

Abstract
The most primitive engrafting hematopoietic stem cell has been assumed to have a fixed phenotype, with changes in engraftment and renewal potential occurring in a stepwise irreversible fashion linked with differentiation. Recent work shows that in vitro cytokine stimulation of murine marrow cells induces cell cycle transit of primitive stem cells, taking 40 h for progression from G0 to mitosis and 12 h for subsequent doublings. At 48 h of culture, progenitors are expanded, but stem cell engraftment is markedly diminished. We have investigated whether this effect on engraftment was an irreversible step or a reversible plastic feature correlated with cell cycle progression. Long-term engraftment (2 and 6 mo) of male BALB/c marrow cells exposed in vitro to interleukin (IL)-3, IL-6, IL-11, and steel factor was assessed at 2–4-h intervals of culture over 24–48 h using irradiated female hosts; the engraftment phenotype showed marked fluctuations over 2–4-h intervals, with engraftment nadirs occurring in late S and early G2. These data show that early stem cell regulation is cell cycle based, and have critical implications for strategies for stem cell expansion and engraftment or gene therapy, since position in cell cycle will determine whether effective engraftment occurs in either setting.
Keywords: hematopoietic stem cell, BALB/c mice, cell cycle, competitive engraftment, cytokines
Dogma is that the most primitive hematopoietic stem cell has a fixed phenotype within a hierarchical differentiation system, with changes in engraftment and renewal potential occurring in a stepwise fashion linked with differentiation (1). In this model, a loss of “stemness” is irreversible. Several studies have shown differences in the biology of resting or cycling hematopoietic stem cells (2–4), and one has discerned differences in long-term engraftment dependent on the phase of cell cycle. This study showed defective long-term engraftment in S/G2/M compared with that seen in the G1 phase of cell cycle (4). Our previous studies showed defective engraftment of unseparated murine marrow cultured in IL-3, IL-6, IL-11, and steel factor for 48 h (5, 6).
A major question is whether this engraftment defect was an irreversible differentiation step or a reversible phenotypic change tied to phase of cell cycle. Stem cells purified from BALB/c male marrow by lineage depletion and selection of cells which stain dimly with Hoechst and rhodamine were cultured under the same conditions as unseparated marrow in IL-3, IL-6, IL-11, and steel factor, and their progress through cell cycle was mapped using tritiated thymidine labeling and cell count doublings (7). The first cycle transit from dormancy through mitosis took ∼36–40 h, with the five subsequent cycles each taking ∼12 h. We wished to study the engraftment phenotype of long-term renewing hematopoietic stem cells through the first and into the second cell cycle. Accordingly, we evaluated engraftment into lethally irradiated female BALB/c mice of male BALB/c marrow cultured in IL-3, IL-6, IL-11, and steel factor at 2- and 4-h intervals from 24 to 48 h and in some instances further.
Materials and Methods
Mice.
BALB/c male and female mice (Taconic Farms Inc., Germantown, NY) and C57BL6 (Ly5.2) and B6SJL (Ly5.1/Ly5.2) mice (The Jackson Laboratory, Bar Harbor, ME) were maintained under virus-free conditions. Mice were purchased at either 16–18 or 18–22 g (age 6–8 wk), were given food and acidified water ad libitum, and were housed for a minimum of 1 wk before experimental use. All experiments were approved by the University of Massachusetts Institutional Animal Care and Use Committee under docket numbers A707 and A729.
Culture of Normal Murine Marrow with Cytokines.
Bone marrow was flushed from bones of 6–8-wk-old mice in HBSS from two tibiae and two femurs. Bone marrow cells were cultured in nonadherent Teflon flasks at densities ranging from 1 to 5 × 10⁶ nucleated cells/ml (see Table 1) in DMEM low glucose, supplemented with 15% heat-inactivated FCS with cytokines as follows: recombinant mouse (rm) steel factor at 50 ng/ml, rmIL-3 at 50 U/ml, rmIL-6 at 50 U/ml, and recombinant human IL-11 at 50 ng/ml at 37°C in a fully humidified atmosphere of 5% CO2 in air. Cells were harvested at different times in culture by vigorous pipetting with ice-cold PBS. In one experiment, conditions were altered, and cells were cultured under serum-free conditions with IL-3, IL-6, IL-11, and steel factor.
Table 1.
Mean Percent Engraftment of Cytokine (IL-3, IL-6, IL-11, and Steel Factor)–treated BALB/c Marrow Cells 8 wk after Cell Infusion
| Time in cytokine culture | Percent engraftment | Total no. of mice analyzed | ||||||||||
|---|---|---|---|---|---|---|---|---|---|---|---|---|
| Exp. 1 | Exp. 2 | Exp. 3 | Exp. 4 | Exp. 5 | ||||||||
| h | ± SD | |||||||||||
| 0 | 31 ± 7 | 36 ± 9 | 45 ± 14 | 43 ± 11 | 45 ± 13 | 20 | ||||||
| 24 | 37 ± 11 | 79 ± 11 | 50 ± 25 | 71 ± 21 | 31 ± 9 | 23 | ||||||
| 26 | 32 ± 14 | 40 ± 21 | 39 ± 2 | 12 | ||||||||
| 28 | 43 ± 21 | 28 ± 5 | 18 ± 7 | 24 ± 8 | 39 ± 2 | 21 | ||||||
| 30 | 28 ± 19 | 24 ± 9 | 32 ± 11 | 12 | ||||||||
| 32 | 7 ± 2 | 32 ± 8 | 72 ± 22 | 33 ± 10 | 22 ± 4 | 22 | ||||||
| 34 | 40 ± 26 | 19 ± 5 | 9 ± 4 | 13 | ||||||||
| 36 | 35 ± 10 | 4 ± 1 | 18 ± 9 | 14 ± 2 | 31 ± 14 | 22 | ||||||
| 38 | 29 ± 4 | 4 | ||||||||||
| 40 | 36 ± 13 | 47 ± 13 | 26 ± 4 | 15 ± 8 | 28 ± 12 | 20 | ||||||
| 42 | 42 ± 4 | 2 | ||||||||||
| 44 | 1 ± 1 | 20 ± 5 | 59 ± 22 | 17 ± 7 | 18 | |||||||
| 46 | 14 ± 7 | 5 | ||||||||||
| 48 | 0.2 ± 0.4 | 3 ± 2 | 27 ± 11 | 37 ± 2 | 33 ± 7 | 20 | ||||||
| 54 | 0 ± 0 | 4 | ||||||||||
| 60 | 19 ± 7 | 5 | ||||||||||
Host mice were exposed to 650 cGy whole body irradiation in experiment (Exp.) 1. In all other experiments, host mice received 1,000 cGy whole body irradiation. The cell concentration in flask culture was 106 cells/ml. In experiments 1 and 2, 106 female BALB/c cells were competed with 106 noncultured or cultured male BALB/c cells, whereas in experiments 3, 4, and 5, 5 × 10⁶ female BALB/c cells competed against 5 × 10⁶ male BALB/c cells.
Competitive Bone Marrow Transplantation (BALB/c Male to Female).
Female mice were exposed to 650–1,000 cGy (the latter split 500 cGy 2 h apart) and then injected with 50% cytokine-cultured male BALB/c cells (corresponding to the equivalent starting cell culture number) and 50% fresh noncultured female cells. The percentage of male cells in host marrow, spleen, or thymus was determined at 8, 15, or 24 wk after transplantation using Southern blot analysis with a Y chromosome–specific probe (PY2) as described previously (5, 6). In brief, genomic DNA was digested with Dra-1, separated by electrophoresis in 0.8% agar, and transferred to nylon membranes (Zetaprobe; Bio-Rad Laboratories, Richmond, CA): 32P-labeled PY2 was hybridized to the blots for 18–22 h, and autoradiography was performed using x-ray film (XRP; Eastman Kodak Co., Rochester, NY). Quantitation was determined on a PhosphorImager (Bio-Rad Laboratories). Percent male chimerism in female hosts was calculated as the proportion of male signal in transplanted mice to the signal in male marrow. Signal from normal female marrow DNA was the negative background and was subtracted from the male signal. PY2 values were normalized for loading variance by reprobing with an IL-3 cDNA.
Competitive Bone Marrow Transplantation with Congenic C57BL/ 6J (Ly5.2) and B6SJL (Ly5.1/Ly5.2) Mice.
Cells were harvested and cultured as described above. B6SJL recipients were exposed to 1,000 cGy of radiation (500 cGy given 2 h apart) from a cesium source irradiator (Gammacell 40; Nordion International, Kanata, Ontario, Canada). After 2 h, the mice were injected intravenously with a mixture of 50% cytokine-cultured B6SJL cells (equivalent to 5 × 10⁶ starting cells harvested after the appropriate hour of incubation with cytokines) and 50% noncultured C57BL/6J cells (5 × 10⁶ cells). Volume for injection was 0.5 ml per recipient. The percentage of bone marrow cells expressing Ly5.1 was determined 18 wk after transplant by flow cytometric analysis. 106 suspended cells were incubated for 25 min with anti-CD45.1 FITC-conjugated antibody (PharMingen, San Diego, CA) at a total volume per tube of 0.2 ml (0.12 μg/ml in HBSS+ 1% FCS) at 4°C. The supernatant was aspirated, and cells were washed twice with cold HBSS and preserved with 2% paraformaldehyde. The cells were subsequently analyzed with a fluorescence-activated cell sorter (MoFlo; Cytomation, Inc., Fort Collins, CO).
Results and Discussion
Cultured male cells were competed with noncultured female marrow cells (harvested separately for each time point) in irradiated female hosts, and engraftment of the male cells in marrow was evaluated at 8 wk or 6 mo after marrow infusion (Fig. 1, A and B, and Tables 1 and 2). These studies showed a loss of engraftment over the 28– 36-h interval, a later restoration of engraftment, and a subsequent loss of engraftment again at 44–48 h. A total of five experiments was carried out evaluating cultured cells and analyzing engraftment at 8 wk after infusion and two separate experiments for the analysis at 6 mo. Tables 1 and 2 present the actual engraftment percentages seen in individual experiments, and Fig. 2 illustrates the mean time of first nadir and time of first recovery superimposed on the previously ascertained cell cycle status of purified cells from these populations and analyzed at 8 wk. The first nadir occurred on average with cells cultured for 33.2 h, with a range within 1 SD of 30.2–36.2 h. The first nadir fell within the late S/G2 phase as determined from previous experiments (Fig. 2). The first nadir compared with 0 h showed a significant decrease (Wilcoxon's rank sum test, P <0.001). Similarly, the first recovery from nadir, which occurred on average at 39.6 h, was significant (P <0.001) compared with the first nadir value. There was a secondary nadir seen at the 44–48-h range (P <0.001). In one experiment, there was a second late recovery seen at 60 h. In four of five experiments at 8 wk (Table 1), recovery values after the first nadir exceeded the time 0 value, whereas in the fifth experiment, the recovery value was >90% of the 0-h value.
Figure 1.


Engraftment of cytokine-treated male BALB/c cells into irradiated female hosts: male BALB/c marrow cells cultured in IL-3, IL-6, IL-11, and steel factor were analyzed at 2–4-h intervals for their capacity to competitively engraft into irradiated female BALB/c mice (650– 1,000 cGy) when competed with equal numbers (based on starting input) of normal, noncultured female cells. (A) In one of five experiments in which marrow engraftment was assessed 8 wk after cell infusion, Southern blot shows PY2-labeled male sequence in DNA from female BALB/c host marrow. Each band represents marrow from an individual mouse. Percent engraftment is derived from phosphorimaging of original blots. The low-level engraftment seen at 32 h was significantly different from levels at 28 h (P = 0.009) or 0 h (P = 0.009). Similarly, values at 44 and 48 h were significantly different from those at 40 and 0 h (P = 0.007 and 0.01), respectively. (B) One of two experiments in which marrow was assessed 6 mo after cell infusion. The engraftment level at 28 h was significantly lower than that at 26 h (P = 0.03) and at 0 h (P = 0.01), and that seen at 48 h was different from 44 h (P = 0.09) and 0 h (P = 0.01).
Table 2.
Mean Percent Engraftment of Cytokine (IL-3, IL-6, IL-11, and Steel Factor)–treated Murine Cells 15–24 wk after Cell Infusion
| Time in cytokine culture | Percent engraftment | Total no. of mice analyzed | ||||||
|---|---|---|---|---|---|---|---|---|
| Cultured male versus female BALB/c | Cultured B6SJL versus C57BL/6 | |||||||
| Exp. 1 | Exp. 2 | Exp. 3 | ||||||
| h | ± SD | |||||||
| 0 | 41 ± 18 | 77 ± 18 | 76 ± 10 | 13 | ||||
| 24 | 27 ± 16 | 58 ± 14 | 59 ± 18 | 14 | ||||
| 26 | 37 ± 18 | 26 ± 20 | 67 ± 9 | 13 | ||||
| 28 | 23 ± 12 | 6 ± 6 | 65 ± 5 | 15 | ||||
| 30 | 21 ± 18 | 24 ± 14 | 8 ± 10 | 13 | ||||
| 32 | 10 ± 5 | 40 ± 7 | 9 | |||||
| 34 | 14 ± 1 | 57 ± 21 | 36 ± 6 | 12 | ||||
| 36 | 63 ± 21 | 35 ± 18 | 10 | |||||
| 38 | 4 ± 7 | 5 | ||||||
| 40 | 65 ± 14 | 11 ± 20 | 9 | |||||
| 42 | 7 ± 1 | 4 | ||||||
| 44 | 28 ± 12 | 64 ± 27 | 25 ± 20 | 13 | ||||
| 46 | 34 ± 18 | 5 | ||||||
| 48 | 31 ± 0 | 35 ± 9 | 12 ± 16 | 11 | ||||
In experiments (Exp.) 1 and 2, male BALB/c cells were cultured at 106 cells/ml. Female BALB/c mice were exposed to 1,000 cGy whole body irradiation and injected with a mixture of 5 × 10⁶ noncultured female BALB/c cells and 5 × 10⁶ fresh or noncultured male BALB/c cells, and engraftment was analyzed at 24 wk. B6SJL cells were cultured at 106 cells/ml, and 5 × 10⁶ cells were competed in 1,000 cGy–irradiated female mice against 5 × 10⁶ noncultured female C57BL/6 cells. Engraftment was determined by FACS® analysis of Ly5.1-positive cells using anti-Ly5.1 (CD45.1) FITC-labeled mAb at 15 wk after cell infusion.
Figure 2.
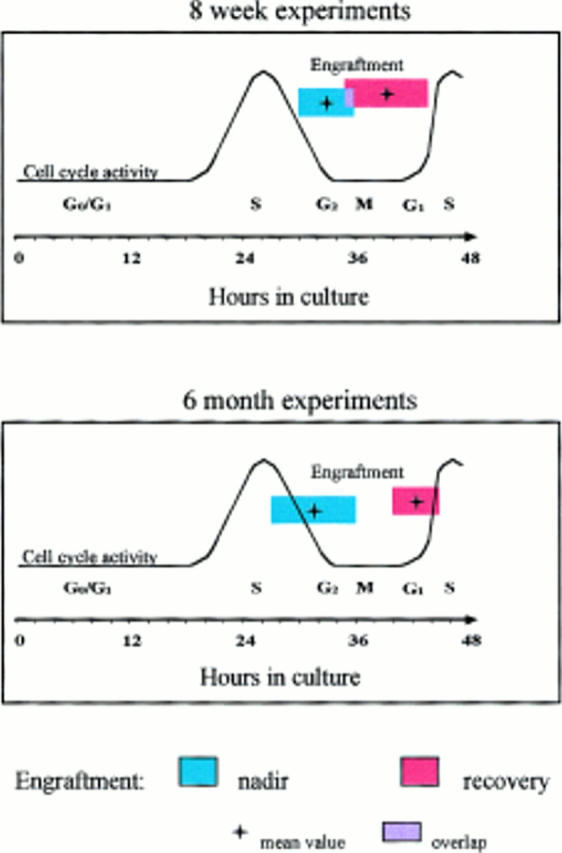
Graphic representation of mean ± 1 SD for the time of first nadir and mean ± 1 SD for the time of first recovery for male BALB/c marrow cells cultured in IL-3, IL-6, IL-11, and steel factor, analyzed for competitive engraftment (competed with equal starting equivalents of fresh female marrow) in 1,000 cGy–irradiated female hosts, and superimposed on cell cycle parameters separately determined for BALB/c lineage–negative rhodaminelo Hoechstlo purified stem cells cultured under identical conditions. Cell cycle parameters were determined by tritiated thymidine labeling and cell count doublings. (A) Summary of five experiments analyzed 8 wk after cell infusion. (B) Summary of two experiments analyzed 6 mo after cell infusion.
Similar results were obtained in the 6-mo experiments (Fig. 1 B, and Table 2): the mean first nadir occurred at 32 h of culture (P = 0.001) compared with 0 h and the first recovery at a mean of 42 h (P = 0.001 compared with first nadir). In one experiment using the Ly5.1/Ly5.2 transplant model and assessing engraftment at 15 wk, there was a nadir, recovery, nadir, recovery pattern, albeit with somewhat different kinetics (Table 2).
Spleen engraftment was analyzed from BALB/c marrow cells cultured for 32 or 40 h and compared with input: nadir (32 h) and recovery (40 h) values paralleled those seen with marrow, both at 8 and 24 wk after transplantation (data not shown), indicating the multilineage nature of engraftment from cytokine-cultured cells.
A striking aspect of these studies was the dramatic shifts in engraftment occurring over 2–4-h time intervals. An alteration in engraftment was felt to be biologically significant if it represented a relative difference more than two times the coefficient of variation (SD divided by the mean). Considering the experiments presented in Tables 1 and 2 (8, 15, and 24 wk after cell infusion), a total of 16 and 8 significant alterations in engraftment were observed at 2-and 4-h intervals, respectively.
Cells cultured under different conditions also evidenced these engraftment shifts during cytokine-stimulated culture. When cells were cultured serum-free with IL-3, IL-6, IL-11, and steel factor, there was a drop in engraftment at 24 h, but thereafter the same type of fluctuations was seen with time in culture (Fig. 3), along with a late recovery at 56 and 80 h.
Figure 3.

Engraftment of BALB/c marrow cells cultured for 80 h under serum-free condition at 3.6 × 10⁶ cells/ml with IL-3, IL-6, IL-11, and steel factor and analyzed 8 wk after transplantation. 106 cultured male BALB/c cells in cytokines were competed against 106 noncultured female cells. Southern blots show PY2-labeled male sequence in DNA from female BALB/c host marrow. Analysis is as described in the legend to Fig. 1, A and B. The low levels of engraftment seen at 28 and 32 h were significantly different from levels at 24 h (P = 0.005 for both) and 0 h (P = 0.005 for both). Similarly, values at 48 h were significantly different from those at 40 h (P = 0.008) and 0 h (P = 0.008).
Previous data have indicated an expansion of progenitor cells in this cytokine combination (5, 6), and other studies have shown progressive expansions of surrogate progenitor stem cells in cytokine-stimulated cultures (8, 9). However, the present data indicate that at least during the first several cell cycles, there are dramatic fluctuations in engraftment phenotype, which are reversible and thus presumably not tied to irreversible differentiation steps.
The mechanism underlying this phenotypic engraftment plasticity may relate to alterations in stem cell “stickiness” and “trafficking.” Separate studies have shown marked fluctuations of adhesion protein and mRNA levels at different points in cell cycle (10). The integrin pathways are complicated, and homing via these pathways probably represents a multistep process. Other possible mechanisms could relate to differential sensitivity to transplantation- induced apoptosis at certain points in the cell cycle, or to altered responsiveness of transplanted cells at certain points in cycle to host proliferation and differentiation signaling.
These data demonstrate dramatically different outcomes with stem cell engraftment based on the precise time in cell cycle at which the cells are infused. Several gene therapy approaches with retroviral vectors use in vitro cytokine stimulation to induce cycling of hematopoietic stem cells to facilitate incorporation of the vectors into the host genome (11–13). Clearly, the end results of such approaches with infusion of gene-transfected stem cells will depend on whether the hematopoietic stem cells are in an appropriate state to facilitate engraftment, i.e., presumably G1, or in a state where engraftment is markedly diminished, i.e., late S/G2. Similarly a relatively large number of investigators have developed approaches to expand both human (14–17) and murine (8, 9) hematopoietic stem cells. These approaches usually use in vitro cytokine stimulation of hematopoietic stem cell populations with subsequent engraftment. Our studies show that a knowledge of the cell cycle status of these cells will be critical to ensure adequate clinical results with expanded stem cells.
Acknowledgments
We thank our laboratory colleagues for help with mouse work, especially Mark Dooner, Brian Benoit, Lizhen Pang, Allen Stering, Bernice Fraioli, and Caron Engstrom.
Footnotes
P.J. Quesenberry was supported by grants from the National Institutes of Diabetes and Kidney Diseases (P0-1 DK 50222-01, R0-1 DK 49650-03, and R0-1 DK 27424-15) and from the National Heart, Lung and Blood Institute (P0-1 HL 56920-01).
References
- 1.Quesenberry, P.J. 1994. Hemopoietic stem cells, progenitor cells and cytokines. In Williams Textbook of Hematology, 5th ed. M. Lichtman and T. Kipps, editors. McGraw-Hill Inc., New York. 211–228.
- 2.Monette FC, DeMello JB. The relationship between stem cell seeding efficiency and position in cell cycle. Cell Tissue Kinet. 1979;12:161–175. doi: 10.1111/j.1365-2184.1979.tb00123.x. [DOI] [PubMed] [Google Scholar]
- 3.Quesenberry PJ. The effect of endotoxin on murine stem cells. J Cell Physiol. 1973;82:239–244. doi: 10.1002/jcp.1040820212. [DOI] [PubMed] [Google Scholar]
- 4.Fleming WM. Functional heterogeneity is associated with the cell cycle status of murine hematopoietic stem cells. J Cell Biol. 1993;122:897–902. doi: 10.1083/jcb.122.4.897. [DOI] [PMC free article] [PubMed] [Google Scholar]
- 5.Peters SO, Kittler EL, Ramshaw HS, Quesenberry PJ. Murine marrow cells expanded in culture with IL-3, IL-6, IL-11, and SCF acquire an engraftment defect in normal hosts. Exp Hematol. 1995;23:461–469. [PubMed] [Google Scholar]
- 6.Peters SO, Kittler EL, Ramshaw HS, Quesenberry PJ. Ex vivo expansion of murine marrow cells with interleukin-3, interleukin-6, interleukin-11, and stem cell factor leads to impaired engraftment in irradiated hosts. Blood. 1996;87:30–37. [PubMed] [Google Scholar]
- 7.Reddy GPV, Tiarks CY, Pang L, Quesenberry PJ. Synchronization and cell cycle analysis of pluripotent hematopoietic progenitor stem cells. Blood. 1997;90:2293–2299. [PubMed] [Google Scholar]
- 8.Muench MO, Moore MAS. Accelerated recovery of peripheral blood cell counts in mice transplanted with in vitrocytokine-expanded hematopoietic progenitors. Exp Hematol. 1992;20:611–618. [PubMed] [Google Scholar]
- 9.Rebel VI, Dragowska W, Eaves CJ, Humphries RK, Landsdorp PM. Amplification of Sca-1+Lin−WGA+ cells in serum-free cultures containing steel factor, interleukin 6, and erythropoietin with maintenance of cells with long term in vivoreconstitution potential. Blood. 1994;83:128–136. [PubMed] [Google Scholar]
- 10.Becker PS. Stimulatory cytokines modulate adhesion receptor expression by murine LIN−SCA+ cells and simultaneous blocking of αL, α4, and L-selectin inhibits hematopoietic progenitor cell-stromal cell interactions. Blood. 1997;90:486a. . (Abstr.) [Google Scholar]
- 11.Karlsson S. Treatment of genetic defects in hematopoietic cell function by gene transfer. Blood. 1991;78:2481–2492. [PubMed] [Google Scholar]
- 12.Nolta JA, Kohn DB. Comparison of the effects of growth factors on retroviral vector-mediated gene transfer and the proliferative status of human hematopoietic progenitor cells. Hum Gene Ther. 1990;1:257–268. doi: 10.1089/hum.1990.1.3-257. [DOI] [PubMed] [Google Scholar]
- 13.Laneuville P. High-efficiency gene transfer and expression in normal human hematopoietic cells with retrovirus vectors. Blood. 1988;71:811–814. [PubMed] [Google Scholar]
- 14.Srour EF. Long term generation and expansion of human primitive hematopoietic progenitor cells in vitro. . Blood. 1992;81:661–669. [PubMed] [Google Scholar]
- 15.Haylock DN. Ex vivo expansion and maturation of peripheral blood CD-34+cells into myeloid lineage. Blood. 1992;80:1405–1412. [PubMed] [Google Scholar]
- 16.Ruggieri L, Heimfeld S, Broxmeyer HE. Cytokine dependent ex vivo expansion of early subsets of CD-34+cord blood myeloid progenitors is enhanced by cord blood plasma, but expansion of more mature subsets of progenitors is favored. Blood Cells (NY) 1994;20:436–454. [PubMed] [Google Scholar]
- 17.Brugger W. Ex vivo expansion of enriched peripheral blood CD-34+progenitor cells by stem cell factor, interleukin-1 beta (IL-1 beta), IL-6, IL-3, interferon-gamma and erythropoietin. Blood. 1993;81:2579–2584. [PubMed] [Google Scholar]