

Abstract
p73 has been recently identified as a new structural and functional homologue of the transcription factor p53. It is expressed in either a full-length form, α, or a shorter β mRNA variant, with exon 13 spliced out. Here we report the identification and functional characterization of two new p73 splicing variants, γ (splicing out exon 11) and δ (splicing out exons 11, 12, and 13). Both γ and δ p73 variants are expressed in human peripheral blood lymphocytes, primary keratinocytes, and different tumor cell lines, including neuroblastoma, glioblastoma, melanoma, hepatoma, and leukemia. The expression pattern of the four p73 splicing variants differs in both primary cells of different lineage and established cell lines even within the same type of tumor. A two-hybrid assay was used to characterize the homodimeric and heterodimeric interactions between the p73 variants, and showed that neither p73γ nor p73δ interact with p53, whereas p73γ showed strong interactions with all p73 isoforms, and p73δ binds efficiently p73α and p73γ but only weakly p73β. At the functional level, p73γ is significantly less efficient in activating transcription of the p21Waf1/Cip1 promoter than p53 or p73β, whereas the effect of p73δ is intermediate and comparable to that of p73α. The ability of the different p73 variants to affect cell growth in p53 null osteosarcoma SAOS-2 cells correlates with their transcriptional activity on the p21Waf1/Cip1 promoter: p73β is the most efficient in inhibiting colony formation, whereas p73γ is almost ineffective. Our results suggest that p73 isoforms may be differentially regulated, with four different isoforms capable of interacting among themselves and with p53. The relative expression level of each splice variant may modulate p73 transcriptional and growth suppression activities by affecting heterodimer formation.
Keywords: p73, p53, differentiation, apoptosis, cancer
The p53 tumor suppressor gene (1, 2) is the most frequent target for genetic alterations in human cancers (3, 4). Attempts to find p53-related genes by low stringency hybridization or by degenerate PCR techniques, in analogy to the pRb family of tumor suppressors, have repeatedly failed. A new gene, p73, has recently been identified that encodes a protein with structural and functional homology to p53 (5). The biological activities of the p53 protein that have been implicated in tumor suppression include growth arrest at both the G1/S and the G2/M transitions of the cell cycle (2, 6), and induction of apoptosis (7). To exert most if not all of its functions, p53 acts as a transcriptional activator on numerous genes that contain specific DNA-binding sequences on their promoter, such as p21Waf1/Cip1 (8, 9) and gadd45 (10), or as a transcription repressor on genes that do not contain such sequences, probably by sequestering transcription factors (11, 12). Similar to p53, p73 can activate transcription of p21Waf1/Cip1, a gene involved in cell growth arrest, and can induce apoptosis when overexpressed (5, 13). p73 gene maps to the short arm of chromosome 1 in a region (1p36.33) that is frequently deleted in neuroblastomas (14, 15), suggesting that it may play a role in the development of these tumors. However, allelic loss in lung cancers does not show imbalance of expression or mutations of the remaining allele (16), and p73 mutations do not appear to be frequent in prostate carcinoma (17).
Despite its structural and functional similarities to p53, p73 is not induced by DNA damaging agents (UV irradiation or actinomycin D) known to activate p53, suggesting that p73 may have different functions and may be involved in the cellular response to different stimuli (5, 18). p73, which is capable of interacting with p53 in a yeast two- hybrid system (5), may also modulate the function of the latter. The full-length protein, p73α, has been shown to be expressed in parallel with a shorter splice variant, p73β, in which the splicing of exon 13 results in a much shorter COOH terminus (5). Here we identify and characterize the functional properties of two new splice variants of the p73 gene, called p73γ and p73δ, differentially expressed both in normal human cells and in tumor cell lines.
Materials and Methods
p73 Cloning.
Reverse transcription (RT)-PCR for all p73 variants used the following primers derived from the published p73 cDNA sequence (sequence data available from EMBL/GenBank/DDBJ under accession no. Y11416): 5′-TTCTGCAGGTGACTCAGGCTG-3′ for RT; and 5′-TTAGCGCTATGGCCCAGTCCACCGCC-3′ (sense primer containing an in-frame NheI site) and 5′-CGAGGCCTCAGTGGATCTGC-3′ (antisense primer) for PCR amplification. cDNA synthesis was performed using 1 μg of total RNA, extracted from the SH-Sy5y cell line using TRIZOL (Life Technologies, Inc., Gaithersburg, MD), in 20 μl of reaction buffer containing 50 mM Tris-HCl (pH 8.3), 75 mM KCl, 3 mM MgCl2, 10 mM dithiothreitol, dNTPs 0.5 mM each, primers 1 μM each, and 200 U of SuperScript RNaseH− reverse transcriptase (GIBCO BRL, Gaithersburg, MD), for 1 h at 37°C. The PCR reaction was performed in 50 μl of reaction buffer containing 4 μl of the RT product, 50 mM KCl, 10 mM Tris-HCl (pH 9.0 at 25°C), 0.1% Triton X-100, 1.5 mM MgCl2, dNTPs 0.2 mM each, primers 0.4 μM each, and 2.5 U of Taq DNA polymerase (Promega Corp., Madison, WI). Amplification consisted of one cycle at 95°C for 5 min followed by 40 cycles of 95°C for 45 s, 58°C for 60 s, and 72°C for 90 s, followed by an extension cycle of 72°C for 5 min. PCR amplification products were gel purified and cloned into pCR 2.1 (TA cloning kit; Clontech, Palo Alto, CA) according to the manufacturer's protocol. All inserts were completely sequenced, and no differences from the published sequence were found. The isolated PCR fragments were then cloned in-frame with a hemagglutinin (HA) tag into pcDNA-HA (19) using the NheI and NotI unique restriction sites.
p73 Transcript Analysis.
To detect expression, all four p73 splicing variants were amplified by radioactive RT-PCR using the following primers: 5′-TTCTGCAGGTGACTCAGGCTG-3′ for RT; and 5′-ACTTTGAGATCCTGATGAAG-3′ (sense primer) and 5′-CAGATGGTCATGCGGTACTG-3′ (antisense primer) for PCR amplification. cDNA synthesis was performed as described above, starting with equal RNA concentrations (1 μg). Radioactive PCR reaction was performed in 50 μl of reaction buffer containing 5 μl of the RT product, 50 mM KCl, 10 mM Tris-HCl (pH 9.0), 0.1% Triton X-100, 1.5 mM MgCl2, dNTPs 0.2 mM each, cold primers 0.4 μM each, plus 40 nM each of [γ-33P]dATP-labeled primers and 2.5 U of Taq DNA polymerase (Promega Corp.). Amplification consisted of one cycle at 95°C for 5 min followed by 35 cycles of 95°C for 60 s, 59°C for 55 s, and 72°C for 45 s. PCR products were separated on a nondenaturing 6% polyacrylamide gel, dried, and analyzed by autoradiography. p53 and GAPDH were amplified using the same protocol as for p73 with the following primers: for p53, 5′-GACCATCGCTATCTGAGCAGCG-3′ for RT, and 5′-TGCTTTCCACGACGGTGACACG-3′ (sense primer) and 5′-GACTGCTTGTAGATGGCCATGG (antisense primer) for PCR amplification; for GAPDH, 5′-TGAAGGTCGGAGTCAACGGATTG-3′ (sense primer) and 5′-GCCATGGAATTTGCCATGCCATGGGTGG (antisense primer) for PCR amplification and RT.
Tissue Culture.
All of the cell lines were grown in a 1:1 mixture of MEM and Ham's F-12 medium supplemented with 10% heat-inactivated FCS, 1.2 g bicarbonate/l, 1% nonessential amino acids, and 15 mM N-2-hydroxyethylpiperazine-N′-2-ethanesulfonic acid, at 37°C in a humidified atmosphere of 5% CO2 in air. SAOS-2 cells were grown in DMEM supplemented with 10% fetal bovine serum.
Lymphocyte Analysis.
PBLs were purified on a Ficoll gradient, labeled by direct immunofluorescence with anti-CD4–PE and anti-CD8–FITC mAbs (Becton Dickinson, San Jose, CA), and sorted by flow cytometry in a FACSCalibur® (Becton Dickinson) according to the manufacturer's protocol. Analysis of the purified population showed a purity of 97%.
Yeast Two-hybrid System.
Nucleotide sequences corresponding to amino acids 72–393 of p53, 85–636 of p73α, 85–499 of p73β, 85–475 of p73γ, and 85–403 of p73δ were PCR amplified from the corresponding cDNAs and cloned in-frame into the Gal4 DNA-binding domain vector pGBT9 (Clontech) and into the Gal4 transcriptional activation domain pGAD424 (Clontech). Transformations into the yeast strain SFY526, containing a β-galactosidase encoding gene under the control of GAL1 promoter, were performed as described (Matchmaker two-hybrid system protocol; Clontech). β-Gal production was quantified with the liquid assay described in the Matchmaker two-hybrid system protocol (Clontech).
Luciferase Assay.
SAOS-2 cells were transfected by the calcium phosphate method with reporter plasmid containing luciferase cDNA under the control of the p21Waf1/Cip1 promoter, together with p53 or p73s expression vectors. 48 h after transfection, cells were lysed and luciferase activity was quantified as described (20).
Growth Suppression Assay.
SAOS-2 cells were transfected in 100-mm plates with the indicated pcDNA3-derived vectors using the calcium phosphate method. 48 h later, cells were placed under G418 (GIBCO BRL) selection (700 mg/ml). After 2 wk, cells were fixed, stained with crystal violet, and photographed, as described (21).
Western Blot Analysis.
SAOS-2 cells were transfected using the calcium phosphate method and lysed 48 h later in 50 mM Tris, pH 8.0, 150 mM NaCl, 0.5% NP-40, 0.5 μg/ml leupeptin, 1 μg/ml aprotinin, and 0.5 mM PMSF. The lysate was cleared by centrifugation, and 30 μg aliquots of cell extract, as determined by the Bradford method, were resolved by electrophoresis in a 10% SDS-polyacrylamide gel, transferred to a nylon membrane, and probed with an anti-HA antibody (Santa Cruz Biotechnology, Inc., Santa Cruz, CA). Immunocomplexes were detected by a chemiluminescence-based system (Amersham Pharmacia Biotech, Inc., Piscataway, NJ) according to the manufacturer's instructions.
Results and Discussion
Identification of Two New Splice Variants of p73.
The p53 tumor suppressor gene encodes for a phosphorylated protein, 393 amino acids long and highly conserved throughout evolution (22). At the structural level, the four functional domains (1, 2, 23) include the transcriptional activation domain (residues 1–42), the DNA-binding domain (residues 102–292), which is the region most frequently mutated in cancer, the oligomerization domain (residues 324–355), and the COOH terminus domain that allosterically regulates the binding of the central region to DNA. The NH2-terminal transcriptional activation domain binds the members of the CBP/p300 family of transcriptional adaptors/coactivators, which are recruited for most p53 biological responses (24–26). p73 homology to p53 is very high in the transactivation domain (29% identity), in the DNA-binding domain (63%), and in the oligomerization domain (38% [5]).
p73 gene encodes two distinct polypeptides, p73α and p73β. The latter arises from the alternative splicing of exon 13 in the p73 transcript (5). With the exception of the last five residues which are unique to the shorter p73β, the rest of the protein is identical to the corresponding regions in p73α. To evaluate whether these splicing variants might be differentially expressed in different tissues or cell lines, we systematically characterized p73 transcripts using RT-PCR. While amplifying the 3′ end of the p73 mRNA from the SH-Sy5y neuroblastoma cell line, we identified two amplification products of 386 and 154 bp, in addition to the expected 535- and 440-bp bands, deriving from the p73α and p73β transcripts, respectively. We cloned and sequenced all cDNAs, and found that they corresponded to four different splice variants of the gene (Fig. 1 A). We named the two new forms p73γ and p73δ. p73γ mRNA was generated by splicing of exon 11, whereas p73δ transcript lacked exons 11, 12, and 13. The splicing of exon 11 in p73γ resulted in a frame shift from the original reading frame leading to the translation of 76 amino acids, different from the original sequence (from amino acid residue 400 to residue 475), followed by a premature stop codon (Fig. 1 B). This 76 amino acid sequence did not show any significant similarity to other known peptide sequences in the database. The resulting p73γ protein is 161 amino acids shorter than the p73α and 24 amino acids shorter than the p73β form, bearing a new COOH terminus that is different from both previously described forms. The splicing of exons 11, 12, and 13 in p73δ resulted in a shorter truncated form of p73 of 403 amino acids (Fig. 1, A and B). p73δ bears the most striking resemblance to p53, as it completely lacks the COOH terminus extension that differentiates the other forms of p73. However, both p73γ and p73δ still contain the regions homologous to the transcription activation domain, the CBP/p300 coactivator binding domain, and the DNA-binding and oligomerization domains of p53.
Figure 1.

(A) Schematic representation of p73 splicing isoforms. Spliced-out exons are indicated with respect to the full-length form, p73α. (B) Amino acid alignment of the COOH-terminal region of the four p73 splice variants and comparison with p53. The corresponding exons are indicated.
Expression Pattern of p73 Splicing Variants.
The relative expression of the p73 isoforms in normal and neoplastic cells was examined using a radioactive PCR that amplifies exons 10–14 in the p73 mRNA (bp 1198–1735 of the full-length mRNA). This strategy identified four bands of 535 (p73α), 440 (p73β), 386 (p73γ), and 154 bp (p73δ), thus distinguishing all four splicing variants with a single PCR. Fig. 2 A shows the results obtained in human PBLs, primary keratinocytes, eight neuroblastoma cell lines, and seven other tumor cell lines, including glioblastoma, melanoma, hepatoma, and leukemia. Fig. 2 B shows the linearity of the PCR reaction in the same experimental conditions used to amplify p73 and p53. The expression pattern of the four p73 splicing variants differs both in primary cells of different lineage and in established cell lines even within the same type of tumor. Two cell lines, Jurkat lymphoma and SMS-KCNR neuroblastoma, were completely negative for p73 expression using our highly sensitive radioactive PCR. Interestingly, normal human lymphocytes lacked p73β and expressed only the p73α, p73γ, and p73δ forms, whereas normal human keratinocytes from a skin biopsy expressed p73α, p73β, and p73γ but not p73δ. When CD4+ and CD8+ enriched lymphocyte populations (97% enrichment after flow cytometry cell sorting) were analyzed, we found that the different forms of p73 were selectively expressed (Fig. 2 C). These results indicate that, although a larger panel of normal tissues needs to be analyzed, the newly identified p73γ and p73δ forms are indeed expressed in normal primary cells and do not represent abnormal transcripts expressed only in transformed cell lines. Our findings also suggest that the various p73 isoforms may play distinct roles in cells of different lineage or at different differentiation stages within the same lineage.
Figure 2.

(A) Differential expression of p73 splicing variants and p53 in normal human (PBLs and skin keratinocytes) and cancer cells. Autoradiography of a radioactive PCR performed on several neuroblastoma [BE(2)-M17, SH-Sy5y, BE(2)-2C, SH-EPI, SK-N-BE(2), SMS-KCNR, CHP100, SH-N-SH, and LAN5], glioblastoma (Lipari), lymphoma (Hut 78, Jurkat), hepatoma (Hep-G2), and breast carcinoma (MCF-7) cell lines. The four p73 splice variants (p73α: 535 bp; p73β: 440 bp; p73γ: 386 bp, and p73δ: 154 bp) and the expression of a control housekeeping gene (GAPDH, bottom lane) are shown. (B) Radioactive PCR for p73, p53, and GAPDH performed on mRNA extracted from the BE(2)-M17 cell line for 25, 30, and 35 cycles of amplification, showing the linearity of the reaction. (C) p73 and p53 expression pattern of CD4+ and CD8+ enriched lymphocyte populations sorted by flow cytometry (see Materials and Methods for details on oligonucleotides and PCR cycles). Radioactive PCR gels shown in the three panels were exposed for 12 h; GAPDH was exposed for only 2 h.
Homotypic and Heterotypic Interactions of p73γ and p73δ Isoforms.
To study homotypic and heterotypic interactions between the p73γ and p73δ and both the other p73 isoforms and p53, we used the yeast two-hybrid system (Fig. 3 A). As reported previously (5), both the α and β forms interact weakly with p53, whereas the γ and δ forms show no interaction with p53. The different forms of p73 interact with each other with variable intensity. p73γ showed strong interactions with all p73 isoforms, including itself. The interaction with p73β was the strongest. p73δ homodimerizes efficiently and binds p73α and p73γ. The interaction of p73δ with the β isoform is much weaker than that of p73γ. We also confirmed that p73α has a very low tendency to form homotypic interactions, whereas p73β homodimerizes strongly and binds weakly to p73α. Comparable results were obtained using the different p73 isoforms in either bait or prey configuration in the two- hybrid assay. Altogether, these results indicate that all homotypic and several heterotypic interactions are possible between the p73 variants, and suggest that the same may occur in vivo to fine-tune the system.
Figure 3.


(A) Yeast two-hybrid interaction assays among p53, p73α, p73β, p73γ, and p73δ presented as ordinate values relative to β-galactosidase activity of p53–p53 interaction. Control interactions using pGAD or pGBT vectors were negative. (B) Luciferase assay of SAOS-2 cells transfected with p21Waf1/Cip1 promoter–driven luciferase reporter plasmid (4 μg), together with p53 (20 ng) or p73 (20 ng) expression plasmids. When transfected in combination with each other, 10 ng of each indicated expression plasmid was used. (C) Expression of p73 splicing variants. Anti-HA Western blot of whole cell extracts after transfection of SAOS-2 cells with plasmids encoding the indicated proteins. Molecular masses are shown in kD (right).
Functional Characterization of p73γ and p73δ.
p73α and p73β have been previously shown to share with p53 the ability to activate the transcription of common target regulatory sequences (13) and to increase the expression of the p21Waf1/Cip1 gene (5). To assess whether the two new splicing variants of p73 we identified are also transcriptionally active, we tested their ability to transactivate the p21Waf1/Cip1 promoter–driven luciferase reporter in the osteogenic sarcoma cell line SAOS-2, which harbors a homozygous deletion of the p53 gene and does not synthesize p53. The results shown in Fig. 3 B demonstrate that p73γ is significantly less efficient in activating transcription from the p21Waf1/Cip1 promoter than p53 or p73β, whereas the effect of p73δ is intermediate and comparable to that of p73α. The above-described differences are not due to variations in the protein levels of the exogenously expressed p73 variants, as shown in Fig. 3 C. Coexpression of either p73α or p73δ with p73β results in a decrease of p21Waf1/Cip1 promoter activation compared with p73β alone. Interestingly, p73γ, which activates transcription poorly by itself and interacts strongly with p73β, exerts no inhibitory effect. The molecular basis for these observations is still unclear. In fact, it remains to be established whether the various p73 homodimers and heterodimers have different DNA-binding capacity, intrinsic transcription activation activity, or ability to recruit the transcriptional adaptors/coactivators of the CBP/p300 family. In keeping with their ability to increase p21Waf1/Cip1 levels in the cell, both p73α and p73β can induce growth arrest when transfected into SK-N-AS (5) or SAOS-2 cells (13). We then tested the effect of exogenously expressed p73γ and p73δ on cell growth in SAOS-2 cells using a standard colony formation assay. To this aim, cells were transfected with the expression vectors either for each p73 isoform or for p53. After G418 selection for 2 wk, drug-resistant colonies were stained and counted. The ability of the different p73 variants to affect cell growth in p53 null SAOS cells correlates well with their transcriptional activity on the p21Waf1/Cip1 promoter. p73β was the most efficient in inhibiting colony formation, and p73γ was almost ineffective (Fig. 4).
Figure 4.
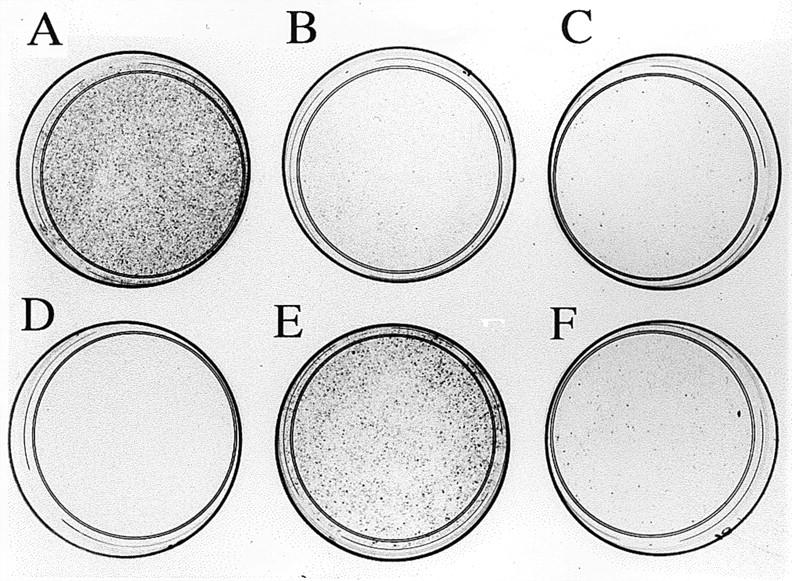
Colony formation assay in SAOS-2 cells grown for 2 wk under G418 selection after transfection with 20 μg of pcDNA3 vector expressing neor alone (A) or with p53 (B), p73α (C), p73β (D), p73γ (E), and p73δ (F). One of three different experiments is shown; the mean colony count (± SEM) of the three experiments was as follows: control, 1,563 ± 120 (A); p53, 74 ± 20 (B); p73α, 95 ± 32 (C); p73β, 26 ± 12 (D); p73γ, 754 ± 149 (E); p73δ, 88 ± 25 (F).
In conclusion, we have identified and functionally characterized two new p73 splicing variants named p73γ and p73δ. Both variants are expressed in human normal cells as well as in tumor cell lines of different origin. Three lines of evidence indicate that the p73 system by itself is likely to provide a complex regulatory mechanism devoted to the control of cell growth: (a) the finding of different expression patterns of the four p73 splicing variants in normal and neoplastic cells; (b) the network of homodimeric and heterodimeric interactions of the various p73 isoforms and p53; and (c) the differences in their transcriptional proficiency and cell growth arrest capacity. The selective ability of the p73 variants to interact with and possibly to modulate the functions of p53 suggests an even more complicated scenario. Indeed, despite the numerous structural and functional similarities between p73 and p53, we do not yet know which stimuli regulate the activity of the various p73 isoforms and their relative ratios in the cell. Unlike p53, which is usually present in small amounts in normal cells (22, 27) and is induced by DNA-damaging agents and radiation (28), p73 is not upregulated in response to DNA damage. Although further investigation is necessary to determine how p73 isoforms are activated and/or regulated, their biological effects may well include cell growth arrest and possibly the induction of cell death.
Acknowledgments
This work was supported by Fondazione Telethon (grant E413), Ministero della Sanità, Associazione Neuroblastoma, and Associazione Italiana Ricerca sul Cancro (to G. Melino); and by CNR-ACRO Project, Associazione Italiana Ricerca sul Cancro, Fondazione Telethon, EC Biomed-2, and Fondazione Andrea Cesalpino (to M. Levrero).
References
- 1.Levine AJ. p53, the cellular gatekeeper for growth and division. Cell. 1997;88:323–331. doi: 10.1016/s0092-8674(00)81871-1. [DOI] [PubMed] [Google Scholar]
- 2.Ko LJ, Prives C. p53: puzzle and paradigm. Genes Dev. 1996;10:1054–1072. doi: 10.1101/gad.10.9.1054. [DOI] [PubMed] [Google Scholar]
- 3.Nigro JM, Baker SJ, Preisinger AC, Jessup JM, Hostetter R, Cleary K, Bigner SH, Davidson N, Baylin S, Devilee P, et al. Mutations in the p53 gene occur in diverse human tumour types. Nature. 1989;342:705–708. doi: 10.1038/342705a0. [DOI] [PubMed] [Google Scholar]
- 4.Hollstein M, Sidransky D, Vogelstein CC. p53 mutations in human cancers. Science. 1991;253:49–53. doi: 10.1126/science.1905840. [DOI] [PubMed] [Google Scholar]
- 5.Kaghad M, Bonnet H, Yang A, Creancier L, Biscan J, Valent A, Minty A, Chalon P, Lelias J, Dumont X, et al. Monoallelically expressed gene related to p53 at 1p36, a region frequently deleted in neuroblastoma and other human cancers. Cell. 1997;90:809–819. doi: 10.1016/s0092-8674(00)80540-1. [DOI] [PubMed] [Google Scholar]
- 6.Michalovitz D, Halevy O, Oren M. Conditional inhibition of transformation and of cell proliferation by a temperature-sensitive mutant of p53. Cell. 1990;62:671–680. doi: 10.1016/0092-8674(90)90113-s. [DOI] [PubMed] [Google Scholar]
- 7.Choisy-Rossi C, Yonish-Rouach E. Apoptosis and the cell cycle: the p53 connection. Cell Death Differ. 1998;5:129–131. doi: 10.1038/sj.cdd.4400339. [DOI] [PubMed] [Google Scholar]
- 8.el-Deiry WS, Tokino T, Velculescu VE, Levy DB, Parsons R, Trent JM, Lin D, Mercer WE, Kinzler KW, Vogelstein B. WAF1, a potential mediator of p53 tumor suppression. Cell. 1993;75:817–825. doi: 10.1016/0092-8674(93)90500-p. [DOI] [PubMed] [Google Scholar]
- 9.Crook T, Marston NJ, Sara EA, Vousden KH. Transcriptional activation by p53 correlates with suppression of growth but not transformation. Cell. 1994;79:817–827. doi: 10.1016/0092-8674(94)90071-x. [DOI] [PubMed] [Google Scholar]
- 10.Kastan MB, Zhan QM, el-Deiry WS, Carrier F, Jacks T, Walsh WV, Plunkett BS, Vogelstein B, Fornace AJ., Jr A mammalian cell cycle checkpoint pathway utilizing p53 and GADD45 is defective in ataxia-telangiectasia. Cell. 1992;71:587–597. doi: 10.1016/0092-8674(92)90593-2. [DOI] [PubMed] [Google Scholar]
- 11.Santhanam U, Ray A, Sehgal PB. Repression of the interleukin 6 gene promoter by p53 and the retinoblastoma susceptibility gene product. Proc Natl Acad Sci USA. 1991;88:7605–7609. doi: 10.1073/pnas.88.17.7605. [DOI] [PMC free article] [PubMed] [Google Scholar]
- 12.Ragimov N, Krauskopf A, Navot N, Rotter V, Oren M, Aloni Y. Wild-type but not mutant p53 can repress transcription initiation in vitro by interfering with the binding of basal transcription factors to the TATA motif. Oncogene. 1993;8:1183–1193. [PubMed] [Google Scholar]
- 13.Jost CA, Marin MC, Kaelin WG., Jr p73 is a human p53 related protein that can induce apoptosis. Nature. 1997;389:191–194. doi: 10.1038/38298. [DOI] [PubMed] [Google Scholar]
- 14.Brodeur GM, Sekhon G, Goldstein MN. Chromosomal aberrations in human neuroblastomas. Cancer. 1977;40:2256–2263. doi: 10.1002/1097-0142(197711)40:5<2256::aid-cncr2820400536>3.0.co;2-1. [DOI] [PubMed] [Google Scholar]
- 15.Sozzi G, Bertoglio MG, Pilotti S, Rilke F, Pierotti MA, Della G, Porta Cytogenetic studies in primary and metastatic neuroendocrine Merkel cell carcinoma. Cancer Genet Cytogenet. 1988;30:151–158. doi: 10.1016/0165-4608(88)90104-5. [DOI] [PubMed] [Google Scholar]
- 16.Nomoto S, Haruki N, Kondo M, Konishi H, Takahashi T, Takahashi T, Takahashi T. Search for mutations and examination of allelic expression imbalance of the p73 gene at 1p36.33 in human lung cancers. Cancer Res. 1998;58:1380–1383. [PubMed] [Google Scholar]
- 17.Takahashi H, Ichimiya S, Nimura Y, Watanabe M, Furusato M, Wakui S, Yatani R, Aizawa S, Nakagawara A. Mutation, allelotyping, and transcription analysis of the p73 gene in prostatic carcinoma. Cancer Res. 1998;58:2076–2077. [PubMed] [Google Scholar]
- 18.Oren M. Lonely no more: p73 finds its kin in a tumor suppressor haven. Cell. 1997;90:829–832. doi: 10.1016/s0092-8674(00)80347-5. [DOI] [PubMed] [Google Scholar]
- 19.Natoli G, Costanzo A, Moretti F, Fulco M, Balsano C, Levrero M. Tumor necrosis factor (TNF) receptor signaling downstream of TNF receptor-associated factor 2. J Biol Chem. 1997;272:26079–26082. doi: 10.1074/jbc.272.42.26079. [DOI] [PubMed] [Google Scholar]
- 20.Takeuchi M, Rothe M, Goeddel DV. Anatomy of TRAF2. J Biol Chem. 1996;271:19935–19942. doi: 10.1074/jbc.271.33.19935. [DOI] [PubMed] [Google Scholar]
- 21.Chirillo P, Pagano S, Natoli G, Puri PL, Burgio VL, Balsano C, Levrero M. The hepatitis B virus X gene induces p53-mediated programmed cell death. Proc Natl Acad Sci USA. 1997;94:8162–8167. doi: 10.1073/pnas.94.15.8162. [DOI] [PMC free article] [PubMed] [Google Scholar]
- 22.Lane DP, Benchimol S. p53: oncogene or anti-oncogene? . Genes Dev. 1990;2:1–8. doi: 10.1101/gad.4.1.1. [DOI] [PubMed] [Google Scholar]
- 23.Clurman B, Groudine M. Killer in search of a motive. Nature. 1997;389:122–123. doi: 10.1038/38116. [DOI] [PubMed] [Google Scholar]
- 24.Avantaggiati ML, Ogryzko V, Gardner K, Giordano A, Levine AS, Kelly K. Recruitment of p300/CBP in p53-dependent signal pathways. Cell. 1997;89:1175–1184. doi: 10.1016/s0092-8674(00)80304-9. [DOI] [PubMed] [Google Scholar]
- 25.Gu W, Shi XL, Roeder RG. Synergistic activation of transcription by CBP and p53. Nature. 1997;387:819–823. doi: 10.1038/42972. [DOI] [PubMed] [Google Scholar]
- 26.Lill N, Grossman SR, Ginsberg D, De Caprio J, Livingston DM. Binding and modulation of p53 by p300/CBP coactivators. Nature. 1997;387:823–827. doi: 10.1038/42981. [DOI] [PubMed] [Google Scholar]
- 27.Montano X. p53 associates with trk tyrosine kinase. Oncogene. 1997;15:245–256. doi: 10.1038/sj.onc.1201215. [DOI] [PubMed] [Google Scholar]
- 28.Donehower LA, Harvey M, Slagle BL, McArthur MJ, Montgomery CA, Butel JS, Bradley A. Mice deficient for p53 are developmentally normal but susceptible to spontaneous tumours. Nature. 1992;356:215–221. doi: 10.1038/356215a0. [DOI] [PubMed] [Google Scholar]