

Abstract
Blood-brain barrier (BBB) compromise and transendothelial migration of HIV-infected leukocytes into the central nervous system (CNS) underlies the neuropathogenesis of HIV-1 infection. How this occurs is incompletely understood. We used a proteomic platform integrating difference gel electrophoresis and tandem mass spectrometry peptide sequencing to determine the effects that HIV-1-infected macrophages have on human brain microvascular endothelial cell (HBMEC) protein profiles. HIV-1 infected monocyte-derived macrophages (MDM) induced the upregulation of over 200 HBMEC proteins. These included metabolic, voltage-gated ion channels, heat shock, transport, cytoskeletal, regulatory, and calcium binding proteins. Results were validated by Western blot tests. We conclude that HIV-1-infected MDM affect the HBMEC proteome and, in this way, affect BBB dysfunction and the development of HIV-1 CNS disease.
Keywords: Human brain microvascular endothelial cells, Proteomics, Monocyte-derived macrophages, Human immunodeficiency virus, 2D difference gel electrophoresis
1. Introduction
The blood brain barrier (BBB) physically and physiologically separates the circulatory system from the central nervous system (CNS). Chemical, physical, cytokine and other cellular cues are transmitted across this barrier to maintain homeostasis (Shusta, 2005). Microvascular endothelial cells, which line the brain’s blood vessels, are a principle control for cell, protein, drug, and chemical entry in the CNS (Banks, 1999). Evidence abounds that this cellular control system is impaired during progressive HIV-1 disease and the emergence of cognitive impairments during HIV-1 associated dementia (HAD) (Dallasta et al., 1999; Persidsky et al., 1999). How this occurs is not completely understood but is thought to involve viral and cellular proteins secreted from infected cells that disrupt endothelial tight junctions (TJ) (Kanmogne et al., 2005) and permit egress of infected macrophages from the circulation into the brain (Banks et al., 2006; Kanmogne et al., 2006). Interestingly, this critical pathobiological process continues despite the dramatic effects of antiretroviral treatment (ART) on slowing disease progression in infected humans (McArthur et al., 2005).
Proteomics techniques provide opportunities to identify the cell phenotype as it is affected by disease (Zabel et al., 2006). Such investigations, done at the cellular level, could shed important light into the biochemical basis for BBB dysfunction in HAD. Based on our own hypotheses and those of others, alterations in cell-to-cell communication during interactions between HIV-1 infected macrophages and human brain microvascular endothelial cells (HBMEC) could affect each others protein content and expression and lead to dysfunction of the BBB (Carlson et al., 2004; Banks et al., 2006; Kanmogne et al., 2006; Persidsky et al., 1999). Thus, we began studies to evaluate the HBMEC proteome in models of HIV-1 associated CNS disease. A transwell co-culture system was used with HIV-1-infected monocyte-derived macrophages (MDM) and HBMEC on opposite sides. Based on these studies, we now demonstrate that structural, cytoskeletal, regulatory proteins, metabolic, voltage-gated ion channels, heat shock, transport, and calcium binding proteins are significantly upregulated in HBMVEC as a consequence of the endothelial cells’ interactions with infected MDM. In this way, we posit that HIV-infected MDM alter HBMEC protein content leading to alterations in the BBB’s integrity and infiltration of blood borne macrophage entry in the brain in disease.
2. Materials and Methods
2.1 Materials
The Cyanine dyes 1-(5-caboxypentyl)-1-propylindocarbocyanine halide (Cy2), N-hydroxy-succinimidyl ester (Cy3), 1-(5-carboxypentyl)-1-methylindodicarbocyanine halide (Cy5); Immobiline Dry Strips pH 3-10 (24cm pH gradient strips), Pharmalyte, 2D Clean-Up kit, 2D Qant Kit were purchased from GE Healthcare/Amersham Biosciences, Inc. (Piscataway, NJ). Urea, thiourea, 3-(3-Cholamidopropyl)dimethylammonio)-1-Propanesulfonic Acid (CHAPS), protease-inhibitor, bromophenol blue, acetonitrile (ACN) trifluoracetic acid (TFA), and ammonioum bicarbonate were obtained from Sigma (St. Louis, MO). Dithiothreitol (DTT), and iodacetamide (IAA) was purchased from Fisher (Pittsburgh, PA). Gels for Ettan Dalt Six System GE Healthcare were purchased from Jule, Inc. (Milford, CT). C18 ZipTips were purchased from Millipore (Billerica, MA), and 4–12% gradient mini gels from Invitrogen (Carlsbad, CA). The polyvinyldifluoride (PVDF) membrane was from GE Healthcare/Amersham Biosciences, Inc. Primary antibodies used in this study included: anti-α-tubulin, anti-β-tubulin, anti-annexin A2, anti-γ actin, anti-glyceraldehyde-3-phosphate dehydrogenase. All these primary and secondary antibodies were purchased from Novus Biologicals (Littleton, CO). Anti-vimentin was from Sigma-Aldrich (St. Louis, MO) and anti-heat shock 70kDa protein (Hsp70) from Cell Signaling Technology (Danvers, MA). The SYPRO® Ruby staining kit was from Molecular Probes Inc. (Eugene, OR).
2.2 Monocyte isolation and viral infection
Human peripheral blood mononuclear cells were isolated from leukopaks of HIV-1, HIV-2, and hepatitis B virus seronegative donors. Monocytes were purified by counter-current centrifugal elutriation and were cultured in DMEM supplemented with 10% heat-inactivated human serum, 2 mM L-glutamine, gentamicin (50 μg/ml), ciprofloxacin (10 μg/ml), and macrophage colony stimulating factor (a generous gift from Wyeth Inc., Cambridge, MA) used at 1000 U/ml. All other cell culture reagents were procured from Invitrogen (Carlsbad, CA). Monocytes were cultured for 7 days to generate MDM. MDM were infected with HIV-1ADA (a macrophage tropic strain) at a multiplicity of infection of 0.01 as previously described (Gendelman et al., 1988).
2.3 Human brain microvascular endothelial cell isolation and culture
HBMEC were isolated from the lateral temporal cortex of brain tissue supplied by Dr. M Witte from the University of Arizona Medical Center as previously described (Persidsky et al., 1997). Endothelial cells were cultured to confluence in 6-well plates, washed three times with serum-free media and then kept overnight in serum-free media before co-culture. Cells at passages 2 to 6 were used in this study.
2.4 BBB transwell co-culture system
The BBB model used in this study is illustrated in Figure 1. It was constructed by placing HBMEC (6 x 10⁶ cells) on the upper surface of the membrane of 6-well tissue culture inserts [Cyclopore® polyethylene tetraphthalate membrane, pore diameter of 0.4 micron products, (BD Biosciences, Franklin Lakes, NJ)]. HIV-1-infected MDM, 5 days after infection, were placed into six-well plates and co-cultured with HBMEC for 12 hours. Replicate co-cultures were done with uninfected MDM and HBMEC. Cells were washed in phosphate buffered saline (PBS), harvested and lysed in 200 μl cell lysis buffer containing 7M Urea, 2M thiourea, 4% CHAPS pH=8.5 and 1x protease inhibitor cocktail. Cells in lysis buffer were vortexed for 5 min to achieve complete cell lysis.
Figure 1.

Transwell system of human brain microvascular endothelial cells (HBMECs) separated by a 0.4 micron membrane co-cultured with un-infected (A) and HIV-1-infected (B) monocyte-derived macrophage (MDM).
2.5 Sample Preparation
To remove impurities and concentrate the sample, cell lysates were treated with a 2D Clean Up Kit from GE Healthcare/Amersham according to the manufacturer’s instructions. Protein concentration was determined with 2D Quant Kit (GE Healthcare/Amersham). Fifty micrograms of proteins from HBMECs co-cultured with non-infected MDM and HBMEC co-cultured with HIV-1 infected MDM were labeled with 400pmol of Cy3 and Cy5 dyes (CyDye Minimum Labelling kit, GE Healthcare/Amersham) respectively, according to the manufacturer’s protocol. Twenty-five micrograms of proteins from HBMECs co-cultured with uninfected MDM and 25 μg from HBMECs co-cultured with HIV-1-infected MDM was mixed and labeled with Cy2. Cy2 labeled samples were utilized as an internal standard to provide a point of normalization for each spot and most importantly the ability to compare a protein spot found in each gel using DeCyder Software. The resulting pools of proteins (Cy2-, Cy3-, and Cy5-labeled) were mixed with rehydration buffer (7 M urea, 2 M thiourea, 2% CHAPS, 50 mM DTT, 1% Pharmalyte (pH 3–10 NL).
2.6 2D difference gel electrophoresis (DIGE) and Image Analysis
Isoelectric focusing, first dimension separation, was carried out in IPGphor II apparatus (GE Healthcare/Amersham Biosciences) as described by the manufacturer. Gel strips with immobilized pH gradient (24 cm; pH 3–10 NL) were used for the first-dimension separation. After overnight incubation with samples resuspended in rehydration buffer, gel strips were subjected for a total focusing of 45 kVh (1 hr at 500V, 1h at 1000V, 3 hr at 8000V, and 3 hr at 8000V). Then, the strips were treated with an equilibration solution [6 M urea, 30% glycerol, 2% sodium dodecyl sulfate (SDS), 50 mM Tris (pH 8.8)] containing 100 mM DTT for 10 min. Next, alkylation with 100mM IAA (Sigma, Co.) in equilibration solution for 10 min. was performed. The strips were directly applied to a 10–20% gradient polyacrylamide gel for the second dimension separation. Current was held constant to 10W for the initial 30 min and 17W for 5 hr. For visualization of proteins spots, excitation wavelength was collected for Cy2-, Cy3-, and Cy5-labeled image at 488nm, 520nm, and 620 nm respectively. The emission wavelength for Cy2, Cy3, and Cy5 was 520nm, 590nm, and 680nm respectively. The resulting gel was then visualized by SYPRO Ruby staining. The SYPRO Ruby-stained gels were scanned at an excitation wavelength of 400nm and an emission wavelength of 630nm (Typhoon Scanner). All the images were collected on 2D 2920 Master Imager (GE Healthcare/Amersham Biosciences, Inc.). Statistics and quantitation of protein expression was carried out using DeCyder-DIA software (GE Healtchare/Amersham Biosciences, Inc.). Only those proteins represented by spots with over 2-fold changes in volume after normalization between the two populations were defined as altered.
2.7 In gel trypsin digestion and Reverse phase C18 column
Experiments were performed as previously described (Ciborowski et al., 2004). In brief, gel pieces were picked using EttanTM (GE Amersham) automated spot picker of 2 mm fragments and destained for 1 hr at room temperature using 100μL of 50% ACN/50mM NH4HCO3. Gel pieces were dried and incubated with trypsin in 10mM NH4HCO3 (Promega, Madison, WI) overnight at 37°C. Peptides were extracted by washing gel pieces twice with 0.1% TFA and 60% ACN. Dried samples were resuspended in 12μL of water containing 0.1% formic acid for automated injection. All samples were purified using ZipTip® (Millipore) prior to mass spectrometric analysis.
2.8 Mass Spectrometry Analysis
In-gel trypsin digested proteins were fractionated on microcapillary RP-C18 (Ciborowski et al., 2004). The resulting peptides were sequenced using Electrospray Ionization-Liquid Chromatography Mass Spectrometry (ESI-LC MS/MS) (Proteome X System with LCQDecaPlus mass spectrometer, ThermoElectron, Inc., San Jose, CA) with a nanospray configuration. The spectra obtained from LC-MS/MS analysis were searched against the NCBI.fasta protein database narrowed to a subset of human proteins (keywords: Homo sapiens, man, human, primate) using SEQUEST search engine (BioWorks 3.1 SR software from ThermoElectron, Inc.). In the TurboSEQUEST Search Parameters, threshold for Dta generation was 10000, Precursor Mass Tolerance for Dta Generation was set at 1.4. For Dta Search, Peptide Tolerance was set at 1.5 and Fragment Ions Tolerance at 0.00. Charge state was set on “Auto.” Database nr.fasta was retrieved from ftp.ncbi.nih.gov. We excluded keratins from our database search based on previous observations that these are contaminants resulting from sample processing.
2.9 Western Blotting Analysis
Western blot analysis was performed in triplicate comparing HBMEC cells co-cultured with infected or uninfected (control) MDM. Four micrograms of cell lysates was fractionated on a 4–12% Tris-glycine sodium dodecyl sulfate-polyacrylamide gel electrophoresis (SDS-PAGE), and electrophoretically transferred to PVDF membrane. Membranes were blocked for 1 hr in blocking solution (PBS containing of 2.5% bovine serum albumin and 2.5% skim milk), blotted for a minimum of 2 hr with primary antibodies diluted in blocking solution, then 1h with secondary antibody. Membranes were then washed and visualized using the enhanced chemiluminescence method (Pierce, Inc. Rockford, IL). Densitometry analysis was performed on all 3 replicate blots using ImageJ software.
3. Results
3.1 Differential protein expression in HBMEC after HIV-1 infected and control MDM co-culture
2D DIGE was used to quantify differences in protein expression in HBMEC co-cultured with control and virus-infected MDM. 2D DIGE analyses of HBMEC cell lysates was repeated three separate times with three independent donors. Gels obtained from the HBMEC 2D DIGE analyses were scanned using Typhoon Scanner set at 200 pixels and images produced using ImageQuant software (Fig. 2). Each experiment was performed in triplicate. Analysis of 2D images from protein lysates of 4 x 10⁷ endothelial cells identified an average of 2100 “putative” protein spots. Comparison of protein expression was performed using DeCyderTM Difference In gel Analysis software; an analysis of Cy3 (proteins from HBMECs co-cultured with non-infected MDM) and Cy5 (proteins from HBMEC co-cultured with HIV-infected MDM) images obtained from three independent experiments showed a total of 2217, 2293, and 1975 detected spots (Fig 2 A-C respectively). Each analysis revealed respectively 7.8%, 9.2%, and 11.5% differentially expressed protein spots after setting a threshold mode of quantitative differences ≥ 2 standard deviations (SD). In Fig. 2 A-C 159 (7.2%), 149 (6.2%), and 174 spots (8.8%) respectively were upregulated in HBMEC after HIV-1-infected MDM co-culture when compared to control MDM co-cultures. Fourteen (0.6%), 72 (3.0%), and 53 spots (2.7%) respectively were downregulated in HBMEC co-cultured with HIV-1-infected MDM compared to controls. After meeting the threshold mode of quantitative differences 2 SD (histograms in Fig. 2), we evaluated individual 3D images and picked 59, 69, and 94 spots from gel A, B, and C respectively (Fig. 2).
Figure 2.
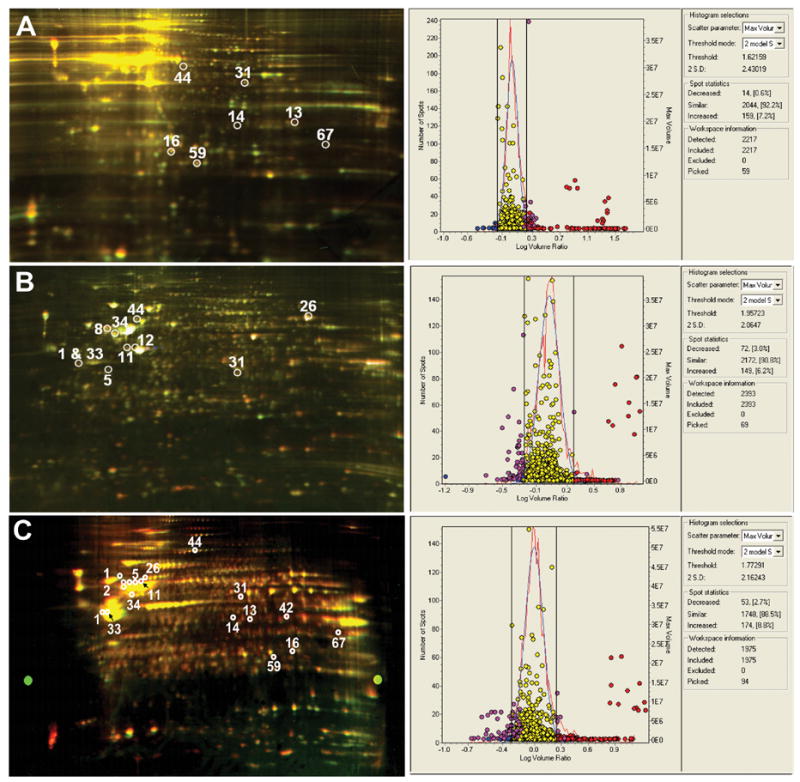
Three 2-dimensional fluorescence difference gel electrophoresis (2D-DIGE) of proteins from HBMECs co-cultured with non-infected (Cy-3 linked, green) and HIV-1-infected (Cy-5, red) MDM. Marked spots indicated on each gel represent proteins that were found in at least 2 gels. The numbers correspond to the identified proteins in Table 1 indicated by *. These are the following proteins: 1-actin gamma, 5-tubulin-alpha, 8-desmin, 11-tubulin-beta, 12-vimentin, 13-annexin A2, 14 annexin I, 16-apolipoprotein A-1, 26-heat shock protein 70, 31-actin Dnase I complex, 33-alpha enolase (non-neural enolase), 34-ATP synthase H+ transporting mitochondrial F1 complex, 42-glyceraldehyde-3-phosphate dehydrogenase, 44-disulfide isomerase, 59-triosephophate isomerase, 67-translation elongation factor 1. The corresponding DeCyderTM histograms view spots detected and differentially expressed for gel A, B, and C. The total number of spots detected were 2217, 2393, and 1975 in gel A, B, and C respectively. The percentage of differentially expressed spots for Gel A, B, and C after setting a threshold difference of 2 S.D. was 7.8%, 9.2%, and 11.5% respectively.
3.2 DeCyder analysis and LC-MS/MS identification of differentially expressed proteins
Analysis of protein expression using DeCyder-DIA software provided 3D simulation of each protein spot. This provided an objective view for comparison of spot intensity between Cy3 and Cy5 images (Fig. 3). Each protein spot could be presented in 3D views based on its relative amount and distribution. The 3D peak of each protein spot was generated based on the pixel intensity versus pixel area, whereby peak area correlated with the distribution of the protein spot on the gel. 3D images were obtained using 2D Master Imager. Each protein spot being comprised of lysates of HBMEC cultured with control (Cy3-labeled) and from those cells co-cultured with infected MDM (Cy5-labeled). These could be viewed and evaluated independently based on their differential fluorescent signal within a constant area for the spot. Their relative peak volumes were normalized to the total volume of the spot (Cy-2-labeled).
Figure 3.

Representative upregulated proteins found in at least 2 gels. Representative gel; the numbers correspond to their identification in Table 1. 1-actin gamma, 5-alpha-tubulin, 11-beta-tubulin, 12-vimentin, 13-annexin A2, 26-Hsp70, and 42-GAPDH. Three-dimensional DeCyder interpretation for seven representative proteins and corresponding Western blot analysis. Data show quantitative differences between HBMECs co-cultured with non-infected MDM indicated by (−) versus HBMECs co-cultured with HIV-1 infected MDM indicated by (+). Each pair of protein spots (Cy3- and Cy5-labeled) in 3D views by their relative peak volumes is also shown. The peak area shows the distribution of the protein spot in the gel, whereas the volume correlates with the protein amount. (B) The corresponding Western blots are shown and were done in triplicate. Western blot data correlate with 3D DeCyder data (except vimentin Western blot) and show protein upregulation in HBMECs co-cultured with HIV-1 MDM.
Table 1 shows those proteins upregulated in HBMEC co-cultured with HIV-1-infected MDM compared to controls. The list of proteins generated met the criteria of an Xcorr cut off greater than 2.5 for doubly charged ions and a Delta Cn of at least 0.30 were considered and Sp was greater than 500. Proteins were considered identified with high confidence when at least two peptides were sequenced and met the peptide criteria described above. Such threshold criteria have been determined previously to result in a 95% confidence level in peptide identification (Ciborowski, 2006; Yu et al., 2004). Following three independent analyses, we detected 16 proteins that were present in at least two gels (indicated by * in Table 1 and marked by their corresponding number on each gel as shown in Fig. 2A-C) The categories include structural/cytoskeletal and regulatory proteins, redox proteins, enzymes, HIV proteins, and others. All the 16 proteins were upregulated in HBMECs co-cultured with HIV-1-infected MDM, compared to endothelial cells co-cultured with non-infected MDM. The proteins identified consisted of structural or cytoskeletal proteins, regulatory proteins, enzymes, and heat shock proteins (Hsp). Fig. 2 A-C shows the location of these proteins on each gel: actin gamma (1), actin Dnase I Complex (31), alpha-tubulin (5), beta-tubulin (11), desmin (8), vimentin (12), annexin A2 (13), annexin I (14), apolipoprotein A-I (16), ATP synthase, H+ transporting mitochondrial protein (34), disulfide-isomerase (44), alpha-enolase (33), GAPDH (glyceraldehyde- 3 phosphate dehydrogenase) (42), TFSM (translation elongation factor) protein (67), triosephosphate isomerase (59), and Hsp 70 (26).
Table 1.
Upregulated proteins in BMVEC during HIV-1 MDM co-culturea
| Proteinb | Accession no.c | MWd | pIe | Peptidesf | |
|---|---|---|---|---|---|
| Structural/Cytoskeleton | |||||
| *1 | Actin, gamma 1 | Q5U032 | 41792 | 5.31 | 4 |
| 2 | Alpha 2 Type VI collagen, isoform 2C2 | Q6P0Q1 | 108606 | 5.85 | 2 |
| 3 | Alpha actinin 4 | O43707 | 104854 | 5.27 | 4 |
| 4 | Alpha actinin alpha1 | ? | 103170 | 5.25 | 2 |
| *5 | Alpha tubulin | Q71U36 | 50135 | 4.94 | 7 |
| 6 | Alpha 2 Type I collagen | P08123 | 129412 | 9.08 | 2 |
| 7 | Cofilin-1 | P23528 | 18360 | 8.26 | 1 |
| *8 | Desmin | P17661 | 53404 | 5.21 | 2 |
| 9 | Profilin, chain A | 1AWIA | 14842 | 8.46 | 2 |
| 10 | Talin 1 | Q5TCU6 | 258081 | 6.1 | 1 |
| *11 | Tubulin beta polypeptide | P07437 | 49670 | 4.78 | 4 |
| *12 | Vimentin | P08670 | 53520 | 5.06 | 25 |
| Regulatory | |||||
| *13 | Annexin A2 isoform 2 | P07355 | 38472 | 7.56 | 11 |
| *14 | Annexin I - human | P04083 | 38690 | 6.57 | 8 |
| 15 | Annexin V | P08758 | 35914 | 4.94 | 13 |
| *16 | Apolipoprotein A-I precursor | P02647 | 30759 | 5.56 | 3 |
| 17 | Calmodulin | P27482 | 16696 | 4.09 | 5 |
| 18 | Calmodulin-like 5 | Q5SQI3 | 15893 | 4.34 | 1 |
| 19 | Calponin | Q99439 | 33565 | 6.92 | 1 |
| 20 | Calreticulin precursor variant | Q53G71 | 46918 | 4.30 | 4 |
| 21 | Chaperonin | P10809 | 61054 | 5.7 | 2 |
| 22 | Cyclophillin | P62937 | 17883 | 8.34 | 1 |
| 23 | Heat shock 70kDa protein 8 isoform 2 | ? | 53517 | 5.62 | 6 |
| 24 | Heat shock 70kDa protein 9B precursor variant | Q53H23 | 73634 | 5.87 | 9 |
| 25 | Heat shock protein 27 | HHHU27 | 22768 | 5.98 | 1 |
| *26 | Heat shock protein 70 | P54652 | 70020 | 5.56 | 1 |
| 27 | Heat-shock protein 60 | Q38L19 | 61212 | 5.7 | 2 |
| 28 | Voltage-dependent anion channel | P21796 | 30641 | 8.63 | 11 |
| Redox Proteins | |||||
| 29 | Peroxiredoxin | CAI13096 | 21140 | 9.1 | 5 |
| 30 | Superoxide Dismutase | P00441 | 15903 | 5.87 | 2 |
| Enzymes | |||||
| *31 | Actin-Dnase I Complex | ? | 41790 | 5.17 | 5 |
| 32 | Aldo-keto reductase family 1, member C1 | Q5SR14 | 28050 | 9.01 | 1 |
| *33 | Alpha-enolase (Non- neural enolase) | P06733 | 47008 | 6.99 | 20 |
| *34 | ATP-synthase H+ transporting mitochondrial F1 | P06576 | 56560 | 5.26 | 7 |
| 35 | Beta-enolase (Muscle-specific enolase) | P13929 | 46826 | 7.73 | 5 |
| 36 | Cellulase | Q8PLM5 | 81259 | 6.21 | 2 |
| 37 | Choline-phosphate cytidylyltransferase B | Q86XC9 | 39307 | 5.99 | 1 |
| 38 | Fumarate hydratase mitochondrial | P07954 | 50353 | 8.85 | 2 |
| 39 | Gamma-enolase (Neural enolase) | P09104 | 47108 | 4.91 | 3 |
| 40 | Gamma-glutamyl hydrolase | JC6115 | 35937 | 6.66 | 1 |
| 41 | Glutathione-insulin transhydrogenase | P07237 | 57116 | 4.76 | 3 |
| *42 | Glyceraldehyde-3-phosphate dehydrogenase | P00354 | 36030 | 8.57 | 5 |
| 43 | H+transporting two sector ATPase | ? | 56500 | 5.57 | 6 |
| *44 | Disulfide Isomerase | ? | 13256 | 5.94 | 3 |
| 45 | Isocitrate Dehydrogenase 3 | P50213 | 39704 | 6.46 | 2 |
| 46 | L-lactate dehydrogenase | Q9BYZ2 | 41943 | 8.88 | 2 |
| 47 | Macrophage migration inhibitory factor | P14174 | 12337 | 8.24 | 1 |
| 48 | Malate dehydrogenase, cytoplasmic | P40925 | 36272 | 6.89 | 1 |
| 49 | NAD kinase | Q5QPS4 | 63456 | 6.32 | 1 |
| 50 | NADH-cytochrome b5 reductase | P00387 | 34082 | 7.31 | 2 |
| 51 | NADH-ubiquinone oxidoreductase 75 kDa subunit | P28331 | 79467 | 5.89 | 1 |
| 52 | Peroxisomal acyl-coenzyme A thioester hydrolase 2a | P49753 | 53223 | 8.93 | 2 |
| 53 | Phosphatase binding 1 protein PTG | Q8TDR5 | 36124 | 6.82 | 1 |
| 54 | Phosphoglycerate kinase | P00558 | 44586 | 8.31 | 13 |
| 55 | Probable thiol-specific reductase | G01790 | 30521 | 6.80 | 2 |
| 56 | Protein phosphatase 1F | Q6IPC0 | 49701 | 5.02 | 2 |
| 57 | Pyrophosphatase (Inorganic) | Q5SQT7 | 32639 | 5.54 | 4 |
| 58 | Pyruvate dehydrogenase (lipoamide) | Q15119 | 43268 | 6.14 | 2 |
| *59 | Triosphosphate Isomerase | P60174 | 26538 | 6.51 | 2 |
| Other | |||||
| 60 | 14-3-3 protein | P63104 | 27728 | 4.73 | 2 |
| 61 | Anti-HBSAg immunoglobulin | ? | 23512 | 8.3 | 2 |
| 62 | AntiTNF-alpha Ab | ? | 23324 | 6.18 | 2 |
| 63 | Polymerase I and transcript release factor | AAH73759 | 33342 | 5.51 | 1 |
| 64 | Centrosomal protein 1 | Q5JVD3 | 52297 | 7.59 | 1 |
| 65 | Desmoyokin | A45259 | 312294 | 5.84 | 2 |
| 66 | Dipeptidyl peptidase 7 preproprotein | ? | 54341 | 5.91 | 3 |
| *67 | Translation elongation factor 1 | Q561V7 | 35353 | 8.62 | 1 |
| 68 | Glucose-regulated protein | P11021 | 72332 | 5.07 | 11 |
| 69 | Heterogeneous nuclear ribonucleoprotein B1 | B34504 | 37407 | 6.93 | 4 |
| 70 | Histone H2A.1 | HSHUA1 | 14083 | 10.9 | 1 |
| 71 | IDH1 protein | Q6FHQ6 | 46630 | 6.53 | 7 |
| 72 | Ig gamma-1 chain C region | ? | 36083 | 8.46 | 3 |
| 73 | Ig light chain Fab fragment | 1AD0A | 23145 | 8.26 | 1 |
| 74 | Mannose 6 phosphate receptor binding protein 1 | O60664 | 47018 | 5.30 | 10 |
| 75 | Nucleobindin 1 variant | Q53GX6 | 53907 | 5.15 | 1 |
| 76 | Sodium channel-like protein | Q9BYZ7 | 43784 | 5.52 | 1 |
| 77 | Tax 1 Binding Protein | O14907 | 12853 | 8.26 | 1 |
| HIV Proteins | |||||
| 78 | Envelope glycoprotein [HIV] | Q3YD75 | 12760 | 10.13 | 1 |
The CID spectra were compared against those of the EMBL nonredundant protein database by using SEQUEST (ThermoElectron, San Jose, CA). After filtering the results based on cross correlation Xcorr (cutoffs of 2.0 for [M+ H]1+, 2.5 for [M + 2H]2+, and 3.0 for [M+ 3H]3+), peptides with scores greater than 3000 and meeting delta cross-correlation scores (Δ Cn) > 0.3, and fragment ion numbers > 60% were deemed valid by these SEQUEST criteria thresholds, which have been determined to afford greater than 95% confidence level in peptide identification (Gorg et.al, 2004).
Alternative names are provided in parentheses.
Accession numbers for UniProt (accessible at http://www.ipr.uniprot.org/search/textSearch.shtml)
Theoretical molecular mass for the primary translation product calculated from DNA sequences protein.
Isoelectric Point
Number of peptides identified for each protein selected based on the above-mentioned criteria.
? Unknown
Proteins found to be present in at least 2 gels
To validate proteins identified by mass spectrometry, we performed western blot analysis for a subset of 7 proteins (actin-γ, tubulin-α, tubulin-β, vimentin, annexin A2, Hsp70 and GAPDH). Fig. 3 shows those 7 representative proteins with their location on the gel, their 3D DeCyderTM interpretation, and corresponding Western blot results.
4. Discussion
The pathological correlate of HAD is HIV-1 encephalitis (HIVE). It is characterized by the egress into the brain of blood borne macrophages and correlates with disease severity (Glass et al., 1995). Distinct histopathological features of HIVE are most pronounced in the deep gray matter and cortical white matter and include alterations in the vascular TJ proteins expression (Dallasta et al., 1999). Indeed, previous studies clearly demonstrate that the BBB, which normally regulates cell trafficking into the CNS parenchyma, is compromised during disease (Dallasta et al., 1999; Petito and Cash, 1992; Power et al., 1993; Rhodes, 1991). Abnormalities reflecting BBB dysfunction abound and include mononuclear cell infiltration, formation of microglial nodules and vessel-associated multinucleated giant cells, serum extravasation, and profound astrocytosis (Persidsky et al., 1999; Toborek et al., 2005). There is ample evidence that such pathological alterations may occur as a result of HBMEC interactions with immune competent and virus-infected macrophages as a result of the secretion of soluble viral and cellular products from macrophages and other infected cells (Kanmogne et al., 2002; Kanmogne et al., 2005; Kanmogne et al., 2006; Nottet et al., 1996). However, the actual mechanism of HIV-induced BBB disruption is incompletely understood. Significant works have demonstrated that cellular and viral proteins can alter vascular BBB permeability and disrupt the BBB. These factors include pro-inflammatory cytokines (for example, tumor necrosis factor-α (TNF-α) and interleukin-6, HIV-1 Tat and gp120 proteins amongst others (Brett et al., 1995; Hurwitz et al., 1994; Ridet et al., 1997; Toborek et al., 2005). TNF-α and interferons, for example, induce fragmentation of ZO-1 via F actin rearrangement in brain endothelial cells (Blum et al., 1997). Viral proteins can also cause oxidative stress and in so doing affect monocyte migration through the barrier (Annunziata, 2003; Annunziata et al., 1998; Cioni and Annunziata, 2002; Price et al., 2005). Nonetheless, these prior works are likely just a fraction of what proteins are implicated in BBB dysfunction and disease.
Thus, we used a proteomic approach to elucidate the phenotype of proteins altered in disease in order to investigate the biochemical basis of HIV-induced BBB dysfunction. In this study, we use an in vitro co-culture system and a proteomic platform integrating DIGE and protein identification using tandem mass spectrometry peptide sequencing to determine the effect of HIV-1 on HBMEC protein expression. To our knowledge, this work is the first to provide a proteomics analysis of HBMEC during exposure to HIV-1-infected MDM. Results showed that HIV-1-infected MDM induced HBMEC upregulation of metabolic, voltage-gated ion channels, heat shock, transport, cytoskeletal, regulatory, and calcium binding proteins. Proteomics results were reproducible, were confirmed in three independent experiments, and were validated by western blot analysis. Western blot data and corresponding 3D DeCyderTM interpretation for seven representative proteins: actin-γ, tubulin-α, tubulin-β, vimentin, Hsp70, Annexin A2, and GAPDH. Overall, Western blot data correlate with 3D DeCyderTM results and confirm upregulation of these HBMEC proteins. The only exception was vimentin where Western blot tests failed to show differences between the samples. This could be due to the low power of separation/quantification of Western blotting techniques, compared to 2D DIGE, mass spectrometry, and DeCyder analysis. Another possible reason for these discrepancies is that vimentin is abundantly expressed in these cells and small differences could be missed in the immunoblot tests.
Cytoskeletal proteins upregulated in this study included actin-γ, tubulin-α, tubulin-β, vimentin, profilin, cofilin, collagen, and alpha actinin. Similar cytoskeletal alterations have been observed in proteomic studies using endothelial cells from other vascular beds. Replicative senescence in cultured umbilical endothelial cells is associated with increased expression of cytoskeletal proteins, including vimentin. Such cytoskeletal alterations may play affect the pathogenesis of arteriosclerosis (Kamino et al., 2003). Inhibitors of angiogenesis also upregulate cofilin, vimentin and tropomyosin in umbilicl endothelial cells and human dermal microvascular endothelial cells (Keezer et al., 2003). Proteomic studies of dermal endothelial cells have revealed that anti-aging agents upregulates actin–γ and actin-related proteins, Annexin A3, Annexin IV and redox enzymes in the dermal endothelial cells (Lee et al., 2006). Parallel results were seen in HIV-1 infected MDM from studies of our own laboratory where cytoskeletal transformation occurred as a consequence of giant cell formation (Kadiu unpublished observations). Another proteomic study showed that exposure of human coronary endothelial cells to the acetylcholine analog carbachol also induced upregulation of several cytoskeletal proteins, including vimentin, redox proteins, and induced the expression heat shock proteins (Hsp70, Hsp gp96 precursor) (Yu et al., 2004). Bruneel and colleagues (Bruneel et al., 2005) also showed that the protein content of primary umbilical vein endothelial cells include cytoskeletal proteins (actin, tubulin, vimentin and tropomyosin), proteins involved in cellular motility and plasticity (e.g cofilin), enzymes (e.g, lactate dehydrogenase and disulfide isomerase) and Hsp.
Our study shows the presence of similar proteins in HBMECs and further demonstrates alterations/upregulation of these proteins by HIV-infected MDM. In addition to cytoskeletal/structural proteins, proteins upregulated in HBMECs following co-culture with infected MDM included annexin family of proteins (A2, I and V), apolipoprotein A-1, calmodulin, heat shock precursor proteins, Hsp70, Hsp27 and Hsp60, and enzymes such as lactate dehydrogenase (LDH). LDH is a marker of cellular toxicity and is often produced by cells undergoing necrosis or apoptosis. We previously showed that HIV-1gp120 proteins induce toxicity and LDH secretion in HBMECs and human cortical neurons (Kanmogne et al., 2002). Annexin A2 or annexin II is a calcium binding protein that has been shown to play a role in cell adhesion and membrane trafficking (Campostrini et al., 2006). Annexin 2 also acts as a phophatidylserine binding moiety in which it plays a cellular cofactor role supporting macrophage HIV-1 infection (Ma et al., 2004). Hsp are molecular chaperones that are induced by various inflammatory and pathophysiological stimuli and play important roles in cell repair and protective mechanisms. It has been suggested that rapid induction of both Hsp27 and vimentin in the microvasculature during hyperthermic stress may compromise the BBB (Bechtold and Brown, 2003). Hsp70 is involved in the regulation of cell growth and transformation (Kaur et al., 2000), is overexpressed in malignant tumors (Campostrini et al., 2006), and HIV-infected cells (Kocsis et al., 2003) and is the most abundant Hsp associated with HIV virions (Kocsis et al., 2003). One study showed that Hsp70 can protect cells from cell cycle arrest and apoptosis induced by HIV-1 viral protein R; the authors stipulated that Hsp70 may be a novel anti-HIV innate immunity factor that targets HIV-1 viral protein R (Iordanskiy et al., 2004). Shear stress induce Hsp60 expression in endothelial cells (Hochleitner et al., 2000); and studies in cultured umbilical vein endothelial cells models of ischemia-reperfusion injury show that compared to Hsp56, overexpression of Hsp70 and Hsp27 in endothelial cells during posthypoxic reoxygenation can protect endothelial cells from delayed apoptosis (Kabakov et al., 2003). Human esophageal endothelial cells also respond to acidic stress by induction of Hsp70 and Hsp27, and this involves activation of the Pi3K/AKT and p38 MAPK pathways (Rafiee et al., 2006).
In our study, redox proteins (peroxiredoxin and superoxide dismutase) were also upregulated in HBMEC-infected MDM cocultures. Krizbai and colleagues have shown that oxidative stress downregulate occludin expression, induce a disruption of the cadherin-beta-catenin complex and activation of extracellular signal-regulated kinase (ERK1/2) (Krizbai et al., 2005). Haorah and colleagues also demonstrated that reactive oxygen species augmented endothelial cell permeability and monocyte migration across the BBB; and this was associated with release of intracellular Ca2+, activation of myosin light chain kinase, phophorylation of tight junctions and cytoskeletal proteins (Haorah et al., 2005). In addition, Tat-induced BBB compromise is associated with oxidative stress, disruption of endothelial tight junctions and decrease cell viability (Price et al., 2005).
Vascular endothelial cells function as a semi-permeable barrier regulated by the cytoskeleton (Dudek and Garcia, 2001). There is evidence that cellular contractile forces involving interactions between actin and myosin can result in actin stress fiber formation, increased tension and enhanced vascular permeability (Hirata et al., 1995); In response to physiological and pathological stresses, endothelial actin filaments undergo dynamic changes that can result in intercellular gap formation, cell shape changes and increased vascular permeability [reviewed in (Lum and Roebuck, 2001)]. These cytoskeletal alterations are often catalyzed by the phosphorylation of myosin light chain as a result of sequential activation of small GTPases of the Rho family proteins and myosin light chain kinase (Houle and Huot, 2006; Jacobson et al., 2004; Persidsky et al., 2006). Several studies show that actin polymerization and remodeling play a central role in regulating endothelial permeability and leukocyte transendothelial migration during inflammation (Houle and Huot, 2006; Lum and Roebuck, 2001). Our present study show that co-culture of HBMECs with HIV-infected MDM induce upregulation in cytoskeletal, structural and regulatory proteins, as well as redox, Hsps, LDH and oxidative stress enzymes in HBMEC. LDH further induce endothelial cell toxicity (Kanmogne et al., 2002) and Hsps chaperone denatured intracellular and signal transduction proteins during stress to maintain cellular homeostasis following sublethal injury. Our proteomic analysis represents important data to further our understanding of HIV-1-induced BBB dysfunction, and we are currently investigating the role these proteins play in cytoskeletal reorganization and BBB modulation in the setting of HIV-1 infection. Understanding the role each of these proteins may ultimately play in HIV-induced BBB impairment could provide additional targets for future therapeutic intervention to prevent HIV neuropathology.
Acknowledgments
Robin Taylor for her tireless effort in helping us put this manuscript together in a timely manner. Tong Wang for his computer and graphic expertise. We thank Dr. Ron Cerny for assistance with the LC-MS/MS protein microsequencing.
This work was funded by NIH grants 1T32 NS07488 (to M.R.-D. and H.E.G.), 2R37 NS36126 and 5 P01 MH64570-03 (H.E.G), 1 P01 NS043985-01 (H.E.G and Y.P), , P20 RR15635-03 (to G.D.K., Y.P., P.C. and H.E.G.); MH-068214 (to G.D.K.), and R21 AA013846, RO1 AA015913 (to Y.P.).
Footnotes
Publisher's Disclaimer: This is a PDF file of an unedited manuscript that has been accepted for publication. As a service to our customers we are providing this early version of the manuscript. The manuscript will undergo copyediting, typesetting, and review of the resulting proof before it is published in its final citable form. Please note that during the production process errors may be discovered which could affect the content, and all legal disclaimers that apply to the journal pertain.
References
- Annunziata P. Blood-brain barrier changes during invasion of the central nervous system by HIV-1. Old and new insights into the mechanism. J Neurol. 2003;250:901–906. doi: 10.1007/s00415-003-1159-0. [DOI] [PubMed] [Google Scholar]
- Annunziata P, Cioni C, Toneatto S, Paccagnini E. HIV-1 gp120 increases the permeability of rat brain endothelium cultures by a mechanism involving substance P. Aids. 1998;12:2377–2385. doi: 10.1097/00002030-199818000-00006. [DOI] [PubMed] [Google Scholar]
- Banks WA. Physiology and pathology of the blood-brain barrier: implications for microbial pathogenesis, drug delivery and neurodegenerative disorders. J Neurovirol. 1999;5:538–555. doi: 10.3109/13550289909021284. [DOI] [PubMed] [Google Scholar]
- Banks WA, Ercal N, Price TO. The blood-brain barrier in neuroAIDS. Curr HIV Res. 2006;4:259–266. doi: 10.2174/157016206777709447. [DOI] [PubMed] [Google Scholar]
- Bechtold DA, Brown IR. Induction of Hsp27 and Hsp32 stress proteins and vimentin in glial cells of the rat hippocampus following hyperthermia. Neurochem Res. 2003;28:1163–1173. doi: 10.1023/a:1024268126310. [DOI] [PubMed] [Google Scholar]
- Blum MS, Toninelli E, Anderson JM, Balda MS, Zhou J, O'Donnell L, Pardi R, Bender JR. Cytoskeletal rearrangement mediates human microvascular endothelial tight junction modulation by cytokines. Am J Physiol. 1997;273:H286–294. doi: 10.1152/ajpheart.1997.273.1.H286. [DOI] [PubMed] [Google Scholar]
- Brett FM, Mizisin AP, Powell HC, Campbell IL. Evolution of neuropathologic abnormalities associated with blood-brain barrier breakdown in transgenic mice expressing interleukin-6 in astrocytes. J Neuropathol Exp Neurol. 1995;54:766–775. doi: 10.1097/00005072-199511000-00003. [DOI] [PubMed] [Google Scholar]
- Bruneel A, Labas V, Mailloux A, Sharma S, Royer N, Vinh J, Pernet P, Vaubourdolle M, Baudin B. Proteomics of human umbilical vein endothelial cells applied to etoposide-induced apoptosis. Proteomics. 2005;5:3876–3884. doi: 10.1002/pmic.200401239. [DOI] [PubMed] [Google Scholar]
- Campostrini N, Marimpietri D, Totolo A, Mancone C, Fimia GM, Ponzoni M, Righetti PG. Proteomic analysis of anti-angiogenic effects by a combined treatment with vinblastine and rapamycin in an endothelial cell line. Proteomics. 2006;6:4420–4431. doi: 10.1002/pmic.200600119. [DOI] [PubMed] [Google Scholar]
- Ciborowski P, Enose Y, Mack A, Fladseth M, Gendelman HE. Diminished matrix metalloproteinase 9 secretion in human immunodeficiency virus-infected mononuclear phagocytes: modulation of innate immunity and implications for neurological disease. J Neuroimmunol. 2004;157:11–16. doi: 10.1016/j.jneuroim.2004.08.033. [DOI] [PubMed] [Google Scholar]
- Ciborowski P, Kadiu-Kielen I, Rozek W, Smith L, Bernhardt K, Fladseth M, Ricardo-Dukelow M, Gendelman HE. Investigating the human immunodeficiency virus type one-infected monocyte-derived macrophage secretome. Molecular and Cellular Proteomics. 2006 doi: 10.1016/j.virol.2007.01.013. sumbitted. [DOI] [PMC free article] [PubMed] [Google Scholar]
- Cioni C, Annunziata P. Circulating gp120 alters the blood-brain barrier permeability in HIV-1 gp120 transgenic mice. Neurosci Lett. 2002;330:299–301. doi: 10.1016/s0304-3940(02)00814-5. [DOI] [PubMed] [Google Scholar]
- Dallasta LM, Pisarov LA, Esplen JE, Werley JV, Moses AV, Nelson JA, Achim CL. Blood-brain barrier tight junction disruption in human immunodeficiency virus-1 encephalitis. Am J Pathol. 1999;155:1915–1927. doi: 10.1016/S0002-9440(10)65511-3. [DOI] [PMC free article] [PubMed] [Google Scholar]
- Dudek SM, Garcia JG. Cytoskeletal regulation of pulmonary vascular permeability. J Appl Physiol. 2001;91:1487–1500. doi: 10.1152/jappl.2001.91.4.1487. [DOI] [PubMed] [Google Scholar]
- Gendelman HE, Orenstein JM, Martin MA, Ferrua C, Mitra R, Phipps T, Wahl LA, Lane HC, Fauci AS, Burke DS, et al. Efficient isolation and propagation of human immunodeficiency virus on recombinant colony-stimulating factor 1-treated monocytes. J Exp Med. 1988;167:1428–1441. doi: 10.1084/jem.167.4.1428. [DOI] [PMC free article] [PubMed] [Google Scholar]
- Glass JD, Fedor H, Wesselingh SL, McArthur JC. Immunocytochemical quantitation of human immunodeficiency virus in the brain: correlations with dementia. Ann Neurol. 1995;38:755–762. doi: 10.1002/ana.410380510. [DOI] [PubMed] [Google Scholar]
- Haorah J, Knipe B, Leibhart J, Ghorpade A, Persidsky Y. Alcohol-induced oxidative stress in brain endothelial cells causes blood-brain barrier dysfunction. J Leukoc Biol. 2005;78:1223–1232. doi: 10.1189/jlb.0605340. [DOI] [PubMed] [Google Scholar]
- Hirata A, Baluk P, Fujiwara T, McDonald DM. Location of focal silver staining at endothelial gaps in inflamed venules examined by scanning electron microscopy. Am J Physiol. 1995;269:L403–418. doi: 10.1152/ajplung.1995.269.3.L403. [DOI] [PubMed] [Google Scholar]
- Hochleitner BW, Hochleitner EO, Obrist P, Eberl T, Amberger A, Xu Q, Margreiter R, Wick G. Fluid shear stress induces heat shock protein 60 expression in endothelial cells in vitro and in vivo. Arterioscler Thromb Vasc Biol. 2000;20:617–623. doi: 10.1161/01.atv.20.3.617. [DOI] [PubMed] [Google Scholar]
- Houle F, Huot J. Dysregulation of the endothelial cellular response to oxidative stress in cancer. Mol Carcinog. 2006;45:362–367. doi: 10.1002/mc.20218. [DOI] [PubMed] [Google Scholar]
- Hurwitz AA, Berman JW, Lyman WD. The role of the blood-brain barrier in HIV infection of the central nervous system. Adv Neuroimmunol. 1994;4:249–256. doi: 10.1016/s0960-5428(06)80263-9. [DOI] [PubMed] [Google Scholar]
- Iordanskiy S, Zhao Y, DiMarzio P, Agostini I, Dubrovsky L, Bukrinsky M. Heat-shock protein 70 exerts opposing effects on Vpr-dependent and Vpr-independent HIV-1 replication in macrophages. Blood. 2004;104:1867–1872. doi: 10.1182/blood-2004-01-0081. [DOI] [PubMed] [Google Scholar]
- Jacobson JR, Dudek SM, Birukov KG, Ye SQ, Grigoryev DN, Girgis RE, Garcia JG. Cytoskeletal activation and altered gene expression in endothelial barrier regulation by simvastatin. Am J Respir Cell Mol Biol. 2004;30:662–670. doi: 10.1165/rcmb.2003-0267OC. [DOI] [PubMed] [Google Scholar]
- Kabakov AE, Budagova KR, Bryantsev AL, Latchman DS. Heat shock protein 70 or heat shock protein 27 overexpressed in human endothelial cells during posthypoxic reoxygenation can protect from delayed apoptosis. Cell Stress Chaperones. 2003;8:335–347. doi: 10.1379/1466-1268(2003)008<0335:hspohs>2.0.co;2. [DOI] [PMC free article] [PubMed] [Google Scholar]
- Kamino H, Hiratsuka M, Toda T, Nishigaki R, Osaki M, Ito H, Inoue T, Oshimura M. Searching for genes involved in arteriosclerosis: proteomic analysis of cultured human umbilical vein endothelial cells undergoing replicative senescence. Cell Struct Funct. 2003;28:495–503. doi: 10.1247/csf.28.495. [DOI] [PubMed] [Google Scholar]
- Kanmogne GD, Kennedy RC, Grammas P. HIV-1 gp120 proteins and gp160 peptides are toxic to brain endothelial cells and neurons: possible pathway for HIV entry into the brain and HIV-associated dementia. J Neuropathol Exp Neurol. 2002;61:992–1000. doi: 10.1093/jnen/61.11.992. [DOI] [PubMed] [Google Scholar]
- Kanmogne GD, Primeaux C, Grammas P. HIV-1 gp120 proteins alter tight junction protein expression and brain endothelial cell permeability: implications for the pathogenesis of HIV-associated dementia. J Neuropathol Exp Neurol. 2005;64:498–505. doi: 10.1093/jnen/64.6.498. [DOI] [PubMed] [Google Scholar]
- Kanmogne GD, Schall K, Leibhart J, Knipe B, Gendelman HE, Persidsky Y. HIV-1 gp120 compromises blood-brain barrier integrity and enhance monocyte migration across blood-brain barrier: implication for viral neuropathogenesis. J Cereb Blood Flow Metab. 2006 doi: 10.1038/sj.jcbfm.9600330. in press. [DOI] [PMC free article] [PubMed] [Google Scholar]
- Kaur J, Kaur J, Ralhan R. Induction of apoptosis by abrogation of HSP70 expression in human oral cancer cells. Int J Cancer. 2000;85:1–5. doi: 10.1002/(sici)1097-0215(20000101)85:1<1::aid-ijc1>3.0.co;2-o. [DOI] [PubMed] [Google Scholar]
- Keezer SM, Ivie SE, Krutzsch HC, Tandle A, Libutti SK, Roberts DD. Angiogenesis inhibitors target the endothelial cell cytoskeleton through altered regulation of heat shock protein 27 and cofilin. Cancer Res. 2003;63:6405–6412. [PubMed] [Google Scholar]
- Kocsis J, Prohaszka Z, Biro A, Fust G, Banhegyi D. Elevated levels of antibodies against 70 kDa heat shock proteins in the sera of patients with HIV infection. J Med Virol. 2003;71:480–482. doi: 10.1002/jmv.10507. [DOI] [PubMed] [Google Scholar]
- Krizbai IA, Bauer H, Bresgen N, Eckl PM, Farkas A, Szatmari E, Traweger A, Wejksza K, Bauer HC. Effect of oxidative stress on the junctional proteins of cultured cerebral endothelial cells. Cell Mol Neurobiol. 2005;25:129–139. doi: 10.1007/s10571-004-1378-7. [DOI] [PMC free article] [PubMed] [Google Scholar]
- Lee JH, Chung KY, Bang D, Lee KH. Searching for aging-related proteins in human dermal microvascular endothelial cells treated with anti-aging agents. Proteomics. 2006;6:1351–1361. doi: 10.1002/pmic.200500287. [DOI] [PubMed] [Google Scholar]
- Lum H, Roebuck KA. Oxidant stress and endothelial cell dysfunction. Am J Physiol Cell Physiol. 2001;280:C719–741. doi: 10.1152/ajpcell.2001.280.4.C719. [DOI] [PubMed] [Google Scholar]
- Ma G, Greenwell-Wild T, Lei K, Jin W, Swisher J, Hardegen N, Wild CT, Wahl SM. Secretory leukocyte protease inhibitor binds to annexin II, a cofactor for macrophage HIV-1 infection. J Exp Med. 2004;200:1337–1346. doi: 10.1084/jem.20041115. [DOI] [PMC free article] [PubMed] [Google Scholar]
- McArthur JC, Brew BJ, Nath A. Neurological complications of HIV infection. Lancet Neurol. 2005;4:543–555. doi: 10.1016/S1474-4422(05)70165-4. [DOI] [PubMed] [Google Scholar]
- Nottet HS, Persidsky Y, Sasseville VG, Nukuna AN, Bock P, Zhai QH, Sharer LR, McComb RD, Swindells S, Soderland C, Gendelman HE. Mechanisms for the transendothelial migration of HIV-1-infected monocytes into brain. J Immunol. 1996;156:1284–1295. [PubMed] [Google Scholar]
- Persidsky Y, Ghorpade A, Rasmussen J, Limoges J, Liu XJ, Stins M, Fiala M, Way D, Kim KS, Witte MH, Weinand M, Carhart L, Gendelman HE. Microglial and astrocyte chemokines regulate monocyte migration through the blood-brain barrier in human immunodeficiency virus-1 encephalitis. Am J Pathol. 1999;155:1599–1611. doi: 10.1016/S0002-9440(10)65476-4. [DOI] [PMC free article] [PubMed] [Google Scholar]
- Persidsky Y, Heilman D, Haorah J, Zelivyanskaya M, Persidsky R, Weber GA, Shimokawa H, Kaibuchi K, Ikezu T. Rho-mediated regulation of tight junctions during monocyte migration across the blood-brain barrier in HIV-1 encephalitis (HIVE) Blood. 2006;107:4770–4780. doi: 10.1182/blood-2005-11-4721. [DOI] [PMC free article] [PubMed] [Google Scholar]
- Persidsky Y, Stins M, Way D, Witte MH, Weinand M, Kim KS, Bock P, Gendelman HE, Fiala M. A model for monocyte migration through the blood-brain barrier during HIV-1 encephalitis. J Immunol. 1997;158:3499–3510. [PubMed] [Google Scholar]
- Petito CK, Cash KS. Blood-brain barrier abnormalities in the acquired immunodeficiency syndrome: immunohistochemical localization of serum proteins in postmortem brain. Ann Neurol. 1992;32:658–666. doi: 10.1002/ana.410320509. [DOI] [PubMed] [Google Scholar]
- Power C, Kong PA, Crawford TO, Wesselingh S, Glass JD, McArthur JC, Trapp BD. Cerebral white matter changes in acquired immunodeficiency syndrome dementia: alterations of the blood-brain barrier. Ann Neurol. 1993;34:339–350. doi: 10.1002/ana.410340307. [DOI] [PubMed] [Google Scholar]
- Price TO, Ercal N, Nakaoke R, Banks WA. HIV-1 viral proteins gp120 and Tat induce oxidative stress in brain endothelial cells. Brain Res. 2005;1045:57–63. doi: 10.1016/j.brainres.2005.03.031. [DOI] [PubMed] [Google Scholar]
- Rafiee P, Theriot ME, Nelson VM, Heidemann J, Kanaa Y, Horowitz SA, Rogaczewski A, Johnson CP, Ali I, Shaker R, Binion DG. Human esophageal microvascular endothelial cells respond to acidic pH stress by PI3K/AKT and p38 MAPK-regulated induction of Hsp70 and Hsp27. Am J Physiol Cell Physiol. 2006;291:C931–945. doi: 10.1152/ajpcell.00474.2005. [DOI] [PubMed] [Google Scholar]
- Rhodes RH. Evidence of serum-protein leakage across the blood-brain barrier in the acquired immunodeficiency syndrome. J Neuropathol Exp Neurol. 1991;50:171–183. doi: 10.1097/00005072-199103000-00008. [DOI] [PubMed] [Google Scholar]
- Ridet JL, Malhotra SK, Privat A, Gage FH. Reactive astrocytes: cellular and molecular cues to biological function. Trends Neurosci. 1997;20:570–577. doi: 10.1016/s0166-2236(97)01139-9. [DOI] [PubMed] [Google Scholar]
- Shusta EV. Blood-brain barrier genomics, proteomics, and new transporter discovery. NeuroRx. 2005;2:151–161. doi: 10.1602/neurorx.2.1.151. [DOI] [PMC free article] [PubMed] [Google Scholar]
- Toborek M, Lee YW, Flora G, Pu H, Andras IE, Wylegala E, Hennig B, Nath A. Mechanisms of the blood-brain barrier disruption in HIV-1 infection. Cell Mol Neurobiol. 2005;25:181–199. doi: 10.1007/s10571-004-1383-x. [DOI] [PMC free article] [PubMed] [Google Scholar]
- Yu M, Chen DM, Hu G, Wang H. Proteomic response analysis of endothelial cells of human coronary artery to stimulation with carbachol. Acta Pharmacol Sin. 2004;25:1124–1130. [PubMed] [Google Scholar]
- Zabel C, Sagi D, Kaindl AM, Steireif N, Klare Y, Mao L, Peters H, Wacker MA, Kleene R, Klose J. Comparative proteomics in neurodegenerative and non-neurodegenerative diseases suggest nodal point proteins in regulatory networking. J Proteome Res. 2006;5:1948–1958. doi: 10.1021/pr0601077. [DOI] [PubMed] [Google Scholar]