Abstract
When a two-photon excited fluorescence (TPEF) microscope is used to image deep inside tissue, out-of-focus background can arise from both ballistic and nonballistic excitation. We propose a solution to largely reject TPEF background in thick tissue. Our technique is based on differential-aberration imaging with a deformable mirror. By introducing extraneous aberrations in the excitation beam path, we preferentially quench in-focus TPEF signal while leaving out-of-focus TPEF background largely unchanged. A simple subtraction of an aberrated, from an unaberrated, TPEF image then removes background while preserving signal. Our differential aberration (DA) technique is simple, robust, and can readily be implemented with standard TPEF microscopes with essentially no loss in temporal resolution when using a line-by-line DA protocol. We analyze the performance of various induced aberration patterns, and demonstrate the effectiveness of DA-TPEF by imaging GFP-labeled sensory neurons in a mouse olfactory bulb and CA1 pyramidal cells in a hippocampus slice.
INTRODUCTION
Two-photon excited fluorescence (TPEF) microscopy has become a well-established tool for high-resolution imaging in scattering media such as thick tissue (1–4). While it is well accepted that TPEF microscopy provides greater imaging depth penetration in thick tissue than more conventional fluorescence imaging techniques, such as confocal or wide-field microscopy, the depth penetration of TPEF microscopy remains nonetheless limited. For example, demonstrations of TPEF imaging beyond 500 μm in brain tissue have been rare (5,6).
Several factors limit TPEF microscopy depth penetration in thick tissue:
An excitation beam can undergo scattering when it propagates through tissue. This scattering weakens the ballistic (unscattered) excitation power that attains the beam focus and thereby reduces the TPEF signal generated at the focus. Because scattering scales roughly exponentially with propagation distance, by dint of the Lambert-Beer law, the reduction in TPEF signal becomes particularly severe at larger focal depths. One strategy to maintain adequate ballistic excitation power at relatively large focal depths has involved the use of nonstandard laser sources based on regenerative amplifiers (5,6). While such a strategy can only go so far in compensating for an exponential loss in ballistic power, it has been the most successful to date in pushing the limits of depth penetration (6). Moreover, it has brought to fore the various other factors limiting depth penetration.
The required increase in excitation power necessary to maintain (or try to maintain) adequate ballistic power at the beam focus can lead to significant power densities near the tissue surface. If the tissue is fluorescent near its surface, as is the case, for example, if the fluorescent labeling is homogeneously distributed throughout the sample, or if the sample is autofluorescent either intrinsically or due to superficial tissue damage, then the power density of the ballistic light near the surface can be so high as to produce out-of-focus background fluorescence that is nonnegligible compared to the in-focus signal fluorescence (7–9). When this background fluorescence begins to dominate signal fluorescence, there is no point in attempting to image deeper in the tissue.
At depths where the scattered light is so strong and the ballistic light so weak that the power density of the ballistic light cannot compete with that of the scattered light near the beam focus, then again there is no point in attempting to image deeper in the tissue. Inasmuch as scattering in biological tissue is very dominantly forward-directed, the scattered light that exhibits the greatest power density is the light that is only slightly deviated from its ballistic path, as can be verified by Monte Carlo simulation (10,11). Light paths that are only slightly deviated are often referred to as snakelike, as opposed to the more severely scattered diffusive paths. Snakelike scattering leads to a blurred halo of background fluorescence surrounding the in-focus signal fluorescence. At shallow depths, this background halo is usually negligible compared to the signal; at larger depths it can become quite problematic.
In this article, we present a robust and simple technique that significantly alleviates Limitations 2 and 3 listed above, namely the limitations arising from out-of-focus background generated either by superficial ballistic excitation or by snakelike scattered excitation. Our technique involves the use of an aberrating element, such as a deformable mirror, in the excitation light path. Although in most applications involving a deformable mirror, the deformable mirror is meant to improve the beam focus by compensating for sample-induced aberrations, in our case it is meant to do just the opposite. We use the deformable mirror to introduce extraneous aberrations in the excitation beam path so as to purposefully degrade the quality of the ballistic light focus, thereby quenching the TPEF signal. As argued in a previous article (12), while the TPEF signal can be severely quenched with extraneous aberrations, the TPEF background generated by superficial ballistic excitation remains relatively unaffected. A simple subtraction of a TPEF image acquired with aberrations (background image) from a TPEF image acquired without aberrations (standard image) then recovers the signal TPEF while rejecting most of this superficial background. We refer to this technique as differential-aberration (DA) imaging.
Our initial demonstration of DA-TPEF was performed using an artificial sample intended to mimic thick tissue, enabling us to confirm the possibility of rejecting superficial TPEF background (12). Our goal in this article is to demonstrate that DA-TPEF microscopy is much more generally applicable. In particular, we perform DA-TPEF imaging with biologically relevant samples such as GFP-labeled sensory neurons in a mouse olfactory bulb, and demonstrate that DA-TPEF is, in fact, also very effective at rejecting TPEF background generated by near-focus scattered excitation.
The organization of this article is as follows: we first review the principles of DA-TPEF microscopy, and experimentally compare the performances of various patterns in terms of their capacity for background rejection and for DA-TPEF imaging in general. Bearing in mind that for DA-TPEF to gain acceptance in the bioimaging community it should provide the same image acquisition rate as a standard TPEF microscope, we further introduce a novel strategy for fast DA-TPEF microscopy based on line-by-line DA subtraction rather than frame-by-frame DA subtraction. We illustrate the feasibility of fast DA-TPEF imaging by monitoring calcium dynamics of pyramidal neurons in a rat hippocampus. Finally, we relegate to the Appendix details concerning the theory underlying the various aberration patterns considered in this article.
Our goal is to demonstrate that DA subtraction provides a simple and robust technique to improve image quality when performing TPEF imaging in thick tissue.
PRINCIPLES OF DA-TPEF MICROSCOPY
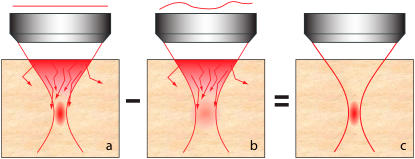
To illustrate the principles of DA-TPEF microscopy, we phenomenologically separate the excitation light into two components, ballistic and scattered. These are, again, respectively defined as the components of the excitation light that have not and have undergone scattering inside a medium (see Fig. 1). As argued above, the power of the ballistic excitation in a scattering medium can be quite high near the medium surface, but decays exponentially as it progresses toward the focal center. The power density of the ballistic excitation can be therefore locally peaked at both the sample surface and at the beam focus (7–9). Defining FS to be the TPEF signal generated by the ballistic excitation beam near its focus; FB to be the superficial background TPEF generated by the ballistic excitation far from focus (i.e., near the medium surface); and FNF to be the near-focus background TPEF generated by scattered excitation (which, as argued above for weakly scattering media, is largely confined to a blurred area around the focal center), then we can express the total TPEF in a sample as
 |
(1) |
The principle of DA-TPEF is as follows. When extraneous aberrations are introduced into the excitation beam path, these preferentially quench the signal TPEF (FS) while leaving the background TPEF (FB + FNF) relatively unaffected. That is, the total TPEF with extraneous aberrations is given by
 |
(2) |
A simple subtraction of Eq. 1 from Eq. 2 then recovers the signal fluorescence
 |
(3) |
as illustrated in Fig. 1.
FIGURE 1.
Principle of DA-TPEF. When focusing a laser beam into thick tissue, the laser power becomes largely depleted by scattering before it attains the beam focus. TPEF background can then arise from out-of-focus ballistic excitation, particularly near the sample surface, or from “snakelike” scattered excitation near the beam focus, both of which can produce background fluorescence that is nonnegligible compared to the in-focus signal fluorescence (a). The introduction of extraneous aberrations in the illumination pupil leads to a spreading of the ballistic excitation profile that is more pronounced near the beam focus than away from the beam focus, thereby preferentially quenching the in-focus TPEF signal while leaving the out-of-focus TPEF background relatively unchanged (b). The subtraction of a TPEF image with extraneous aberrations (configuration b) from an image without extraneous aberrations (configuration a) then leads to enhanced out-of-focus TPEF background rejection (c).
A detailed analysis of the reduction in FS provoked by various extraneous aberrations is presented in the Appendix.
MATERIALS AND METHODS
Sample preparation
All sample preparation protocols were approved by the Boston University Animal Care and Use Committee.
Olfactory-bulb samples were obtained by anesthetizing and decapitating a synapto-pHluorin mouse. The mouse head was immediately submerged into mouse Ringer's solution and the bone on top of the olfactory bulbs was removed to expose the complete dorsal surface of both bulbs. The lower jaw was then removed and the mouse head was glued to an agar dish by its ventral surface, leaving the olfactory bulbs exposed, though still bathed in mouse Ringer's solution.
Brain slice samples were prepared using the established techniques described in the literature (13,14). Young Long-Evans rats (postnatal days 12–20) were anesthetized using isoflurane and decapitated. The brain was removed rapidly and placed in a beaker of ice cold, oxygenated artificial cerebrospinal fluid containing 124 mM NaCl, 5 mM KCl, 1.2 mM KH2PO4, 2.4 mM CaCl2, 2.6 mM MgSO4, 26 mM NaHCO3, and 25 mM D-glucose. The pH was maintained at 7.4 by saturation with 95% O2/5% CO2. The brain was dissected down to a block of tissue containing the region of interest. A Vibratome (TPI, St. Louis, MO) was used to cut slices, 300–500-μm thick, typically in the transverse plane, perpendicular to the septo-temporal axis, for hippocampus. Slices were incubated in an interface chamber at 32°C for at least 1 h before use, and then stained either by incubating for 30 min in 2.5 mL of artificial cerebrospinal fluid + 30 μM sulforhodamine 101 (Invitrogen, Carlsbad, CA), or by identifying a pyramidal cell with graded-field microscopy (15) and then patching this with a 3–6 MΩ glass pipette filled with an internal solution that contained 120 mM K-Gluconate, 10 mM KCl, 10 mM HEPES, 4 mM Mg-ATP, 0.3 mM Tris-GTP, 10 mM Na2-Phosphocreatine, 0.01 mM Calcium Green-1 hexapotassium salt, and 20 U/ml Creatine Kinase. The pipette was connected to the headstage of an amplifier (MultiClamp 700B; Molecular Devices, Sunnyvale, CA) set in “bridge” mode to obtain current-clamp recordings.
EXPERIMENTAL RESULTS
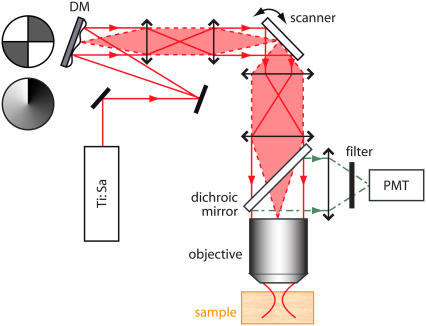
The layout of our DA-TPEF microscope is much the same as a standard TPEF microscope, except that a deformable mirror (μDMS-Multi with a 3.5-mm maximum stroke; Boston Micromachines, Cambridge, MA) has been inserted into the excitation beam path (see Fig. 2). The DM is imaged onto the beam scanner, which is itself imaged onto the objective back aperture. The DM is therefore located in a conjugate plane of the objective back aperture, meaning that height deformations in the DM effectively translate to phase deformations (i.e., aberrations) in the pupil function governing the excitation beam focus (see Appendix for more details).
FIGURE 2.
Experimental layout of a DA-TPEF microscope. A mode-locked Ti:sapphire laser beam is focused into a sample, and the resulting TPEF is epi-collected and routed to a photomultiplier tube (PMT) with a dichroic mirror. The layout of our DA-TPEF is identical to that of a standard TPEF microscope except that a deformable mirror (DM) is inserted in the laser beam path in a conjugate plane to the scanning mirrors and hence to the objective back aperture (i.e., the illumination pupil). As illustrated, two kinds of voltage patterns are applied to the DM, introducing either quadrant or spiral phase aberration profiles in the illumination pupil plane.
The first step in performing DA-TPEF imaging is to acquire a standard TPEF image without the application of DM-induced aberrations. That is, we acquire a TPEF image with all the DM-actuator voltages set to 0 V. The flatness of the DM at zero applied voltage was verified in two ways: First, we characterized our microscope resolution by acquiring images of sub-resolution-sized fluorescent beads. Second, we measured our excitation beam phase profile at the objective back-aperture plane with a Shack-Hartmann wavefront sensor (HASO-128; Imagine Optic, Orsay, France), allowing us to derive a corresponding theoretical microscope point-spread function. Both measurements confirmed that our TPEF microscope resolution was not significantly degraded by the insertion of the DM (with all its actuators set to 0 V) in the excitation beam light path.
The second step in performing DA-TPEF imaging is to acquire a background image. That is, we acquire a TPEF image with a predefined voltage pattern applied to our DM that introduces an extraneous aberration pattern in our illumination pupil function. The resulting background image is essentially devoid of signal TPEF (see Appendix), while the background TPEF remains relatively unaffected. A necessary condition for the background TPEF to remain relatively unaffected is that the same amount of total excitation power must be delivered into the sample with and without DM-induced aberrations. That is, any beam divergence imparted by the extraneous aberrations must not be so large as to provoke vignetting by the illumination aperture. To minimize this possibility of vignetting, we somewhat underfilled our objective back aperture and verified that, for the aberrations used in our study, the power delivered to the sample with and without DM-induced aberrations varied by less than a few percent. We remark that when performing deep TPEF imaging it is standard practice to underfill the objective back aperture in any case (8,16).
As noted in Leray and Mertz (12), there are few constraints on the allowed DM-induced aberration patterns, the main constraints being that they should provoke neither beam defocus nor tilt. We consider here two aberration-pattern types. The first is a quadrant-phase pattern where the excitation beam wavefront at the objective back aperture is divided into four quadrants, two of which are phase-shifted by π, as shown in Fig. 2. This pattern was used in our previous report (12). The second type of pattern is a spiral-phase pattern, where the phase-shift imparted on the beam varies angularly from 0 to 2mπ, m being a small integer. Both types of patterns exhibit advantages and disadvantages. The advantage of the quadrant-phase pattern is mostly technical in that it readily allows fast DA-TPEF imaging (see next section). The advantage of the spiral-phase pattern is more fundamental, as is discussed in the Appendix and ultimately revealed by experiment.
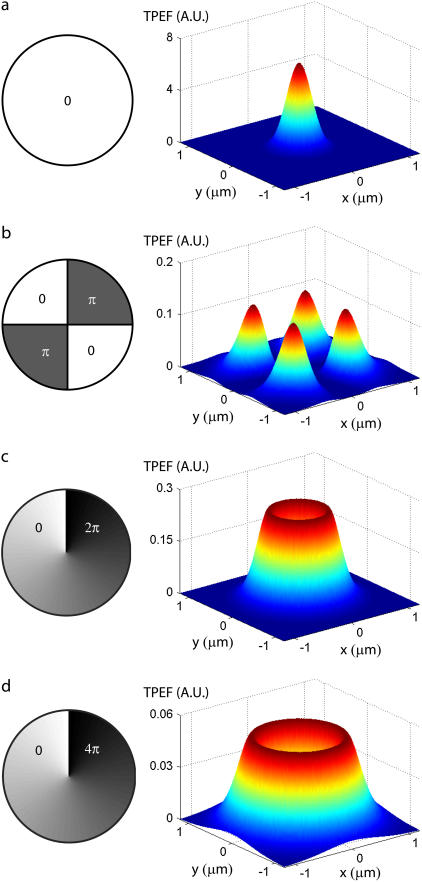
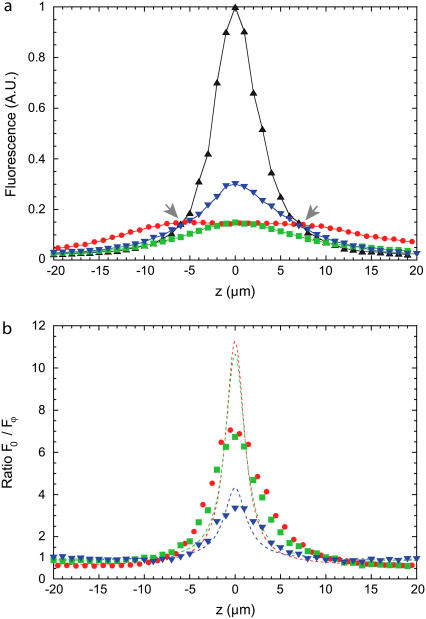
Theoretical profiles of the ballistic-excitation TPEF at the focal plane for different DM-induced aberration patterns are illustrated in Fig. 3. The quadrant-phase pattern splits the unaberrated (i.e., diffraction-limited) TPEF peak into four subpeaks, while the spiral-phase pattern spreads the TPEF into a ring pattern whose width spreads and whose height decreases with increasing m. Each of the patterns leads to a TPEF null exactly at the focal center. We draw attention to the TPEF scales in each panel of Fig. 3. While the aberrations provoke a spread in the lateral areas of the TPEF profiles, they also provoke a significant quenching of the total TPEF power generated at the focal plane, as can be experimentally verified by measuring the total (integrated) TPEF power generated by a thin uniform fluorescent slab as a function of slab defocus (Fig. 4). In the absence of DM-induced aberrations, the TPEF power is peaked when the slab is in focus, and decays as the slab is displaced from focus (the width of this peak is somewhat broadened owing to the nonzero slab thickness). When extraneous aberrations are introduced, the in-focus TPEF peak is severely quenched, as predicted.
FIGURE 3.
DM-induced aberration profiles in the pupil plane (left) and corresponding theoretical three-dimensional TPEF intensity distributions in the focal plane  (right). Cases are shown with (a) no aberrations, (b) quadrant-phase aberrations of stroke π, (c) spiral-phase aberrations of pitch 2π, and (d) spiral-phase aberrations of pitch 4π. The mean laser wavelength is taken to be 800 nm and the unaberrated illumination field profile at the focal plane is taken to be a Gaussian of waist w0 = 500 nm. See the Appendix for derivation of TPEF intensity distributions.
FIGURE 4.
(a) TPEF detected from a thin uniform fluorescent slab (≈6-μm-thick fluorescein solution sandwiched between two coverslips) as a function of slab defocus. Measurements were obtained with no beam scanning and an Olympus 20 × NA = 0.95 water-immersion objective. The TPEF profile in the absence of DM-induced aberrations (F0(z)) is depicted by black triangles. The TPEF profiles with DM-induced aberrations (Fφ(z)) are plotted in red, blue, and green. Three aberrations are considered: a quadrant-phase pattern (red circles), a spiral-phase pattern with a phase shift varying angularly from 0 to 2π (blue triangles), and from 0 to 4π (green squares). (b) The corresponding ratios F0(z)/Fφ(z) as a function of slab defocus. Theoretical evaluations of F0(z)/Fφ(z) for an infinitely thin fluorescent plane are represented with dashed traces (see Appendix).
We note here some fundamental differences in the different aberration profiles. While the quadrant-phase profile is the most effective at quenching in-focus TPEF, it actually somewhat enhances TPEF out of focus. A subtraction of the aberrated from the nonaberrated TPEF profiles then leads to negative values out of focus, meaning that DA-TPEF somewhat overcorrects its background subtraction. While this overcorrection is small, it subsists over a fairly large defocus range, typically extending several tens of microns. In practice, negative values in the final DA-TPEF image are set to zero for display; however, they can have the undesirable effect of erasing very weak in-focus signal TPEF.
This problem of background overcorrection is largely absent when using spiral-phase aberrations, where we observe from Fig. 4 that the aberrated TPEF profiles converge much more rapidly to the nonaberrated TPEF profile without overcorrecting. We note that the defocus values where the aberrated and nonaberrated TPEF profiles converge (indicated by arrows in Fig. 4) provide a convenient indicator for the boundary between in-focus and out-of-focus TPEF. TPEF generated outside these boundaries is rejected upon DA subtraction and is therefore interpreted as out-of-focus background by our technique. Moreover, we observe that the 2π spiral phase aberration rejects TPEF closer to the focus than does the 4π spiral phase aberration, suggesting that it provides tighter background rejection. To its disadvantage, however, the 2π spiral phase aberration does not quench the in-focus TPEF as effectively as the 4π spiral phase aberration, meaning that it leads to a reduced net signal in the final DA-TPEF image, which in turn can lead to a somewhat decreased signal/noise ratio when the TPEF signal is weak. In practice, the choice of which spiral pitch is the most effective for DA-TPEF imaging largely depends on the sample of interest.
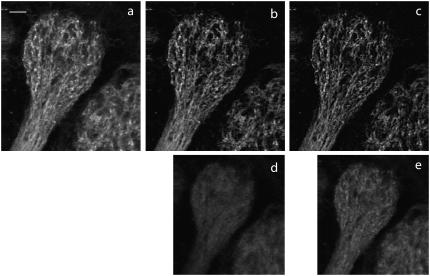
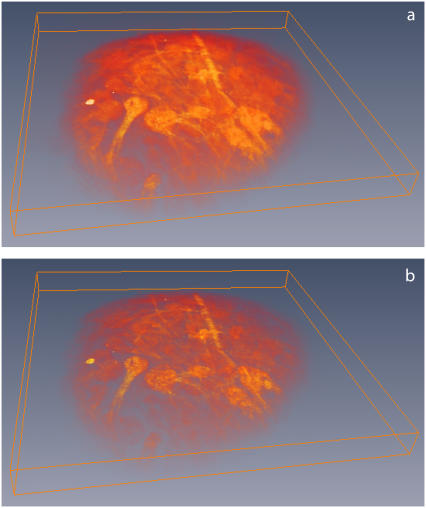
We demonstrate the application of quadrant versus spiral-phase DA-TPEF by imaging synapto-pHluorin, a pH-sensitive GFP, targeted to presynaptic terminals of sensory neurons in an excised mouse olfactory bulb (17). The sample was prepared according to the protocol outlined in Materials and Methods. The laser source was a 5W pumped mode-locked Ti:sapphire laser (Tsunami; Spectra-Physics Mountain View, CA) operating at λ ≈ 800 nm, delivering a total power into the sample of ∼20 mW. The olfactory bulb was imaged both by standard TPEF and DA-TPEF microscopy, using a 20× water immersion objective (NA = 0.95; Olympus, Tokyo, Japan). The background rejection occasioned by DA-TPEF is apparent in both two-dimensional images (Fig. 5) and three-dimensional reconstructions of an olfactory bulb (Fig. 6). A careful examination of Fig. 5 reveals that the out-of-focus TPEF rejection somewhat depends on the particular aberration pattern applied to the DM. As anticipated both from theory (see Appendix) and sectioning experiments (Fig. 4), the background registered by our 2π spiral-phase aberration is closer to the in-focus plane than the background registered by our quadrant aberration profile beam, as demonstrated by the greater background level in Fig. 5 e than in Fig. 5 d. As a result, the spiral-phase aberration provides tighter out-of-focus background rejection, leading to the crisper apparent resolution in Fig. 5 c as compared to Fig. 5 b.
FIGURE 5.
Demonstration of DA-TPEF background rejection. A synapto-pHluorin-labeled glomerulus in an excised mouse olfactory bulb was imaged with standard TPEF microscopy (a) and with DA-TPEF microscopy using π-quadrant phase aberrations (b) or 2π spiral phase aberrations (c). The corresponding background images are shown in panels d and e, respectively. The scale bar is 20 μm. All images were acquired with an Olympus 20 × NA = 0.95 water immersion objective and are represented in grayscale with a γ-factor set to 0.7. Two-photon excitation was performed at 800 nm.
FIGURE 6.
A volumetric reconstruction based on an 50-image stack of an excised mouse olfactory bulb (same sample as in Fig. 3) acquired with standard TPEF microscopy (a) and with 2π spiral phase DA-TPEF microscopy (b). Raw images were acquired every 2 μm to a depth of 150 μm. Lateral field of view is ∼1.3 × 1.3 mm2 (Olympus 20 × NA = 0.95 water immersion objective). The laser wavelength was 800 nm and the power delivered to the sample was ∼20 mW. Volumetric reconstruction was performed with Amira software (ZIB, Berlin, Germany).
Finally, Fig. 5, d and e, reveal that much of what is interpreted as background in our glomerulus images contains structure and therefore corresponds more to near-focus background FNF than to far out-of-focus background FB (the latter would be much more uniformly distributed) Our results therefore differ from those presented in Leray and Mertz (12), which demonstrated only that DA-TPEF can reject far out-of-focus background, and illustrate the broader utility of DA-TPEF for rejecting TPEF background in general.
Fast DA-TPEF microscopy
A drawback of DA-TPEF as we have described it so far is that two images, an unaberrated and an aberrated image, are required to obtain a final DA-TPEF image. As such, the overall image acquisition rate of a DA-TPEF microscope is twice as slow as that of a standard TPEF microscope. Such a reduction in image acquisition rate may not be suitable when imaging fluorescence dynamics. To mitigate this problem of slower acquisition rate, we modified our DA-TPEF hardware to benefit from the dead time occasioned with standard TPEF microscope imaging. In particular, raster scans in standard TPEF microscopes are usually one-sided. That is, fluorescence signal is usually recorded as the laser scans along one direction, and is discarded (or the laser beam is blanked) during scan flybacks. We benefit from this flyback time, which is normally dead time, by introducing DM aberrations and acquiring our (inverted) background image during scan flybacks, thereby performing DA-TPEF line-by-line rather than frame-by-frame. A necessary condition for the implementation of such a strategy is that the switching time between nonaberrated and aberrated pupil profiles must be much shorter than the line-scan duration which, for standard galvanometric scanning, is typically ∼1 ms (meaning that the switching rates must be much faster than 1 kHz). Herein lies an enormous advantage of using DMs to produce pupil aberrations, since these can, in principle, readily attain such switching rates. For technical reasons, however, the drive software of our DM did not permit fast switching rates, and we adopted instead a hardware solution where the DM actuators were individually addressed with a bimodal voltage. Such a hardware solution was used to bypass our drive software and produce quadrant phase profiles at switching rates of ∼10 kHz.
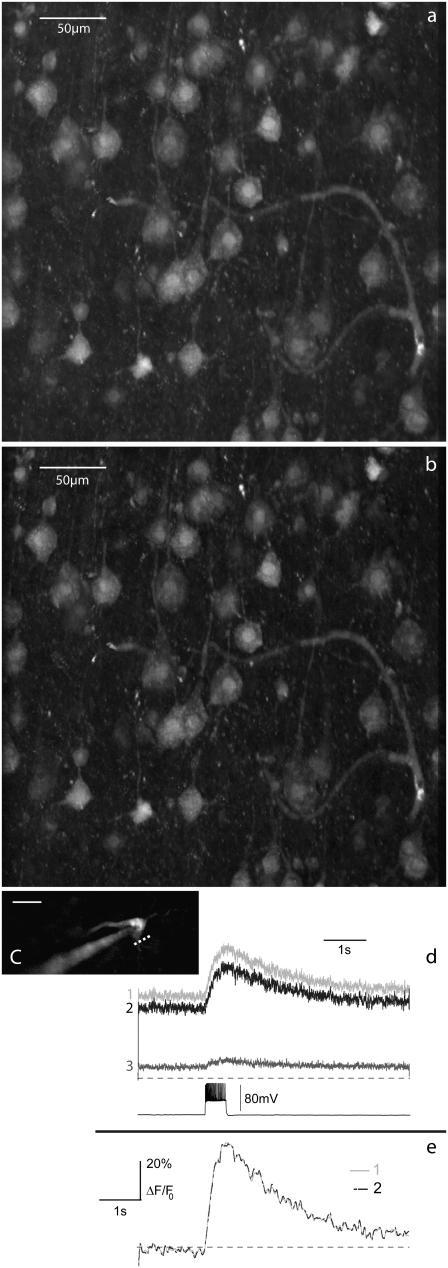
To demonstrate our ability to perform fast DA switching, we imaged a rat medial entorhinal cortex stained with sulforhodamine 101 with both standard TPEF (Fig. 7 a) and line-by-line DA-TPEF (Fig. 7 b). The penetration depth for these images was no more than ∼60 μm, and so very little background TPEF was expected, as is manifest from the only slight difference between the two images. The main purpose of Fig. 7, a and b, is to illustrate the fast response time of DA-TPEF. The forward line-scan time for these images was 7.3 ms, and edges of the images have not been clipped, revealing that the switching time between nonaberrated and aberrated pupil profiles is so fast as to be essentially unobservable. Fig. 7, a and b, are derived, in fact, from the same data, where Fig. 7 a is extracted from one-sided scan data only. DA-TPEF was performed therefore in the background, and did not affect the ordinary operation of our microscope in any way.
FIGURE 7.
Standard TPEF image (a) and 3π quadrant-phase DA-TPEF image (b) of a section of a medial entorhinal cortex stained with sulforhodamine 101, revealing astrocytes as well as neurons. Images are maximum intensity z-stack projections over 30-μm depth with steps of 2 μm. The DM-induced aberrations were applied during scan flybacks, and DA subtraction was performed line by line. The improvement in signal/background ratio in the DA-TPEF image is slight (as expected) but noticeable. (c) A CA1 pyramidal neuron was patch-clamped and labeled with Calcium Green 1, and calcium imaging was performed by repeatedly scanning a single line (white dashed line in c) at 1-ms intervals. Fluorescence traces in panel d are low-pass filtered at 20 Hz. Normalized ΔF/F0 traces are overlaid in panel e, facilitating a comparison of measurements obtained with standard TPEF (trace 1) and with DA-TPEF (trace 2), where trace 3 corresponds to the background fluorescence obtained with aberrations. The laser wavelength was 810 nm and the power delivered to the sample was ∼4 mW. Images a and b are shown with a γ-factor set to 0.8.
To further demonstrate that DA-TPEF does not compromise our temporal resolution, we patch-clamped a CA1 pyramidal cell, which we labeled with Calcium Green-1 (Fig. 7 c). Cell depolarization was elicited by a 500 ms, 350 pA current pulse, leading to the calcium influx that was recorded by both standard TPEF and line-by-line DA-TPEF (Fig. 7, d and e). As expected, the fluorescence dynamics recorded with standard TPEF line scans (trace 1) and with DA-TPEF line scans (trace 2) are essentially identical, with no apparent temporal lag. As in the imaging case above, the data for the TPEF and DA-TPEF line scans was acquired simultaneously and the operation of DA-TPEF was completely transparent to the user.
DISCUSSION
To provide a better understanding of the potential utility of DA-TPEF microscopy, we first clarify what DA-TPEF is and what it is not.
To begin, we emphasize that DA-TPEF provides images that are fundamentally different from those obtainable by simple image processing of standard TPEF images. For example, on glancing at Fig. 5 or 6, one might infer that our final DA-TPEF image is roughly equivalent to a simple high-pass filtering of the original standard TPEF image (Figs. 5 a or 6 a), but this is not the case. High-pass filtering of a standard TPEF image would erase any low-frequency components in the image, whereas DA-TPEF does not. This is made clear from our results presented in Fig. 4. Even though the sample is laterally homogeneous in this case (i.e., its lateral spatial frequency is equal to zero), DA-TPEF continues to reveal strong signal when the sample is in focus.
Moreover, one might imagine an alternative background-subtraction strategy that consists in simply alternating between two different illumination numerical apertures, the higher NA generating the uncorrected TPEF image, and the lower NA generating the background image. Such a differential-NA strategy is nowhere near as effective as the differential aberration strategies presented here because of the fundamental increase in out-of-focus TPEF provoked by low-NA illumination. As an example, it is well known that the total TPEF produced by a Gaussian beam focused into an infinite homogeneously labeled sample is, in fact, independent of the beam NA (i.e., the beam waist). The application of a differential-NA strategy in a homogeneously labeled thick sample then fails completely. In contrast, the application of a differential-aberration strategy, using the aberration patterns presented here, is much more effective at preserving signal from a homogeneously labeled sample (see Appendix).
Yet again, one might imagine that an alternative and even simpler technique to reject out-of-focus background might be to use a detection pinhole, as is the principle of confocal microscopy. We emphasize that such a pinhole would defeat one of the main advantages of TPEF microscopy, since it would require geometrical imaging of the in-focus TPEF signal. Inasmuch as the TPEF generated from the excitation focus undergoes scattering as it emerges from the sample, which is all the more severe the greater the focal depth, pinhole detection would ultimately reject not only TPEF background but also TPEF signal, and hence would be of no avail. A significant advantage of DA-TPEF is that, because it involves no pinhole, the collection efficiency of TPEF signal remains high.
However, DA-TPEF microscopy also exhibits disadvantages. Our differential-aberration technique is based on the subtraction of a background image from an image that contains both background and signal. Inasmuch as the images are acquired independently, the shot-noise associated with these images is also independent. Hence, while DA-TPEF is effective at rejecting background, it is not effective at rejecting the shot-noise associated with this background. As a rule of thumb, therefore, DA-TPEF is useful only if the shot-noise associated with the background is smaller than both the average background level and also the average signal level. The first condition is met when the average background is large enough to produce at least one detected photoelectron per detector integration time. The second condition is met when the signal has not been overly degraded by loss of ballistic excitation due to scattering. That is, DA-TPEF ultimately fails when the imaging depth is too great. Nevertheless, there exists a wide range of experimental situations where both conditions are easily met, and where DA-TPEF is indeed effective at improving signal/background ratio, as demonstrated by our experimental results.
CONCLUSION
We have demonstrated that a TPEF background image can be readily obtained by the introduction of extraneous aberrations in the illumination pupil, and that this background image can subsequently be subtracted from a standard TPEF image, yielding a corrected image with enhanced signal/background ratio. We have further demonstrated that when a fast-switching DM is used to induce the extraneous aberrations, the temporal resolution of a DA-TPEF microscope remains essentially unchanged from that of a standard TPEF microscope.
We emphasize that while DA-TPEF can reject background, it cannot increase signal. If the signal is too weak, then another strategy must be found to complement DA-TPEF and facilitate the extraction of signal from background. One such strategy, for example, involves counteracting the loss of ballistic excitation to scattering by introducing adaptive wavefront correction. Such wavefront correction has the dual benefit of both increasing signal and suppressing background (as opposed to simply rejecting it). However, adaptive wavefront correction remains a difficult problem, and in general requires a sophisticated multiparameter feedback control of the illumination wavefront. Nevertheless, various strategies have been used to successfully tackle this problem (18–21). We note that DA-TPEF is entirely compatible with adaptive wavefront correction in that the same DM used to introduce extraneous aberrations can also be used to correct the illumination wavefront.
The main advantages of DA-TPEF, at least in the implementations we have presented here, are in its extreme simplicity and robustness. Basically, DA-TPEF can be combined with any TPEF microscope by simple insertion of a switchable aberrating element into the illumination beam path, provided this element is imaged onto the illumination pupil (e.g., with the addition of a pair of lenses, as shown in Fig. 2). Moreover, DA-TPEF can be operated in a simple open-loop configuration, requiring no feedback whatsoever, and no special care concerning the accuracy of the extraneous aberrations patterns. Because of its simplicity and ease of use, DA-TPEF should be of general utility in improving deep-tissue TPEF imaging.
Acknowledgments
We are extremely grateful to Boston Micromachines Corporation for the loan of a deformable mirror and for their continuing support. We thank Matt Wachowiak and John White for supplying us samples.
This work was partially funded by National Institutes of Health grant No. R21 EB005736.
APPENDIX
DA-TPEF theory
We derive here analytic expressions for the ballistic illumination power density in a scattering sample as a function of various aberration patterns introduced in the illumination pupil. A knowledge of this power density allows us to derive both the TPEF signal and the TPEF background generated by out-of-focus ballistic illumination near the sample surface, and to quantify how these are altered by the application of extraneous aberrations. Our aim here is to characterize the relative performances of the various aberration patterns described in this article.
In the paraxial approximation, the ballistic component of a light beam focused to a depth zd into a scattering sample has an intensity that scales according to Beer-Lambert's law as
 |
(4) |
where  and z are coordinates relative to the beam focus (i.e., the surface of the sample is located at negative z), and μs is the scattering coefficient of the medium. PSF
 is the ballistic point-spread function, corresponding to the beam intensity profile if the medium were nonscattering. We normalize this such that
  independently of z. That is, we write
 |
(5) |
where CSF  is the ballistic coherent spread function, corresponding to the beam field profile if the beam were on scattering. In the paraxial approximation, we have (22,23)
 |
(6) |
where k = 2π/λ (λ being the laser wavelength in the sample medium), and we have introduced the pupil function  whose Fourier coordinates
  are located in the objective back-focal plane (i.e., back aperture).
When extraneous aberrations are introduced into the objective back aperture, the pupil function becomes
 |
(7) |
where  is the unaberrated pupil function and
  is the phase profile of the applied extraneous aberrations. Equations 4–7 provide a general recipe for deriving the ballistic intensity distribution in a scattering sample as a function of these extraneous aberrations.
To begin, we consider an unaberrated pupil (i.e.,  ). For a Gaussian illumination beam, we have
 |
(8) |
where  w0 is the beam waist at the focus, and
  is the corresponding Rayleigh range.
When extraneous aberrations are applied to the pupil, then this ballistic point spread function becomes altered. We consider both quadrant-phase and spiral-phase aberration patterns.
Our quadrant-phase pattern is defined by
 |
(9) |
When Eq. 9 is inserted into Eq. 5, a straightforward calculation leads to
 |
(10) |
Similarly, our spiral-phase aberration pattern is defined by
 |
(11) |
where (k⊥, θk) is the polar coordinate representation of  and m is a small integer.
For example, if m = 1 (i.e., the spiral phase pitch is 2π), then an insertion of Eq. 11 into Eq. 5 leads to
 |
(12) |
where In is the modified Bessel function of the first kind.
If instead m = 2 (i.e., the spiral-phase pitch is 4π) then a similar calculation leads to
 |
(13) |
The above equations provide starting points from which we can calculate the TPEF generated by ballistic illumination without and with extraneous aberrations. We recall that a defining characteristic of local TPEF power is that it scales quadratically with the local excitation intensity. Considering only the ballistic component of this excitation, we have then
 |
(14) |
where  is the local TPEF power. Plots of
  are illustrated in Fig. 3 for unaberrated and aberrated illumination pupils. As expected, the TPEF distribution is highly localized when the pupil is unaberrated, whereas it becomes delocalized when the pupil is aberrated.
We turn now to imaging in a thick tissue. For purposes of discussion we henceforth assume that the fluorescence labeling inside the tissue is homogeneously distributed. Such a distribution is generally not the case in practice, since individual cells or cell populations of interest are usually labeled specifically; however, this distribution serves as a basis of reference, and can generally be thought of as a worst-case scenario when trying to perform three-dimensional fluorescence imaging.
To compare TPEF generated in and out of focus, we denote as Fz the net TPEF fluorescence generated by ballistic excitation at any given depth in the sample. That is, we write
 |
(15) |
Because TPEF scales quadratically with excitation, the delocalization of  depicted in Fig. 3 is necessarily accompanied by a net suppression of Fz=0 at the focal plane (12). That is, the TPEF signal becomes effectively removed upon application of the extraneous aberrations. In contrast, the out-of-focus TPEF background (i.e., Fz ≠ 0) remains relatively unaffected upon application of the extraneous aberrations (see Fig. 8). This is the principle of DA-TPEF microscopy.
FIGURE 8.
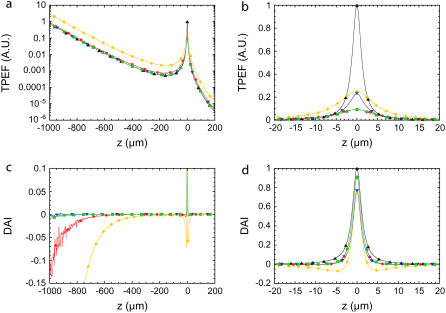
(a) Theoretical semilogarithmic traces of the ballistic-excitation-induced TPEF obtained from a uniform transverse fluorescent plane in a scattering medium, as a function of plane defocus. The scattering medium mean free path is defined by ls ≈ 150 μm. Traces derived for unaberrated Gaussian beam focal waists w0 = 500 nm and w0 = 1000 nm (low NA) are represented by black triangles and yellow diamonds respectively. Traces derived when excitation beam is aberrated with a π-quadrant-phase pattern (red circles), a 2π spiral-phase pattern (blue triangles), and a 4π spiral-phase pattern (green squares). (b) Same curves in linear scale to emphasize the aberration-induced TPEF reduction near the focal plane (z = 0). (c) Corresponding DA-TPEF profiles obtained for unaberrated focal waist w0 = 500 nm (same labels as in a). (d) To illustrate that the in-focus DA-TPEF signal is relatively unchanged compared to a standard TPEF signal, traces are plotted about the focal plane. Note: These theoretical derivations take only ballistic excitation into account.
For comparison, we have also included in our analysis a plot of Fz for the case of a differential-NA strategy discussed in the text (for a Gaussian beam, a reduction in NA is equivalent to an increase in the beam-focus waist w0 while maintaining a fixed total illumination power). Whereas a reduction in NA indeed suppresses Fz=0, it leads to an inevitable increase in Fz ≠ 0 that subsists throughout the entire sample volume, thereby severely undermining the effectiveness of a differential-NA strategy (see Fig. 3). We note that our differential-aberration strategy with a quadrant-phase pattern also leads to an increase in Fz ≠ 0; however, this increase is quite small and slowly decays away from focus. This small increase has the effect of leading to a slight negativity in ΔFz ≠ 0 just above and below the focal plane, but also to a negativity in ΔFz ≠ 0 at very large defocus values in a scattering medium (owing to the slowness of the decay). As such, the effectiveness of DA-TPEF with a quadrant-phase pattern might be compromised at ultra-deep imaging depths. Notwithstanding, we remind the reader that we are considering here a sample that has been homogeneously labeled throughout its entire volume, which, again, can generally be regarded as a worst-case scenario. We further note that the negativities described above are essentially absent when using a spiral-phase pattern.
In comparing panels a and c of Fig. 8, it is apparent that DA-TPEF is quite effective at rejecting out-of-focus TPEF background generated by ballistic excitation in a scattering tissue. We have not considered in this Appendix the rejection of near-focus TPEF background, which is a more difficult problem to analyze theoretically, and will be treated in a future report.
Editor: Enrico Gratton.
References
- 1.Denk, W., J. H. Strickler, and W. W. Webb. 1990. Two-photon laser scanning fluorescence microscopy. Science. 248:73–76. [DOI] [PubMed] [Google Scholar]
- 2.Zipfel, W. R., R. M. Williams, and W. W. Webb. 2003. Nonlinear magic: multiphoton microscopy in the biosciences. Nat. Biotechnol. 21:1369–1377. [DOI] [PubMed] [Google Scholar]
- 3.Helmchen, F., and W. Denk. 2005. Deep tissue two-photon microscopy. Nature Meth. 2:932–940. [DOI] [PubMed] [Google Scholar]
- 4.Svoboda, K. 2006. Principles of two-photon excitation microscopy and its applications to neuroscience. Neuron. 50:823–839. [DOI] [PubMed] [Google Scholar]
- 5.Beaurepaire, E., M. Oheim, and J. Mertz. 2001. Ultra-deep two-photon fluorescence excitation in turbid media. Opt. Commun. 188:25–29. [Google Scholar]
- 6.Theer, P., M. T. Hasan, and W. Denk. 2003. Two-photon imaging to a depth of 1000 mm in living brains by use of a Ti:Al2O3 regenerative amplifier. Opt. Lett. 28:1022–1024. [DOI] [PubMed] [Google Scholar]
- 7.Ying, J., F. Liu, and R. R. Alfano. 1999. Spatial distribution of two-photon-excited fluorescence in scattering media. Appl. Opt. 38:224–229. [DOI] [PubMed] [Google Scholar]
- 8.Theer, P., and W. Denk. 2006. On the fundamental imaging-depth limit in two-photon microscopy. J. Opt. Soc. Am. A. 23:3139–3149. [DOI] [PubMed] [Google Scholar]
- 9.Leray, A., C. Odin, E. Huguet, F. Amblard, and Y. Le Grand. 2007. Spatially distributed two-photon excitation fluorescence in scattering media: experiments and time-resolved Monte Carlo simulations. Opt. Commun. 272:269–278. [Google Scholar]
- 10.Blanca, C. M., and C. Saloma. 1999. Monte Carlo analysis of two-photon fluorescence imaging through a scattering medium. Appl. Opt. 38:5433–5437. [DOI] [PubMed] [Google Scholar]
- 11.Sergeeva, E. A., M. Y. Kirillin, and A. V. Priezzhev. 2006. Propagation of a femtosecond pulse in a scattering medium: theoretical analysis and numerical simulation. Quantum Electron. 36:1023–1031. [Google Scholar]
- 12.Leray, A., and J. Mertz. 2006. Rejection of two-photon fluorescence background in thick tissue by differential aberration imaging. Opt. Express. 14:10565–10573. [DOI] [PubMed] [Google Scholar]
- 13.Haas, J. S., and J. A. White. 2002. Frequency selectivity of layer II stellate cells in the medial entorhinal cortex. J. Neurophysiol. 88:2422–2429. [DOI] [PubMed] [Google Scholar]
- 14.Netoff, T. I., C. D. Acker, J. C. Bettencourt, and J. A. White. 2005. Beyond two-cell networks: experimental measurement of neuronal responses to multiple synaptic inputs. J. Comput. Neurosci. 18:287–295. [DOI] [PubMed] [Google Scholar]
- 15.Yi, R., K. K. Chu, and J. Mertz. 2006. Graded-field microscopy with white light. Opt. Express. 14:5191–5200. [DOI] [PubMed] [Google Scholar]
- 16.Oheim, M., E. Beaurepaire, E. Chaigneau, J. Mertz, and S. Charpak. 2001. Two-photon microscopy in brain tissue: parameters influencing imaging depth. J. Neurosci. Methodol. 111:29–37. [DOI] [PubMed] [Google Scholar]
- 17.McGann, J. P., N. Pírez, M. A. Gainey, C. Muratore, A. S. Elias, and M. Wachowiak. 2005. Odorant representations are modulated by intra- but not interglomerular presynaptic inhibition of olfactory sensory neurons. Neuron. 48:1039–1053. [DOI] [PubMed] [Google Scholar]
- 18.Neil, M. A. A., R. Juskaitis, M. J. Booth, T. Wilson, T. Tanaka, and S. Kawata. 2000. Adaptive aberration correction in a two-photon microscope. J. Microsc. 200:105–108. [DOI] [PubMed] [Google Scholar]
- 19.Wright, A. J., D. Burns, B. A. Patterson, S. P. Poland, G. J. Valentine, and J. M. Girkin. 2005. Optimization algorithms for the implementation of adaptive optics in confocal and multiphoton microscopy. Microsc. Res. Tech. 67:36–44. [DOI] [PubMed] [Google Scholar]
- 20.Schwertner, M., M. J. Booth, T. Tanaka, T. Wilson, and S. Kawata. 2006. Adaptive aberration correction in a two-photon microscope. Opt. Commun. 263:147–151. [DOI] [PubMed] [Google Scholar]
- 21.Rueckel, M., J. A. Mack-Bucher, and W. Denk. 2006. Adaptive wavefront correction in two-photon microscopy using coherence-gated wavefront sensing. Proc. Natl. Acad. Sci. USA. 103:17137–17142. [DOI] [PMC free article] [PubMed] [Google Scholar]
- 22.Born, M., and E. Wolf. 1999. Principles of Optics. Cambridge University Press, Cambridge, UK.
- 23.Goodman, J. W. 2005. Introduction to Fourier Optics. Roberts & Company, Greenwood Village, CO.


