

Abstract
Activation of the transcription factor signal transducer and activator of transcription (STAT)5 is involved in various aspects of hematopoiesis, affecting cell proliferation, differentiation, and cell survival. Constitutive activation of STAT5 has also been associated with leukemic transformation. We overexpressed the constitutively active mutant STAT5A(1*6) in human cord blood CD34+ cells and evaluated the effects on the hematopoietic potential of stem cells in a variety of in vitro and in vivo systems. The observed phenotypic changes were correlated with differential gene expression patterns induced by STAT5A(1*6). Our data indicate that a persistent activation of STAT5A in human hematopoietic stem and progenitor cells results in their enhanced self-renewal and diverts differentiation to the erythroid lineage.
Keywords: STAT5A(1*6), leukemia, erythropoiesis, hematopoiesis, CD34
Introduction
Hematopoiesis is initiated by a relatively small number of multipotent self-renewing hematopoietic stem cells (HSCs) that generate large numbers of differentiated progeny by a process of amplification and progressive lineage restriction. The process of hematopoietic differentiation involves the generation of multilineage progenitors that are restricted to either the myeloid or lymphoid lineages (the common myeloid progenitor [1] and the common lymphoid progenitor [2]), and further differentiation of these pluripotent cells generates mature erythroid, megakaryocytic, myeloid, or lymphoid cells (3).
HSC self-renewal and hematopoietic differentiation are tightly controlled by multiple positive and negative regulatory elements, but mechanisms modulating the balance between self-renewal and entrance into a differentiation program are poorly understood. By loss of function (gene targeting) or gain of function (ectopic expression) experiments, a number of transcription factors have been suggested to be involved in HSC self-renewal, including HOXB4 (4), NOTCH1 (5), and BMI1 (6, 7). Ectopic expression of HOXB4 in murine bone marrow resulted in a rapid expansion of the HSC pool, which retained full lymphomyeloid regenerative potential (4). Similar results have been described in human CD34+ cells isolated from cord blood (CB), although high expression levels of HOXB4 resulted in a profound in vivo competitive growth advantage of HSCs, but an impairment of lymphomyeloid differentiation (8). Overexpression of NOTCH1 in mouse bone marrow resulted in enhanced stem cell self-renewal and a decreased differentiation with a preferential lymphoid over myeloid commitment when differentiation did occur (5). More recently, bmi1 −/− knockout mice, which have a normal number of HSCs in the fetal liver, were generated, but postnatal bmi1 −/− mice have reduced numbers of HSCs in the marrow, which contribute only transiently to hematopoiesis upon transplantation (6, 7). The WNT3A/β-catenin (9) and sonic hedgehog (10) pathways have also been shown to promote murine HSC self-renewal and oligoclonal lymphomyeloid differentiation potential in vivo.
Upon lineage commitment, HSCs generate progeny that initiate increased expression of lineage-specific genes with the coordinate silencing of genes that are not required. For example, the common myeloid progenitor will express myeloid-specific genes (e.g., myeloperoxidase, G-CSFR, cathepsin G, and C/EBPα), the megakaryocytic/erythroid progenitor will express genes such as β-globin, GATA1, and EPOR, and the common lymphoid progenitor will express lymphoid-specific genes (e.g., PAX5 and λ5; references 1 and 2). However, molecular mechanisms underlying these decision checkpoints are still poorly understood. It is believed that a subtle balance exists between the expression of genes involved in differentiation, genes that are cell cycle related, and pro-/antiapoptotic genes, to ensure appropriate expansion, survival, and differentiation.
A variety of cytokines and growth factors have been identified that perform crucial roles in checkpoint decisions during hematopoiesis. Many of these involve the activation of STAT transcription factors. Seven mammalian STAT family members have been identified thus far, STAT1–6, with two different genes encoding for STAT5A and STAT5B (11, 12). Signal transduction pathways involved in STAT activation have been studied in great detail, but typically involve JAK-mediated phosphorylation of tyrosine residues in the SH2 domain of STATs, enabling STAT dimerization, nuclear translocation, and binding to response elements in promoters of target genes (11, 12). STAT5 is activated in response to various hematopoietic cytokines, including IL-2, IL-3, IL-5, IL-7, GM-CSF, erythropoietin (EPO), and CSF-1 (13). Activation of STAT5 has been shown to be required during terminal stages of myeloid differentiation (14), eosinophil differentiation of human CB-derived CD34+ cells (15), as well as in early B cells where it up-regulates PAX5 expression in response to IL-7 (16). In particular, STAT5 has been implicated in erythropoiesis in response to EPO and early erythroblast survival by up-regulating BCL-XL (17, 18). Stat5a −/− 5b −/− knockout mice are characterized by fetal anemia and increased apoptosis of fetal liver erythroid progenitors, although adult steady-state hematopoiesis was reported to be normal (17, 18). Consistent with these observations, STAT5 has an antiapoptotic effect in erythroid cell lines and overexpression of dominant negative STAT5 results in increased apoptosis and growth inhibition of cultured fetal liver erythroid progenitors (17, 19).
Besides the various functions that STAT5 fulfills in normal hematopoiesis, a constitutive activation of STAT5 has been observed in a variety of hematological and nonhematological malignancies (20). STAT5 is constitutively activated in the majority of acute myeloid leukemias (21–24) and chronic myeloid leukemia (CML; references 25 and 26). A number of chromosomal aberrations, including Flt-3-ITDs (21), Bcr/Abl (25, 26), and Tel/Jak2 (27) induce constitutive activation of STAT5, and particularly in the case of Tel/Jak2, it has been demonstrated that STAT5 is necessary for Tel/Jak2-induced myeloproliferative disease (27). Furthermore, the constitutively active mutant STAT5(1*6) is capable of transforming hematopoietic cell lines to growth factor independence in vitro (28, 29). These data suggest that constitutive activation of STAT5 can play a causal role in leukemic transformation (30).
Because no data were available on the effects of a persistent activation of STAT5 in human HSCs, we introduced the STAT5A(1*6) mutant into human stem and progenitor cells derived from umbilical CB. Here we report that a persistent activation of STAT5A in human CD34+ cells results in enhanced self-renewal. STAT5A drives the expression of a number of proto-oncogenes and cytokines in human CD34+ cells, as well as a number of erythroid-specific genes, favoring erythroid over myeloid differentiation and providing a long-term proliferative advantage for erythroid progenitors.
Materials and Methods
Cell Culture and Cell Lines.
Neonatal CB was obtained from healthy full-term pregnancies from the Cord Blood Bank of the New York Blood Center. CD34+ cells (>95% pure) were derived from CB using MiniMACS (Miltenyi Biotec) as described previously (31). Vesicular stomatitis virus–pseudotyped H29 cells were cultured in DME (GIBCO BRL) supplemented with 10% FBS (HyClone Laboratories), penicillin and streptomycin, 200 mM glutamine, 2 μg/ml tetracyclin, 300 μg/ml geneticin, and 2 μg/ml puromycin (all obtained from GIBCO BRL). Gibbon ape leukemia virus–pseudotyped PG13 fibroblasts were grown in DME supplemented with 10% FBS, penicillin and streptomycin, and 200 mM glutamine. MS5, OP9, and aorta-gonad-mesonephros-S2 (AGM-S2) murine stromal cells were propagated in αMEM (GIBCO BRL) supplemented with 10% FBS, penicillin and streptomycin, and 200 mM glutamine. For MS5 coculture experiments and long-term culture–initiating cell (LTC-IC) assays, cells were grown in αMEM supplemented with heat-inactivated 12.5% FBS, heat-inactivated 12.5% horse serum (HyClone Laboratories), penicillin and streptomycin, 200 mM glutamine, 57.2 μM β-mercaptoethanol, and 1 μM hydrocortisone (LTC medium). For OP9 coculture experiments, cells were grown in αMEM supplemented with 12.5% FBS, 12.5% horse serum, penicillin and streptomycin, 200 mM glutamine, 57.2 μM β-mercaptoethanol, and 50 μg/ml vitamin C. For AGM-S2 coculture experiments, cells were grown in αMEM supplemented with 12.5% FBS, 12.5% horse serum, penicillin and streptomycin, 200 mM glutamine, and 57.2 μM β-mercaptoethanol. Liquid culture experiments were performed in IMDM (GIBCO BRL) in the presence of 10% FBS, 20 ng/ml IL-3, 20 ng/ml IL-6, and c-Kit ligand (KL), Flt-3 ligand (FL), and thrombopoietin (TPO; 100 ng/ml each; provided by Kirin Brewery Co., Ltd.).
Retroviral Vectors, Production, and Transduction.
For all retroviral transduction experiments, the murine stem cell virus retroviral expression vector was used, which contained an encephalomyelocarditis virus–derived internal ribosomal entry site (IRES)2 in front of the enhanced GFP (EGFP; provided by W. Pear, University of Pennsylvania, Philadelphia, PA). The constitutively active mutant murine STAT5A(1*6) was subcloned from pMXpuro-STAT5(1*6) into the EcoRI–SalI sites of the pIRES2-EGFP vector (CLONTECH Laboratories, Inc.). Subsequently, the BglII–SalI fragment from pSTAT5A(1*6)-IRES2-EGFP was subcloned into the BglII–XhoI sites from the murine stem cell virus vector. All constructs were verified by sequencing. Stable high titer retroviral producer cell lines were generated by transiently transfecting H29 cells using 10 μg DNA and the calcium-phosphate precipitation method as described previously (32). After 4 d, supernatants from H29 cultures were used to cross-transduce PG13 cells in the presence of 8 μg/ml polybrene (Sigma-Aldrich). High titer retroviral producer PG13 cell lines were selected by stringent GFP+ cell sorting and/or single cell cloning. CD34+ cells were prestimulated for 48 h in QBSF-60 serum-free medium (Quality Biological, Inc.) supplemented with 100 ng/ml TPO, 100 FL, and 100 KL. Retroviral supernatants were harvested from stable PG13 producers in QBSF for 8–12 h. Before the first transduction round, supernatants were collected, 100 ng/ml TPO, 100 ng/ml FL, 100 ng/ml KL, and 4 μg/ml polybrene were added, and supernatants were filtered through 0.45-μm filters (Corning) and used immediately for transduction of CB CD34+ cells on RetroNectin-coated (Takara) six-well plates. Three consecutive transduction rounds of 8–12 h were performed before starting various assays.
Colony-forming Cell (CFC), LTC-IC, and Secondary Cobblestone Area–forming cell (CAFC) Assays.
CFC assays and LTC-IC assays on MS5 stromal cells were performed as described previously (31). In brief, CFC assays were performed in 1.2% methylcellulose containing 30% FBS, 57.2 μM β-mercaptoethanol, 2 mM glutamine, 0.5 mM hemin (Sigma-Aldrich), 20 ng/ml IL-3, 20 ng/ml IL-6, 20 ng/ml G-CSF, 20 ng/ml KL, and 6 U/ml EPO. Week 0 data represent CFCs per 1,000 plated cells, and week 1 and 2 data represent data per 10,000 plated cells. CFU-E assays were performed as CFC assays in the presence or absence of EPO, only using 10,000 cells per plate. LTC-IC assays were performed by plating transduced CB CD34+ cells in limiting dilutions in the range of 5–100 cells per well on MS5 stromal cells in 48-well plates in LTC medium. For secondary CAFC assays, day 10 CAFCs were harvested by trypsinization of adherent cell populations and replated on fresh MS5 stroma or used for analysis or GFP+ sorting.
Immunoblotting, Histochemistry, and Cytospins.
5 × 10⁵ cells were lysed on ice in lysis buffer as described previously (32). Whole cell extracts were boiled for 5 min in Laemmli sample buffer before separation on 12% SDS-acrylamide gels. Proteins were transferred to nitrocellulose filters (Millipore) in Tris-glycine buffer at 9 V for 1.5 h using a semidry electroblotter from Bio-Rad Laboratories. Membranes were blocked in PBS containing 5% nonfat milk before incubation with antibodies. Binding of antibodies was detected by ECL according to the manufacturer's instructions (Roche Diagnostics). Antibodies against STAT5 (C20) and GFP (B2) were obtained from Santa Cruz Biotechnology, Inc. and were used in dilutions of 1:2,000. For histochemistry, cytospins were fixed in 4% paraformaldehyde, permeabilized in PBS containing 0.1% Tween-20, and stained with antibodies in dilutions of 1:100. Secondary Cy2-conjugated antibodies were obtained from Jackson ImmunoResearch Laboratories and were used in 1:200 dilutions. Cells were visualized using an inverted fluorescence microscope (Carl Zeiss MicroImaging, Inc.). May-Grünwald-Giemsa staining was used to analyze cytospins.
PCR and Gene Array Analysis.
For RT-PCR, total RNA was isolated from 106 cells using the RNeasy kit from QIAGEN according to the manufacturer's recommendations. 2 μg RNA was reverse transcribed with M-MuLV reverse transcriptase (Roche Diagnostics). For PCR, 2 μl cDNA was amplified using primers as indicated in the text (sequences and conditions are available on request) in a total volume of 50 μl using 2 U Taq polymerase (Roche Diagnostics). As a negative control, RNA minus reverse transcriptase (−RT)–prepared cDNA was used in PCR reactions. 10-μl aliquots were run on 1.5% agarose gels. For microarray analyses, total RNA was isolated from transduced GFP+-sorted cells using the RNeasy kit from QIAGEN, and 4 μg RNA was used for labeling reactions according to the manufacturer's instructions and was hybridized to Affymetrix Human Genome U133A. MiGR1 and STAT5A(1*6) transcripts were hybridized independently and gene expression profiles were compared. Differences in gene expression were considered significant when the fold change was >1.87 with a detection p-value <0.05 and a signal value >200.
Mice.
Nonobese diabetic (NOD)-SCID mice (also referred to as NOD/LtSz-SCID) were obtained from The Jackson Laboratory and were maintained in germ-free conditions. Mice were matched for age (8–10 wk), weight (>20 g), and sex, received a sublethal dose of 300 cGy total body irradiation, and were injected with 2 × 10⁵ cells via tail vein injection.
Flow Cytometry Analysis.
All antibodies were obtained from BD Biosciences. Cells were incubated with antibodies at 4°C for 45 min. For blocking nonspecific binding to Fcγ receptors, cells were blocked with anti-Fcγ antibodies for 15 min at 4°C. All FACS analyses were performed on a FACSCalibur (Becton Dickinson) and data was analyzed using FlowJo (Tree Star, Inc.). Cells were sorted on a MoFlo (DakoCytomation).
Results
Retroviral Introduction of STAT5A(1*6) into Human CB CD34+ Cells.
Human umbilical CB–derived CD34+ cells were transduced with either the control bicistronic MiGR1 retroviral vector or the STAT5A(1*6) vector, allowing expression of a constitutively active mutant of STAT5A (28) as well as EGFP (Fig. 1 A). Transduction efficiencies were determined by flow cytometric detection of GFP, and MiGR1 transduction efficiencies ranged from 35–60%, whereas the efficiencies for STAT5A(1*6) ranged from 20–35% (Fig. 1 B). STAT5A(1*6) was strongly overexpressed in both the PG13 retroviral producer cell line as well as in transduced CB CD34+ cells, as determined by Western blotting (Fig. 1 C). Constitutive activation of STAT5A(1*6) was demonstrated by a constitutive nuclear localization of STAT5A(1*6) in transduced cells using immunofluorescence microscopy (Fig. 1 D). Nontransduced CB CD34+ cells expressed low levels of endogenous STAT5A (Fig. 1 C), which was localized throughout the cytoplasm and nucleoplasm (Fig. 1 D).
Figure 1.

Retroviral introduction of STAT5A(1*6) into human CB CD34+ cells. (A) Schematic representation of the MiGR1 and STAT5A(1*6) retroviruses used in this study. (B) CB CD34+ cells were prestimulated for 48 h in QBSF supplemented with KL, FL, and TPO (100 ng/ml) followed by three transduction rounds in the next 48 h with STAT5A(1*6) or MiGR1 retroviruses, after which transduction efficiencies were determined on the basis of GFP expression using FACS. (C) Western blot of total extracts from PG13 retroviral producer cell lines and transduced CB CD34+ cells as described above. Membranes were probed with α-STAT5 and α-GFP antibodies. (D) Cytospins of transduced CB CD34+ cells. Cytospins were fixed and permeabilized as described in Materials and Methods and stained with α-STAT5 antibodies. Transduced cells (T) appear as bright green with a predominantly nuclear localization of STAT5, whereas the untransduced cells (U) appear as dim.
STAT5A(1*6) Provides a Proliferative Advantage for CB CD34+ Cells on MS5 Stromal Cells and Induces Erythroid Differentiation.
To assess the effects of constitutive activation of STAT5A on the self-renewal and differentiation potential of HSCs, transduced CB CD34+ cells were cultured on the MS5 murine stromal cell line, and cocultures were demidepopulated weekly for analysis. Plating of GFP+-sorted cells on MS5 resulted in a strong expansion of >500-fold of the STAT5A(1*6)-expressing cells, whereas the MiGR1 control cells expanded only ∼50-fold in a 5-wk time period (Fig. 2 A). Plating of nonsorted cells on MS5 allowed analysis of the relative proliferation of GFP+ and GFP− populations. As depicted in Fig. 2 B, expression of constitutively active STAT5A(1*6) provided a proliferative advantage, as the GFP+ population of the nonadherent cells increased from 21 to >80% within 3 wk, whereas the GFP+ MiGR1 population remained constant between 50 and 55%. Similar results were obtained in cocultures with other stromal cell lines, including OP9 and AGM-S2 (Fig. 2, C and D), and AFT-024 (not depicted). The proliferative advantage provided by STAT5A(1*6) required the coculture on stroma, as this phenotype was not observed in liquid culture assays in the presence of the cytokines IL-3, IL-6, KL, FL, and TPO (Fig. 2, E and F).
Figure 2.

CB CD34+ cells transduced with STAT5A(1*6) have a proliferative advantage in stroma coculture. CB CD34+ cells were transduced with MiGR1 or STAT5A(1*6) as described in Fig. 1 and grown in cocultures on MS5 (A and B), OP9 (C), AGM-S2 (D), or in liquid culture (E and F) in IMDM in the presence of 10% FCS, 20 ng/ml IL-3, 20 ng/ml IL-6, KL, FL, and TPO (100 ng/ml each). Cultures were weekly demidepopulated and cells were counted and analyzed for GFP expression by FACS. Data are of a representative experiment in triplicate out of at least three independent experiments. A and E represent the expansion in absolute cell counts of GFP+-sorted cells. B–D and F represent experiments started with unsorted cells and indicate the percentage of GFP+ cells. Week 0 represents transduced cells before plating on stroma or liquid cultures.
Morphological and phenotypic analyses revealed that the STAT5A(1*6)-expanded cells on MS5 were predominantly committed to the erythroid lineage. Cytospins of week 1 and 2 nonadherent cells showed proerythroblasts, basophilic erythroblast, polychromatic and orthochromatic erythroblasts, as well as terminally differentiated erythrocytes (Fig. 3 A). Flow cytometric analyses revealed elevated levels of CD36, CD71bright, and glycophorin A (GPA) as compared with controls, whereas CD45 expression was strongly reduced (Table I). The myeloid markers CD14 and CD15 were not expressed on STAT5A(1*6) cells, whereas CD11b expression was reduced, in agreement with the cytospins in which very few monocytes or macrophages and occasional granulocytes could be detected. These results were further underscored by data obtained from gene array analyses of transduced GFP+-sorted CB CD34+ cells, in which expression of STAT5A(1*6) strongly induced the expression of the erythroid markers CD36, glycophorin A and B, and hemoglobins α, δ, ɛ, and γ, whereas genes associated with myeloid differentiation were down-regulated (see below).
Figure 3.
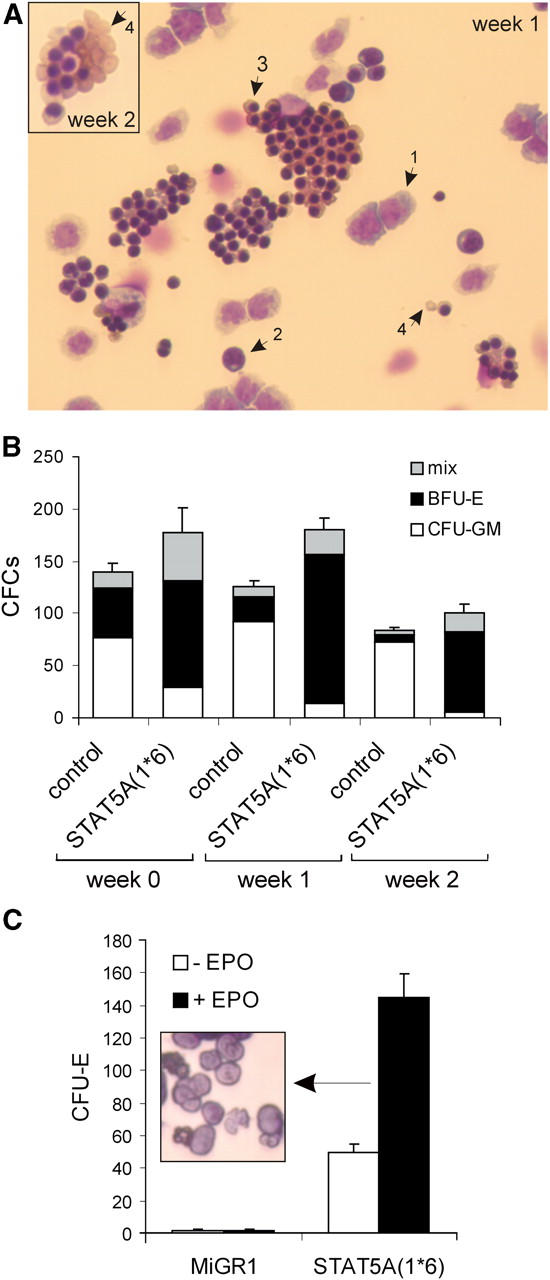
Overexpression of STAT5A(1*6) in CB CD34+ cells induces erythroid differentiation. CB CD34+ cells were transduced with MiGR1 or STAT5A(1*6) as described in Fig. 1 and grown in cocultures on MS5. Cultures were weekly demidepopulated, nonadherent cells were counted and used for cytospins (A), CFC assays (B), or CFU-E assays (C), as described in Materials and Methods. Week 0 represents transduced cells before plating on MS5 stroma. The arrows in A indicate the following: 1, proerythroblasts; 2, basophilic erythroblasts; 3, polychromatic and orthochromatic erythroblasts; and 4, erythrocytes.
Table I.
Phenotype of Nonadherent Cells from Cocultures of Transduced CB CD34+ Cells on MS5 Stroma (in Percent)
| Week 0a
|
Week 1
|
Week 2
|
||||
|---|---|---|---|---|---|---|
| MiGR1 | STAT5A(1*6) | MiGR1 | STAT5A(1*6) | MiGR1 | STAT5A(1*6) | |
| CD34 | 92 | 93 | 10 | 11 | 1–4 | 1–4 |
| CD38 | 64 | 35 | 59 | <1 | 84 | 18 |
| CD33 | 99 | 99 | 84 | 8 | 78 | 17 |
| CD36 | 34 | 65 | 31 | 57 | 24 | 47 |
| CD71bright | 29 | 35 | 15 | 65 | 13 | 26 |
| CD45 | 99 | 99 | 88 | 14 | 95 | 7 |
| GPA | <1 | 7.5 | 10 | 64 | 5 | 41 |
| CD11b | 11 | 6 | 53 | 3 | 68 | 14 |
| CD14 | <1 | <1 | 45 | 4 | 27 | 2 |
| CD15 | <1 | <1 | 12 | 0 | 23 | 3 |
Week 0 represents analysis after 48 h of prestimulation followed by 48 h of transduction of CB CD34+ cells in QBSF with KL, FL, and TPO (100 ng/ml of each) before plating cells on MS5 stroma. Data represent the average percentages of two to five independent experiments.
The amount of progenitors in the MS5 cocultures was enumerated in colony assays in methylcellulose. Transduced CB CD34+ cells were either plated directly for CFC assays (week 0) or on MS5 for expansion and weekly demidepopulation (weeks 1 and 2). As depicted in Fig. 3 B, overexpression of STAT5A(1*6) resulted in a shift to mostly erythroid burst-forming units (BFU-E) and some mixed and CFU-GM progenitors within 48 h after the start of the transduction (week 0), whereas the MiGR1 cells contained mostly CFU-GM colonies and some mixed and BFU-E colonies. These differences were further pronounced in MS5 cocultures in which the nonadherent cells of the STAT5A(1*6) coculture contained mostly BFU-E and some mixed colonies at weeks 1 and 2, whereas few CFU-GM progenitors were present (Fig. 3 B). In contrast, MiGR1 cells gave rise to mostly CFU-GMs at weeks 1 and 2 (Fig. 3 B). Furthermore, week 2 nonadherent cells from the MS5 coculture were plated in CFU-E assays in methylcellulose in the absence or presence of EPO. As indicated in Fig. 3 C, STAT5A(1*6) cells generated a significant number of erythroid colonies (CFU-E) in the absence of EPO, which was further enhanced by the addition of EPO. In contrast, control MiGR1 cells did not give rise to CFU-E on MS5 (Fig. 3 C). Morphological analyses demonstrated that most of the colonies consisted of terminally differentiated enucleated erythrocytes (Fig. 3 C, inset).
Taken together, these data indicate that STAT5A(1*6) provides a proliferative advantage for CB CD34+ cells on stroma and drives erythroid, but blocks myeloid, differentiation.
STAT5A(1*6) Induces Early Cobblestone Areas on Stroma with Self-Renewing Potential.
In coculture studies on various stromal cell lines, we noted the appearance of very early CAFCs with STAT5A(1*6)-transduced CB CD34+ cells within 10 d after plating (Fig. 4 A). These early CAFCs were not observed with MiGR1-transduced cells, which did develop the classical week 5 CAFCs on MS5 stroma. To enumerate the CAFC frequencies, LTC-IC assays were performed under limiting dilution conditions using GFP+-sorted CB CD34+ cells transduced with MiGR1 or STAT5A(1*6). As indicated in Fig. 4 B, the expression of constitutively active STAT5A(1*6) resulted in a CAFC frequency of 12–13% at day 10, and most of these early CAFCs continued to grow until week 5. In contrast, CB CD34+ cells transduced with MiGR1 generated CAFCs on MS5 with a frequency of 0.5–1% at week 5 (Fig. 4 B). These data indicate that besides the shift from week 5 to day 10 cobblestones, the frequency is strongly enhanced in cells that express STAT5A(1*6). Phenotypical analysis of the day 10 CAFCs generated by overexpression of STAT5A(1*6) revealed that ∼5% of the cells expressed CD34, 65% were CD71bright, and 25% expressed GPA. The myeloid markers CD14, CD15, and CD19 were not expressed and only ∼12% expressed CD45 (Fig. 4 C). As a control, day 10 adherent GFP+ MiGR1-transduced cells were analyzed, which at this time had not developed into CAFCs. These cells expressed CD14 and CD45, whereas <1% expressed CD34 and no GPA expression could be detected. These data indicate that the early CAFCs induced by STAT5A(1*6) contain erythroid progenitors, more committed erythroid cells, and some CD34+ cells, but few myeloid cells. This was further underscored by morphological analysis of GFP+-sorted adherent cells from cocultures on MS5 at day 10. Although the adherent population in the MiGR1 cells contained mostly myeloid cells, the STAT5A(1*6) cells contained erythroid progenitors, more committed erythroid cells, and some cells with a blast-like morphology, but few myeloid cells (Fig. 4 D).
Figure 4.
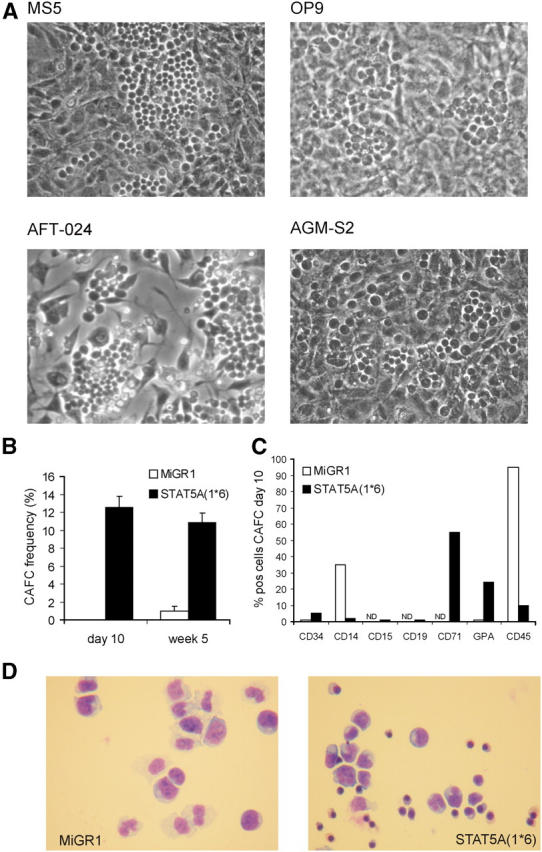

STAT5A(1*6) induces early CAFCs in CB CD34+ cells. CB CD34+ cells were transduced with MiGR1 or STAT5A(1*6) as described in Fig. 1 and grown in cocultures on stromal cell lines as indicated. (A) Representative examples of CAFCs at day 10 observed in coculture studies with CB CD34+ cells transduced with STAT5A(1*6). (B) CAFC frequencies were determined on MS5 in limiting dilution conditions as described in Materials and Methods. (C) GFP+ cells were sorted from the adherent population on MS5 at day 10 and used for FACS analysis and cytospins (D). (E) CB CD34+ cells were transduced with MiGR1 or STAT5A(1*6), after which the CD38high and CD38low populations were sorted and used to determine the CAFC frequencies on MS5 under limiting dilution conditions. First CAFC frequencies were determined at day 10, and cultures were either harvested and plated on new MS5 stroma to determine secondary CAFC frequencies (indicated in black as number of secondary CAFCs/number of primary CAFCs), or plated in methylcellulose to determine the number of CFCs/10 CAFCs (F). (G) CB CD34+ cells were transduced with MiGR1 or STAT5A(1*6) as described in Fig. 1 and plated for CFC assays in triplicate. After 2 wk, the colonies were scored and cells from each plate were plated for secondary CFCs. (H) Sublethally irradiated NOD-SCID recipients were injected with 2 × 10⁵ GFP+ day 10 STAT5A(1*6) CAFCs. Mice were killed at week 6 and the bone marrow was analyzed as indicated.
To determine whether the early CAFCs induced by STAT5A(1*6) represent true HSCs, a variety of assays were undertaken. First, transduced CB CD34+ cells were sorted into GFP+/CD38low and GFP+/CD38high populations, which were analyzed for CAFC activity on MS5 under limiting dilution conditions. As indicated in Fig. 4 E, most of the CAFCs at day 10 arose from the CD38low population with a frequency of 13.8%, whereas the CD38high population contained some CAFCs at a frequency of 4.5%. Importantly, only the CAFCs generated by the GFP+/CD38low population gave rise to secondary CAFCs when plated onto fresh MS5 stroma, whereas the CAFCs generated from the GFP+/CD38high population did not (Fig. 4 E). Differentiated progeny from secondary CAFCs from the GFP+/CD38low population was monitored by flow cytometry and cytospins. Secondary CAFCs predominantly gave rise to erythroid cells and some myeloid cells (not depicted; see also Fig. 5). Furthermore, day 10 CAFCs were plated in methylcellulose to determine the presence of hematopoietic progenitors. Most of the progenitors were found to be in the CAFCs generated by the GFP+/CD38low population and contained mostly BFU-E, some CFU-GM, and mixed colonies (Fig. 4 F). To establish the effect of STAT5A(1*6) expression on the self-renewal of immature progenitors, we also performed secondary CFC assays with transduced CD34+ cells in which primary colonies from CFC assays in methylcellulose were harvested and plated for secondary CFCs. As illustrated in Fig. 4 G, expression of STAT5A(1*6) resulted in the appearance of significant numbers of secondary CFCs, most of which were myeloid. In contrast, MiGR1 CFCs did not generate secondary CFCs (Fig. 4 G). Finally, sublethally irradiated NOD-SCID recipients were injected with 2 × 10⁵ GFP+ day 10 STAT5A(1*6) CAFCs. Mice were killed at week 6 and the bone marrow was analyzed for GFP+ and CD45+ populations. A typical analysis is shown in Fig. 4 G, and graft efficiencies were in the range of 0.1–1% (n = 4), indicating that the early CAFCs generated by overexpression of STAT5A(1*6) contain cells that are able to engraft in a sublethally irradiated host in vivo. Further analysis indicated that the donor-derived STAT5A(1*6) GFP+ cells were predominantly CD36+ and CD45+, whereas few CD11b+ donor-derived cells were detected in NOD-SCID mice injected with STAT5A(1*6) CAFCs. Interestingly, a significant number of cells positive for human GPA were GFP−. Possibly some of the GPA+ cells are negative for GFP due to quenching by the heme group found within red cells. These data suggest that the STAT5A(1*6) CAFCs contain HSCs or early progenitors that engraft NOD-SCID mice and differentiate toward the erythroid lineage in vivo. In NOD-SCID engraftment studies in which MiGR1 and STAT5A(1*6) CD34+ cells were injected directly after transduction (n = 8 for MiGR1 and STAT5A(1*6)), we observed comparable engraftment levels of 0.5–1.5% for both MiGR1 and STAT5A(1*6). FACS analysis of the peripheral blood cells with CD11b, CD15, CD36, and CD19 showed donor-derived cells in erythroid, myeloid, and lymphoid lineages (not depicted).
Figure 5.

Long-term cultures of CB CD34+ cells transduced with STAT5A(1*6) on MS5 stroma. (A) CB CD34+ cells were transduced with STAT5A(1*6) and plated on MS5 to generate CAFCs, which were harvested and replated onto new MS5 at day 10, weeks 3, 5, and 7 (not depicted), and weeks 10, 13, and 15 (indicated by the arrows). Cultures were weekly demidepopulated and cell counts of a representative experiment out of two independent experiments are shown. At week 14, nonadherent cells were used for FACS analysis (see Table I), RT-PCR analysis (B), in which total RNA was isolated, and used in RT-PCR reactions with primers that amplify the STAT5A(1*6)-IRES2 cassette, cytospins (C), or CFC assays (D), in which cells were plated in methylcellulose.
Activation of STAT5A Allows Long-Term Cultures of CAFCs on MS5 for up to 18 wk.
We wished to determine for how long early CAFCs generated by overexpression of STAT5A(1*6) could be serially passaged onto new MS5 stroma. Day 10 CAFCs were harvested and plated on fresh MS5 stroma to allow generation of secondary CAFCs. Secondary CAFCs were formed readily within 10–20 d with the STAT5A(1*6) cells, generating approximately four to five secondary CAFCs per initial CAFC. Moreover, STAT5A(1*6) CAFCs could be serially passaged for up to 18 wk. A typical experiment out of two independent experiments is shown in Fig. 5, in which CAFCs were plated onto new MS5 at day 10, weeks 3, 5, and 7 (not depicted), and weeks 10, 13, and 15, continuously generating new CAFCs and nonadherent cells for up to 18 wk (Fig. 5 A). Cocultures were weekly demidepopulated and analysis of nonadherent cells at week 14 revealed that STAT5A(1*6) RNA was still being expressed (Fig. 5 B) and that cells were mostly erythroid, somewhat resembling an erythroleukemia (Fig. 5 C). These cells still generated significant numbers of progenitors as determined by CFC assays, all of which were BFU-E (Fig. 5 D). These results were further underscored by FACS analysis of nonadherent cells at week 14: 1.5% expressed CD34, 30% expressed CD36, 55% were CD71bright, and 4.5% were GPA+, whereas no CD14+ and CD15+ cells, and few CD45+ (11%) and CD11b+ (10%) cells, were detected (not depicted). Taken together, these data indicate that overexpression of constitutively active STAT5A(1*6) allows the generation of early CAFCs with long-term self-renewal capacity on MS5 ex vivo.
Molecular Analysis of Overexpression of Constitutively Active STAT5A(1*6) in CB CD34+ Cells.
To obtain more insight in the underlying mechanisms involved in the phenotypes we observed by overexpression of STAT5A(1*6) in CB CD34+ cells, microarray analysis was performed using the Affymetrix Human Genome U133A gene arrays that contain ∼21,000 probe sets. CB CD34+ cells were transduced with MiGR1 or STAT5A(1*6), total RNA was isolated from GFP+-sorted cells, and labeled cDNA was prepared for hybridization with the gene arrays. MiGR1 and STAT5A(1*6) transcripts were hybridized independently, and gene expression profiles were compared. The most important results are shown in Table II. Changes of expression patterns of genes that were possibly related to our observed phenotypes were further confirmed by RT-PCRs in two independent preparations of total RNA from GFP+-sorted CB CD34+ cells (Fig. 6 A). 137 genes were differentially expressed in CB CD34+ cells transduced with STAT5A(1*6) versus MiGR1, 84 genes were up-regulated, and 53 genes were down-regulated. 25 of the 137 genes encoded for hypothetical proteins or expressed sequence tags.
Table II.
Differential Gene Expression in CB CD34+ Cells Expressing STAT5A(1*6)
| Gene | Unigene accession | Gene symbol | Fold changea |
|---|---|---|---|
| hemoglobin, ζ | Hs.272003 | HBZ | 42.22 |
| glycophorin A (includes MN blood group) | Hs.108694 | GYPA | 12.13 |
| FBJ murine osteosarcoma viral oncogene homologue B | Hs.75678 | FOSB | 11.31 |
| aquaporin 3 | Hs.234642 | AQP3 | 4.92 |
| leukemia inhibitory factor (cholinergic differentiation factor) | Hs.2250 | LIF | 4.92 |
| hemoglobin, α2 | Hs.347939 | HBA2 | 3.73 |
| hemoglobin, α1 | Hs.272572 | HBA1 | 3.73 |
| glycophorin B (includes Ss blood group) | Hs.343871 | GYPB | 3.73 |
| monoamine oxidase A | Hs.183109 | MAOA | 3.25 |
| pim-1 oncogene | Hs.81170 | PIM1 | 3.25 |
| ankyrin 1, erythrocytic | Hs.183805 | ANK1 | 3.25 |
| TNF receptor–associated factor 4 | Hs.8375 | TRAF4 | 3.25 |
| cytokine-inducible SH2-containing protein | Hs.8257 | CISH | 3.03 |
| hemoglobin, γA | Hs.266959 | HBG1 | 3.03 |
| hemoglobin, ε1 | Hs.117848 | HBE1 | 2.83 |
| leptin receptor | Hs.226627 | LEPR | 2.64 |
| Rhesus blood group–associated glycoprotein | Hs.169536 | RHAG | 2.64 |
| ankyrin 1, erythrocytic | Hs.183805 | ANK1 | 2.46 |
| ras-related C3 botulinum toxin substrate 3 (rho family, Rac3) | Hs.45002 | RAC3 | 2.46 |
| Kell blood group precursor (McLeod phenotype) | Hs.78919 | XK | 2.46 |
| CD36 antigen (collagen type I receptor) | Hs.75613 | CD36 | 2.30 |
| PDGFA-associated protein 1 | Hs.278426 | PDAP1 | 2.14 |
| son of sevenless homologue 1 (Drosophila) | Hs.326392 | SOS1 | 1.87 |
| vascular endothelial growth factor | Hs.73793 | VEGF | 1.87 |
| FOS-like antigen 2 | Hs.301612 | FOSL2 | −1.87 |
| absent in melanoma 1 | Hs.161002 | AIM1 | −1.87 |
| T cell receptor β locus | Hs.303157 | TRB | −1.87 |
| CD44 antigen (homing function) | Hs.169610 | CD44 | −1.87 |
| RAB27A, member RAS oncogene family | Hs.50477 | RAB27A | −1.87 |
| platelet/endothelial cell adhesion molecule (CD31 antigen) | Hs.78146 | PECAM1 | −1.87 |
| TYRO protein tyrosine kinase binding protein | Hs.9963 | TYROBP | −1.87 |
| myeloperoxidase | Hs.1817 | MPO | −1.87 |
| v-myc myelocytomatosis viral-related oncogene (avian) | Hs.25960 | MYCN | −2.00 |
| cathepsin G | Hs.100764 | CTSG | −2.00 |
| elastase 2, neutrophil | Hs.99863 | ELA2 | −2.00 |
| CCAAT/enhancer binding protein (C/EBP), δ | Hs.76722 | CEBPD | −2.00 |
| immunoglobulin heavy constant μ | Hs.153261 | IGHM | −2.14 |
| caspase 1, apoptosis-related cysteine protease | Hs.2490 | CASP1 | −2.14 |
| CD48 antigen (B cell membrane protein) | Hs.901 | CD48 | −2.46 |
| chemokine (C-X-C motif), receptor 4 (fusin) | Hs.89414 | CXCR4 | −2.64 |
| B cell CLL/lymphoma 6 (zinc finger protein 51) | Hs.155024 | BCL6 | −2.64 |
| CCAAT/enhancer binding protein (C/EBP), α | Hs.76171 | CEBPA | −3.25 |
CB CD34+ cells were prestimulated for 48 h in QBSF with KL, FL, and TPO (100 ng/ml of each) followed by three transduction rounds in the next 48 h. GFP+ cells were sorted and total RNA was isolated and used to hybridize gene arrays. Data shown is the comparison of GFP+ STAT5A(1*6) versus GFP+ MiGR1 cells. A change in gene expression was only considered significant when the fold change was >1.87 with a statistical p-value of <0.05 and a signal value of >200.
Figure 6.
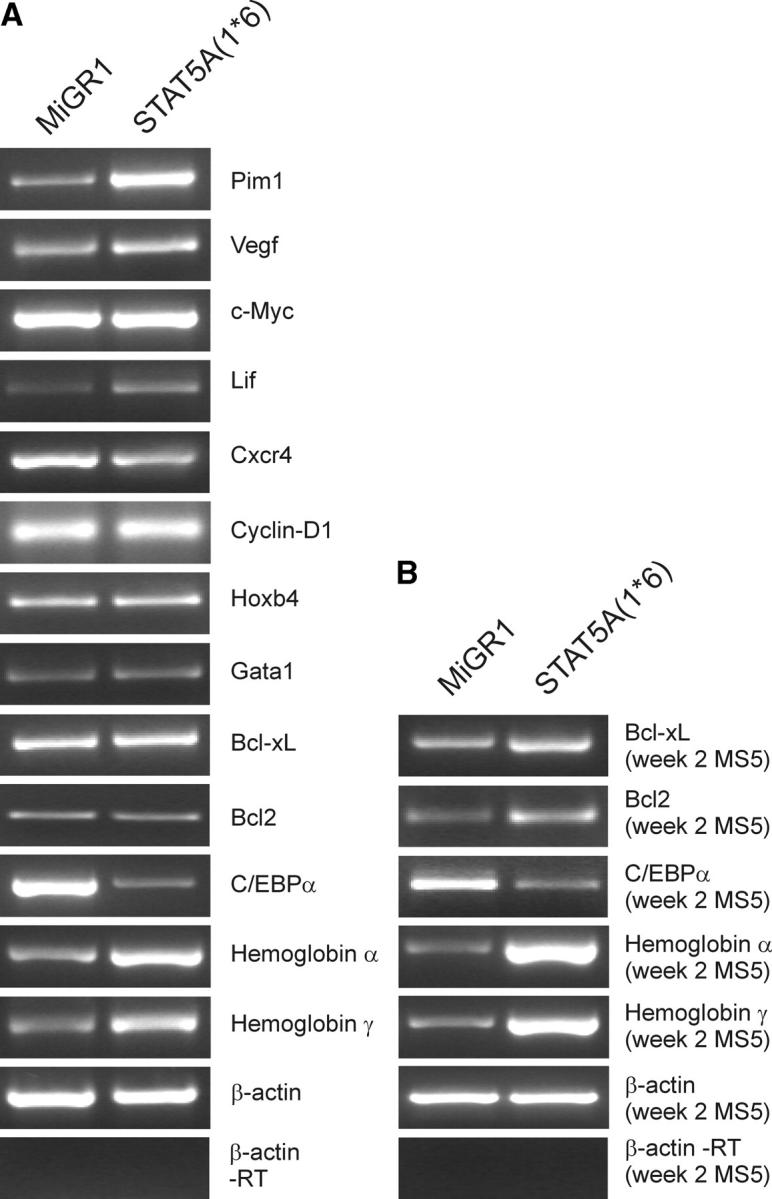
RT-PCR analysis of CB CD34+ cells transduced with STAT5A(1*6) versus MiGR1. (A) CB CD34+ cells were prestimulated for 48 h in QBSF supplemented with KL, FL, and TPO (100 ng/ml of each) followed by three transduction rounds in the next 48 h with STAT5A(1*6) or MiGR1 retroviruses. Total RNA was isolated and used in RT-PCR reactions as described in Materials and Methods, and used for RT-PCR reactions. (B) RT-PCR analysis as in A, but on total RNA isolated from the week 2 nonadherent cells from MS5 cocultures.
The genes that were up-regulated by STAT5A(1*6) included many that are associated with erythroid differentiation, such as the hemoglobins ζ, α1, α2, γA, and ɛ1, and the glycophorins A and B. Also, an up-regulation was found of ankyrin 1, rhesus blood group–associated glycoprotein, Kell blood group precursor, and CD36. GATA1 was expressed in CB CD34+ cells, but was not significantly up-regulated by STAT5A(1*6). In contrast, some of the genes that have been associated with myeloid differentiation were down-regulated, including cathepsin G, CD31, elastase 2, C/EBPα, C/EBPδ, and CD44 and CD48. These data reflect the observations from coculture studies of transduced CB CD34+ cells on MS5 stroma in which we observed a strong erythroid differentiation, whereas myeloid differentiation was blocked. Other genes of interest include the proto-oncogenes FOS-B and PIM1, which both have been associated with enhanced cell proliferation and survival. Caspase 1 was down-regulated, whereas LIF and VEGF were up-regulated.
Interestingly, no effects were found on known STAT5A target genes related to cell cycle progression and antiapoptosis, such as CyclinD1, BCL2, and BCL-XL within 48 h of expression in CB CD34+ cells (Fig. 6 A and microarray data). However, RT-PCR analysis of nonadherent cells from week 2 MS5 cocultures revealed that both BCL2 and BCL-XL were up-regulated as compared with control MiGR1 cells, suggesting that STAT5A(1*6) protects cells from apoptosis in our coculture studies by up-regulating these proteins.
Discussion
A variety of hematopoietic growth factors and cytokines have been shown to induce phosphorylation of STAT5, although functional data on the effects of STAT5A activation in human hematopoietic cells is still limited. Here, we show that a persistent activation of STAT5A in CB CD34+ cells results in enhanced human HSC self-renewal and erythropoiesis.
One critical component in the phenotypes observed by overexpression of the constitutively active mutant STAT5A(1*6) in CB CD34+ cells is the interaction of HSCs with the surrounding stroma. Within a few days after plating, CB CD34+ cells transduced with STAT5A(1*6) form CAFCs on various stromal cell lines, including MS5, and these CAFCs can be cultured for at least up to 18 wk. Typically, the production of CAFCs at weeks 5 or 6 in ex vivo expansion cultures has been shown to be indicative of the presence and quantity of in vivo long-term repopulating HSCs, as measured using the quantitative NOD-SCID transplantation model, whereas CAFCs arising earlier have been associated with short-term engrafting cells (33–36). In the case of overexpressed STAT5A(1*6), the CAFCs that arise within 5–10 d can be grown for at least 18 wk by serial passage on new stromal cells every 2–3 wk, giving rise to nonadherent progeny that is mostly erythroid, but also contains a small subset of CD11b+ myeloid cells, suggesting that these CAFCs represent self-renewing cells with the capacity to give rise to predominantly erythroid and, to a lesser extent, myeloid progeny. Interestingly, in liquid cultures, STAT5A(1*6)-transduced cells did not have a proliferative advantage over control MiGR1 cells, as observed in stromal cocultures. Also, no pronounced erythroid differentiation was observed in STAT5A(1*6) cells in liquid cultures. These data indicate that the interaction with stroma is critical for the self-renewal, proliferative advantage, and erythropoiesis of STAT5A(1*6)-expressing cells. Perhaps, VEGF or LIF, which are both up-regulated in CB CD34+ cells transduced with STAT5A(1*6), are critical in ensuring an appropriate microenvironment for HSC self-renewal in stromal niches, a possibility that will certainly be a focus of future research. Indeed, it has been demonstrated that LIF can up-regulate the production of stem cell expansion–promoting factors in stromal cells, enabling the maintenance of highly enriched competitive repopulating stem cells (37–39).
Although in control cells ∼1 in 100 cells will give rise to a CAFC at week 5 on MS5, in STAT5A(1*6)-expressing cells this has increased to ∼12 in 100 cells within 10 d. Upon secondary passage, one STAT5A(1*6) CAFC gave rise to four to five secondary CAFCs. The self-renewing HSCs reside in the immature CD34+/CD38low population. In experiments in which GFP+/CD34+/CD38low and GFP+/CD34+/CD38high populations were sorted directly after transduction and analyzed for CAFC, secondary CAFC, and CFC/CAFC ratios, we found that the CD38high fraction contains some CAFCs, but no secondary CAFCs and few CFCs/CAFC, whereas the majority of CAFCs, secondary CAFCs, and CFC/CAFC activities was present in the CD38low population. The CAFCs generated by this CD34+/CD38low fraction contained mostly BFU-E progenitors and some CFU-GM and CFU-mix progenitors (Fig. 4 F). The secondary CAFCs generated predominantly erythroid and some myeloid cells (not depicted). Although it has been described that the CD34+/CD38low population contains both long-term and short-term repopulating stem cells, our data indicate that a persistent activation of STAT5A imposes self-renewal characteristics on this population. Microarray and RT-PCR analyses revealed that STAT5A(1*6) does not enhance the expression of genes that have previously been associated with HSC self-renewal, such as HOXB4, NOTCH1, BMI11, or β-catenin (4–7, 9), although these genes are being expressed, as determined by our microarray analysis (not depicted). The proto-oncogenes FOSB and PIM1 were up-regulated in CB CD34+ cells, and PIM1 has previously been identified as a STAT5 target gene (40). In particular, PIM1 has been associated with enhanced cell proliferation, cytokine independent growth, and cellular transformation processes (28, 41–43), and it will be of interest to determine its role in HSC self-renewal.
The early CAFCs can engraft sublethally irradiated NOD-SCID mice with frequencies of 0.1–1%. As we injected 2 × 10⁵ GFP+ CAFCs into NOD-SCID mice, of which ∼5% were CD34+, these engraftment frequencies are comparable to those that have been reported for fresh CB (33). It has been suggested that upon plating on stromal cells, HSCs are initially in a quiescent state and reside in a nonproliferative niche, comparable to the situation in the bone marrow under nonmyelosuppressive conditions (44). Bone marrow ablation induces the release of soluble KL, enabling bone marrow–repopulating cells to translocate to a permissive vascular niche, favoring differentiation and reconstitution of the stem/progenitor cell pool (44). On stroma, stem cells start to proliferate within 5 wk, giving rise to CAFCs with in vivo multilineage reconstitution potential. As overexpression of STAT5A(1*6) results in a shift toward early CAFCs, we hypothesize that these HSCs are less quiescent, but rather “activated,” resulting in the generation of CAFCs with long-term self-renewal potential ex vivo. Recently, Bradley et al. (45) reported that under 5-FU–induced myelosuppressive conditions, stat5a − / − b − / − repopulating stem cells are indeed more quiescent and much less responsive to early-acting cytokines that may play a role in repopulation. These observations and our data suggest that STAT5 fulfills an important function in the hematopoietic reconstitution and self-renewal properties of HSCs.
Although expression of STAT5A(1*6) in CB CD34+ cells results in the generation of CAFCs that can be cultured for up to 18 wk, give rise to new CAFCs with every passage, and engraft sublethally irradiated NOD-SCID mice, we cannot rule out the possibility that STAT5A activity promotes the expansion and self-renewal of early erythroid progenitors with reconstitution potential rather than true HSC expansion and self-renewal. Clearly, most of our data, including ex vivo long-term cultures on MS5 and in vivo hematopoietic reconstitution studies in NOD-SCID mice, indicate that cells predominantly differentiate along the erythroid lineage, which would support such a model. Nevertheless, after 18 wk on MS5, we still find ∼10% CD11b+ cells. In secondary CFCs assays, we observed that only STAT5A(1*6) cells give rise to secondary CFCs, which are mostly CFU-GMs, suggesting that STAT5A(1*6) promotes self-renewal of an early cell that certainly can give rise to myeloid progeny. The CAFCs generated by STAT5A(1*6) still contained significant amounts of CFU-GM and CFU-mixed progenitors (Fig. 4 F), and upon long-term culture on MS5, we observed a gradual loss of myeloid progenitors. Further studies in which STAT5A(1*6) is expressed in various sorted subsets, including early HSCs and more differentiated erythroid and myeloid progenitors, are currently ongoing and will help to clarify some of these issues.
Our data are in agreement with previously published observations in mice that have suggested a role for STAT5 in HSC self-renewal (45–47). In competitive repopulation assays, bone marrow and fetal liver cells of stat5a −/− b −/− mice displayed a decreased repopulating activity in granulocyte, macrophage, erythroid, and B lymphocyte populations, with no detectable engraftment of T lymphocytes (46). These results indicated that a significant proportion of the growth factor signals required for multilineage reconstitution potential of HSCs is dependent on STAT5. In a similar study, Snow et al. (47) also demonstrated that STAT5-null HSCs have a profound impairment in repopulating potential, and they suggested that STAT5 is required to sustain a robust hematopoietic reserve that contributes to host viability through crucial survival effects on early progenitor cells. These data indicate that although STAT5-deficient mice are viable and steady-state hematopoiesis is fairly normal, STAT5A/B is an important positive factor for HSC fitness and multilineage hematopoiesis. Our data indicate that constitutive activation of STAT5 is in fact sufficient for long-term human HSC self-renewal. Currently, studies are ongoing to further evaluate the effects of STAT5A(1*6) on multilineage reconstitution potential of human HSCs in vivo in NOD-SCID mice, and we have observed similar phenotypes in murine embryonic stem cell–derived hematopoietic cells in which overexpression of STAT5A(1*6) facilitates hematopoietic differentiation and results in long-term HSC self-renewal in vitro and in vivo (48).
Although adult mice lacking STAT5A/B have normal hematocrit and hemoglobin concentrations, stat5a −/− b −/− embryos are severely anemic due to massive apoptosis and a reduced response to EPO (17, 18). These findings and others have implicated STAT5 in EPO downstream signaling and have suggested an antiapoptotic role for STAT5A in erythroid progenitors by up-regulating genes such as bcl-x L. Besides effects on antiapoptosis, our studies indicate that a persistent activation of STAT5A directly drives erythropoiesis by up-regulating genes involved in erythroid differentiation. It will be of interest to determine whether the promoters of the STAT5A(1*6)–up-regulated erythroid genes contain bona fide STAT5 binding elements or whether these genes are up-regulated via an indirect mechanism. Furthermore, BCL2 and BCL-XL were not up-regulated by STAT5A(1*6) within 48 h of expression in CB CD34+ cells, as determined by microarray analysis as well as by RT-PCR, whereas an increase of these transcripts was observed in week 2 nonadherent cells from MS5 cocultures. These data suggest that initially STAT5A(1*6) drives erythroid differentiation by the up-regulation of critical erythroid genes (and/or the concomitant down-regulation of other lineage-specific genes), whereas in later phases during differentiation STAT5 will also play a role in the survival of erythroid progenitors by preventing apoptosis.
Finally, our data provide some important insights into the possible roles that STAT5 proteins might play in the development of leukemic malignancies. A constitutive activation of STAT5 has been observed in acute myeloid leukemia (21–24), CML (25, 26), and idiopathic myelofibrosis (49), either as a result of chromosomal translocations such as Bcr/Abl in the case of CML, or possibly due to a disturbed cytokine production by leukemic blasts themselves or the surrounding stroma (50, 51). Our data indicate that a persistent activation of STAT5A in HSCs results in enhanced self-renewal, whereas differentiation along the myeloid lineage toward macrophages and granulocytes is severely impaired. Evidence is now accumulating that suggests that acute leukemias are clonal disorders in which blastic cells have stem cell self-renewal characteristics with a concomitant block in differentiation toward mature blood cells (52, 53). It is now conceivable that a persistent activation of STAT5A might play a causal role in the development of such disorders in humans and it would therefore be of great interest to develop therapeutically agents that specifically inhibit STAT5. Little is known about the activation patterns of STAT5 in erythroleukemias in humans, but this is certainly a focus of future research, as our data directly indicate that a constitutive activation of STAT5 is sufficient to drive erythropoiesis at the expense of myeloid differentiation.
Acknowledgments
The authors would like to acknowledge Diane Domingo, Patrick Anderson, and Jan Hendrikx for excellent flow cytometry assistance, Kang Zhang for excellent assistance with NOD-SCID engraftment studies, Katja Weisel for providing AGM-S2, and Dr. Viale from the Genomics Core Facility of the Memorial Sloan-Kettering institute for microarray analyses.
J.J. Schuringa was supported by a grant from the EMBO (ALTF-412-2001), K.Y. Chung was supported by a Charles A. Dana Foundation Fellowship and National Institutes of Health grant CA-09512 (Ruth L. Kirschstein National Research Service Award), G. Morrone is on leave of absence from the Dept. of Experimental and Clinical Medicine, University of Catanzaro “Magna Graecia,” Italy, and M.A.S. Moore was supported by P01 CA 59350, R01 HL 61401, and Leukemia and Lymphoma Society SCOR grants.
The authors have no conflicting financial interests.
Abbreviations used in this paper: AGM-S2, aorta-gonad-mesonephros-S2; BFU-E, erythroid burst-forming unit(s); CAFC, cobblestone area–forming cell; CB, cord blood; CFC, colony-forming cell; CML, chronic myeloid leukemia; EGFP, enhanced GFP; EPO, erythropoietin; FL, Flt-3 ligand; GPA, glycophorin A; HSC, hematopoietic stem cell; IRES, internal ribosomal entry site; KL, c-Kit ligand; LTC-IC, long-term culture–initiating cell; NOD, nonobese diabetic; TPO, thrombopoietin.
References
- 1.Akashi, K., D. Traver, T. Miyamoto, and I.L. Weissman. 2000. A clonogenic common myeloid progenitor that gives rise to all myeloid lineages. Nature. 404:193–197. [DOI] [PubMed] [Google Scholar]
- 2.Kondo, M., I.L. Weissman, and K. Akashi. 1997. Identification of clonogenic common lymphoid progenitors in mouse bone marrow. Cell. 91:661–672. [DOI] [PubMed] [Google Scholar]
- 3.Kondo, M., A.J. Wagers, M.G. Manz, S.S. Prohaska, D.C. Scherer, G.F. Beilhack, J.A. Shizuru, and I.L. Weissman. 2003. Biology of hematopoietic stem cells and progenitors: implications for clinical application. Annu. Rev. Immunol. 21:759–806. [DOI] [PubMed] [Google Scholar]
- 4.Antonchuk, J., G. Sauvageau, and R.K. Humphries. 2002. HOXB4-induced expansion of adult hematopoietic stem cells ex vivo. Cell. 109:39–45. [DOI] [PubMed] [Google Scholar]
- 5.Stier, S., T. Cheng, D. Dombkowski, N. Carlesso, and D.T. Scadden. 2002. Notch1 activation increases hematopoietic stem cell self-renewal in vivo and favors lymphoid over myeloid lineage outcome. Blood. 99:2369–2378. [DOI] [PubMed] [Google Scholar]
- 6.Lessard, J., and G. Sauvageau. 2003. Bmi-1 determines the proliferative capacity of normal and leukaemic stem cells. Nature. 423:255–260. [DOI] [PubMed] [Google Scholar]
- 7.Park, I.K., D. Qian, M. Kiel, M.W. Becker, M. Pihalja, I.L. Weissman, S.J. Morrison, and M.F. Clarke. 2003. Bmi-1 is required for maintenance of adult self-renewing haematopoietic stem cells. Nature. 423:302–305. [DOI] [PubMed] [Google Scholar]
- 8.Schiedlmeier, B., H. Klump, E. Will, G. Arman-Kalcek, Z. Li, Z. Wang, A. Rimek, J. Friel, C. Baum, and W. Ostertag. 2003. High-level ectopic HOXB4 expression confers a profound in vivo competitive growth advantage on human cord blood CD34+ cells, but impairs lymphomyeloid differentiation. Blood. 101:1759–1768. [DOI] [PubMed] [Google Scholar]
- 9.Reya, T., A.W. Duncan, L. Ailles, J. Domen, D.C. Scherer, K. Willert, L. Hintz, R. Nusse, and I.L. Weissman. 2003. A role for Wnt signalling in self-renewal of haematopoietic stem cells. Nature. 423:409–414. [DOI] [PubMed] [Google Scholar]
- 10.Bhardwaj, G., B. Murdoch, D. Wu, D.P. Baker, K.P. Williams, K. Chadwick, L.E. Ling, F.N. Karanu, and M. Bhatia. 2001. Sonic hedgehog induces the proliferation of primitive human hematopoietic cells via BMP regulation. Nat. Immunol. 2:172–180. [DOI] [PubMed] [Google Scholar]
- 11.Levy, D.E., and J.E. Darnell Jr. 2002. Stats: transcriptional control and biological impact. Nat. Rev. Mol. Cell Biol. 3:651–662. [DOI] [PubMed] [Google Scholar]
- 12.Ihle, J.N. 2001. The Stat family in cytokine signaling. Curr. Opin. Cell Biol. 13:211–217. [DOI] [PubMed] [Google Scholar]
- 13.Grimley, P.M., F. Dong, and H. Rui. 1999. Stat5a and Stat5b: fraternal twins of signal transduction and transcriptional activation. Cytokine Growth Factor Rev. 10:131–157. [DOI] [PubMed] [Google Scholar]
- 14.Kieslinger, M., I. Woldman, R. Moriggl, J. Hofmann, J.C. Marine, J.N. Ihle, H. Beug, and T. Decker. 2000. Antiapoptotic activity of Stat5 required during terminal stages of myeloid differentiation. Genes Dev. 14:232–244. [PMC free article] [PubMed] [Google Scholar]
- 15.Buitenhuis, M., B. Baltus, J.W. Lammers, P.J. Coffer, and L. Koenderman. 2003. Signal transducer and activator of transcription 5a (STAT5a) is required for eosinophil differentiation of human cord blood-derived CD34+ cells. Blood. 101:134–142. [DOI] [PubMed] [Google Scholar]
- 16.Hirokawa, S., H. Sato, I. Kato, and A. Kudo. 2003. EBF-regulating Pax5 transcription is enhanced by STAT5 in the early stage of B cells. Eur. J. Immunol. 33:1824–1829. [DOI] [PubMed] [Google Scholar]
- 17.Socolovsky, M., A.E. Fallon, S. Wang, C. Brugnara, and H.F. Lodish. 1999. Fetal anemia and apoptosis of red cell progenitors in Stat5a−/−5b−/− mice: a direct role for Stat5 in Bcl-X(L) induction. Cell. 98:181–191. [DOI] [PubMed] [Google Scholar]
- 18.Socolovsky, M., H. Nam, M.D. Fleming, V.H. Haase, C. Brugnara, and H.F. Lodish. 2001. Ineffective erythropoiesis in Stat5a(−/−)5b(−/−) mice due to decreased survival of early erythroblasts. Blood. 98:3261–3273. [DOI] [PubMed] [Google Scholar]
- 19.Chida, D., O. Miura, A. Yoshimura, and A. Miyajima. 1999. Role of cytokine signaling molecules in erythroid differentiation of mouse fetal liver hematopoietic cells: functional analysis of signaling molecules by retrovirus-mediated expression. Blood. 93:1567–1578. [PubMed] [Google Scholar]
- 20.Turkson, J., and R. Jove. 2000. STAT proteins: novel molecular targets for cancer drug discovery. Oncogene. 19:6613–6626. [DOI] [PubMed] [Google Scholar]
- 21.Spiekermann, K., K. Bagrintseva, R. Schwab, K. Schmieja, and W. Hiddemann. 2003. Overexpression and constitutive activation of FLT3 induces STAT5 activation in primary acute myeloid leukemia blast cells. Clin. Cancer Res. 9:2140–2150. [PubMed] [Google Scholar]
- 22.Birkenkamp, K.U., M. Geugien, H.H. Lemmink, W. Kruijer, and E. Vellenga. 2001. Regulation of constitutive STAT5 phosphorylation in acute myeloid leukemia blasts. Leukemia. 15:1923–1931. [DOI] [PubMed] [Google Scholar]
- 23.Gouilleux-Gruart, V., F. Gouilleux, C. Desaint, J.F. Claisse, J.C. Capiod, J. Delobel, R. Weber-Nordt, I. Dusanter-Fourt, F. Dreyfus, B. Groner, et al. 1996. STAT-related transcription factors are constitutively activated in peripheral blood cells from acute leukemia patients. Blood. 87:1692–1697. [PubMed] [Google Scholar]
- 24.Xia, Z., M.R. Baer, A.W. Block, H. Baumann, and M. Wetzler. 1998. Expression of signal transducers and activators of transcription proteins in acute myeloid leukemia blasts. Cancer Res. 58:3173–3180. [PubMed] [Google Scholar]
- 25.Chai, S.K., G.L. Nichols, and P. Rothman. 1997. Constitutive activation of JAKs and STATs in BCR-Abl-expressing cell lines and peripheral blood cells derived from leukemic patients. J. Immunol. 159:4720–4728. [PubMed] [Google Scholar]
- 26.Shuai, K., J. Halpern, J. ten Hoeve, X. Rao, and C.L. Sawyers. 1996. Constitutive activation of STAT5 by the BCR-ABL oncogene in chronic myelogenous leukemia. Oncogene. 13:247–254. [PubMed] [Google Scholar]
- 27.Schwaller, J., E. Parganas, D. Wang, D. Cain, J.C. Aster, I.R. Williams, C.K. Lee, R. Gerthner, T. Kitamura, J. Frantsve, et al. 2000. Stat5 is essential for the myelo- and lymphoproliferative disease induced by TEL/JAK2. Mol. Cell. 6:693–704. [DOI] [PubMed] [Google Scholar]
- 28.Onishi, M., T. Nosaka, K. Misawa, A.L. Mui, D. Gorman, M. McMahon, A. Miyajima, and T. Kitamura. 1998. Identification and characterization of a constitutively active STAT5 mutant that promotes cell proliferation. Mol. Cell. Biol. 18:3871–3879. [DOI] [PMC free article] [PubMed] [Google Scholar]
- 29.Santos, S.C., V. Lacronique, I. Bouchaert, R. Monni, O. Bernard, S. Gisselbrecht, and F. Gouilleux. 2001. Constitutively active STAT5 variants induce growth and survival of hematopoietic cells through a PI 3-kinase/Akt dependent pathway. Oncogene 19:2080–2090. [DOI] [PubMed] [Google Scholar]
- 30.Spiekermann, K., M. Pau, R. Schwab, K. Schmieja, S. Franzrahe, and W. Hiddemann. 2002. Constitutive activation of STAT3 and STAT5 is induced by leukemic fusion proteins with protein tyrosine kinase activity and is sufficient for transformation of hematopoietic precursor cells. Exp. Hematol. 30:262–271. [DOI] [PubMed] [Google Scholar]
- 31.Jo, D.Y., S. Rafii, T. Hamada, and M.A. Moore. 2000. Chemotaxis of primitive hematopoietic cells in response to stromal cell-derived factor-1. J. Clin. Invest. 105:101–111. [DOI] [PMC free article] [PubMed] [Google Scholar]
- 32.Schuringa, J.J., L.V. Dekker, E. Vellenga, and W. Kruijer. 2001. Sequential activation of Rac-1, SEK-1/MKK-4, and protein kinase Cdelta is required for interleukin-6-induced STAT3 Ser-727 phosphorylation and transactivation. J. Biol. Chem. 20:27709–27715. [DOI] [PubMed] [Google Scholar]
- 33.Piacibello, W., F. Sanavio, A. Severino, A. Dane, L. Gammaitoni, F. Fagioli, E. Perissinotto, G. Cavalloni, O. Kollet, T. Lapidot, et al. 1999. Engraftment in nonobese diabetic severe combined immunodeficient mice of human CD34(+) cord blood cells after ex vivo expansion: evidence for the amplification and self-renewal of repopulating stem cells. Blood. 93:3736–3749. [PubMed] [Google Scholar]
- 34.Kusadasi, N., P.L. van Soest, A.E. Mayen, J.L. Koevoet, and R.E. Ploemacher. 2000. Successful short-term ex vivo expansion of NOD/SCID repopulating ability and CAFC week 6 from umbilical cord blood. Leukemia. 14:1944–1953. [DOI] [PubMed] [Google Scholar]
- 35.Kanai, M., F. Hirayama, M. Yamaguchi, J. Ohkawara, N. Sato, K. Fukazawa, K. Yamashita, M. Kuwabara, H. Ikeda, and K. Ikebuchi. 2000. Stromal cell-dependent ex vivo expansion of human cord blood progenitors and augmentation of transplantable stem cell activity. Bone Marrow Transplant. 26:837–844. [DOI] [PubMed] [Google Scholar]
- 36.Yamaguchi, M., F. Hirayama, M. Kanai, N. Sato, K. Fukazawa, K. Yamashita, K. Sawada, T. Koike, M. Kuwabara, H. Ikeda, et al. 2001. Serum-free coculture system for ex vivo expansion of human cord blood primitive progenitors and SCID mouse-reconstituting cells using human bone marrow primary stromal cells. Exp. Hematol. 29:174–182. [DOI] [PubMed] [Google Scholar]
- 37.Szilvassy, S.J., K.P. Weller, W. Lin, A.K. Sharma, A.S. Ho, A. Tsukamoto, R. Hoffman, K.R. Leiby, and D.P. Gearing. 1996. Leukemia inhibitory factor upregulates cytokine expression by a murine stromal cell line enabling the maintenance of highly enriched competitive repopulating stem cells. Blood. 87:4618–4628. [PubMed] [Google Scholar]
- 38.Shih, C.C., M.C. Hu, J. Hu, J. Medeiros, and S.J. Forman. 1999. Long-term ex vivo maintenance and expansion of transplantable human hematopoietic stem cells. Blood. 94:1623–1636. [PubMed] [Google Scholar]
- 39.Shih, C.C., M.C. Hu, J. Hu, Y. Weng, P.J. Yazaki, J. Medeiros, and S.J. Forman. 2000. A secreted and LIF-mediated stromal cell-derived activity that promotes ex vivo expansion of human hematopoietic stem cells. Blood. 95:1957–1966. [PubMed] [Google Scholar]
- 40.Matikainen, S., T. Sareneva, T. Ronni, A. Lehtonen, P.J. Koskinen, and I. Julkunen. 1999. Interferon-alpha activates multiple STAT proteins and upregulates proliferation-associated IL-2Ralpha, c-myc, and pim-1 genes in human T cells. Blood. 93:1980–1991. [PubMed] [Google Scholar]
- 41.Nosaka, T., T. Kawashima, K. Misawa, K. Ikuta, A.L. Mui, and T. Kitamura. 1999. STAT5 as a molecular regulator of proliferation, differentiation and apoptosis in hematopoietic cells. EMBO J. 18:4754–4765. [DOI] [PMC free article] [PubMed] [Google Scholar]
- 42.Mochizuki, T., C. Kitanaka, K. Noguchi, T. Muramatsu, A. Asai, and Y. Kuchino. 1999. Physical and functional interactions between Pim-1 kinase and Cdc25A phosphatase. Implications for the Pim-1-mediated activation of the c-Myc signaling pathway. J. Biol. Chem. 274:18659–18666. [DOI] [PubMed] [Google Scholar]
- 43.Losman, J.A., X.P. Chen, B.Q. Vuong, S. Fay, and P.B. Rothman. 2003. Protein phosphatase 2A regulates the stability of Pim protein kinases. J. Biol. Chem. 278:4800–4805. [DOI] [PubMed] [Google Scholar]
- 44.Heissig, B., K. Hattori, S. Dias, M. Friedrich, B. Ferris, N.R. Hackett, R.G. Crystal, P. Besmer, D. Lyden, M.A. Moore, et al. 2002. Recruitment of stem and progenitor cells from the bone marrow niche requires MMP-9 mediated release of kit-ligand. Cell. 109:625–637. [DOI] [PMC free article] [PubMed] [Google Scholar]
- 45.Bradley, H.L., T.S. Hawley, and K.D. Bunting. 2002. Cell intrinsic defects in cytokine responsiveness of STAT5-deficient hematopoietic stem cells. Blood. 100:3983–3989. [DOI] [PubMed] [Google Scholar]
- 46.Bunting, K.D., H.L. Bradley, T.S. Hawley, R. Moriggl, B.P. Sorrentino, and J.N. Ihle. 2002. Reduced lymphomyeloid repopulating activity from adult bone marrow and fetal liver of mice lacking expression of STAT5. Blood. 99:479–487. [DOI] [PubMed] [Google Scholar]
- 47.Snow, J.W., N. Abraham, M.C. Ma, N.W. Abbey, B. Herndier, and M.A. Goldsmith. 2002. STAT5 promotes multilineage hematolymphoid development in vivo through effects on early hematopoietic progenitor cells. Blood. 99:95–101. [DOI] [PubMed] [Google Scholar]
- 48.Schuringa, J.J., K. Wu, G. Giovanni Morrone, and M.A.S. Moore. 2004. Enforced activation of STAT5A facilitates the generation of ES-derived hematopoietic stem cells that contribute to hematopoiesis in vivo. Stem Cells. In press. [DOI] [PubMed] [Google Scholar]
- 49.Komura, E., H. Chagraoui, D.M. Mansat, B. Blanchet, P. de Sepulveda, F. Larbret, J. Larghero, M. Tulliez, N. Debili, W. Vainchenker, et al. 2003. Spontaneous STAT5 activation induces growth factor independence in idiopathic myelofibrosis: possible relationship with FKBP51 overexpression. Exp. Hematol. 31:622–630. [DOI] [PubMed] [Google Scholar]
- 50.Coffer, P.J., L. Koenderman, and R.P. de Groot. 2000. The role of STATs in myeloid differentiation and leukemia. Oncogene. 19:2511–2522. [DOI] [PubMed] [Google Scholar]
- 51.Schuringa, J.J., A.T. Wierenga, W. Kruijer, and E. Vellenga. 2000. Constitutive Stat3, Tyr705, and Ser727 phosphorylation in acute myeloid leukemia cells caused by the autocrine secretion of interleukin-6. Blood. 95:3765–3770. [PubMed] [Google Scholar]
- 52.Bonnet, D., and J.E. Dick. 1997. Human acute myeloid leukemia is organized as a hierarchy that originates from a primitive hematopoietic cell. Nat. Med. 3:730–737. [DOI] [PubMed] [Google Scholar]
- 53.Lapidot, T., C. Sirard, J. Vormoor, B. Murdoch, T. Hoang, J. Caceres-Cortes, M. Minden, B. Paterson, M.A. Caligiuri, and J.E. Dick. 1994. A cell initiating human acute myeloid leukaemia after transplantation into SCID mice. Nature. 367:645–648. [DOI] [PubMed] [Google Scholar]