Abstract
The potassium-channel gene, AKT3, has recently been isolated from an Arabidopsis thaliana cDNA library. By using the whole-mount and in situ hybridization techniques, we found AKT3 predominantly expressed in the phloem. To study the physiological role of this channel type, AKT3 was heterologously expressed in Xenopus oocytes, and the electrical properties were examined with voltage-clamp techniques. Unlike the plant inward-rectifying guard cell K+ channels KAT1 and KST1, the AKT3 channels were only weakly regulated by the membrane potential. Furthermore, AKT3 was blocked by physiological concentrations of external Ca2+ and showed an inverted pH regulation. Extracellular acidification decreased the macroscopic AKT3 currents by reducing the single-channel conductance. Because assimilate transport in the vascular tissue coincides with both H+ and K+ fluxes, AKT3 K+ channels may be involved in K+ transport accompanying phloem loading and unloading processes.
The plant vascular system, which consists of xylem and phloem, is specialized for long-distance solute and water transport. In both tissues, potassium represents one of the major mineral nutrients and is likely to assist in osmotic homeostasis. After uptake from the soil, K+ ions circulate between roots and shoots through the xylem and phloem to adopt the specific demands for this cation in the various tissues (1, 2). Recently, in vivo and in vitro analysis demonstrated the presence of K+ uptake and release channels in xylem parenchyma cells (3–6). In comparison, information about K+ transport across the plasma membrane of phloem cells, the underlying mechanisms, and the physiological role in long-distance solute transport is still limited. Phloem loading with assimilates is accompanied by ionic movements (7). Protons are pumped into the apoplast by a H+–ATPase, generating transmembrane gradients in electropotential and pH that in turn enable the uphill transport of assimilates into the phloem through assimilate/H+-cotransporters (8–10). The phloem loading coincides with an increase in the symplastic K+ concentration likely to maintain electrical neutrality that is required for creating the pH gradient (2, 7). In addition, the K+ concentration in the sieve tube may affect the volume flow rate in the phloem (11). Furthermore, the membrane potential that transiently changes during phloem-propagating action potentials is possibly reestablished on K+ release from the sieve tube (12). Evidence for the expression of K+ channels in the phloem was recently provided (P.A., K. Philippar, and R.H., unpublished data) to support the idea that K+ channels may also mediate the transmembrane K+ fluxes in the phloem.
In the present paper, we localized the cloned Arabidopsis K+ channel AKT3 to the phloem and revealed its unique dependence on voltage, Ca2+, and pH properties, which are well suited for meeting its supposed role in processes associated with the phloem.
MATERIALS AND METHODS
RNA Extraction and Northern Blot Analysis.
Total RNA was isolated from Arabidopsis thaliana mesophyll protoplasts and major veins. RNA extraction and Northern blot analysis were carried out as described by Sambrook et al. (13).
Whole-Mount and in Situ Hybridization of Cross Sections.
For whole-mount and in situ hybridization, a protocol of M. Bennett (University of Warwick, U.K.) was used with minor modifications.
AKT3 and KAT1 Expression.
AKT3- and KAT1-encoding RNAs were essentially obtained as described by Ketchum and Slayman (14) and Hoshi (15), respectively, and were injected into Xenopus laevis oocytes. Recordings were made 2–6 days after injection.
Electrophysiological Recordings.
Whole-oocyte currents were recorded with a Turbotec-01C two-electrode voltage-clamp amplifier (NPI Instruments, Tamm, Germany). Patch-clamp experiments were performed either with an AxoPatch 200A (Axon Instruments, Foster City, CA) or an EPC-9 amplifier (HEKA Electronics, Lambrecht, Germany). The single-channel current data were sampled at 200 μs to 1 ms and low-pass filtered at 6–0.2 kHz through an eight-pole Bessel filter. The solution compositions are given in the figure legends. If necessary, solutions were adjusted to 220–240 milliosmol/kg with d-sorbitol.
Analysis of Ca2+ Block.
The effect of external Ca2+ ions and protons on the macroscopic AKT3 currents were examined by applying voltage pulses from the zero current potential that was close to the K+ equilibrium potential. To quantitatively analyze the Ca2+-dependent inhibition of whole-oocyte AKT3 currents, instantaneous current–voltage curves I0(V) were determined for bath solutions containing different external Ca2+ concentrations. After steady-state activation of AKT3 channels on a hyperpolarizing prepulse to −150 mV, current relaxations were recorded at voltages from +20 to −170 mV for a duration of 2.5 s. The tail current amplitudes I0 were calculated on extrapolation to t = 0 and were normalized to that determined for −150 mV in the absence of Ca2+. The data were plotted against voltage and fitted with the function I0(V)= I00Ca(V)/(1 + exp −zFδ/RT(V − V1/2 block)) according to the Woodhull model (16). F, R, and T have their usual meanings. I00Ca represents the instantaneous tail current amplitude in the absence of Ca2+. z denotes the valence of the blocking ion. The fraction of the membrane electric field passed by Ca2+ through the AKT3 pore is given by δ.
Relative Open Probability.
After 2.5-s voltage pulses from +30 to −150 mV in 10-mV steps, the instantaneous tail current amplitudes I0 were determined at +40 mV on extrapolation to the time t = 0. When plotted against voltage, the instantaneous tail current amplitude describes the voltage dependence of the relative open probability [relative Po(V) = constant⋅Po absolute(V)] according to the equation I0(V)= N⋅i(40 mV)⋅Po absolute(V) = constant⋅Po absolute(V). N denotes the number of AKT3 channels available for activation, i(40 mV) the single channel current amplitude at +40 mV, Po absolute(V) the absolute channel open-probability, and N⋅i(40 mV) = constant. Because a fraction of AKT3 channels is open at +40 mV, the voltage-dependent relative open probability is given by the equation: relative Po(V) = constant⋅[P1 absolute(40 mV) + P2 absolute(V)] = relative P1(+40 mV) + relative P2(V).
To quantitatively describe the voltage-dependent relative open probability, the nonnormalized data were fitted with a simple Boltzmann function as given by Po relative(V) = (P2 relative/[1 + exp(V − V1/2)zF/RT]) + P1 relative.
Single-Channel Conductance.
Single-channel fluctuations were continuously recorded at different pipette potentials in the cell-attached configuration. Single-channel amplitudes were obtained on generating open–closed state all-point amplitude histograms from usually 60-s segments. For the exception of one voltage pulse applied to three individual patches, the recording times were 2.3 s, 17.4 s, and 40 s, respectively. The resulting peaks of the histograms were fitted with Gaussian functions. The calculated single-channel amplitudes were plotted against the voltage, and the single-channel conductance was obtained by using linear regression.
When appropriate, the data were represented as mean ± SD. The number of experiments is indicated by n.
RESULTS
AKT3 Is Expressed in the Phloem.
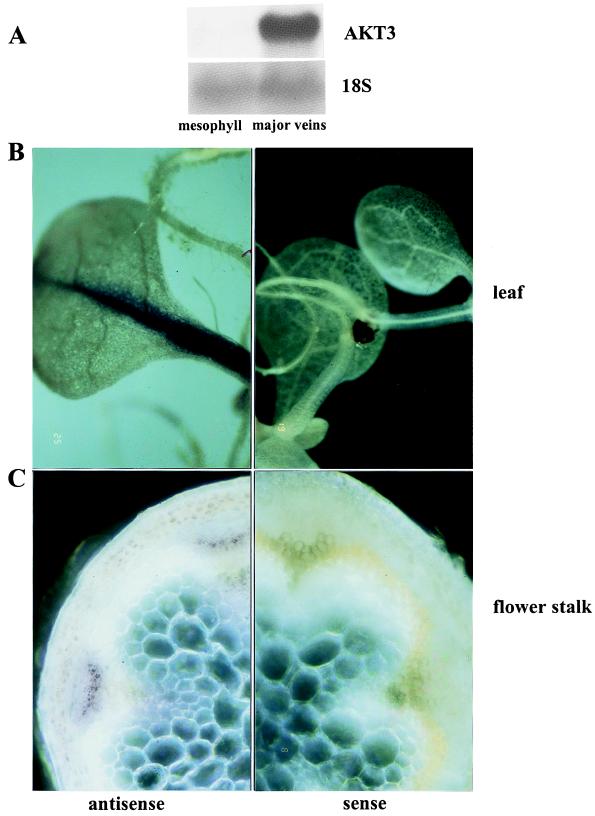
Previous studies showed that the K+ channel gene AKT3 was expressed in leaves but did not identify its cellular localization (17). To further specify the tissue expression of AKT3, Northern blot hybridizations were carried out with total RNA of mesophyll protoplasts and of major veins from Arabidopsis leaves. Fig. 1A shows that AKT3 was highly expressed in major veins but was almost undetectable in mesophyll cells. This finding is consistent with the results obtained from whole-mount hybridizations that also localized AKT3-RNA to major veins of leaves from whole plantlets (Fig. 1B). Finally, in situ hybridization experiments on handmade cross sections of flower stalks revealed the expression of AKT3 in the phloem (Fig. 1C). Because of the resolution limit of the whole-mount in situ technique, we are only confident about the AKT3 localization in the major veins within the leaf and the phloem of the flower stalk. Nevertheless, the three independent approaches indicate that AKT3 represents a phloem-localized channel.
Figure 1.
Expression analysis of the K+ channel AKT3. (A) Northern blot analysis of 10 μg of total RNA isolated from mesophyll protoplasts and major veins of A. thaliana leaves. Hybridizations with 32P-labeled probes are indicated on the right. The 18S probe demonstrated that equal amounts of total RNA were loaded in each lane. (B) Whole-mount hybridization of 7-week-old Arabidopsis plantlets grown on agar. (C) In situ hybridization of handmade cross sections from flower stalks of 10-week-old Arabidopsis plants grown on soil. Strand-specific antisense (Left) and sense (Right) cDNAs labeled with digoxigenin were used as probes.
The Voltage Dependence Is Weak.
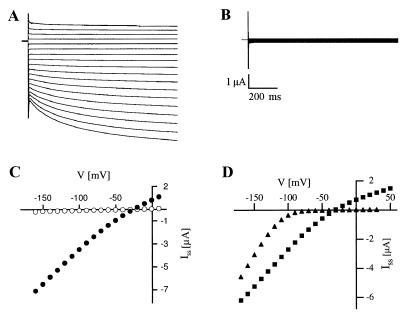
Because the cell types in the phloem are not yet accessible with the patch-clamp technique, two-electrode voltage-clamp measurements were performed on AKT3-expressing Xenopus oocytes. Instantaneous and time-dependent currents were observed in response to pulses from +10 to −160 mV in Xenopus oocytes injected with AKT3 RNA (Fig. 2A). The steady-state current-voltage [Iss(V)] curve shows that the AKT3 currents only weakly rectified from +50 to −170 mV (Fig. 2 C and D). Similar currents were not observed in noninjected oocytes. In contrast to AKT3, KAT1 channels exhibited the characteristics of a strong inward rectifier (Fig. 2D). To determine the cation selectivity of the AKT3 channel, the external K+ concentration was reduced from 100 mM to 50, 10, and 3 mM by replacing K+ by same concentrations of N-methylglucamine. A 10-fold decrease in the external K+ concentration shifted the reversal potential Vrev by −57.7 mV and identified AKT3 as a K+-selective ion channel (data not shown; cf. 14). When potassium was substituted with Na+, a relative permeability of PNa/PK = 0.03 ± 0.08 (n = 8) was determined, indicating a high selectivity of AKT3 for K+ over Na+.
Figure 2.
Current–voltage relationship of AKT3 channels. (A) Representative macroscopic recordings of inward and outward currents obtained from AKT3-RNA-injected Xenopus oocytes. From the resting potential (Vr ≈ −20 mV), the membrane voltage was successively changed from +10 mV to −160 mV in 10-mV decrements for a duration of 1 s. The bath solution was composed of 30 mM KCl, 1 mM CaCl2, 2 mM MgCl2, and 10 mM Mes/Tris (pH 5.6). (B) Both the instantaneous and time-dependent current components were blocked in the presence of 30 mM Ba2+. (C) The steady-state currents Iss determined from A (●, control) and B (○, 30 mM Ba2+) were plotted against the membrane voltage. (D) Steady-state currents Iss recorded from AKT3- and KAT1-injected oocytes from the same batch are given as a function of the membrane voltage. In contrast to KAT1 channels (▴), AKT3 channels (■) showed weak rectification. The solution contained 30 mM KCl, 1 mM CaCl2, and 10 mM Mes/Tris (pH 7.2).
The K+ channel blockers Ba2+, Cs+, and tetraethylammonium (TEA+) were added to the extracellular solution to examine whether both the instantaneous and time-dependent current components are mediated by the heterologously expressed AKT3 channels. In the presence of 30 mM Ba2+ and 30 mM K+, both current components disappeared (Fig. 2 B and C). Similar results were obtained with Cs+ and TEA+ in the bath solution (30 and 20 mM, respectively; data not shown). Consistent with the data obtained with other cloned plant K+ channels (KAT1, KST1, and SKT1; refs. 18–21), the Cs+ block of AKT3 channels was voltage-dependent at the concentrations examined (0.5–5 mM; data not shown), becoming more effective with hyperpolarization. The block by these K+ channel inhibitors was readily reversible. The observation that these agents blocked the instantaneous and time-dependent components equally suggests that the heterologously expressed AKT3 channels are responsible for both components and that the instantaneous current component is mediated by AKT3 channels already open before the onset of the pulse, even at ≥−50 mV.
Ca2+ Block Is Voltage-Dependent.
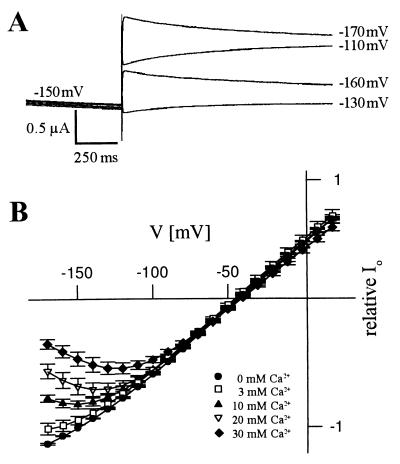
In addition to the membrane potential, extracellular Ca2+ and pH changes have been shown to modulate the plant K+ channel activity (6, 22–26). Therefore, we examined whether the AKT3 channel is regulated by external Ca2+ and pH. When 30 mM Ca2+ replaced the equimolar Mg2+ concentration in the bath, the steady-state current amplitude at −150 mV decreased by 54.7 ± 8.6% (n = 3, not shown; for ionic solutions, see Fig. 3). To test the hypothesis that Ca2+ acts as a voltage-dependent blocking particle, tail currents were measured in the presence of different external Ca2+ concentrations (Fig. 3). Instantaneous tail current amplitudes were obtained at various voltages after preactivating the AKT3 channels by prepulses to −150 mV. With pulses to voltages <−150 mV, a pronounced decrease in the instantaneous current amplitude was observed (Fig. 3). This effect became more prominent with increasing Ca2+ concentrations. These data characterizing a voltage-dependent block were well described by the Woodhull model for cationic block of ion channels (Fig. 3; ref. 16). The fits provide estimates of the electrical distance δ describing the fraction of the membrane electric field sensed by Ca2+ and of V1/2 block, at which the Ca2+-induced inhibition was half-maximal. The estimated values of δ and V1/2 block in the presence of 20 mM Ca2+ were 0.46 ± 0.02 and −157.0 ± 3.4 mV (n = 3), respectively. These results indicate that the AKT3 channel is blocked by Ca2+ ions that enter half of the AKT3 permeation pathway in the membrane electric field.
Figure 3.
Voltage-dependent block of AKT3 by extracellular Ca2+. (A) Tail currents elicited by voltage pulses to −130, −110, −160, and −170 mV after prepulses to −150 mV were recorded in the presence of 30 mM Ca2+. (B) Relative instantaneous tail current amplitudes Io plotted against the voltage revealed a voltage- and concentration-dependent block by Ca2+ (n = 3). The lines represent best fits according to the Woodhull model (16). The solutions contained 20 mM KCl, 10 mM Tris/Mes (pH 7.2), and CaCl2 as indicated. CaCl2 was replaced by same concentrations of MgCl2.
Protons Reduce the Unitary Conductance.
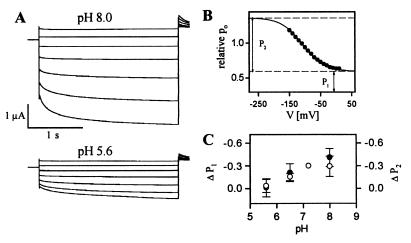
Extracellular acidification activates the cloned K+ uptake channels KAT1, KST1, and SKT1 by shifting their voltage dependence to less negative voltages (18–20, 23). By contrast, we observed that the AKT3 channel was inhibited by extracellular acidification. When the H+ concentration of the bath solution was increased, the steady-state AKT3 current amplitude decreased in a reversible manner (Fig. 4A). To examine whether protons affect AKT3 by altering its voltage dependence, the relative open probability was determined from the tail currents at +40 mV (Fig. 4B). Acidification reduced the minimal and maximal relative open probability of AKT3 (P1 and P2, respectively; Fig. 4 B and C). A change in pH from 8.0 to 5.6 caused a statistically significant decrease in both values by ≈30% (unpaired t test: p-valueΔP1 = 0.05, p-valueΔP2 = 0.01). However, the half-activation voltage and the apparent equivalent gating charge movement were unaffected (pH 8.0: V1/2 = −110.5 ± 6.2 mV, z = 0.59 ± 0.05, n = 3; pH 7.2: V1/2 = −110.4 ± 2.3 mV, z = 0.64 ± 0.05, n = 3; pH 6.5: V1/2 = −105.4 ± 3.6 mV, z = 0.64 ± 0.09, n = 3; pH 5.6: V1/2 = −108.4 ± 7.9 mV, z = 0.54 ± 0.03, n = 3). Thus, extracellular protons do not alter the voltage dependence to decrease the AKT3 channel activity.
Figure 4.
pH dependence of macroscopic AKT3 currents. (A) Current responses to voltage pulses from +30 mV to −150 mV (30-mV decrements) followed by a voltage pulse to +40 mV are shown for pH 8.0 and pH 5.6. (B) The relative open probability of AKT3 shown for pH 8.0 was determined by using the tail current amplitudes from A. The data points were fitted with a simple Boltzmann function. Dashed lines indicate the minimal (lower line, P1) and maximal (upper line, P2) level of the relative open probability. (C) The ΔP1 (○) and ΔP2 (●) values represent the difference of P1 or P2 at pH 8.0, 6.5, or 5.6, to those of pH 7.2 and are shown as a function of the extracellular pH (n = 3). Both ΔP1 and ΔP2 declined with a rise in the proton concentration. The pH solutions contained 50 mM KCl, 2 mM MgCl2, and 10 mM Mes/Tris for pH 5.6 and 6.5 or 10 mM Tris/Mes for pH 7.2 and 8.0.
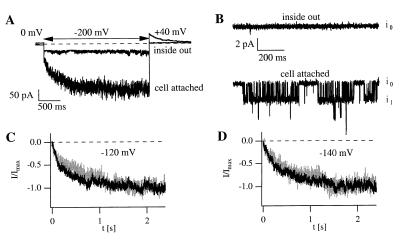
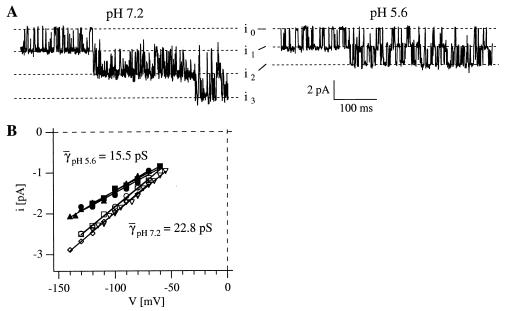
To examine the single-channel conductance of the K+ channel and its sensitivity toward external protons, patch-clamp experiments were performed on AKT3-expressing oocytes. In the cell-attached configuration, we identified open–closed transitions with a 23-pS conductance at an external pH of 7.2 as the AKT3 channel openings for the following reasons. (i) These fluctuations were observed only in oocytes injected with the AKT3 RNA (Figs. 5B and 6A). (ii) Like the AKT3 currents recorded in macropatches, the single-channel openings disappeared on patch excision (Fig. 5 A and B). Thus, the AKT3 channel activity is likely under the control of cytoplasmic factors. (iii) The activation time courses of ensemble currents obtained from the single-channel fluctuations were similar to those of the time-dependent macroscopic currents (Fig. 5 C and D). We found that external acidification reduced the current amplitude of single AKT3 channels. For example, the single-channel current amplitude determined at −140 mV was 2.5 pA at pH 7.2 and 1.8 pA at pH 5.6 (Fig. 6A). Reduction of the extracellular pH from 7.2 to 5.6 decreased the single-channel conductance by 32%, from 23 pS to 16 pS (γpH 5.6 = 15.5 ± 0.5 pS, n = 3; γpH 7.2 = 22.8 ± 0.2 pS, n = 4; P < 0.0001). Thus, the proton effect on the unitary conductance very likely underlies the acidification-induced decrease in the macroscopic AKT3 currents (Fig. 4).
Figure 5.
Comparison of macropatch currents and single-channel fluctuations in cell-attached and excised patches. (A) Time-dependent and instantaneous macropatch currents were observed in response to hyperpolarization. A comparable current response was not observed in the inside-out configuration. (B) Representative channel openings observed in an AKT3-expressing oocyte. Openings and closings were continuously recorded in the cell-attached mode (lower trace) but were not found in the corresponding excised patch (upper trace; V = −140 mV). The labels i0 and i1 indicate the current amplitude when 0 or 1 AKT3 channels are open. (C and D) Activation time course of macropatch currents and assembled single-channel current traces elicited by 2.4-s pulses in the cell-attached mode at −120 mV (C) and at −140 mV (D). Scaled ensemble averages (black traces) of 81 (C) and 67 (D) sweeps and macropatch currents (gray traces) are compared. The solutions contained 140 mM KCl, 2 mM MgCl2, 10 mM Hepes or Tris and were adjusted to pH 7.2 with N-methylglucamine or Mes. The bath solution used for the measurements in A and B and for the macropatch recordings in C also contained 1 mM EGTA.
Figure 6.
Extracellular proton effect on the single-channel conductance of AKT3. (A) Single-channel fluctuations recorded in the presence of pH 7.2 (Left) and pH 5.6 (Right) at a voltage of −130 mV. The labels i0–i3 indicate the current amplitude when 0, 1, 2, or 3 AKT3 channels are simultaneously open. The bath and pipette solution contained 140 mM KCl, 2 mM MgCl2, 10 mM Hepes/N-methylglucamine, pH 7.2. In addition, 1 mM EGTA was added to the pipette solution. To adjust the pipette solution to pH 5.6, 10 mM Mes/N-methylglucamine instead of 10 mM Hepes/N-methylglucamine was used. (B) Single-channel amplitudes i were determined for pH 5.6 (closed symbols, n = 3) and pH 7.2 (open symbols, n = 4) from different patches and are shown as a function of voltage. The corresponding single-channel conductances γ were estimated by using linear regression (γ: ● = 15.0 pS; ■ = 15.1 pS; ▴ = 16.3 pS; ○ and □ = 22.6 pS; ▿ = 22.4 pS; ◊ = 23.4 pS). The data points represented by ● and ○ were obtained from the same oocyte but at different external pH (see above). The recordings were performed in the cell-attached configuration. The solutions contained 140 mM KCl, 2 mM MgCl2, 10 mM Hepes/N-methylglucamine or 10 mM Tris/Mes (pH 7.2). To adjust the pipette solution to pH 5.6, we used either 10 mM Mes/N-methylglucamine or 10 mM Mes/Tris. Except for ■, the bath solution also contained 1 mM EGTA.
DISCUSSION
Here we show that AKT3 represents a weakly voltage-dependent and highly K+-selective channel that is mainly expressed in the phloem. The electrical properties of AKT3 are modulated by Ca2+ ions and pH changes within the physiological range. Unlike other cloned plant K+ inward-rectifying channels, AKT3 is inhibited by external Ca2+ and extracellular acidification.
Weak Voltage Control.
The AKT3 channel is a structural homolog of AKT1 and KAT1, showing ≈60% amino acid identity in the S1–S6 region (14). In particular, the transmembrane domains (including the S4 segment, which is proposed to represent the major voltage sensor) are highly similar in sequence. Nevertheless, the voltage-dependent gating of AKT3 differs markedly from that of AKT1, SKT1, and KAT1. The latter channels show strong inward rectification with apparent activation threshold voltages more negative than −80 mV and thus do not conduct K+ in the steady state during depolarization (Fig. 2D; refs. 19, 27, and 28). In contrast, the voltage-dependent gating behavior of AKT3 is less pronounced, leaving a sizable fraction of AKT3 channels open at depolarized voltages (Figs. 2 and 4).
Ca2+ Sensitivity.
The membrane electric field is not a very potent regulator of the AKT3 activity (Fig. 2). As a result, the AKT3 channel is able to conduct both inward and outward currents. In the presence of additional regulatory factors acting on AKT3, the plant cell may be able to promote either K+ uptake or release by regulating K+ channel activity at hyperpolarized or depolarized potentials. Our results suggest that one possible modifier of the AKT3 transport activity in vivo might be extracellular Ca2+. A rise in the external Ca2+ level inhibited the AKT3 currents. The voltage dependence of the block indicates that the Ca2+ binding site may be located within the pore of AKT3 (Fig. 3). As determined for the exudation sap of various mono- and dicotyledons, the apoplastic Ca2+ concentration can reach a high millimolar range (0.2–14 mM Ca2+; ref. 29). A sensitivity of in vivo K+ inward rectifiers to apoplastic Ca2+ have already been reported for different species and tissues (4, 6, 25, 26). The effect of external Ca2+ on the cloned guard cell channels KAT1 and KST1, however, was not measurable or was very weak (18, 21, 30, 31). In contrast to KAT1 and KST1, but comparable to the K+ uptake channels in native guard cells (26), the voltage-dependent Ca2+ block of AKT3 channels was easily detectable at 10–30 mM Ca2+ (Fig. 3). The Ca2+ block of AKT3 is likely to be even more effective at physiological concentration such as 1 mM K+ and 3 mM Ca2+, because Dietrich et al. (26) observed an increase in the strength of Ca2+ inhibition of K+ channels in vivo with decreasing K+ levels.
Unique pH Regulation.
In addition to Ca2+, protons modulate the AKT3 channel. Extracellular acidification reduced the macroscopic conductance level, which can be accounted for by a decrease in the single-channel slope conductance (Figs. 4 and 6). We cannot yet exclude that protons may also be able to slowly permeate the AKT3 channels, hindering the K+ permeation. So far, the pH effect on the macroscopic AKT3 current is only consistent with one observation: an inward-rectifying K+ channel from Arabidopsis cultured cells was found to be acid-inhibited (32). The decrease in macroscopic inward currents was not caused by a shift in the activation threshold voltage, suggesting that the underlying mechanism of proton action may be similar to that in AKT3. Because suspension culture cells are dedifferentiated cells, the cellular origin of this inward-rectifying K+ channel is unknown. Thus, this channel type cannot be correlated to a particular tissue. In contrast, all other plant K+ inward rectifiers, such as the native guard cell K+-uptake channel from Vicia faba and the cloned guard cell K+ channels KST1 and KAT1, are activated by extracellular acidification based on a change in their voltage-dependent gating behavior (20, 22, 23, 26, 30, 33, 34). A histidine residue conserved in the pore region of all cloned inward-rectifying K+ channels was identified to be involved in pH sensing of KST1 but not in KAT1 (23, 35). In addition, the KST1-specific residue H160 in the S3–S4 linker and the pore residue D269 contribute to pH sensing in KST1. The inverted pH sensitivity of AKT3 suggests that the mechanism of pH perception and transduction in AKT3 is different and may require other or additional residues to the pore histidine.
Physiological Role of AKT3.
The genomic sequences of the uniquely designated Arabidopsis channels AKT2 and AKT3 are identical (14, 17). In contrast to AKT2, the protein sequence of AKT3 was deduced from a full-length cDNA clone that extends to the transcriptional start site of the gene mapped by a 5′ rapid amplification of cDNA ends (RACE) analysis (14). Compared with the AKT3 channel, the predicted AKT2 channel protein contains 14 additional amino acid residues at its N terminus (17). By using the AKT2 construct from Cao et al. (17), expression was only observed in Escherichia coli but not in Xenopus oocytes, yeast, or insect cells (17, 36). Recently, only a modified AKT2 construct yielding a channel identical to AKT3 (37) showed transport activity in Xenopus oocytes. However, Baizabal-Aquirre et al. (37) erroneously removed the instantaneous AKT3 currents by application of the p/4-leak subtraction method, a procedure that leaves the voltage-dependent fraction of the AKT3 channels only. The AKT3 homologs VFK1 and ZMK2 cloned from V. faba and Zea mays, respectively, show a similar expression pattern in the vascular system, are inhibited by extracellular acidification, and are also weakly voltage-dependent (P.A., K. Philippar, and R.H., unpublished data). These observations suggest that AKT3 belongs to a plant K+ channel subfamily that is characterized by phloem expression and phloem-related regulatory properties. Because of its unique channel properties, AKT3 might play diverse roles in the phloem. These AKT3 properties, however, may be modulated when the AKT3 α-subunits form heteromers with other K+ channel α-subunits (37, 38). In addition to membrane potential, external protons, and Ca2+ ions, the AKT3 channel activity depends on cytoplasmic factors as indicated by the rundown behavior on patch excision (Fig. 5). So far, we can only speculate about the physiological function of AKT3 in the vascular system because information about e.g., the K+, H+, Ca2+-concentrations in the apoplast and the sieve tube of A. thaliana under sink/source conditions are not yet available. AKT3 could be important for charge balance and osmotic adaptation during assimilate transport. In addition, AKT3 could also reestablish the membrane potential that depolarizes during a phloem-propagating action potential by mediating K+ efflux (12). Future studies concerning the ionic composition and membrane potential during phloem loading/unloading in Arabidopsis, the isolation of phloem protoplasts and exploration of their electrical properties, and the AKT3 expression pattern within the phloem and AKT3 knock-out plants will give further insights into the physiological role of this quite unique K+ channel type.
Acknowledgments
We thank V. Avdonin for providing igor pro macros and patch machine and J. Thommandru and K. Neuwinger for technical assistance. This work was supported in part by the Human Frontier Science Program to I.M. (LT380/95), the National Institutes of Health to T.H. (GM51474), and the Deutschen Forschungsgmeinschaft to R.H. (1640/11).
Note Added in Proof
Recently, C. S. Bauer and R.H. recognized AKT3-like whole-cell and single-channel currents in protoplasts derived from major veins.
References
- 1.Jeschke W D, Pate J S. J Exp Bot. 1991;42:1105–1116. [Google Scholar]
- 2.Marschner H, Kirkby E A, Engels C. Bot Acta. 1997;110:265–273. [Google Scholar]
- 3.Gaymard F, Pilot G, Lacombe B, Bouchez D, Bruneau D, Boucherez J, Michaux-Ferriere N, Thibaud J-B, Sentenac H. Cell. 1998;94:647–655. doi: 10.1016/s0092-8674(00)81606-2. [DOI] [PubMed] [Google Scholar]
- 4.Roberts S K, Tester M. Plant J. 1995;8:811–825. [Google Scholar]
- 5.Wegner L H, Raschke K. Plant Physiol. 1994;105:799–813. doi: 10.1104/pp.105.3.799. [DOI] [PMC free article] [PubMed] [Google Scholar]
- 6.Wegner L H, De Boer A H, Raschke K. J Membr Biol. 1994;142:363–379. doi: 10.1007/BF00233442. [DOI] [PubMed] [Google Scholar]
- 7.Fromm J, Eschrich W. Plant Physiol Biochem. 1989;27:577–585. [Google Scholar]
- 8.Kinraide T B, Newmann I A, Etherton B. Plant Physiol. 1984;76:806–813. doi: 10.1104/pp.76.3.806. [DOI] [PMC free article] [PubMed] [Google Scholar]
- 9.Van Bel A J E. Plant Mol Biol. 1993;44:253–281. [Google Scholar]
- 10.Lohaus G, Winter H, Riens B, Heldt H W. Bot Acta. 1995;108:270–275. [Google Scholar]
- 11.Mengel K, Haeder H-E. Plant Physiol. 1977;59:282–284. doi: 10.1104/pp.59.2.282. [DOI] [PMC free article] [PubMed] [Google Scholar]
- 12.Fromm J, Bauer T. J Exp Bot. 1994;45:463–469. [Google Scholar]
- 13.Sambrook J, Fritsch E F, Maniatis T. Molecular Cloning: A Laboratory Manual. 2nd Ed. Plainview, NY: Cold Spring Harbor Lab. Press; 1989. [Google Scholar]
- 14.Ketchum K A, Slayman C W. FEBS Lett. 1996;378:19–26. doi: 10.1016/0014-5793(95)01417-9. [DOI] [PubMed] [Google Scholar]
- 15.Hoshi T. J Gen Physiol. 1995;105:309–328. doi: 10.1085/jgp.105.3.309. [DOI] [PMC free article] [PubMed] [Google Scholar]
- 16.Woodhull A M. J Gen Physiol. 1973;61:687–708. doi: 10.1085/jgp.61.6.687. [DOI] [PMC free article] [PubMed] [Google Scholar]
- 17.Cao Y, Ward J M, Kelly W B, Ichida A M, Gaber R F, Anderson J A, Uozumi N, Schroeder J I, Crawford N M. Plant Physiol. 1995;109:1093–1106. doi: 10.1104/pp.109.3.1093. [DOI] [PMC free article] [PubMed] [Google Scholar]
- 18.Müller-Röber B, Ellenberg J, Provart N, Willmitzer L, Busch H, Becker D, Dietrich P, Hoth S, Hedrich R. EMBO J. 1995;14:2409–2416. doi: 10.1002/j.1460-2075.1995.tb07238.x. [DOI] [PMC free article] [PubMed] [Google Scholar]
- 19.Zimmermann S, Talke I, Ehrhardt T, Nast G, Müller-Röber B. Plant Physiol. 1998;116:879–890. doi: 10.1104/pp.116.3.879. [DOI] [PMC free article] [PubMed] [Google Scholar]
- 20.Hedrich R, Moran O, Conti F, Busch H, Becker D, Gambale F, Dreyer I, Kuch A, Neuwinger K, Palme K. Europ Biophys J. 1995;24:107–115. doi: 10.1007/BF00211406. [DOI] [PubMed] [Google Scholar]
- 21.Becker D, Dreyer I, Hoth S, Reid J D, Busch H, Lehnen M, Palme K, Hedrich R. Proc Natl Acad Sci USA. 1996;93:8123–8128. doi: 10.1073/pnas.93.15.8123. [DOI] [PMC free article] [PubMed] [Google Scholar]
- 22.Blatt M R. J Gen Physiol. 1992;99:615–644. doi: 10.1085/jgp.99.4.615. [DOI] [PMC free article] [PubMed] [Google Scholar]
- 23.Hoth S, Dreyer I, Dietrich P, Becker D, Müller-Röber B, Hedrich R. Proc Natl Acad Sci USA. 1997;94:4806–4810. doi: 10.1073/pnas.94.9.4806. [DOI] [PMC free article] [PubMed] [Google Scholar]
- 24.Fairley-Grenot K A, Assmann S M. J Membr Biol. 1992;128:103–113. doi: 10.1007/BF00231883. [DOI] [PubMed] [Google Scholar]
- 25.Thiel G, Brudern A, Gradmann D. J Membr Biol. 1996;49:9–20. doi: 10.1007/s002329900002. [DOI] [PubMed] [Google Scholar]
- 26.Dietrich P, Dreyer I, Wiesner P, Hedrich R. Planta. 1998;205:277–287. [Google Scholar]
- 27.Schachtman D P, Schroeder J, Lucas W J, Anderson J A, Gaber R F. Science. 1992;258:1654–1658. doi: 10.1126/science.8966547. [DOI] [PubMed] [Google Scholar]
- 28.Gaymard F, Cerutti M, Horeau C, Lemaillet G, Urbach S, Ravallec M, Devauchelle G, Sentenac H, Thibaud J-B. J Biol Chem. 1996;271:22863–22870. doi: 10.1074/jbc.271.37.22863. [DOI] [PubMed] [Google Scholar]
- 29.Atkinson C J, Ruiz L P, Mansfield T A. J Exp Bot. 1992;43:1315–1324. [Google Scholar]
- 30.Brüggemann L, Dietrich P, Dreyer I, Hedrich R. Planta. 1999;207:370–376. doi: 10.1007/s004250050494. [DOI] [PubMed] [Google Scholar]
- 31.Dreyer I, Becker D, Bregante M, Gambale F, Palme K, Hedrich R. FEBS Lett. 1998;430:370–376. doi: 10.1016/s0014-5793(98)00694-2. [DOI] [PubMed] [Google Scholar]
- 32.Giromini L, Camattari G, Cerana R, Colombo R. J Plant Physiol. 1997;151:682–688. [Google Scholar]
- 33.Ilan N, Schwartz A, Moran N. J Membr Biol. 1996;154:169–181. doi: 10.1007/s002329900142. [DOI] [PubMed] [Google Scholar]
- 34.Roelfsema M R G, Prins H B A. Planta. 1998;205:100–112. doi: 10.1007/s004250050301. [DOI] [PubMed] [Google Scholar]
- 35.Hoth S, Hedrich R. J Biol Chem. 1999;274:11599–11603. doi: 10.1074/jbc.274.17.11599. [DOI] [PubMed] [Google Scholar]
- 36.Uozumi N, Nakamura T, Schroeder J I, Muto S. Proc Natl Acad Sci USA. 1998;95:9773–9778. doi: 10.1073/pnas.95.17.9773. [DOI] [PMC free article] [PubMed] [Google Scholar]
- 37.Baizabal-Aguirre V M, Clemens S, Uozumi N, Schroeder J I. J Membr Biol. 1999;167:119–125. doi: 10.1007/s002329900476. [DOI] [PubMed] [Google Scholar]
- 38.Dreyer I, Antunes S, Hoshi T, Müller-Röber B, Palme K, Pongs O, Reintanz B, Hedrich R. Biophys J. 1997;72:2143–2150. doi: 10.1016/S0006-3495(97)78857-X. [DOI] [PMC free article] [PubMed] [Google Scholar]


