

Abstract
The Scurfy mutation of the FoxP3 gene (FoxP3 sf) in the mouse and analogous mutations in human result in lethal autoimmunity. The mutation of FoxP3 in the hematopoietic cells impairs the development of regulatory T cells. In addition, development of the Scurfy disease also may require mutation of the gene in nonhematopoietic cells. The T cell–extrinsic function of FoxP3 has not been characterized. Here we show that the FoxP3sf mutation leads to defective thymopoiesis, which is caused by inactivation of FoxP3 in the thymic stromal cells. FoxP3 mutation also results in overexpression of ErbB2 in the thymic stroma, which may be involved in defective thymopoiesis. Our data reveal a novel T cell–extrinsic function of FoxP3. In combination, the T cell–intrinsic and –extrinsic defects provide plausible explanation for the severity of the autoimmune diseases in the scurfy mice and in patients who have immunodysregulation, polyendocrinopathy, enteropathy, and X-linked syndrome.
A long-standing, but poorly understood, paradox in immunology is the link between defective T cell production in the thymus and T cell–dependent autoimmune diseases. Thus, in the human, DiGeorge syndrome can lead to autoimmune diseases (1–5); thymoma is commonly associated with myasthenia gravis (6, 7), whereas thymic hypoplasia is associated with autoimmune hemolytic anemia and juvenile pemphigoid (8). The diabetes-prone BB rats have severe defects in thymocyte development because of mutations of the IAN gene family members (9, 10).
Mutations of the FoxP3 gene are responsible for the spontaneous autoimmune diseases that are observed in patients who have immunodysregulation, polyendocrinopathy, enteropathy, X-linked syndrome (IPEX) and scurfy mice (11–14). Studies have revealed that FoxP3 gene expression in CD4 lymphocytes is essential for the development and function of CD4+CD25+ regulatory T cells (T reg cells) (15–17). However, several lines of evidence also suggest that defective T reg cell development alone may be insufficient to initiate such severe autoimmune diseases as those observed in scurfy mice and IPEX patients. Thus, irradiation chimeras using bone marrow from scurfy mice demonstrated that the defective FoxP3 expression in the hematopoietic cells did not lead to the development of autoimmune disease (18). Second, transgenic expression of WT FoxP3 under the lck promoter did not rescue the autoimmunity in scurfy mice, although it is unclear whether modest elevation of the FoxP3 gene in the spleen of one founder line can restore T reg cell function fully (19).
T lymphocytes are produced in the thymus through an ordered process. Upon their arrival in the thymus, T cell precursors divide rapidly before their expression of the CD4 and CD8 coreceptors on the cell surface (20). Based on the cell surface expression of CD44 and CD25 markers, the development of double negative (DN) thymocytes can be divided into 4 stages (21). DN1 expresses CD44, but not CD25. With the expression of CD25, the DN1 T cells enter into the DN2, which expresses CD25 and CD44, and actively divide. The DN2 cells diminish the expression of CD44 and enter into the DN3 stage. With the rearrangement of the TCRβ gene, the DN3 cells enter into the second and most active wave of division and maturate into DN4 cells, which are characterized by down-regulation of CD25. The DN4 T cells are the direct precursors of CD4−CD8+ immature single positive T cells (22), which are believed to differentiate into CD4+CD8+ T cells that express functional TCRαβ genes and undergo TCR ligand-based positive and negative selection (23). Only the T cells that succeed in both selections are allowed to mature and populate the peripheral lymphoid organs. Despite the clear delineation of the developmental pathway, the molecular mechanisms by which the thymic epithelial cells control thymopoiesis remains poorly understood.
Here we report that the Scurfy mutation of FoxP3 leads to thymic atrophy, which is mainly the result of the diminished DN thymocyte proliferation. This phenomenon is due to the FoxP3 mutation in the nonhematopoietic lineages. Furthermore, defective thymopoiesis correlates with overexpression of ErbB2 in the thymic stroma, an event that is known to cause the thymic atrophy (24). FoxP3 represses expression of the ErbB2 gene in a thymic epithelial cell line. These results reveal a novel T cell–extrinsic role of FoxP3 in stromal cells for the development of T cells.
RESULTS
Defective thymopoiesis rather than accelerated death of thymocytes leads to reduced thymic cellularity of FoxP3sf mice
The hemizygous FoxP3 sf male mice usually dies between 18–25 d of age (unpublished data). We examined the mice at 1 or 2 wk of age, and found that thymii of the mutant mice were atrophic. The number of thymocytes in the FoxP3 sf mice was reduced by twofold on day 7 and by about threefold on day 15 (Fig. 1 a). On day 7, the major thymocyte subsets were present, although a small reduction of double positive (DP) thymocytes was found. Corresponding to this, the percentages of CD4+CD8−, CD4−CD8+, and CD4− CD8− populations were increased when compared with normal littermates (Fig. 1 b). Because the thymic cellularity was reduced by about threefold, there was no increase in the number of mature T cells in the thymus.
Figure 1.

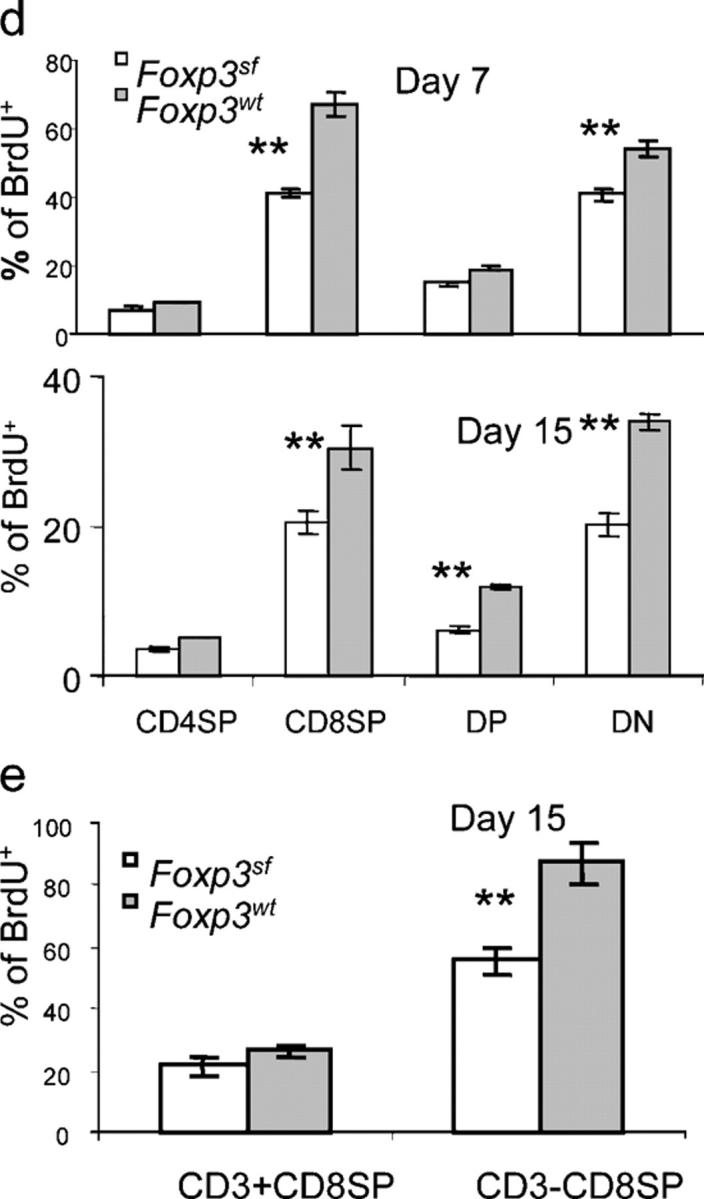

Abnormal thymopoiesis in the FoxP3 sf mice. (a) Progressive reduction of thymic cellularity in the BALB/c. FoxP3 sf mice. Numbers represent the mean cell number ± SEM per thymus. The number of mice examined: day 7–9, FoxP3 sf n = 5, WT n =8; day15–18, FoxP3 sf n =10, WT n = 12. (b) Thymocyte subsets based on expression of CD4 and CD8 markers. Thymii were isolated on days 7–9 or days 15–18 after birth, and analyzed by flow cytometry. Data shown are representative profiles of day-15 mice. (c) Proliferation of thymocyte subsets. Representative line graphs of thymocytes and their subpopulations of mice at day 15. The numbers represent the percentages of BrdU+ cells in each subpopulation. Mice at day 7 or 15 of age were injected i.p. with BrdU (1 mg/mouse) 3 h before sacrifice. Thymocytes were stained with PE– or PerCP–Cy5.5-conjugated anti–mouse CD4 and allophycocyanin-conjugated anti-mouse CD8 mAbs, then intracellularly with FITC-conjugated anti-BrdU antibody, and were analyzed by flow cytometry. (d) Summary of BrdU incorporation data of major thymocyte subsets. Data shown are mean percentages ± SEM. The top panel shows the data from 7-d-old mice (FoxP3 sf mice, n = 5; WT littermates n = 7); the bottom panel depicts the data of 15-d-old mice (FoxP3 sf mice, n =10; normal littermates, n = 12). (e) As in (d), except that the CD8+CD4− thymocytes were divided into CD3+ and CD3− subsets. (f) BrdU incorporation of DN thymocytes at four stages. DN1: CD44+CD25−; DN2: CD44+CD25+; DN3: CD44−CD25+; DN4: CD44−CD25−. (g) Summary of BrdU+ percentage among DN1–4. Data represent mean ± SEM (FoxP3 sf mice, n = 10; WT, n=12). (h) FACS profiles of DN thymocytes of 15-d-old FoxP3sfmice. Thymocytes from FoxP3 sf or WT littermates were stained by CD4, CD8, CD25, and CD44. The DN thymocytes were divided based on expression of CD44 and CD25. (i) Cell size of the mutant thymocytes at different DN stages compared with WT littermates, as indicatd by their forward scatters (FCS). Data are representative of four independent experiments.
Proliferation and apoptosis shape thymic cellularity (25). To explore the possible contributions of apoptosis, flow cytometric analysis of Annexin V+ cells was performed on ex vivo thymocytes that were isolated from mice on days 7 and 15 after birth (Fig. S1, available at http://www.jem.org/cgi/content/full/jem.20050157/DC1). The percentage of Annexin V+ thymocytes in scurfy mice was comparable to that in WT littermates. These data indicate that thymic atrophy in the FoxP3 sf mice probably is not due to increased apoptosis of the thymocytes.
We then examined the proliferation of thymocytes in FoxP3 sf mice. Scurfy mice and their littermates were injected with nucleotide analogue bromodeoxyuridine (BrdU) at 3 h before sacrifice, and BrdU incorporation was measured by flow cytometry after surface staining for CD4 and CD8 expression and intracellular staining for BrdU incorporation. As shown in Fig. 1 (c and d), the percentage of BrdU+ thymocytes was substantially lower in FoxP3 sf mice than that in normal littermates. Analysis of thymocyte subsets revealed that BrdU incorporation was reduced significantly in CD4+CD8+ DP (day 15 only), CD4−CD8− DN, and single positive (SP) CD4−CD8+ thymocytes (Fig. 1, d and e). Consistent with the previous report, most of the BrdU-labeled CD8 SP T cells in WT mice had no or lower levels of cell surface CD3/TCR (22). The division of this immature subset was repressed significantly in the FoxP3 sf mice. In contrast, only a minor reduction was observed among the more mature SP cells with high levels of TCR, regardless of whether they were CD4+SP or CD8+SP (Fig. 1, d and e). Thus, the FoxP3 sf mice have significant defects in the proliferation of immature T cells.
DN thymocytes differentiate sequentially through the DN1 (CD25−CD44+), DN2 (CD25+CD44+), DN3 (CD25+CD44−), and DN4 (CD25−CD44−) subsets; the proliferation of DN thymocytes is most prominent in the DN2 and DN4 stages. The most significant reduction of BrdU incorporation was observed in the DN4 stage, although DN2 thymocytes in the FoxP3 sf mice also had less proliferation (Fig. 1, f and g). Proliferation of the DN1 and DN3 thymocytes was not reduced significantly. Moreover, compared with WT littermates, the distribution of DN subsets also was altered greatly in the mutant mice. In the FoxP3 sf mice, the DN1 population was expanded, whereas the DN4 population was reduced significantly (Fig. 1 h). In addition, consistent with the reduced proliferation, the size of the DN4 thymocytes from the FoxP3 sf mice was significantly smaller than those from WT mice (Fig. 1 i). Together, our results revealed that defective proliferation of immature thymocytes is responsible for thymic atrophy in the FoxP3 sf mice.
Reduced thymopoiesis in the FoxP3 sf mice is independent of T cell activation in the periphery and is extrinsic to bone marrow–derived cells
Because the FoxP3 sf mice have ongoing T cell activation in the periphery, it is possible that such activation can affect thymopoiesis indirectly. To address this issue, we produced Rag-2 − / − FoxP3 sf mice. Rag-2 − / − FoxP3 wt mice expressed low, but detectable levels, of FoxP3 mRNA, and perhaps because of RNA instability that is associated with the frame-shift mutation, the mutant FoxP3 sf mice have further reduced levels of FoxP3 mRNA (Fig. 2, a and b). Because Rag deficiency arrests thymocyte development at the DN3 stage, one can study the effect of the mutations on thymocyte development up to the DN3 stage in the absence of peripheral T cell activation. The thymocyte subsets (Fig. 2, c and d) and BrdU incorporation (Fig. 2, e and f) were altered significantly in the Rag-2 − / − FoxP3 sf mice in comparison with the Rag-2 − / − mice. The alterations in the DN1–3 subsets were similar to what were found in Rag-2 + / + FoxP3 sf mice, particularly the expansion of DN1 thymocytes. Thus, the changes in the DN1–3 stages and diminished proliferation of DN thymocytes were independent of T cell activation in the periphery.
Figure 2.


Abnormal thymopoiesis in the FoxP3 sf Rag2−/− mice. (a and b) Expression of the FoxP3 gene in the BALB/c. Rag-2 − / − and BALB/c. Rag-2 − / − FoxP3 sf thymus, as determined by real-time PCR. A typical PCR profile is shown in (a); the summary data, including three mice per group, is shown in (b). Each sample was analyzed in triplicate. (c–f) The impact of FoxP3 mutation on the DN development. 5-wk-old BALB/c.Rag2 − / − FoxP3 sf mice received an injection of BrdU (1 mg/mouse) 6 h before sacrifice. (c) FACS profiles of the thymocytes from FoxP3 sf Rag2 − / − or FoxP3 wt Rag2− / − recipients. (d) BrdU incorporation at different stages. Data are representative of two independent experiments involving three Rag2 − / − FoxP3 sf mice and five Rag 2 −/− FoxP3 wt mice. Representative profile (e) and summary (f) of BrdU incorporation data from two independent experiments involving three mutant and five WT mice.
To study the impact of the FoxP3 mutation in the stroma cells on the development of DN thymocytes, we transferred bone marrow from BALB/c transgenic mice that express GFP into sublethally irradiated Rag-2 − / − or Rag-2 − / − FoxP3 sf mice. 6 wk after the transfer, we analyzed the proliferation and the development of GFP+ thymocytes. As demonstrated in Fig. 3 a, the CD4- and CD8-expressing thymocytes that developed with FoxP3 sf stroma were normal compared with FoxP3 wt stroma. However, analysis of DN thymocytes by CD25 and CD44 markers revealed significant increases in DN2 and DN3, and a significant reduction in DN4 (Fig. 3, b and c). In addition, proliferation of DN thymocytes also was reduced in the mutant recipients. In two independent experiments, the BrdU incorporation was lower in the Rag-2 − / − FoxP3 sf mice as compared with their Rag-2 − / − FoxP3 wt littermates. Although the baseline proliferation was different in the two experiments, perhaps as a result of the age of recipients and the time of analysis, the reduction was statistically significant (P = 0.019) in a pair-wise comparison between WT and mutant siblings (Fig. 3, d and e). Furthermore, in the mutant recipient, DN2 and DN4 thymocytes also had reduced blasting cells compared with the WT recipient (Fig. 3 f). These results demonstrate that the mutation of FoxP3 in the thymic stroma cells is sufficient to cause defective DN thymocyte development.
Figure 3.

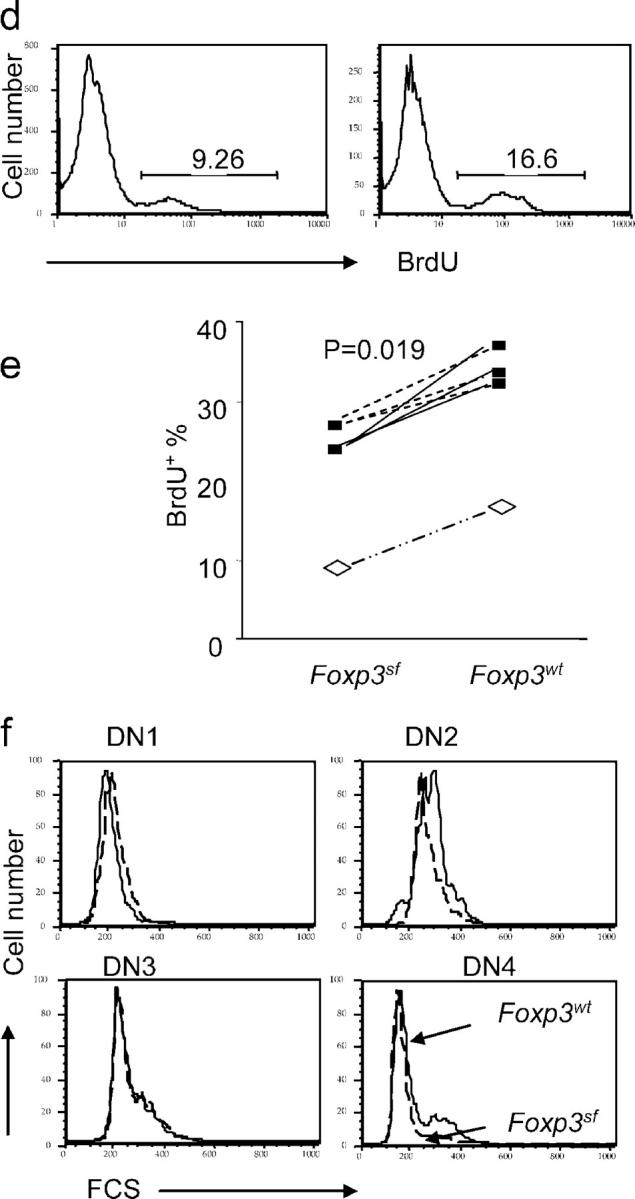
FoxP3 defect in thymic stroma cells leads to defective thymopoiesis. 5 × 10⁶ T cell–depleted bone marrow cells from GFP transgenic mice were transferred into 3- or 4-wk-old Rag-2 −/− FoxP3 sf mice or Rag-2 −/− FoxP3 wt littermates, which received sublethal irradiation (500 rad) 1 d before transplantation. 5 or 6 wk after the transplantation, the donor thymocytes were gated based on GFP expression. Thymocyte subsets based on expression of CD4/CD8 (a), and DN subsets based on CD25/CD44 markers (b). Representative FACS profiles (a and b) and summary data from two independent experiments (c) are shown. (d and e) BrdU incorporation of DN of donor (GFP+) origin. Representative FACS profile (d) and summary data (e) from two independent experiments are presented. In experiment 1 (open symbols), the recipients are 4-wk-old at the time of reconstitution, and were analyzed at 6 wk after reconstitution; in experiment 2 (solid symbols), the recipients were 3-wk-old at the time of reconstitution, and were analyzed 5 wk later. The two-related sample Wilcoxon test was used to examine the statistical significance of the difference between WT and mutant littermate recipients. (f) Cell size of GFP+ DN thymocytes at different stages. All data have been repeated in 2 independent experiments involving 3 FoxP3 sf Rag-2−/− and 5 FoxP3 wt Rag-2−/− mice.
To test whether FoxP3 mutation in the bone marrow cells also contributes to defective thymopoiesis, we transferred T cell–depleted bone marrow from Thy1.1+ WT or Thy1.1 FoxP3 sf BALB/c mice into separate Rag-2 − / − recipients, which received 500 rad of γ-irradiation before reconstitution. At 10 wk after reconstitution, the chimera mice were killed and analyzed. At this point, >95% of thymocytes and spleen cells were of donor origin (unpublished data). The number of thymocytes in the mice that received FoxP3 sf bone marrow was comparable to that in the mice that received WT bone marrow (unpublished data). The distribution of thymocyte subsets as revealed by CD4 and CD8 markers also was unaffected. More importantly, no appreciable effect was observed in the DN1–DN4 subsets and BrdU incorporation. Thus, proliferation and the development of DN thymocytes were unaffected (Fig. 4 a). Therefore, defective FoxP3 expression in hematopoietic lineages is not sufficient to cause defective thymopoiesis. In the periphery, an increased number of T cells were found in the spleen and lymph nodes of mice that were reconstituted with mutant bone marrow (unpublished data). However, the activation status and rate of proliferation were comparable between the two types of chimeras (Fig. 4 b).
Figure 4.

Normal thymopoiesis of WT and FoxP3 sf bone marrow reconstituted Rag-2 −/− mice. T cell–depleted bone marrow cells from Thy1.1+ FoxP3 sf mice or WT littermates were transferred into sublethally (500 rad) irradiated Thy1.2+ Rag-2 − / − mice. 10 wk after the transfer, thymocytes were harvested and their cellularity, proliferation, and subset distribution were analyzed. (a) Subsets of total thymocytes (top), DN (middle), and BrdU incorporation of DN thymocytes (bottom) over a 3-h period. (b) Activation and proliferation of spleen T cells. Top, distribution of CD4 and CD8 T cells subsets. Note the increase in the proportion of T cells when bone marrow is from the FoxP3 sf mice. Middle, activation status as revealed by CD44 and CD62L. Bottom, incorporation of BrdU over a 3-h period. Data shown are profiles of Thy1.1+ cells, which account for >95% of spleen T cells and thymocytes, and are from a representative mouse in an experiment involving two mice per group. Essentially identical results were obtained when C57BL/6.FoxP3 sf bone marrow cells were used to reconstitute the irradiated C57BL/6.Rag-1 − / − mice and when BALB/cFoxP3 sfOtcspf mice bone marrow was used to reconstitute the BALB/cRag-2 − / − mice.
Consistent with previous observations (18), all of the chimera consisting of mutant bone marrow and irradiated WT host survived significantly longer than did the mutant scurfy mice (Fig. 5). When killed for analysis at 8–10 wk, the healthy mice showed increased cellularity in the lymph nodes (not depicted), although we did not observe increased activation markers on the T cells in these chimeras (Fig. 4 b). In the C57BL/6 background, all eight chimeras survived the entire period of observation (Fig. 5 a). In the BALB/c background—except for those mice that were killed for analysis—recipients of FoxP3 sf bone marrow succumbed between 8 and 20 wk after transplantation (Fig. 5 b). The difference in survival between these two strains is unclear. However, analysis of moribund mice revealed extremely small thymii and reduced cellularity in the peripheral lymphoid organs. Thus, these moribund mice did not have the typical pathologic changes that are observed in the scurfy mice (i.e., increased lymph proliferation). However, the T cells in the moribund mice were highly activated. Because bone marrow did contain a small number of T cells, it is unclear whether the pathogenic T cells were generated in the scurfy donor or in the WT recipients. Because the delay and/or ablation of diseases cannot be accounted for by the 3–4 wk that is required for the generation of T cells in chimera mice to the level seen in newborn mice, it seems that the Scurfy mutation of FoxP3 in the hematopoietic cells did not result in the full spectrum of polyclonal T cell activation and pathogenicity that is typical of scurfy mice (26).
Figure 5.

Bone marrow cells from the FoxP3 sf mice either fail or have diminished ability to transfer autoimmune diseases to the Rag-deficient syngeneic host. Data shown are the survival of scurfy mice or syngeneic Rag-deficient mice that received bone marrow cells from the scurfy mice in C57BL/6 (a) or BALB/c (b) background. Kaplan-Meier analyses were used to compare the two groups. P values of the log rank test are presented. One accidental death at 3 wk in the BALB/c group was excluded from the analysis. Some mice have not been observed throughout the experiments because the experiments are ongoing or because they were used to analyze T cell development. These samples were marked as censored (+) in the Kaplan-Meier curves.
Together, these data demonstrate that the FoxP3 sf defects in nonhematopoietic tissues are necessary and sufficient for reduced thymopoiesis. In contrast, the defects in bone marrow–derived cells are neither necessary nor sufficient for the thymopoietic defects that are described herein. The significant delay in onset and incidence of autoimmune diseases in the chimera mice are consistent with the notion that mutation of FoxP3 in the non-T host cells may be essential for the development of autoimmune diseases. At the least, the T cell–extrinsic defects help to exacerbate autoimmune diseases in the scurfy mice.
Expression of the FoxP3 gene in the thymic epithelial cells
We have shown that a defective FoxP3 gene in nonhematopoietic thymic cells mediated thymopoiesis defects. This suggests that FoxP3 must be expressed in some types of thymic stromal cells. We took two approaches to detect FoxP3 expression in the thymic stromal cells. First, we separated thymocytes into CD45+ and CD45− compartments by MACS beads. The thymic epithelial cells were isolated from the CD45− compartment based on their binding to monoclonal antibody G8.8 (27) (Fig. 6 a). After two rounds of FACS sorting of the CD45−G8.8+ epithelial cells to near 100% purity, expression of FoxP3 in the CD45+ thymocytes and the CD45−G8.8+ thymic epithelial cells was quantitated by real-time PCR. As shown in Fig. 6 b, the highly purified CD45−G8.8+ cells have ∼2–20-fold more FoxP3 mRNA compared with CD45+ cells, depending on the housekeeping genes used. The FoxP3 mRNA was not due to T cell contamination, because the expression of the CD3ζ chain was barely detectable in the epithelial population.
Figure 6.

FoxP3 expression in thymic epithelial cells. Thymii from 4–6-wk-old WT mice were digested with Collagenase/Dispase to prepare single-cell suspensions. The cells were stained with anti–CD45.2-PE and unlabeled G8.8. The CD45+ cells (99% pure) were isolated with anti–PE-MACS beads. After extensive depletion of MACS+ cells, we added FITC-conjugated anti–rat IgG2a to the CD45− population. The CD45−G8.8+ cells were sorted twice using the FACS Vantage. (a) FACS profiles that show expression of CD45 and G8.8 of total cell preparation (upper left), purified CD45+ cells (lower left), remaining cells after depletion of CD45+ cells (upper right), and the sorted CD45−G8.8+ epithelial cells (lower right). (b) FoxP3 and CD4 expression in the thymic epithelial cells (CD45–G8.8+) compared with the CD45+ population as measured by real-time PCR. To normalize the cell numbers, the ratios of FoxP3 or CD4 mRNA and that of housekeeping gene Hprt or β-actin are presented. Expression of the CD3ζ chain was used to mark potential T cell contamination. Data shown are means and SEM of triplicates from two independent experiments. (c) Immunofluorescence staining of the thymus sections for cortical epithelial marker Cytokeretin 8 (K8, left panels) and for FoxP3 protein (as determined by rhodamine-conjugated goat anti–rabbit IgG, middle panels); merged images are presented in the right panels. The cortex regions are shown. Medulla epithelial cells show no FoxP3 staining (not depicted). Top panels are specificity controls that show an absence of FoxP3 protein in the thymus of FoxP3 sf mice. Lower panels show 40× image of the area boxed in the middle panels. The K8+FoxP3+ cells are indicated by arrows. (d) Expression of FoxP3 and CD4 in thymic epithelial cells as revealed by flow cytometry. Lower panels show the staining profile of CD45 and G8.8; thymic epithelial cells are defined in the CD45−G8.8+gate. The upper panels show line graphs depicting the distribution of CD4 or Foxp3 expression (solid lines). Isotype controls (iso) are shown as dotted lines. The circles in the bottom panels show gates of epithelial cells. Data are representative of two or three independent experiments.
To locate the expression pattern of FoxP3 protein in various types of cells in the thymus, we produced affinity-purified rabbit anti-FoxP3 antibodies (Fig. S2, available at http://www.jem.org/cgi/content/full/jem.20050157/DC1). To determine whether FoxP3 was present in the thymic epithelial cells, we costained FoxP3 with cortical epithelial cell marker K8 and/or medullar epithelial K5. A small, but considerable, number of epithelial cells in the cortex (Fig. 6 c), but not in the medulla, expressed FoxP3 protein. The specificity of the staining was confirmed, because the thymus from the FoxP3 sf mice was negative for FoxP3 protein. In contrast, no K5+FoxP3+ cells were found in the medulla (unpublished data). The immunohistochemical data were corroborated by flow cytometry using a monoclonal anti-FoxP3 antibody (Fig. 6 d). Mouse thymic epithelial cells also expressed significant levels of CD4 mRNA (Fig. 6 b) and protein (Fig. 6 d). Thus, in addition to its expression in the lymphocyte lineages as others have reported, FoxP3 was detected in CD45− stromal cells, with high levels found among a small number of cortical epithelial cells. This expression pattern is consistent with the effect of FoxP3 mutation on the development of immature thymocytes that reside primarily in the cortex.
FoxP3 suppresses expression of ErbB2
Abnormal expressions of several molecules affect thymopoiesis, including overexpression of ErbB2 (24) and targeted mutation of IL-7 (28). As shown in Fig. 7 a, no significant difference in IL-7 expression was observed in 7- and 15-d-old FoxP3 sf thymii when compared with thymii from WT littermates. In contrast, expression of ErbB2 mRNA was elevated significantly in thymii of the FoxP3 sf mice, as revealed by real-time PCR (Fig. 7 b). To determine whether FoxP3 can suppress the expression of the ErbB2 gene in the thymic epithelial cells, we transfected the thymic epithelial cell lines 6.1.7 with FoxP3 cDNA, and analyzed ErbB2 expression 3 d after transfection. We found that the ErbB2 expression level in the 6.1.7 cells was reduced by fivefold with the ectopic expression of FoxP3 (Fig. 7 c). Thus, the FoxP3 expression in the thymus epithelial cell line directly suppresses expression of the ErbB2 gene. To determine whether FoxP3 represses ErbB2 promoter activity, we cloned the 500-bp ErbB2 promoter (29–31) into a pGL-2 luciferase reporter vector, and transiently transfected the reporter, in conjunction with FoxP3 or vector control, into 6.1.7. As shown in Fig. 7 d, FoxP3 cDNA repressed the ErbB2 promoter activity by two- to fivefold in a dose-dependent manner.
Figure 7.

FoxP3 maintains thymopoiesis by repressing expression of ErbB2. Real-time PCR analyses of IL-7 (a) or ErbB2 (b) expression in the WT and FoxP3 sf thymii at different ages. Data shown are the means ± SEM. Day 7: FoxP3 sf, n = 5, WT, n = 4; Day 15: FoxP3 sf, n = 3, WT, n = 3. (c) Real-time PCR analysis of ErbB2 expression in the thymic epithelial cell line 6.1.7 after transient transfection of FoxP3 cDNA. The transfectants were selected with blasticidin (5 μg/ml) to remove untransfected cells. After removing nonadherent dead cells, mRNA was isolated and quantitated by real-time PCR. Data are representative of two independent experiments, using either Hprt or β-actin as housekeeping gene. (d) FoxP3 represses Her-2 promoter. Data shown are summary of two independent experiments, depicting relative promoter activity with vector control arbitrarily defined as 1.0.
DISCUSSION
FoxP3 is a major regulator for the development and function of CD25+CD4+ T reg cells (15–17). This function requires expression of FoxP3 in the T cell lineages. Although the Scurfy mutation in the non-T cells seems to be necessary for the pathogenesis of the disease in the mice (18), the immunologic basis for a T cell–extrinsic function of FoxP3 has not been identified. We show here that the FoxP3 mutation result in significantly reduced thymic cellularity. This reduction is due to defective proliferation of immature T cells, which is caused by FoxP3 defects in the thymic stroma, but not in the T cells. Our systematic analysis of the proliferation of thymocyte subsets revealed that FoxP3 mutation primarily affects proliferation of immature T cells, including those of DN2 and DN4, the major stages of thymocyte proliferation, and to a less extent, immature single positive and DP thymocytes. In addition, increased apoptosis of thymocytes did not seem to contribute to reduced thymic cellularity, at least at early ages (<2 wk). This is very different from the reduced thymic cellularity that is associated with peripheral T cell activation, which can cause the nonspecific deletion of DP thymocytes (32). Consistent with these findings, the thymic abnormalities that we observed in the scurfy mice have not been reported in other lymphoproliferative disease models, such as CTLA4 KO mice (33–35). Moreover, analysis of Rag-2 − / − FoxP3 sf mice demonstrated that the defects in the DN1–DN3 thymocytes cannot be due to peripheral T cell activation. In addition, in chimera mice that were reconstituted with WT bone marrow cells, generation of DN4 and proliferation of DN thymocytes was compromised in the FoxP3 sf RAG-2−/− host. To our knowledge, this is the first direct demonstration of FoxP3 function in overall T cell development, and is a direct link between FoxP3 expressed in thymic stromal cells and the proliferation of immature T cells. In addition to their diminished proliferation, we also found the subset distribution of the DN thymocytes was affected significantly by FoxP3 mutation. This is characterized by the increased DN1 and reduced DN4 populations. However, both changes can be explained by defective proliferation at DN2 and DN4.
An important question is whether the defective thymopoiesis in the mutant mice contributes to the pathogenesis of disease in the scurfy mice and patients who have IPEX. Theoretically, reduced production of new T cells may stimulate lymphoproliferation that is characteristic of the scurfy mice, although additional studies are needed to establish such a link. It remains controversial whether mutation of FoxP3 in the T cell lineage is necessary and sufficient to cause lethal autoimmune diseases. More than 10 yr ago, it was demonstrated that adoptive transfer of bone marrow cells from nude scurfy mice into SCID mice or irradiated syngeneic mice failed to transfer autoimmune diseases (18, 36, 37). Likewise, we have observed substantial survival irradiation chimera of the Rag-deficient mice that were reconstituted with FoxP3 sf bone marrow. Conversely, recent work by Fontenot et al. (38) demonstrated that when CD4 promoter–driven Cre induced deletion of FoxP3 in the FoxP3 flox/flox in transgenic mice, they developed the full spectrum of Scurfy disease. However, although Cre under the CD4 promoter induced gene deletion in the T cell lineage, its impact on the thymic epithelial cells has not been studied. Our data demonstrate that the CD4 gene is expressed in mouse thymic epithelial cells.
Finally, although the FoxP3 gene has features of transcription factors, its down-stream targets have not been identified. Our data reveal ErbB2 as one of its molecular targets, because the ErbB2 gene is overexpressed in the thymic stromal cells. Conversely, transfection of FoxP3 represses expression of ErbB2 in the thymic epithelial cell lines, at least in part, by transcriptional repression. Our results are consistent with two previous studies that support a critical role for ErbB2 in thymopoiesis. First, transgenic expression of ErbB2 under the keratin promoter, which resulted in overexpression of HER-2 in skin and thymic epithelial cells, leads to thymic atrophy (24). Therefore, overexpression of ErbB2, as a result of FoxP3 mutation, may contribute to thymic atrophy. Second, a recent study revealed that mice with targeted mutation of the Stat-3 gene also showed reduced thymopoiesis, increased ErbB2 expression, and thymic atrophy (39). Our studies with cross-reactive anti–HER-2 antibodies indicated that overexpression of ErbB2 contributed to defective thymopoiesis (Fig. S3, available at http://www.jem.org/cgi/content/full/jem.20050157/DC1).
Taken together, our results reveal the first non-T cell intrinsic function of FoxP3; it serves as a novel checkpoint for thymopoiesis. Combined T cell–intrinsic and –extrinsic defects provide a plausible explanation for the severity of autoimmune diseases in the scurfy mice and patients who have IPEX.
MATERIALS AND METHODS
Animals.
Thy1.1 BALB/c mice with mutation of FoxP3 (FoxP3 sf) were produced after more than 12 generations of backcross in the University of North Carolina. They were maintained under specific pathogen-free conditions at the University Laboratory Animal Resources at the Ohio State University for the duration of the study. Male Rag-2 − / − FoxP3 sf mice were generated by breeding female FoxP3 sf/+ heterozygous BALB/c mice with male Rag-2 − / − mice. The genotype of the FoxP3 gene was determined by allele-specific PCR (11). Primers specific for mutant FoxP3 gene include forward primer (5′-TCAGGCCTCAATGGACAAAAG-3′), reverse primer (5′-AACTATTGCCATGGCTTCC-3′) and complementary depository oligonucleotides (5′-CTTGTCCATTGAGGCTGAG-3′). The primers specific for the WT FoxP3 gene were forward primer (5′-CTCAGGCCTCAATGGACAAG-3′), reverse (5′-AACTATTGCCATGGCTTCC-3′) and complementary depository oligonucleotides (5′-CTTTTGRCCATTGAGGC-3′). The complementary depository oligonucleotides were used to improve the reliability of allele-specific PCR (40). Male FoxP3 sf or FoxP3 sfOtcspf mice and normal gender-matched littermates were used in some experiments. Animal studies were approved by the Institutional Review Board of the Ohio State University.
Thymocyte apoptosis.
Cell viability of thymocyte subsets was determined by flow cytometry with PE-conjugated anti–mouse CD4 and allophycocyanin (APC)-conjugated anti–mouse CD8 mAbs, and then FITC-conjugated Annexin V. Apoptotic cells were identified as Annexin V+.
BrdU incorporation and measurement.
Mice were injected i.p. with nucleotide analog bromodeoxyuridine (BrdU; 1 mg/mouse in 100 μl PBS) 3 h before sacrifice, except where indicated. The mice were killed, and single thymocytes and spleen cells were prepared. BrdU incorporation was detected by flow cytometry with a BrdU Flow Kit, as described by the manufacturer (BD Biosciences). In brief, thymocytes or spleen cells were stained with various surface markers, then the cells were fixed, treated with DNase (Sigma-Aldrich), and stained with FITC-conjugated or APC-conjugated anti-BrdU mAb (clone 3D4) or FITC-conjugated mouse IgG1.
Bone marrow chimera.
For the bone marrow reconstitution, 6–8-wk-old Rag2 − / − BALB/c mice received 500 rad of γ-irradiation 1 d before transplantation. Bone marrow cells from FoxP3 sf or the WT littermates were purified, and T cells were depleted using anti-CD4 (GK1.5) and anti-CD8 (2.4.3) antibodies followed by DYNAL Beads (Dynal) as described by manufacturer. After the deletion, the CD3+ cells within the bone marrow were always <2%. 8 × 10⁶ bone marrow cells were transferred into the recipients by i.v. injection. At 10 wk after the reconstitution, mice were killed and lymphocytes were analyzed as indicated.
For the bone marrow reconstitution of FoxP3 sf or FoxP3 wt Rag-2−/− mice, all of the mice were given 500 rad irradiation 1 d before reconstitution, and received 5 × 10⁶ T cell–depleted bone marrow cells from BALB/c GFP transgenic mice. 6 wk after the reconstitution, mice were killed and their thymocytes and splenocytes were analyzed as indicated.
Real-time PCR.
Real-time PCR was done using the QuantiTect SYBR green PCR kit (QIAGEN) in an ABI PRISM 7700 cycler (Applied Biosystems) according to manufacturers' protocols. In brief, 1 μg total RNA was pretreated with RNase-free DNase I (Invitrogen) to eliminate contaminating genomic DNA and was reverse transcribed using Superscriptase II (Invitrogen) and oligo(dT) in a 20-μl reaction. 1 μl cDNA was used in each 25-μl PCR reaction, and all samples were run in triplicate. All PCR products were analyzed by annealing curves as well as 2% agarose gel and contained only one amplicon with the correct size. The primers were as follows: FoxP3, 5′-GGCCCTTCTCCAGGACAG-3′ and 5′-GCTGATCATGGCTGGGTTGT-3′; ErbB2, 5′-TGAGAAATGCAGCAAGCCCT-3′ and 5′-AATGCCAGGCTCCCAAAGAT-3′; HPRT: 5′-AGCCTAAGATGAGCGCAAGT-3′ and 5′-TTACTAGGCAGATGGCCACA-3′; β-actin 5′-GATC-TGGCACCACACCTTCT-3′ and 5′-GGGGTGTTGAAGGTCTCAAA-3′; CD4, 5′-TCTGCATCCTCTGTGTC-3′ and 5′-GCACTGGCAGGTCTTCTTCT-3′; CD3 zeta chain, 5′-TCTGCTGGATCCCAAACTCT-3′ and 5′-TGCACTCCTGCTGAATTTTG-3′.
Purification of thymic epithelial cells.
Thymii from 4–8-wk-old BALB/c mice were cut into small pieces and stirred for 30 min at 4°C to reduce thymocytes. The fragments remaining were digested by 1 mg/ml Collagenase/Dispase (Roche) plus 1 mg/ml Dnase I (Sigma-Aldrich) successively for three 15-min incubations. Single-cell suspensions went through the Percoll gradient (1.07, 1.045, 1.03, 1.0), and the upper two layers of cells were collected. Those cells were stained with CD45.2 APC, and G8.8 (BD Biosciences), followed by FITC-conjugated anti–rat IgG2a (BD Biosciences). Two rounds of FACS sorting were used to purify CD45+G8.8− thymocytes and CD45−G8.8+ epithelial cells.
FACS staining of thymic epithelial cells.
Thymus from young adult mice was digested as described above. Cells from the last two digestions were combined and incubated with 2.4G2 hybridoma supernatants for 20 min at 4°C to block the FcR. The cells were stained with G8.8 (Rat IgG2a) and CD45 APC (BD Biosciences) followed by FITC-conjugated anti–rat IgG2a (BD Biosciences). Excess FTIC anti–rat IgG2a antibody was blocked by incubating with purified rat IgG for 20 min. Intracellular staining was conducted using PE-conjugated anti-FoxP3 (FJK-16S) or isotype control as described by the manufacturer (eBioscience). For surface CD4 staining, cells were incubated with PE-conjugated anti-CD4 (GK1.5, IgG2b) or rat IgG2b isotype control at 4°C for 30 min.
Transfection.
Mouse thymic epithelial cell line 6.1.7 was transfected by the pcDNA3-FoxP3 or the vector alone using Fugene 6 (Roche). 24 h after transfection, blasticidin (10 μg/ml) was added to deplete the untransfected cells. 72 h after the selection, cells were harvested and expression of HER-2 was detected by real-time PCR.
Luciferase reporter assay.
104 cells/well of thymic epithelial cells were seeded in 24-well plates. 0.2 μg luciferase construct that contained a 500-bp ErbB2 promoter and 0.02 μg of pRL-TK (Promega) were transiently cotransfected with 0.2 μg, 0.5 μg, and 1 μg FoxP3 expression plasmid or the pcDNA3 vector, respectively. After incubation for 48 h, the cells were harvested with Passive Lysis Buffer (Promega); luciferase activities of cell extracts were measured with the use of the Dual Luciferase Assay System (Promega).
Statistical analysis.
Unless otherwise noted, most data were analyzed with two-tailed Student's t test. *P < 0.05, significant; **P < 0.01, highly significant.
Online supplemental material
Fig. S1 shows analysis of thymocyte apoptosis by annexin V staining. Fig. S2 displays the production and characterization of anti-FOXP3 antibodies. Fig. S3 shows that Her-2 blockade partially rescues thymopoiesis in scurfy mice. Online supplemental material is available at http://www.jem.org/cgi/content/full/jem.20050157/DC1.
Acknowledgments
We thank Dr. L. Wang for assistance with statistical analyses and L. Shaw for editorial assistance.
This study was supported by grants from the National Institutes of Health and the Department of Defense prostate cancer initiative.
The authors have no conflicting financial interests.
Abbreviations used: BrdU, nucleotide analog bromodeoxyuridine; DN, double negative; DP, double positive; IPEX, immunodysregulation, polyendocrinopathy, enteropathy, X-linked syndrome; sf, scurfy; SP, single positive; spf, sparse fur; T reg, regulatory T cell.
References
- 1.Kratz, C.P., T. Niehues, S. Lyding, A. Heusch, G. Janssen, and U. Gobel. 2003. Evans syndrome in a patient with chromosome 22q11.2 deletion syndrome: a case report. Pediatr. Hematol. Oncol. 20:167–172. [DOI] [PubMed] [Google Scholar]
- 2.Pelkonen, P., P. Lahdenne, R. Lantto, and V. Honkanen. 2002. Chronic arthritis associated with chromosome deletion 22q11.2 syndrome. J. Rheumatol. 29:2648–2650. [PubMed] [Google Scholar]
- 3.Davies, K., E.R. Stiehm, P. Woo, and K.J. Murray. 2001. Juvenile idiopathic polyarticular arthritis and IgA deficiency in the 22q11 deletion syndrome. J. Rheumatol. 28:2326–2334. [PubMed] [Google Scholar]
- 4.Kawamura, T., I. Nimura, M. Hanafusa, R. Fujikawa, M. Okubo, G. Egusa, and M. Amakido. 2000. DiGeorge syndrome with Graves' disease: a case report. Endocr. J. 47:91–95. [DOI] [PubMed] [Google Scholar]
- 5.Sullivan, K.E., D.M. McDonald-McGinn, D.A. Driscoll, C.M. Zmijewski, A.S. Ellabban, L. Reed, B.S. Emanuel, E.H. Zackai, B.H. Athreya, and G. Keenan. 1997. Juvenile rheumatoid arthritis-like polyarthritis in chromosome 22q11.2 deletion syndrome (DiGeorge anomalad/velocardiofacial syndrome/conotruncal anomaly face syndrome). Arthritis Rheum. 40:430–436. [DOI] [PubMed] [Google Scholar]
- 6.Davis, S., and M.J. Schumacher. 1979. Myasthenia gravis and lymphoma. A clinical and immunological association. JAMA. 242:2096–2097. [PubMed] [Google Scholar]
- 7.Gerli, R., R. Paganelli, A. Cossarizza, C. Muscat, G. Piccolo, D. Barbieri, S. Mariotti, D. Monti, O. Bistoni, E. Raiola, et al. 1999. Long-term immunologic effects of thymectomy in patients with myasthenia gravis. J. Allergy Clin. Immunol. 103:865–872. [DOI] [PubMed] [Google Scholar]
- 8.Bloomfield, S., G. Stockdill, and R.S. Barnetson. 1982. Thymic hypoplasia, auto-immune haemolytic anaemia and juvenile pemphigoid in an infant. Br. J. Dermatol. 106:353–355. [DOI] [PubMed] [Google Scholar]
- 9.MacMurray AJ, DH Moraljo, AE Kwitek, EA Rutledge, B Van Yserloo, P Gohlke, SJ Speros, B Snyder, J Schaefer, S Bieg, et al. 2002. Lymphopenia in the BB rat model of type 1 diabetes is due to a mutation in a novel immune-associated nucleotide (Ian)-related gene. Genome Res. 12:1029–1039. [DOI] [PMC free article] [PubMed] [Google Scholar]
- 10.Hornum, L., J. Romer, and H. Markholst. 2002. The diabetes-prone BB rat carries a frameshift mutation in Ian4, a positional candidate of Iddm1. Diabetes. 51:1972–1979. [DOI] [PubMed] [Google Scholar]
- 11.Brunkow, M.E., E.W. Jeffery, K.A. Hjerrild, B. Paeper, L.B. Clark, S.A. Yasayko, J.E. Wilkinson, D. Galas, S.F. Ziegler, and F. Ramsdell. 2001. Disruption of a new forkhead/winged-helix protein, scurfin, results in the fatal lymphoproliferative disorder of the scurfy mouse. Nat. Genet. 27:68–73. [DOI] [PubMed] [Google Scholar]
- 12.Chatila, T.A., F. Blaeser, N. Ho, H.M. Lederman, C. Voulgaropoulos, C. Helms, and A.M. Bowcock. 2000. JM2, encoding a fork head-related protein, is mutated in X-linked autoimmunity-allergic dysregulation syndrome. J. Clin. Invest. 106:R75–81. [DOI] [PMC free article] [PubMed] [Google Scholar]
- 13.Bennett, C.L., J. Christie, F. Ramsdell, M.E. Brunkow, P.J. Ferguson, L. Whitesell, T.E. Kelly, F.T. Saulsbury, P.F. Chance, and H.D. Ochs. 2001. The immune dysregulation, polyendocrinopathy, enteropathy, X-linked syndrome (IPEX) is caused by mutations of FOXP3. Nat. Genet. 27:20–21. [DOI] [PubMed] [Google Scholar]
- 14.Wildin, R.S., F. Ramsdell, J. Peake, F. Faravelli, J.L. Casanova, N. Buist, E. Levy-Lahad, M. Mazzella, O. Goulet, L. Perroni, et al. 2001. X-linked neonatal diabetes mellitus, enteropathy and endocrinopathy syndrome is the human equivalent of mouse scurfy. Nat. Genet. 27:18–20. [DOI] [PubMed] [Google Scholar]
- 15.Khattri, R., T. Cox, S.A. Yasayko, and F. Ramsdell. 2003. An essential role for Scurfin in CD4+CD25+ T regulatory cells. Nat. Immunol. 4:337–342. [DOI] [PubMed] [Google Scholar]
- 16.Hori, S., T. Nomura, and S. Sakaguchi. 2003. Control of regulatory T cell development by the transcription factor FoxP3. Science. 299:1057–1061. [DOI] [PubMed] [Google Scholar]
- 17.Fontenot, J.D., M.A. Gavin, and A.Y. Rudensky. 2003. FoxP3 programs the development and function of CD4+CD25+ regulatory T cells. Nat. Immunol. 4:330–336. [DOI] [PubMed] [Google Scholar]
- 18.Godfrey, V.L., J.E. Wilkinson, E.M. Rinchik, and L.B. Russell. 1991. Fatal lymphoreticular disease in the scurfy (sf) mouse requires T cells that mature in a sf thymic environment: potential model for thymic education. Proc. Natl. Acad. Sci. USA. 88:5528–5532. [DOI] [PMC free article] [PubMed] [Google Scholar]
- 19.Khattri, R., D. Kasprowicz, T. Cox, M. Mortrud, M.W. Appleby, M.E. Brunkow, S.F. Ziegler, and F. Ramsdell. 2001. The amount of scurfin protein determines peripheral T cell number and responsiveness. J. Immunol. 167:6312–6320. [DOI] [PubMed] [Google Scholar]
- 20.Huesmann, M., B. Scott, P. Kisielow, and H. von Boehmer. 1991. Kinetics and efficacy of positive selection in the thymus of normal and T cell receptor transgenic mice. Cell. 66:533–540. [DOI] [PubMed] [Google Scholar]
- 21.Ceredig, R., and T. Rolink. 2002. A positive look at double-negative thymocytes. Nat. Rev. Immunol. 2:888–897. [DOI] [PubMed] [Google Scholar]
- 22.Zuniga-Pflucker, J.C., and M.J. Lenardo. 1996. Regulation of thymocyte development from immature progenitors. Curr. Opin. Immunol. 8:215–224. [DOI] [PubMed] [Google Scholar]
- 23.von Boehmer, H. 1990. Developmental biology of T cells in T cell-receptor transgenic mice. Annu. Rev. Immunol. 8:531–556. [DOI] [PubMed] [Google Scholar]
- 24.Bol, D., K. Kiguchi, L. Beltran, T. Rupp, S. Moats, I. Gimenez-Conti, J. Jorcano, and J. DiGiovanni. 1998. Severe follicular hyperplasia and spontaneous papilloma formation in transgenic mice expressing the neu oncogene under the control of the bovine keratin 5 promoter. Mol. Carcinog. 21:2–12. [PubMed] [Google Scholar]
- 25.Rathmell, J.C., and C.B. Thompson. 2002. Pathways of apoptosis in lymphocyte development, homeostasis, and disease. Cell. 109(Suppl):S97–107. [DOI] [PubMed] [Google Scholar]
- 26.Godfrey, V.L., B.T. Rouse, and J.E. Wilkinson. 1994. Transplantation of T cell-mediated, lymphoreticular disease from the scurfy (sf) mouse. Am. J. Pathol. 145:281–286. [PMC free article] [PubMed] [Google Scholar]
- 27.Farr, A., A. Nelson, J. Truex, and S. Hosier. 1991. Epithelial heterogeneity in the murine thymus: a cell surface glycoprotein expressed by subcapsular and medullary epithelium. J. Histochem. Cytochem. 39:645–653. [DOI] [PubMed] [Google Scholar]
- 28.Rodewald, H.R., K. Kretzschmar, W. Swat, and S. Takeda. 1995. Intrathymically expressed c-kit ligand (stem cell factor) is a major factor driving expansion of very immature thymocytes in vivo. Immunity. 3:313–319. [DOI] [PubMed] [Google Scholar]
- 29.Scott, G.K., C.H. Chang, K.M. Erny, F. Xu, W.J. Fredericks, F.J. Rauscher, A.D. Thor, and C.C. Benz. 2000. Ets regulation of the erbB2 promoter. Oncogene. 19:6490–6502. [DOI] [PubMed] [Google Scholar]
- 30.Xing, X., S.C. Wang, W. Xia, Y. Zou, R. Shao, K.Y. Kwong, Z. Yu, S. Zhang, S. Miller, L. Huang, and M.C. Hung. 2000. The ets protein PEA3 suppresses ErbB2 overexpression and inhibits tumorigenesis. Nat. Med. 6:189–195. [DOI] [PubMed] [Google Scholar]
- 31.Hurst, H.C. 2001. Update on HER-2 as a target for cancer therapy the ERBB2 promoter and its exploitation for cancer treatment. Breast Cancer Res. 3:395–398. [DOI] [PMC free article] [PubMed] [Google Scholar]
- 32.Martin, S., and M.J. Bevan. 1997. Antigen-specific and nonspecific deletion of immature cortical thymocytes caused by antigen injection. Eur. J. Immunol. 27:2726–2736. [DOI] [PubMed] [Google Scholar]
- 33.Waterhouse, P., J.M. Penninger, E. Timms, A. Wakeham, A. Shahinian, K.P. Lee, C.B. Thompson, H. Griesser, and T.W. Mak. 1995. Lymphoproliferative disorders with early lethality in mice deficient in Ctla-4. Science. 270:985–988. [DOI] [PubMed] [Google Scholar]
- 34.Chambers, C.A., T.J. Sullivan, and J.P. Allison. 1997. Lymphoproliferation in CTLA-4-deficient mice is mediated by costimulation-dependent activation of CD4+ T cells. Immunity. 7:885–895. [DOI] [PubMed] [Google Scholar]
- 35.Zheng, X., J.X. Gao, X. Chang, Y. Wang, Y. Liu, J. Wen, H. Zhang, J. Zhang, and P. Zheng. 2004. B7-CD28 interaction promotes proliferation and survival but suppresses differentiation of CD4-CD8- T cells in the thymus. J. Immunol. 173:2253–2261. [DOI] [PubMed] [Google Scholar]
- 36.Godfrey, V.L., B.T. Rouse, and J.E. Wilkinson. 1994. Transplantation of T cell-mediated, lymphoreticular disease from the scurfy (sf) mouse. Am. J. Pathol. 145:281–286. [PMC free article] [PubMed] [Google Scholar]
- 37.Godfrey, V.L., J.E. Wilkinson, and L.B. Russell. 1991. X-linked lymphoreticular disease in the scurfy (sf) mutant mouse. Am. J. Pathol. 138:1379–1387. [PMC free article] [PubMed] [Google Scholar]
- 38.Fontenot, J.D., J.P. Rasmussen, L.M. Williams, J.L. Dooley, A.G. Farr, and A.Y. Rudensky. 2005. Regulatory T cell lineage specification by the forkhead transcription factor foxp3. Immunity. 22:329–341. [DOI] [PubMed] [Google Scholar]
- 39.Sano, S., Y. Takahama, T. Sugawara, H. Kosaka, S. Itami, K. Yoshikawa, J. Miyazaki, W. van Ewijk, and J. Takeda. 2001. Stat3 in thymic epithelial cells is essential for postnatal maintenance of thymic architecture and thymocyte survival. Immunity. 15:261–273. [DOI] [PubMed] [Google Scholar]
- 40.Imyanitov, E.N., K.G. Buslov, E.N. Suspitsin, E. Kuligina, E.V. Belogubova, M.Y. Grigoriev, A.V. Togo, and K.P. Hanson. 2002. Improved reliability of allele-specific PCR. Biotechniques 33:484, 486, 488 passim. [DOI] [PubMed]