

Abstract
Stem cells reside in a specialized niche that regulates their abundance and fate. Components of the niche have generally been defined in terms of cells and signaling pathways. We define a role for a matrix glycoprotein, osteopontin (OPN), as a constraining factor on hematopoietic stem cells within the bone marrow microenvironment. Osteoblasts that participate in the niche produce varying amounts of OPN in response to stimulation. Using studies that combine OPN-deficient mice and exogenous OPN, we demonstrate that OPN modifies primitive hematopoietic cell number and function in a stem cell–nonautonomous manner. The OPN-null microenvironment was sufficient to increase the number of stem cells associated with increased stromal Jagged1 and Angiopoietin-1 expression and reduced primitive hematopoietic cell apoptosis. The activation of the stem cell microenvironment with parathyroid hormone induced a superphysiologic increase in stem cells in the absence of OPN. Therefore, OPN is a negative regulatory element of the stem cell niche that limits the size of the stem cell pool and may provide a mechanism for restricting excess stem cell expansion under conditions of niche stimulation.
The stem cell niche is a specialized microenvironment that houses and regulates the stem cell pool. In lower organisms, the niche incorporates elements that support a primitive or stem cell phenotype, as well as components that enforce terminal differentiation and end cell cycling among stem cell progeny. In this way, the Drosophila melanogaster germ cell niche both nurtures and constrains stem cells, maintaining strict control on stem cell number (1, 2). Whether the same is true for mammalian stem cell niches has not been well defined. Components of stem cell niches have generally been defined in terms of cells and molecular pathways. In the murine hematopoietic stem cell niche, we and Zhang et al. demonstrated that the osteoblast is a major niche constituent (3, 4). We showed that activation of the osteoblast by parathyroid hormone (PTH)-R activation could increase stem cell numbers mediated by Notch1. Zhang et al determined that deleting BMPR1a similarly increased osteoblasts and caused an increase in stem cells. In both cases, the increase in hematopoietic stem cells was no more than twofold. Such an increase was demonstrated to have a physiologic importance of surprising uniformity given the varying means of osteoblast activation.
We examined whether an osteoblast product could account for this restriction on the stem cell pool size and chose the osteoblast product osteopontin (OPN) for several reasons. OPN (also known as early T cell activation gene-1, or eta-1), is a secreted, highly acidic glycoprotein with pleiotropic effects (5–11). OPN binds to cells through an arginine-glycine-aspartate–mediated interaction with integrins and non–arginine-glycine-aspartate–mediated interactions with CD44, activating multiple and varied signaling pathways. Stem cells are known to express CD44 and α4 integrin, both of which are receptors capable of interacting with OPN (12, 13). Within bone, OPN is expressed prominently at sites of bone remodeling and at cell-lined bone surfaces such as the endosteum, providing a potential context for stem cells encountering this glycoprotein (14). The absence of OPN does not affect bone morphology, trabecular spaces associated with stem cell localization, or osteoblasts under homeostatic conditions (15). In addition to being produced by cells of osteoblastic lineage, OPN has been shown to play important roles in chemotaxis, adhesion, and proliferation, all of which allow it to mediate inflammation and immunity to infectious diseases (16–19). For example, granulomatous responses are associated with high levels of OPN expression (16, 17, 20) and OPN can function as a Th1 cell cytokine, enhancing IL-12 while inhibiting expression of the Th2 cell cytokine IL-10 (17, 19, 21). Furthermore, OPN can alter the sensitivity of hematopoietic cells to other cytokine stimuli (22). We reasoned that the potential for OPN to affect stem cell function in the niche was great given its abundance in the proper geographic location, its receptor expression on stem cells, and the evidence for it affecting processes in other cells that might be relevant for stem cell physiology.
We previously reported that OPN production is modulated by osteoblast stimulation in vivo, resulting in dramatically increased OPN abundance in the areas adjacent to trabecular bone known to serve as the anatomic location of hematopoietic stem cells (3, 4). These data indicated that OPN is produced in a regulated manner, a characteristic that would be expected of a physiologic mediator of niche function. We therefore examined the role of OPN in the hematopoietic stem cell niche using genetically engineered mice and exogenous OPN. We report that mice deficient in OPN have an increased stem cell pool size in vivo. Without OPN, there was no notable change in stem cell cycling, but there was an increased expression of two ligands known to modify stem cell function—the Notch1 ligand (Jagged1) and the Tie-2 ligand (Angiopoietin-1)—accompanied by a decreased rate of stem cell apoptosis. Adding OPN to primitive cells ex vivo directly increased their apoptotic fraction. The ability of OPN to restrict stem cell numbers was emphasized under conditions of osteoblast stimulation with PTH in which the expansion of stem cells was increased in the absence of OPN. Therefore, OPN provides a constraining function on stem cell numbers in the hematopoietic stem cell niche and may provide a dampening effect to prevent excess stem cell expansion during periods of niche stimulation.
Results
Bone marrow OPN production is altered by PTHR activation on osteoblasts
To validate that OPN is produced in a modulated manner at sites relevant for hematopoiesis, we performed immunohistochemistry on tibia sections either from wild-type animals or from animals with the activation of the PTHR. To focus specifically on the osteoblast production of OPN, we used mice transgenic for a constitutively active PTHR driven by the osteoblast-specific collagenα1(I) promoter. Production of OPN in the marrow cavity under normal homeostatic conditions was generally in immediate proximity to spindle-shaped osteoblasts lining trabecular bone surfaces (Fig. 1). In contrast, with activated PTHR, OPN staining was markedly increased and extended diffusely from the trabecular surface into the interstitium surrounding hematopoietic cells (Fig. 1). We previously demonstrated that osteoblasts were producing this increased OPN using a combination of in situ hybridization and immunohistochemistry (23). However, we noted that other hematopoietic cells can also express OPN in response to cytokine stimuli (Fig. S1, available at http://www.jem.org/cgi/content/full/jem.20041992/DC1). Collectively, these data indicate that OPN is produced in varying amounts with the resulting varied distribution affected by cell stimulation. Our demonstration of varied OPN production by the known niche constituent, the osteoblast, provides support to further investigate the role of OPN in bone marrow homeostasis.
Figure 1.
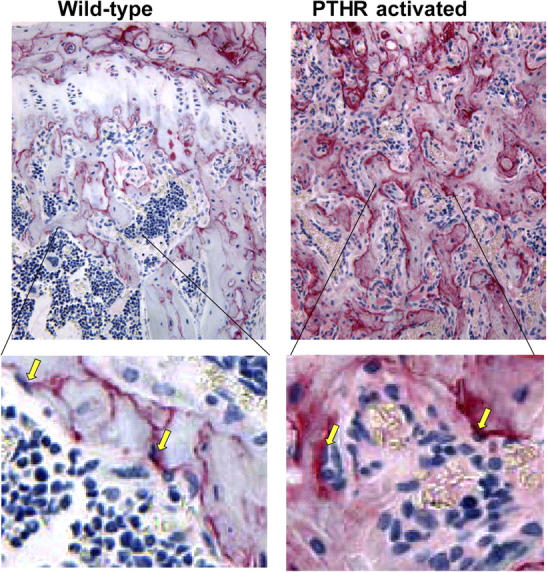
OPN is increased in bone marrow with the activation of osteoblasts. Immunohistochemistry of tibia sections from wild-type (left) or littermate transgenic (right) mice with a constitutively activated PTH/parathyroid related peptide receptor driven by a 2.3-kb fragment of the collagenα1(I) promoter as previously described (reference 4). Sections were stained with antibody to osteopontin (red) and counterstained as described (reference 4), and photographed at 200× (top) with ∼4× image zoom (bottom). Yellow arrows indicate OPN-rich spindle shaped cells lining the trabecular bone that is consistent with an osteoblast morphology.
Expanded primitive cell pool in OPN-deficient mice
Initially, we characterized the bone marrow hematopoietic compartment under steady-state conditions using animals engineered to be deficient in OPN or their wild-type littermates as controls (15). The total cellularity (OPN+/+, 54.4 ± 4.7 × 10⁶ cells and OPN−/−, 51.4 ± 3.8 × 10⁶ cells; P = 0.31, n = 9) and the proportion of differentiated cells such as B- and T-lymphocytes, granulocytes, or erythroid cells were not altered in the absence of OPN (Fig. 2 B). Therefore, OPN deficiency has minimal impact on the steady state of more mature blood elements and similarly modest changes in precursor populations as determined by quantitating cells without mature lineage markers (lin−; absolute numbers: OPN+/+, 2.6 × 10⁶ ± 0.2; and OPN−/−, 3.0 × 10⁶ ± 0.3 per femur; P = 0.16, n = 8) or with markers of differentiating erythroblasts (Ter119/CD71) or B cells (B220/IgM− or B220/IgM+; Fig. S2, available at http://www.jem.org/cgi/content/full/jem.20041992/DC1). However, flow cytometric analyses revealed significantly more primitive cells in the stem cell–enriched Sca1+c-kit+lin− cells in OPN-deficient mice compared with controls (OPN+/+, 1.44 ± 0.26% vs. OPN−/−, 2.64 ± 0.58%; P = 0.03, n = 8) (absolute number: 2.92 ± 0.55 × 10⁴ vs. 4.68 ± 1.12 × 10⁴ per femur pair; P = 0.02, n = 8; Fig. 2 C; reference 24). Within the Sca1+c-kit+lin− population, the CD34− subset has been defined to further purify cells capable of long-term reconstitution; we found that these cells were also considerably increased in the OPN-deficient animals (P = 0.02, n = 8; Fig. 2 D; reference 25).
Figure 2.

Primitive hematopoietic cells are increased in the bone marrow of OPN−/− mice, whereas mature cells are not. (A) Bone marrow cells of OPN+/+ (littermate control) and OPN−/− mice were harvested, counted, and stained with the lineage-specific markers CD8, CD4, B220, Mac1 (CD11b), Gr-1, and Ter119 before flow cytometry. The graph shows the mean percentage ± SEM (n = 3). Bone marrow cells of OPN+/+ and OPN−/− mice were stained with Sca1, c-kit, and lineage markers (CD3, CD4, CD8, B220, Gr-1, CD11b, and Ter119) for flow cytometry. The dot plots show the Sca1+c-kit+ cells (top right) gated on lin− bone marrow cells for a single experiment (B) and for a summary of six mice in each group (C). (D) The highly stem cell–enriched CD34− portion of the Sca1+c-kit+lin− cells was evaluated in eight pairs of OPN+/+ (littermate control) and OPN−/− mice by flow cytometry. The absolute number was calculated and is shown. (E) To confirm the immuno-phenotypic findings, we performed LTC-IC assays at limiting dilution and calculated the frequency of LTC-ICs. The data shown are the mean frequency ± SEM of LTC-ICs per 100,000 bone marrow cells (P = 0.01, n = 5 pairs). (F) To confirm the LTC-IC data, we transplanted equal numbers of OPN-deficient (Ly5.2) and wild-type (Ly5.1) bone marrow of congenic mice into lethally irradiated wild-type recipients in a CRA. 12 wk after transplantation, the bone marrows of the recipient mice were analyzed for the contribution of Ly5.2 and Ly5.1 cells by flow cytometry with results shown (n = 8).
To assess the impact on cells defined by function, we initially performed colony assays using the methylcellulose colony-forming cell (CFC) assay for progenitors. A significantly lower number of CFCs in the bone marrow of OPN−/− mice were noted (OPN+/+, 30.6 ± 4.1 vs. OPN−/−, 19.05 ± 2.9 colonies per 104 bone marrow cells; P = 0.025, n = 5). As a measure of more primitive cells, we performed long-term cultures (LTCs) on primary murine bone marrow stroma using a limiting dilution LTC–initiating cell (IC) assay. OPN−/− bone marrow cells gave rise to a significantly higher number of LTC-ICs (P = 0.01, n = 5; Fig. 2 E). Notably, the OPN-null cells were able to mature into normal-appearing colonies on wild-type stroma used in these assays, which suggests that OPN deficiency did not intrinsically impair hematopoietic cell differentiation.
To more accurately assess the impact of OPN on the stem cell compartment, we admixed cells in a 1:1 ratio from the wild-type and null genotypes and transplanted them into lethally irradiated wild-type recipients. 12 wk after transplantation, the relative abundance of each genotype was quantitated, and the OPN−/− cells represented 67.1 ± 1.6% (n = 8) of the bone marrow and blood cells (Fig. 2 F). The difference between the relative engraftment of OPN−/− to wild-type cells was highly statistically significant (P = 0.00001) and reflected an approximately twofold excess of stem cells present in the OPN−/− donor marrow. Proliferation, apoptosis, or other stem cell–autonomous effects could all account for these results and were subsequently addressed.
Transplantation analysis demonstrates a stroma-determined effect by OPN on hematopoietic stem cells
To address whether the impact of OPN was stem cell autonomous or stroma dependent, we performed sequential bone marrow transplantation, reasoning that a stem cell–autonomous effect would be retained with each transplant, whereas a nonautonomous or stroma-determined effect would not. Bone marrow from OPN+/+ or OPN−/− male animals (Ly5.2) was transplanted into lethally irradiated female Ly5.1+ mice. 2 mo after engraftment, 4–8 × 10⁶ bone marrow cells were used as donor cells and again transplanted into new lethally irradiated Ly5.1+ recipients. After another 3-mo period, the bone marrows of the secondary recipients were analyzed. There was no difference in the total bone marrow cellularity of animals serially transplanted with OPN−/− or OPN+/+ bone marrow cells. Similarly, there was no difference in either the proportion or absolute number of the stem cell–enriched Sca1+kit+lin− fraction of Ly5.2+ cells in the bone marrow of animals serially transplanted with OPN−/− or OPN+/+ cells, suggesting the unaltered self-renewal ability of OPN-deficient stem cells (Fig. 3 A). To more accurately quantify the progenitor and primitive cell frequency in the bone marrow of the serially transplanted animals, we performed CFC and LTC-IC assays. We could not detect any notable differences between genotypes in either population as reflected by these assays (unpublished data). These data demonstrate that the alteration in primitive hematopoiesis (increased LTC-ICs and decreased CFCs) seen in an OPN-deficient animal was not persistent when cells from that animal were transplanted into a wild-type background. Why the cell numbers would revert back to a level resembling wild-type animals has several possible explanations. It is possible that OPN−/− stem cells do not home as well as OPN+/+ cells, meaning that fewer cells arrive at their supportive niche, which accounts for the result.
Figure 3.

OPN−/− hematopoietic stem cell increase is not cell autonomous, but stroma dependent. (A) In a serial transplantation experiment using C57BL/6 wild-type mice (Ly5.1) as recipients for either OPN−/− or OPN+/+ bone marrow (Ly5.2), OPN−/− hematopoietic stem cells lost their advantage in numbers by the second transplantation, reverting to the OPN+/+ phenotype. Data are presented as the ratio of OPN−/−/OPN+/+ with the mean absolute number of Sca1+c-kit+lin− cells from five mice in each genotype at each transplantation. (B) OPN−/− primitive hematopoietic cells have no advantage in homing to the bone marrow. Whole bone marrow cells of male OPN−/− and OPN+/+ mice (Ly5.2) were transplanted into lethally irradiated female recipients (Ly5.1), and 16 h after transplantation, the bone marrow of the recipients was analyzed for Ly5.1 and Ly5.2 and differentiation markers. The graph shows that the approximately twofold increase in donor OPN−/− Sca1+c-kit+lin− cells was preserved in the marrow of recipients. (C–E) Primitive cell expansion in OPN−/− mice is stroma dependent. In C, Sca1+lin− hematopoietic stem cells were isolated from wild-type bone marrow and plated on either wild-type or OPN-deficient stroma in limiting dilution LTC-IC assays (n = 7). In D and E, wild-type bone marrow was transplanted into lethally irradiated OPN+/+ or OPN−/− recipients. 12 wk after transplantation, the bone marrow cells of the recipient mice were analyzed by flow cytometric analyses and functional LTC-IC assays (n = 4 for each assay). Error bars represent SEM.
To directly address the issue of abnormal homing of seeding, we performed in vivo homing assays. Bone marrow cells of OPN+/+ or OPN−/− (Ly5.2) mice were transplanted into lethally irradiated wild-type recipients (Ly5.1; 2 × 10⁷ per animal). 14 h after transplantation, the recipient animals were killed and the bone marrow was analyzed by flow cytometry using the surface markers Ly5.1 and Ly5.2 simultaneously with stem cell markers. The proportion of donor cells (Ly5.2) was similar in the bone marrow of animals transplanted with OPN+/+ or OPN−/− bone marrow ([OPN+/+] 3.37 ± 0.4% vs. [OPN−/−] 2.66 ± 0.2%; P = 0.08, n = 3). However, the proportion of Sca1+lin− cells, a more primitive subset (26), was twofold higher in the animals transplanted with OPN−/− bone marrow compared with the controls ([OPN+/+] 1.03 ± 0.1% vs. [OPN−/−] 2.13 ± 0.1%; P = 0.001, n = 3; Fig. 3 B), which reflected the twofold higher proportion of stem cells in the bone marrow of the OPN−/− donor animals before transplantation. Therefore, OPN-deficient stem cells do not appear to have any disadvantage in seeding or short-term (14 h) retention in the bone marrow.
To assess the possible role of the microenvironment itself in governing stem cell pool size, we cultivated stroma from either OPN+/+ or OPN−/− mouse bone marrow. Sca-1+ lin− mononuclear bone marrow cells from either genotype were then plated at limiting dilutions in standard LTC-IC conditions. The OPN−/− stroma was more capable of supporting LTC-ICs than wild-type stroma (365.5 ± 60.2 LTC-ICs/100,000 cells vs. 450.4 ± 63.1 LTC-ICs/100,000 cells; P = 0.002, n = 7; Fig. 3 C). These data suggested that stroma was the determinant of primitive pool size and not the primitive cells themselves. This nonautonomous effect on primitive cells supported a role for OPN in the regulatory microenvironment and we further investigated that role.
To test the in vivo effects of the OPN−/− stroma, we transplanted wild-type cells into lethally irradiated OPN−/− or OPN+/+ animals. 12 wk after engraftment, the relative abundance of donor cells was examined by flow cytometry and functional LTC-IC assays. Marrow that had been engrafted in the OPN-deficient hosts demonstrated a statistically significant increase in phenotypic Ly5.2 Sca1+c-kit+lin− cells and functional LTC-ICs (4.72 ± 0.11 vs. 5.63 ± 0.49% of Sca1+c-kit+ cells in the lin− fraction, P = 0.049, n = 4; 0.59 ± 0.08 vs. 1.22 ± 0.26 LTC-ICs/100,000 cells, P = 0.049, n = 4; Fig. 3, D and E) closely resembling the OPN-null phenotype. Therefore, the microenvironment provided by the OPN-deficient animals was able to support a greater number of primitive cells in a stroma-dependent manner. These data support the stem cell–nonautonomous nature of the OPN−/− effect.
OPN deficiency does not affect cell cycle kinetics, but alters stromal Jagged1 and Angiopoietin-1 expression and primitive cell apoptosis
To assess potential mechanisms by which the microenvironment of the OPN-deficient animals contributed to the expanded stem cell pool in OPN−/− mice, we assessed cell cycle kinetics. Bone marrow cells were stained with Sca1, c-kit, and lineage markers, and the cell cycle status was analyzed by simultaneous staining with the DNA dye Hoechst 33342. We observed a similar G0/G1 and S+G2/M percentage of Sca1+c-kit+lin− in the bone marrow of OPN+/+ and OPN−/− animals (S+G2/M OPN+/+, 0.22 and OPN−/−, 0.22%; pooled bone marrow of three animals each; Fig. 4 A). These data indicate an unperturbed cell cycle status of primitive cells in the absence of OPN even though it is recognized that they cannot define the interval spent in any phase in a single cycle, nor the rapidity of cycling. To better address the latter issue, BrdU labeling was performed by exposing the animals to BrdU in their drinking water for variable intervals and examining the extent of BrdU uptake in primitive subsets of marrow cells by flow cytometry. Modest differences that did not achieve significance were noted between the genotypes at 3, 6, and 10 d (Fig. 4 B).
Figure 4.

OPN−/− bone marrow has unaltered cell cycle profiles associated with increased stromal Jagged1 and Angiopoietin-1 expression and reduced primitive cell apoptosis. (A) Bone marrow Sca1+c-kit+lin− cells with a bright staining for Hoechst 33342, representing cells in the G2/M phase of the cell cycle (n = 3 pairs). (B) BrdU incorporation in Sca1+c-kit+lin− cells at the specified time points in OPN+/+ and OPN−/− bone marrow. Data are the result of two independent experiments with four mice per group in each experiment. A Student's t test comparison revealed no P < 0.05. (C) Bone marrow adherent stromal cells were evaluated for Jagged1, Angiopoietin (Ang)-1, and N-cadherin expression by RT-PCR (n = 6 for each). Data were normalized to an intrasample GAPDH standard, and the results of the OPN−/− vs. OPN+/+ cells were compared by ratio. (D) Bone marrow cells of OPN+/+ and OPN−/− mice were stained with antibodies to differentiation markers, the apoptosis marker Annexin V, and the DNA dye 7-AAD. Annexin V–positive/7-AAD–negative apoptotic Sca1+c-kit+lin− cells are shown (n = 4 pairs). (E) Stroma-dependent apoptotic rate demonstrated by reduced apoptosis of wild type primitive hematopoietic cells when transplanted into OPN−/− mice compared with OPN+/+ recipient mice. Analyses were performed on the lin− fraction 12 wk after transplantation (n = 4). Error bars represent SEM.
Stem cell expansion may occur without increased proliferation in the context of Notch1 activation where stem cell self-renewal is favored over differentiation (27, 28). Activation of Notch1 on primitive hematopoietic cells in vivo was previously shown by us to result in an increase in primitive cells, but reduced progenitor cells; a similar phenotype was observed here (27). Also, a link between Notch1 and OPN was reported by Iwata et al., who showed that OPN can reduce Notch1 receptor abundance on human CD34+ cells (29). Because the Notch1 ligand, Jagged1, has been shown to be produced by osteoblasts in the hematopoietic stem cell niche and to affect stem cell pool size (4), we assessed the Jagged1 expression in marrow stromal cells. An increase in Jagged1 was observed in the OPN-deficient animals relative to wild-type controls (P = 0.02, n = 6; Fig. 4 C). To determine whether the reciprocal was true—that OPN stimulation of wild-type cells might decrease Jagged1—we exposed marrow stroma to OPN ex vivo for 4 h. Jagged1 was found to be significantly reduced statistically by OPN (Fig. S3, available at http://www.jem.org/cgi/content/full/jem.20041992/DC1). Other molecular features of the stem cell niche recently defined include N-cadherin (3) and Angiopoietin-1 (30). We also examined the expression of these in stroma and noted modest, insignificant increases in N-cadherin (P = 0.08, n = 6), but a more pronounced increase in Angiopoietin-1 in the absence of OPN (P = 0.02, n = 6; Fig. 4 C). Angiopoietin-1 has been defined as a molecule that can increase stem cells not by increasing proliferation, but rather by enhancing quiescence. These data suggest that the impact of OPN expression is likely multifaceted; it alters features of the niche that in combination change its capacity to nurture primitive hematopoietic cells, none of which are associated with increased proliferation.
An additional possible mechanism for increasing stem cell numbers without altering cycling kinetics is decreased cell death. To evaluate this, bone marrow cells were stained with stem cell markers and simultaneously with Annexin V and the DNA dye 7-AAD to determine the fraction of apoptotic cells indicated by the phenotype Annexin V+7-AAD−. We could detect a trend toward fewer apoptotic cells in the Sca1+c-kit+lin− bone marrow stem cell–enriched population in OPN−/− mice in comparison with controls (n = 4). Additionally, the OPN-deficient bone marrow in serially transplanted animals showed a lower fraction of apoptotic cells in the Sca1+c-kit+lin− cell population in comparison with controls, suggesting a preserved lower tendency of OPN-deficient stem cells to become apoptotic. Furthermore, we transplanted wild-type bone marrow into either the wild type or OPN-deficient recipients and noted that lineage-negative hematopoietic cells of the OPN+/+ genotype acquired a decreased apoptosis fraction similar to the OPN-deficient animal (Fig. 4 D), demonstrating that the basis for the change in apoptosis was stroma dependent. These results suggest that the enlarged stem cell pool in OPN-deficient mice may be caused, in part, by enhanced survival, but required further definition.
Soluble OPN reduces LTC-ICs and increases the apoptotic fraction of wild-type cells
We used exogenous OPN to assess its potential role in regulating primitive cells directly rather than through the altered expression of other regulators within the niche. Initial experiments used Sca1+lin− bone marrow cells of C57BL/6 mice cultured in a medium containing stem cell factor (SCF), Flt-3, TPO, and IL-3 with and without OPN for 7 d, after which the cells were counted and analyzed in functional in vitro progenitor and stem cell assays. The addition of soluble OPN led to a lower total cell number with an unperturbed absolute number of CFCs representing hematopoietic progenitor cell activity (n = 5; Fig. 5 A). However, exogenous OPN led to a significantly lower absolute number of LTC-ICs (without OPN, 35.9 ± 5.14 LTC-ICs/well; with OPN, 16.41 ± 4.5 LTC-ICs/well; P = 0.002, n = 5; Fig. 5 B).
Figure 5.

Soluble OPN induces apoptosis of primitive hematopoietic cells. Sca1+lin− cells were isolated from the bone marrow of C57BL/6 mice and cultured in IMDM containing 10% FCS, SCF, Flt-3, TPO, and IL-3 with or without 1 μg/ml OPN. After 7 d, the cells were counted and analyzed in functional hematopoietic assays. (A) Soluble OPN did not alter the absolute number of CFCs per well in comparison with controls. Chart shows the total number of CFCs per well of five independent experiments (continuous lines) and the mean of all experiments (dotted line). (B) A decreased primitive cell activity could be detected in cells stimulated with OPN in comparison to controls. Chart shows the total number of LTC-ICs per well of five independent experiments (continuous lines) and the mean of all experiments (dashed line). (C) Cultured cells were stained with lineage markers, Annexin V, and 7-AAD. The chart shows the mean percentage ± SEM of lin−7-AAD−Annexin V+ cells representing apoptotic primitive hematopoietic cells.
We next analyzed the fraction of apoptotic cells by staining with lineage markers, 7-AAD and Annexin V, and detected a higher percentage of Annexin V+7-AAD− cells in the lin− cell population cultured with OPN, which was consistent with increased apoptosis (Fig. 5 C). A similar effect was seen with Sca+ lin− cells in the OPN−/− animals and was neutralized with anti–OPN-specific antibody (unpublished data). Therefore, the addition of OPN documented an effect on primitive cell apoptosis that had been suggested by the analysis of the OPN-deficient mice in vivo. OPN exerts a proapoptotic effect on primitive cells, potentially constraining the size of the stem cell pool.
OPN restricts primitive cell expansion induced by osteoblast activation
To determine whether OPN acts to limit the dimensions of the stem cell pool under conditions in which stem cell expansion occurs, we took advantage of a previously reported in vivo context. PTH is capable of activating niche osteoblasts and, in a Notch-mediated manner, expand the number of stem cells in vitro and in vivo (4). PTH has been shown to be physiologically increased in settings such as myelotoxic ablation with radiation and chemotherapy (31). Stimulation with PTH increases OPN production, so we hypothesized that the degree of stem cell expansion possible by PTH niche activation may be restricted by OPN. Using an OPN-null or wild-type mouse, we assessed the number of primitive cells after 4 wk of PTH stimulation. There was the expected difference in the number of Sca1+c-kit+lin− between the OPN-null and wild-type mouse before PTH (Fig. 6). With PTH treatment, there was an increase in the Sca1+c-kit+lin− cells in each genotypic background. The magnitude of Sca1+c-kit+lin− increase induced by PTH was greater in both proportion and absolute number in the null animals (10.0 vs. 7.5%, or 5.94 × 10⁴ vs. 3.82 × 10⁴ stem cells per femur pair). These data indicate that activation of the niche can increase primitive cells to a greater degree without OPN present in the milieu, arguing that OPN limits the degree of primitive cell increase that can be attained with the stimulation of osteoblasts.
Figure 6.

OPN deficiency permits increased primitive hematopoietic cell compartment expansion after niche activation by PTH. OPN+/+ and OPN−/− mice were treated with PTH by daily injection for 4 wk. The bone marrow was analyzed by flow cytometry. The graph shows the average of absolute numbers of Sca1+c-kit+lin− stem cells per mouse without and with PTH stimulation in OPN+/+ (littermate control) and OPN−/− mice (n = 3 or 4). Numbers indicate the difference in absolute numbers of bone marrow LKS cells between the two sets of mice.
Discussion
The stem cell niche provides a specialized regulatory environment that includes signals to maintain the stem cell pool, protecting it from exhaustion during the life of an organism. Similarly, it provides a context in which stem cells are pushed to differentiate, and it appears to limit the size of the stem cell pool, presumably because of some selective pressure against an excessively abundant stem cell mass. In organisms such as Drosophila, for example, it is well defined that contact of stem cells with hub cells in the germarium are required for the preservation of stem cells (2). If daughter cells are not in contact with the hub cell, they undergo enforced differentiation, resulting in the cessation of cell cycling. In this manner, there is a balance between primitive and differentiated cells, and the size of the primitive population does not go beyond the nurturing context of hub cell contact, enforcing a tight control on stem cell number.
In mammalian systems, a similar regulatory relationship has not been previously defined. The data we present indicate that OPN is modulated in expression by stimulation of the PTHR in osteoblasts as has been previously described by us and others (4). The production appears to extend OPN beyond that of the immediate periosteoblast area and into stroma away from the endosteal surface. The absence of OPN results in an increase in the number of stem cells and the ability to increase primitive cell production when the PTHR is activated. These data are consistent with a model in which OPN restricts the stem cell population; without this mechanism of constraint, expansion exceeds the usual level. Because the relative increase was modest, the data suggest that OPN is not alone in constraining stem cell pool size and that other products of the niche may provide further restriction.
The increase in stem cells when OPN was absent was caused by a microenvironmental effect rather than a stem cell–autonomous effect. The effect was not restricted to the bone marrow, as LTC-ICs were also noted to be increased in the spleen (unpublished data), an observation that also indicates the change in stem cell pool size was not due simply to redistribution. Localization was one mechanism of OPN action that might have been anticipated given that OPN can engage a number of receptors, including the integrins αv(β1,β3, or β5) and (α4, α5, α8, or α9)β1, and is a ligand for certain variant forms of CD44, specifically v6 and/or v7 (10, 32–35). CD44 and integrin α4 are expressed on primitive hematopoietic progenitor cells and play physiologic roles in stem cell localization (36, 37). Yet, the effects of OPN we noted were not associated with altered homing. Nor was there evidence for an altered cycling profile as has been observed in other settings, resulting in expanded stem cell numbers, such as p21Cip1 or p18INK4c deficiency (38, 39), or HoxB4 (40) or Bmi-1 overexpression (41). The alteration could be caused by a number of influences. One that we showed could be a direct effect of OPN is apoptotic rate, though it is more likely that there is combinatorial effect contributed to by other features of the niche we also defined as altered, including Jagged1 and Angiopoietin-1. Increased local production of Jagged1 could alter Notch1 activation and affect self-renewal.
However, it should be noted that there did not appear to be stem cell– or hematopoietic cell–autonomous changes in self-renewal as evident in the serial transplantation studies in which OPN-null stem cells failed to demonstrate persistent increased cell numbers when transplanted into wild-type hosts. Whether there is any link between the findings of decreased apoptosis and up-regulation of Jagged1 or Angiopoietin-1 in the absence of OPN cannot be discerned from our current data. We have previously demonstrated that activation of Notch1 in hematopoietic stem cells can result in an increased stem cell pool size in vivo with reduced primitive cell production of colonies similar to the phenotype of OPN null (27); others have reported that Notch1 activation can prevent hematopoietic cell death (42). Angiopoietin-1 has been shown to enhance stem cell interactions with matrix and cell components of the niche (30, 43, 44) and to enhance stem cell survival under stress (30). Altogether, these studies suggest a possible indirect mechanism by which OPN deficiency can change primitive cell populations by altering Jagged1 or Angiopoietin-1 expression. However, our data also argue for a functional contribution of OPN directly. Exogenous OPN provided a proapoptotic stimulus in primitive cells that was abrogated with neutralizing antibody to OPN. Therefore, direct and indirect mechanisms likely contribute to the in vivo phenotype of OPN null and generation of dually deficient animals is in progress to sort out the relative contribution of each.
The data presented here extend the general concept of matrix proteins regulating neighboring cell functions to that of the stem cell niche. The participation of matrix proteins in creating specialized microenvironments for stem cells that participate in regulating the stem cell pool size adds a novel dimension to the physiologic roles of extracellular matrix constituents. A recent report indicates that the matrix protein, tenascin C, is needed for the proper number and potential of primitive neural cells to be established in the subventricular zone of the central nervous system, indicating that extracellular matrix can participate in mammalian stem cell niches (45). We add the additional finding that a matrix protein that is modulable in its production may add a barrier to stem cell expansion upon niche stimulation. Therefore, extracellular matrix components may play a dynamic role not just in establishing the stem cell pool size, but in governing its responsiveness to expansion signals.
MATERIALS AND METHODS
Cells and cell culture.
Mouse bone marrow was obtained from 8–12-wk-old 129/C57BL/6 OPN+/+ and 129/C57BL/6 OPN−/− mice killed with CO2. Experiments were performed with the permission of the subcommittee on Research Animal Care of the Massachusetts General Hospital. BM and spleen cell suspensions were flushed from femurs and tibias, or taken from spleens, and filtered through a 100-μm mesh nylon cloth (Sefar America Inc.) and stored on ice until use.
Sca1+lin− BM WT cells were obtained from 6–8-wk-old C75Bl/6 mice. BM cells were washed and stained with Sca1+ microbeads (Miltenyi Biotec) and biotinylated lineage antibodies (CD3, CD4, CD8, Gr-1, Mac-1, B220, and Ter119; BD Biosciences). A positive selection for Sca1+ cells, followed by a negative selection for Sca+lin− cells, using streptavidin microbeads was performed according to the manufacturer's instructions (Miltenyi Biotec). The cells were cultured in IMDM (GIBCO BRL) containing 10% FCS, 50 ng/ml SCF, 50 ng/ml Flt-3, 25 ng/ml TPO, and 10 ng/ml IL-3 (R&D Systems). OPN protein was obtained from R&D Systems.
Colony forming assay.
This assay was used to measure the CFC as described in our previous publication (38). Murine SCF was used in this study instead of human SCF and cells were plated at only 500 cells/ml.
LTC with limiting dilutions.
To quantify the stem cells in the bone marrow and spleen cell suspension, we adapted the colony forming assay (46) with minor modifications, as described in our previous publication (47). To measure LTC-ICs, the semisolid cytokine-containing methylcellulose medium for CFC was overlaid into the wells at week 5 and the colonies were counted at day 10. A limiting dilution analysis software program (Maxrob; provided by J. Down, BioTransplant Inc., Charlestown, MA) was used to calculate the frequency of LTC-ICs in the cell population.
Competitive repopulation assay (CRA).
The CRA was used to evaluate the repopulation ability of the OPN−/− BM in irradiated recipient mice (48, 49). Recipient animals (female, C57BL/6-Ly5.1; The Jackson Laboratories) were irradiated with a single dose of 10 Gy 12–16 h before transplantation. The BM donor cells were obtained from 8–10-wk-old male 129/C57BL/6 OPN−/− and 129/C57BL/6 OPN+/+ mice and prepared as in Cells and cell culture section. All leukocytes of these mice are Ly5.2 positive. Congenic competitive BM cells (Ly5.1) were prepared as single cell suspensions from male mice. A mixture of equal amounts of cells of the OPN−/− BM cells along with congenic Ly5.1 BM cells were resuspended in Medium 199 and i.v. injected into the lateral tail vein of lethally irradiated Ly5.2 WT or OPN−/− female recipients (n = 5 per group). The mice were killed and BM cells were prepared from those mice and analyzed by flow cytometry.
Serial BM transplantation.
Serial BM transplantation was used to evaluate the ability of stem cells to self-renew. The BM donor cells were obtained from 8–10-wk-old male 129/C57BL/6 OPN−/− and 129/C57BL/6 OPN+/+ mice and transplanted into lethally irradiated WT congenic recipients (Ly5.1). The transplanted mice were killed at 2 mo and the BM was prepared from those mice. New female recipient mice (n = 5 per group) were lethally irradiated and transplanted with 4 × 10⁶ mononuclear BM cells of the killed animals by injection in lateral tail veins. After 2 mo, BM cells were harvested from these transplanted mice, analyzed by flow cytometry, and again transplanted into lethally irradiated recipients (second transplanted mice). This process was repeated 2 mo later (third transplanted mice), and CFC and LTC-IC assays were performed.
In vivo PTH treatment.
6–8-wk-old WT or null male mice were i.p. injected with rat PTH (1–34; 80 μg/kg of body weight; Bachem) or vehicle alone five times per week for 4 wk (n = 4–6 per group). Animals were killed, and BM cells were isolated and analyzed as in Flow cytomeric analysis section.
Flow cytometric analysis.
Flow cytometry was used to quantify the hematopoietic cells at different stages in the peripheral blood and BM of the transplanted animals. BM nucleated cells were labeled with leukocyte antibodies (Ly5.1-PE and Ly5.2-biotin; BD Biosciences), lineage antibodies (CD3-PerCP, CD4-PE, B220-PE, Ter119-PE [BD Biosciences]; CD8-Tri, Gr-1-Tri, Mac1-PE [Caltag]), and stem cell markers (Sca1-Tri and PE, c-kit-Tri; Caltag). To quantify the enriched stem cell phenotype (Sca1+lin−) in primary animals and in transplanted animals, BM cells were stained with biotinylated lineage antibodies (CD3, Ter119 [BD Biosciences]; CD4, CD8, B220, IgM, Gr-1, and Mac1 [Caltag]), c-kit-APC (BD Biosciences), and Sca1-PE (Caltag). The cells were analyzed after labeling with the secondary antibody Streptavidin-PerCP (Becton Dickinson). For cell cycle analyses, BM cells were incubated with stem cell markers and the DNA dye Hoechst33342. The proportion of apoptotic cells was measured by staining with Annexin V (Caltag) and the DNA dye 7-AAD (Sigma-Aldrich).
Expression of Jagged1, Angiopoietin-1, N-cadherin, and OPN.
The expression of Jagged1, Angiopoietin-1, and N-cadherin in BM stroma cells was measured by RT-PCR. Bone marrow stroma cells of OPN+/+ and OPN−/− mice were cultured for 3–6 wk in LTC medium and irradiated with 10 Gy to abolish any hematopoietic activity in the culture. After 3 d, cells were lysed with TRI reagent and RT-PCR was performed as previously described (50). The following primers were used: Jagged1, 5′-GTGTGCCTCAAGGAGTATCAG-3′ and 5′-CATAGTAGTGGTCATCACAGG-3′; Angiopoietin-1, 5′-GGATTCAACATGGGCAATGTG-3′ and 5′-GGTTCCTATCTCAAGCATGG-3′; N-cadherin, 5′-GCAGATTTCAAGGTGGACG-3′ and 5′-CAGACCTGATTCTGACAAGC-3′; and OPN, 5′-CAAAGTCAGCCGTGAATTCCA-3′ and 5′-AACCCAATAAACTGAGAAAGAAGC-3′. PCR of the reverse transcribed RNA was performed using 25 cycles for Jagged1 and Angiopoietin-1, and 27 cycles for N-cadherin. GAPDH transcripts were amplified in 25 PCR cycles. The ethidium bromide–stained gels were photographed and the densitometric results of gene expression were standardized to that of GAPDH expression in the same sample.
OPN expression in primitive hematopoietic (LKS) cells was performed as above after culture of the cells in IMDM (GIBCO-BRL) containing 10% FCS, 50 ng/ml SCF, 50 ng/ml Flt-3, 25 ng/ml TPO, and 10 ng/ml IL-3 (R&D Systems) for the indicated times (Fig. S1).
Statistical analysis.
The significance of the difference between groups in the in vitro and in vivo experiments was evaluated by analysis of variance followed by a one-tailed Student's t test.
Online supplemental materials
Evidence from RT-PCR analysis that LKS cells express OPN mRNA with stimulation is provided in Fig. S1. Also provided are the results of flow cytometry comparing the IgM− and IgM+ B220+ populations of the WT and OPN−/− animals (Fig. S2). These data demonstrate no difference between the genotypes for either subset of cells. Fig. S3 shows that the expression of Jagged1 relative to GAPDH decreases by RT- PCR analysis when WT stromal cells are exposed to 1 μg/ml OPN for 4 h ex vivo. Online supplemental material is available at http://www.jem.org/cgi/content/full/jem.20041992/DC1.
Acknowledgments
The authors thank Dr. Louise Purton for her helpful comments and reading of the manuscript. We also thank the FACS Core Facility of the Institute for Molecular Medicine of the University of Bonn and the Massachusetts General Hospital.
This work was supported by grants from the National Institutes of Health (HL44851, HL65909, and CA086355), the Deutsche Forschungsgemeinschaft (STI 172/3), and the Bonfor-Foundation (O-139.026). The Burroughs Wellcome Foundation and the German Academic Exchange Service also provided support.
A patent application has been filed for these findings. Otherwise, the authors have no conflicting financial interests.
Abbreviations used: CFC, colony-forming cell; CRA, competitive repopulation assay; IC, initiating cell; LTC, long-term culture; OPN, osteopontin; PTH, parathyroid hormone; SCF, stem cell factor.
References
- 1.Kiger, A.A., D.L. Jones, C. Schulz, M.B. Rogers, and M.T. Fuller. 2001. Stem cell self-renewal specified by JAK-STAT activation in response to a support cell cue. Science. 294:2542–2545. [DOI] [PubMed] [Google Scholar]
- 2.Xie, T., and A.C. Spradling. 2000. A niche maintaining germ line stem cells in the Drosophila ovary. Science. 290:328–330. [DOI] [PubMed] [Google Scholar]
- 3.Zhang, J., C. Niu, L. Ye, H. Huang, X. He, W.G. Tong, J. Ross, J. Haug, T. Johnson, J.Q. Feng, et al. 2003. Identification of the haematopoietic stem cell niche and control of the niche size. Nature. 425:836–841. [DOI] [PubMed] [Google Scholar]
- 4.Calvi, L.M., G.B. Adams, K.W. Weibrecht, J.M. Weber, D.P. Olson, M.C. Knight, R.P. Martin, E. Schipani, P. Divieti, F.R. Bringhurst, et al. 2003. Osteoblastic cells regulate the haematopoietic stem cell niche. Nature. 425:841–846. [DOI] [PubMed] [Google Scholar]
- 5.Denhardt, D.T., M. Noda, A.W. O'Regan, D. Pavlin, and J.S. Berman. 2001. Osteopontin as a means to cope with environmental insults: regulation of inflammation, tissue remodeling, and cell survival. J. Clin. Invest. 107:1055–1061. [DOI] [PMC free article] [PubMed] [Google Scholar]
- 6.Denhardt, D.T., and X. Guo. 1993. Osteopontin: a protein with diverse functions. FASEB J. 7:1475–1482. [PubMed] [Google Scholar]
- 7.Rittling, S.R., and D.T. Denhardt. 1999. Osteopontin function in pathology: lessons from osteopontin-deficient mice. Exp. Nephrol. 7:103–113. [DOI] [PubMed] [Google Scholar]
- 8.O'Brien, E.R., M.R. Garvin, D.K. Stewart, T. Hinohara, J.B. Simpson, S.M. Schwartz, and C.M. Giachelli. 1994. Osteopontin is synthesized by macrophage, smooth muscle, and endothelial cells in primary and restenotic human coronary atherosclerotic plaques. Arterioscler. Thromb. 14:1648–1656. [DOI] [PubMed] [Google Scholar]
- 9.Liaw, L., V. Lindner, S.M. Schwartz, A.F. Chambers, and C.M. Giachelli. 1995. Osteopontin and beta 3 integrin are coordinately expressed in regenerating endothelium in vivo and stimulate Arg-Gly-Asp-dependent endothelial migration in vitro. Circ. Res. 77:665–672. [DOI] [PubMed] [Google Scholar]
- 10.Liaw, L., M.P. Skinner, E.W. Raines, R. Ross, D.A. Cheresh, S.M. Schwartz, and C.M. Giachelli. 1995. The adhesive and migratory effects of osteopontin are mediated via distinct cell surface integrins. Role of alpha v beta 3 in smooth muscle cell migration to osteopontin in vitro. J. Clin. Invest. 95:713–724. [DOI] [PMC free article] [PubMed] [Google Scholar]
- 11.Chambers, A.F., S.M. Wilson, N. Kerkvliet, F.P. O'Malley, J.F. Harris, and A.G. Casson. 1996. Osteopontin expression in lung cancer. Lung Cancer. 15:311–323. [DOI] [PubMed] [Google Scholar]
- 12.Scott, L.M., G.V. Priestley, and T. Papayannopoulou. 2003. Deletion of alpha4 integrins from adult hematopoietic cells reveals roles in homeostasis, regeneration, and homing. Mol. Cell. Biol. 23:9349–9360. [DOI] [PMC free article] [PubMed] [Google Scholar]
- 13.Schmits, R., J. Filmus, N. Gerwin, G. Senaldi, F. Kiefer, T. Kundig, A. Wakeham, A. Shahinian, C. Catzavelos, J. Rak, et al. 1997. CD44 regulates hematopoietic progenitor distribution, granuloma formation, and tumorigenicity. Blood. 90:2217–2233. [PubMed] [Google Scholar]
- 14.McKee, M.D., M.C. Farach-Carson, W.T. Butler, P.V. Hauschka, and A. Nanci. 1993. Ultrastructural immunolocalization of noncollagenous (osteopontin and osteocalcin) and plasma (albumin and alpha 2HS-glycoprotein) proteins in rat bone. J. Bone Miner. Res. 8:485–496. [DOI] [PubMed] [Google Scholar]
- 15.Rittling, S.R., H.N. Matsumoto, M.D. McKee, A. Nanci, X.R. An, K.E. Novick, A.J. Kowalski, M. Noda, and D.T. Denhardt. 1998. Mice lacking osteopontin show normal development and bone structure but display altered osteoclast formation in vitro. J. Bone Miner. Res. 13:1101–1111. [DOI] [PubMed] [Google Scholar]
- 16.O'Regan, A.W., G.L. Chupp, J.A. Lowry, M. Goetschkes, N. Mulligan, and J.S. Berman. 1999. Osteopontin is associated with T cells in sarcoid granulomas and has T cell adhesive and cytokine-like properties in vitro. J. Immunol. 162:1024–1031. [PubMed] [Google Scholar]
- 17.Ashkar, S., G.F. Weber, V. Panoutsakopoulou, M.E. Sanchirico, M. Jansson, S. Zawaideh, S.R. Rittling, D.T. Denhardt, M.J. Glimcher, and H. Cantor. 2000. Eta-1 (osteopontin): an early component of type-1 (cell-mediated) immunity. Science. 287:860–864. [DOI] [PubMed] [Google Scholar]
- 18.Liaw, L., D.E. Birk, C.B. Ballas, J.S. Whitsitt, J.M. Davidson, and B.L. Hogan. 1998. Altered wound healing in mice lacking a functional osteopontin gene (spp1). J. Clin. Invest. 101:1468–1478. [DOI] [PMC free article] [PubMed] [Google Scholar]
- 19.Chabas, D., S.E. Baranzini, D. Mitchell, C.C. Bernard, S.R. Rittling, D.T. Denhardt, R.A. Sobel, C. Lock, M. Karpuj, R. Pedotti, et al. 2001. The influence of the proinflammatory cytokine, osteopontin, on autoimmune demyelinating disease. Science. 294:1731–1735. [DOI] [PubMed] [Google Scholar]
- 20.Nau, G.J., L. Liaw, G.L. Chupp, J.S. Berman, B.L. Hogan, and R.A. Young. 1999. Attenuated host resistance against Mycobacterium bovis BCG infection in mice lacking osteopontin. Infect. Immun. 67:4223–4230. [DOI] [PMC free article] [PubMed] [Google Scholar]
- 21.O'Regan, A.W., J.M. Hayden, and J.S. Berman. 2000. Osteopontin augments CD3-mediated interferon-gamma and CD40 ligand expression by T cells, which results in IL-12 production from peripheral blood mononuclear cells. J. Leukoc. Biol. 68:495–502. [PubMed] [Google Scholar]
- 22.Lin, Y.H., C.J. Huang, J.R. Chao, S.T. Chen, S.F. Lee, J.J. Yen, and H.F. Yang-Yen. 2000. Coupling of osteopontin and its cell surface receptor CD44 to the cell survival response elicited by interleukin-3 or granulocyte-macrophage colony-stimulating factor. Mol. Cell. Biol. 20:2734–2742. [DOI] [PMC free article] [PubMed] [Google Scholar]
- 23.Calvi, L.M., N.A. Sims, J.L. Hunzelman, M.C. Knight, A. Giovannetti, J.M. Saxton, H.M. Kronenberg, R. Baron, and E. Schipani. 2001. Activated parathyroid hormone/parathyroid hormone-related protein receptor in osteoblastic cells differentially affects cortical and trabecular bone. J. Clin. Invest. 107:277–286. [DOI] [PMC free article] [PubMed] [Google Scholar]
- 24.Uchida, N., A. Tsukamoto, D. He, A.M. Friera, R. Scollay, and I.L. Weissman. 1998. High doses of purified stem cells cause early hematopoietic recovery in syngeneic and allogeneic hosts. J. Clin. Invest. 101:961–966. [DOI] [PMC free article] [PubMed] [Google Scholar]
- 25.Osawa, M., K. Hanada, H. Hamada, and H. Nakauchi. 1996. Long-term lymphohematopoietic reconstitution by a single CD34-low/negative hematopoietic stem cell. Science. 273:242–245. [DOI] [PubMed] [Google Scholar]
- 26.Spangrude, G.J., S. Heimfeld, and I.L. Weissman. 1988. Purification and characterization of mouse hematopoietic stem cells. Science. 241:58–62. (published erratum appears in Science. 1989. 244:1030) [DOI] [PubMed] [Google Scholar]
- 27.Stier, S., T. Cheng, D. Dombkowski, N. Carlesso, and D.T. Scadden. 2002. Notch1 activation increases hematopoietic stem cell self-renewal in vivo and favors lymphoid over myeloid lineage outcome. Blood. 99:2369–2378. [DOI] [PubMed] [Google Scholar]
- 28.Varnum-Finney, B., L. Xu, C. Brashem-Stein, C. Nourigat, D. Flowers, S. Bakkour, W.S. Pear, and I.D. Bernstein. 2000. Pluripotent, cytokine-dependent, hematopoietic stem cells are immortalized by constitutive notch1 signaling. Nat. Med. 6:1278–1281. [DOI] [PubMed] [Google Scholar]
- 29.Iwata, M., N. Awaya, L. Graf, C. Kahl, and B. Torok-Storb. 2004. Human marrow stromal cells activate monocytes to secrete osteopontin, which down-regulates Notch1 gene expression in CD34+ cells. Blood. 103:4496–4502. [DOI] [PubMed] [Google Scholar]
- 30.Arai, F., A. Hirao, M. Ohmura, H. Sato, S. Matsuoka, K. Takubo, K. Ito, G.Y. Koh, and T. Suda. 2004. Tie2/angiopoietin-1 signaling regulates hematopoietic stem cell quiescence in the bone marrow niche. Cell. 118:149–161. [DOI] [PubMed] [Google Scholar]
- 31.Carlson, K., B. Simonsson, and S. Ljunghall. 1994. Acute effects of high-dose chemotherapy followed by bone marrow transplantation on serum markers of bone metabolism. Calcif. Tissue Int. 55:408–411. [DOI] [PubMed] [Google Scholar]
- 32.Bayless, K.J., G.A. Meininger, J.M. Scholtz, and G.E. Davis. 1998. Osteopontin is a ligand for the alpha4beta1 integrin. J. Cell Sci. 111:1165–1174. [DOI] [PubMed] [Google Scholar]
- 33.Denda, S., L.F. Reichardt, and U. Muller. 1998. Identification of osteopontin as a novel ligand for the integrin alpha8 beta1 and potential roles for this integrin-ligand interaction in kidney morphogenesis. Mol. Biol. Cell. 9:1425–1435. [DOI] [PMC free article] [PubMed] [Google Scholar]
- 34.Smith, L.L., and C.M. Giachelli. 1998. Structural requirements for alpha 9 beta 1-mediated adhesion and migration to thrombin-cleaved osteopontin. Exp. Cell Res. 242:351–360. [DOI] [PubMed] [Google Scholar]
- 35.Weber, G.F., S. Ashkar, M.J. Glimcher, and H. Cantor. 1996. Receptor-ligand interaction between CD44 and osteopontin (Eta-1). Science. 271:509–512. [DOI] [PubMed] [Google Scholar]
- 36.Dimitroff, C.J., J.Y. Lee, S. Rafii, R.C. Fuhlbrigge, and R. Sackstein. 2001. CD44 is a major E-selectin ligand on human hematopoietic progenitor cells. J. Cell Biol. 153:1277–1286. [DOI] [PMC free article] [PubMed] [Google Scholar]
- 37.Antica, M., L. Wu, K. Shortman, and R. Scollay. 1994. Thymic stem cells in mouse bone marrow. Blood. 84:111–117. [PubMed] [Google Scholar]
- 38.Cheng, T., N. Rodrigues, H. Shen, Y. Yang, D. Dombkowski, M. Sykes, and D.T. Scadden. 2000. Hematopoietic stem cell quiescence maintained by p21cip1/waf1. Science. 287:1804–1808. [DOI] [PubMed] [Google Scholar]
- 39.Yuan, Y., H. Shen, D.S. Franklin, D.T. Scadden, and T. Cheng. 2004. In vivo self-renewing divisions of haematopoietic stem cells are increased in the absence of the early G1-phase inhibitor, p18INK4C. Nat. Cell Biol. 6:436–442. [DOI] [PubMed] [Google Scholar]
- 40.Sauvageau, G., U. Thorsteinsdottir, C.J. Eaves, H.J. Lawrence, C. Largman, P.M. Lansdorp, and R.K. Humphries. 1995. Overexpression of HOXB4 in hematopoietic cells causes the selective expansion of more primitive populations in vitro and in vivo. Genes Dev. 9:1753–1765. [DOI] [PubMed] [Google Scholar]
- 41.Lessard, J., and G. Sauvageau. 2003. Bmi-1 determines the proliferative capacity of normal and leukaemic stem cells. Nature. 423:255–260. [DOI] [PubMed] [Google Scholar]
- 42.Jang, M.S., H. Miao, N. Carlesso, L. Shelly, A. Zlobin, N. Darack, J.Z. Qin, B.J. Nickoloff, and L. Miele. 2004. Notch-1 regulates cell death independently of differentiation in murine erythroleukemia cells through multiple apoptosis and cell cycle pathways. J. Cell. Physiol. 199:418–433. [DOI] [PubMed] [Google Scholar]
- 43.Sato, A., A. Iwama, N. Takakura, H. Nishio, G.D. Yancopoulos, and T. Suda. 1998. Characterization of TEK receptor tyrosine kinase and its ligands, Angiopoietins, in human hematopoietic progenitor cells. Int. Immunol. 10:1217–1227. [DOI] [PubMed] [Google Scholar]
- 44.Takakura, N., X.L. Huang, T. Naruse, I. Hamaguchi, D.J. Dumont, G.D. Yancopoulos, and T. Suda. 1998. Critical role of the TIE2 endothelial cell receptor in the development of definitive hematopoiesis. Immunity. 9:677–686. [DOI] [PubMed] [Google Scholar]
- 45.Garcion, E., A. Halilagic, A. Faissner, and C. Ffrench-Constant. 2004. Generation of an environmental niche for neural stem cell development by the extracellular matrix molecule tenascin C. Development. 131:3423–3432. [DOI] [PubMed] [Google Scholar]
- 46.Ploemacher, R.E., J.P. van der Sluijs, C.A. van Beurden, M.R. Baert, and P.L. Chan. 1991. Use of limiting-dilution type long-term marrow cultures in frequency analysis of marrow-repopulating and spleen colony-forming hematopoietic stem cells in the mouse. Blood. 78:2527–2533. [PubMed] [Google Scholar]
- 47.Cheng, T., N. Rodrigues, D. Dombkowski, S. Stier, and D.T. Scadden. 2000. Stem cell repopulation efficiency but not pool size is governed by p27kip1. Nat. Med. 6:1235–1240. [DOI] [PubMed] [Google Scholar]
- 48.Fisher, R.C., J.D. Lovelock, and E.W. Scott. 1999. A critical role for PU.1 in homing and long-term engraftment by hematopoietic stem cells in the bone marrow. Blood. 94:1283–1290. [PubMed] [Google Scholar]
- 49.Harrison, D.E. 1980. Competitive repopulation: a new assay for long-term stem cell functional capacity. Blood. 55:77–81. [PubMed] [Google Scholar]
- 50.Stier, S., G. Totzke, E. Grunewald, T. Neuhaus, S. Fronhoffs, A. Sachinidis, H. Vetter, K. Schulze-Osthoff, and Y. Ko. 2000. Identification of syntenin and other TNF-inducible genes in human umbilical arterial endothelial cells by suppression subtractive hybridization. FEBS Lett. 467:299–304. [DOI] [PubMed] [Google Scholar]