Abstract
We tracked pathogenic myelin basic protein-specific CD4+ effector T cells in early central nervous system (CNS) lesions of experimental autoimmune encephalomyelitis (EAE) by combining two-photon imaging and fluorescence video microscopy. We made two key observations: (a) the majority of the cells (65%) moved fast (maximal speed 25 μm/min) and apparently nondirected through the compact tissue; and (b) a second group of effector T cells (35%) appeared tethered to a fixed point. Polarization of T cell receptor and adhesion molecules (lymphocyte function-associated antigen 1) towards this fixed point suggests the formation of immune synapses. Nonpathogenic, ovalbumin-specific T cells were not tethered in the CNS and did not form synapse-like contacts, but moved through the tissue. After intrathecal injection of antigen, 40% of ovalbumin-specific T cells became tethered. Conversely, injection of anti–major histocompatibility complex class II antibodies profoundly reduced the number of stationary pathogenic T cells within the CNS (to 15%). We propose that rapid penetration of the CNS parenchyma by numerous autoimmune effector T cells along with multiple autoantigen-presentation events are responsible for the fulminate development of clinical EAE.
Organ-specific autoimmune diseases are triggered commonly by tissue-specific autoaggressive T lymphocytes. These cells persist as normal components in the healthy immune repertoire. Only upon activation in the peripheral organism they reach their target organ via the bloodstream where they mount an attack against the local milieu, the starting point of a pathogenic inflammatory reaction (1, 2). This scenario essentially rests on observations that were made in a rodent model of brain autoimmunity, experimental autoimmune encephalomyelitis (EAE), but also has been verified in other models, such as autoimmune diabetes (3, 4).
EAE can be mediated in adult inbred rats or mice by parenteral transfers of freshly activated brain-specific CD4+ T cells. These encephalitogenic T cells enter the central nervous system (CNS) in two distinct waves. The first wave reaches the CNS within the first few hours following transfer, with just a few activated cells passing through the tight endothelial blood–brain barrier. However, these “pioneer cells” do not cause any immediate clinical or histological changes, but rather seem to prepare the CNS tissues for a second, much more massive wave of invading effector cells, which comes after a prodromal lag period of 3–4 d (5, 6). Then, within hours, the CNS tissue is infiltrated by millions of immune cells and macrophages, a process that coincides with the abrupt onset of neurological disease. We showed before that the inflammatory cell populations that enter the CNS at the onset of EAE are dominated by autoimmune effector cells (7). Using biological fluorescent labels, we found that in these initial stages of CNS invasion, >90% of all infiltrating CD4+ T cells are unequivocal effector lymphocytes. How can so many autoimmune T cells pass into a compact tissue, such as the CNS, within such a short period? How do the lymphocytes move through the parenchyma, and with which local cells do they interact?
We have traced the behavior of encephalitogenic effector T cells directly during the critical early phases of EAE development by real-time imaging approaches. We observed two distinct types of T cell behavior: (a) a major proportion of the autoimmune T cells meanders rapidly through the CNS tissue, and (b) a minor, although substantial, part of the cells seems to become attached to a fixed point and spins vividly around this pivot. We show that the attached, but not the migrant T cells target T cell receptor and cell adhesion molecules to the pivots, reminiscent of immune synapses.
RESULTS
Motility of encephalitogenic T cells in early EAE lesions
We induced EAE in Lewis rats by transferring myelin basic protein (MBP)-specific T cells (TMBP-GFP) which had been engineered retrovirally to express GFP (8). As expected, the fluorescent effector T cells invaded the CNS massively at the onset of clinical disease, 3–4 d after T cell transfer. We studied the behavior of these autoreactive T cells during this early clinical phase of EAE in live spinal cord slices by combining two-photon imaging and fluorescence videorecording.
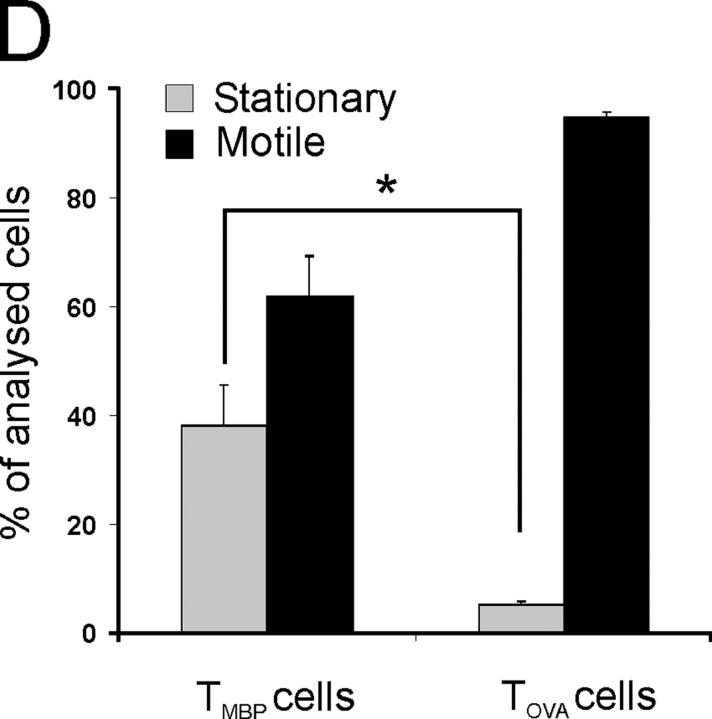
We found large numbers of fluorescent effector T cells throughout the CNS tissue. The cells were distributed evenly within the white and gray matter and infiltrated deep into the parenchyma (Fig. 1 A). Their locomotion paths were recorded first using three-dimensional time-lapse microscopy. All viable T cells (>90; Fig. S1, available at http://www.jem.org/cgi/content/full/jem.20050011/DC1) vividly changed their body shape (Video 1, available at http://www.jem.org/cgi/content/full/jem.20050011/DC1), but they differed radically in locomotor behavior; most of the cells (65%) cruised through the nervous tissue at high velocity (“motile” cells; Fig. 2, A and D; Video 2, available at http://www.jem.org/cgi/content/full/jem.20050011/DC1). At the same time, a minor set of cells (35%) remained confined to a narrow area (“stationary” cells; Fig. 2, B and D; Video 3, available at http://www.jem.org/cgi/content/full/jem.20050011/DC1).
Figure 1.
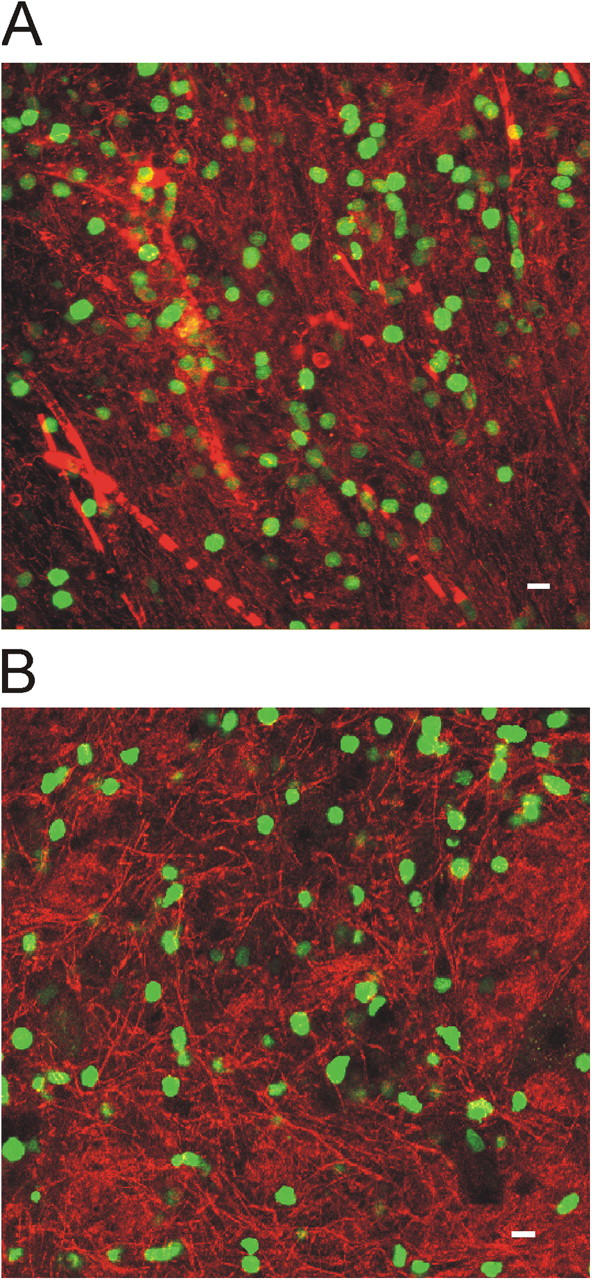
Distribution of TMBP-GFP and TOVA-GFP cells in early EAE lesions. (A) Confocal microscopy showing TMBP-GFP cells (green) in spinal cord lesions 4 days after transfer. Vessels are visualized by dextran–Texas red injection. (B) Distribution of TOVA-GFP cells in EAE lesions 4 d after cotransfer with nonlabeled TMBP cells. CNS parenchyma is labeled by Topro. Bars, 10 μm.
Figure 2.
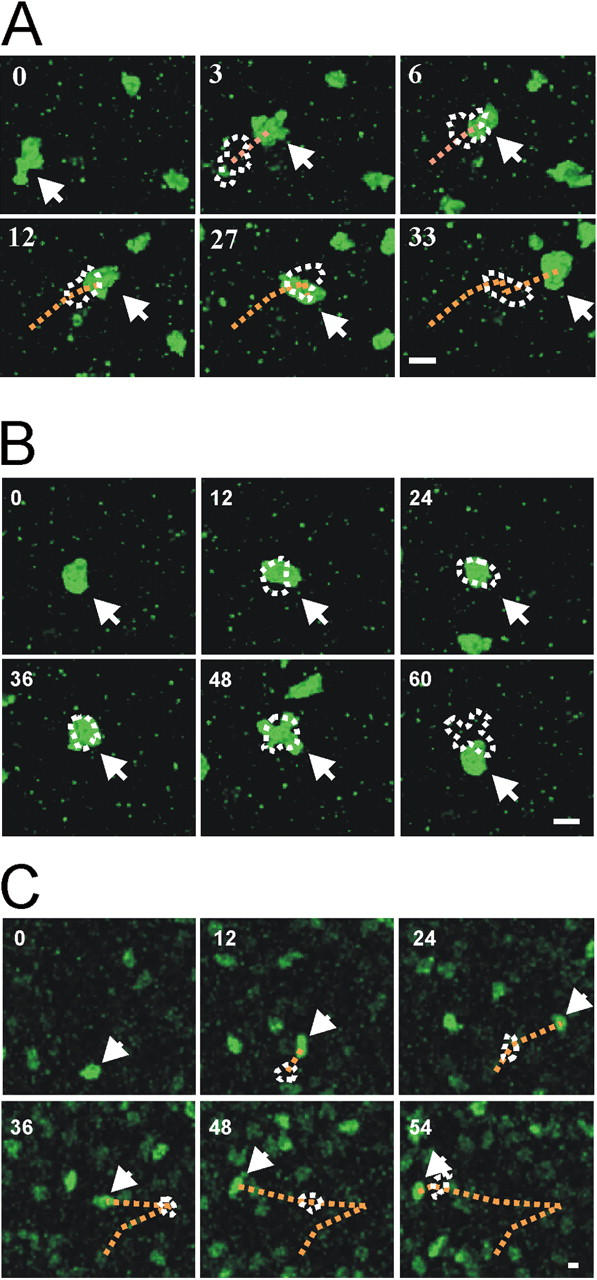
Motility of auto and control antigen-specific T cells in EAE lesions. (A, B) Two-photon live microscopy of TMBP-GFP cells in acute spinal cord slices. Two types of T cell movements are observed within CNS lesions: “motile” (A) and “stationary” (B) TMBP-GFP cells. Numbers indicate time after start of the analysis (minutes). Dotted lines indicate the trajectories and the cell shape of the preceding pictures. Arrows point to the tracked cells. Representative cells of 10 videos from four independent experiments. Bars, 10 μm. (C) Locomotion of TOVA-GFP cells in living spinal cord slices analyzed by two-photon analysis (4 d after cotransfer of TMBP cells and TOVA-GFP cells). A representative cell of 6 videos from three independent experiments is shown. Bar, 10 μm. (D) Proportion of motile versus stationary MBP- (TMBP cells) and OVA- (TOVA cells) specific T cells in living CNS slices (video microscopy). Motile T cells were defined as cells which migrated >10 μm in 10 min. Cells were grouped as stationary if they moved <10 μm in 10 min. TMBP cells: means ± SD from 6 independent experiments including >700 cells from 11 videos. TOVA cells: means ± SD of 187 cells from 4 videos and three independent experiments. Student's t test, *P < 0.001.
Locomotion characteristics of autoreactive T cells within the CNS
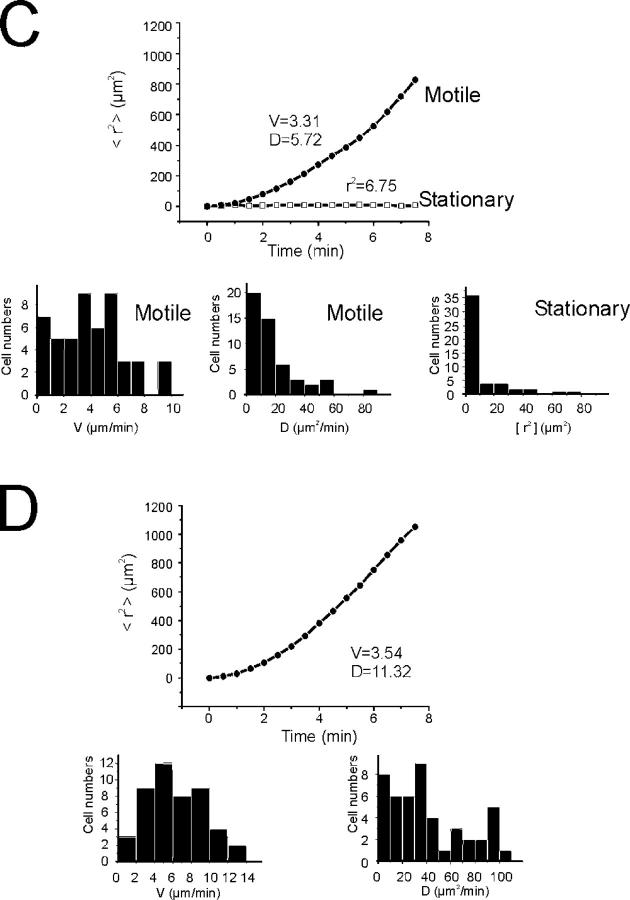
Chemokines are the main agents that control the formation of EAE infiltrates, and chemokine gradients should guide inflammatory cells into and through the CNS tissues. Therefore, it came as a surprise that the motile T cells did not cross the CNS parenchyma with any order but seemed to cruise through the tissue at random. Analysis of migratory trajectories showed that the vector sum of their directions and lengths was close to zero (Fig. 3 A). Stationary T cells seemed to be trapped in their location, but within this confine they were remarkably agitated. Apparently fixed to one particular anchor point, they changed their shapes rapidly by extending and retracting protrusions (Fig. 2 B). Mean square displacement plots confirmed the morphological observations: they distinguished two populations, a population with constant displacement over time (i.e., freely moving motile T cells) and a population of cells that reached a low plateau (<r2> = 6.75, stationary cells; Fig. 3 C).
Figure 3.
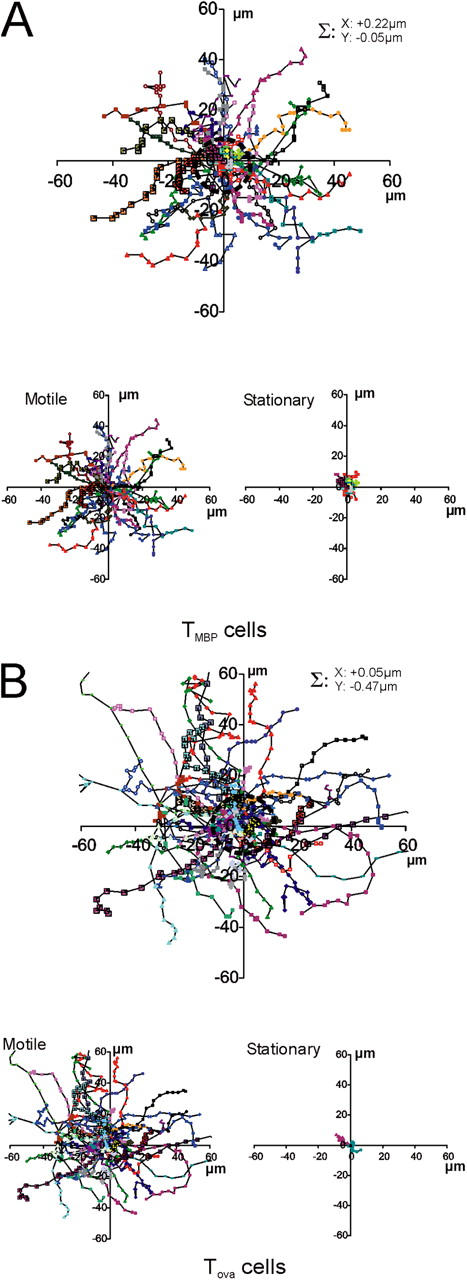
Encephalitogenic, but not control-antigen specific, TGFP cells show confined motility within the CNS. (A, B) Random walk of TGFP cells within the CNS. (A) Superimposed trajectories of TMBP-GFP cells (each line represents one cell) over a 10-min time span analyzed by video microscopy. Σ: trajectory vector calculated from the sum of all cell trajectory vectors divided by the number of cells (n = 200 cells). Top plot: trajectories of stationary and motile TMBP-GFP cells. Bottom left plot: motile T cells; bottom right plot: stationary T cells. 50 trajectories from 4 independent experiments. (B) Trajectories of TOVA GFP cells in the CNS. 50 trajectories from 3 independent experiments. (C, D) Mean square displacements of TGFP cells plotted against time. (C) Representative plots for a motile (circles) and a stationary (squares) TMBP-GFP cell are shown. The diffusion coefficient of D = 5.72 μm/min of the curve and the cell velocity of V = 3.31 μm/min indicate free movement of the motile cell. The motility of the stationary cell is strongly confined, as reflected by the plateau at r2 = 6.75. Bar diagrams: velocities and diffusion coefficients of 50 motile T cells, and r2 values of 50 stationary cells. Mean square displacements were calculated from 21,198 displacement steps. (D) Mean square displacements of TOVA-GFP cells within the CNS. A representative plot for a TOVA-GFP cell shows nonrestrained motility, indicated by a diffusion coefficient of D = 11.32 μm/min and a cell velocity of V = 3.54 μm/min. Bar diagrams: velocities and diffusion coefficients of 50 TOVA-GFP cells. 9,347 time points were analyzed for evaluation of mean square displacements.
The motile cells traveled with an average velocity of 6 μm/min; some reached maximal values of 25 μm/min (Fig. 4 A). However, this locomotion was not constant, but proceeded in a “stop and go” mode. Phases of rapid progression alternated with periods of slow movement or no motion (Fig. 4 C). Depending on their speed, the T cells seemed to change shape. During fast locomotion, many cells had a polarized shape with a broad leading edge followed by a slim tail—a uropod. After deceleration, which often was coincident with a change of direction, the T cells assumed an amoeboid shape with pseudopodia which extended in various directions (Video 4, available at http://www.jem.org/cgi/content/full/jem.20050011/DC1). The duration of fast and slow phases was similar (moving phase: 1.4 ± 0.7 min, resting phase: 1 ± 0.6 min; Fig. 4 C). The locomotor behavior of encephalitogenic T cells in the CNS lesion is reminiscent of T cells that migrate through peripheral lymphoid organs with comparable velocities, and along random migration tracks (9).
Figure 4.
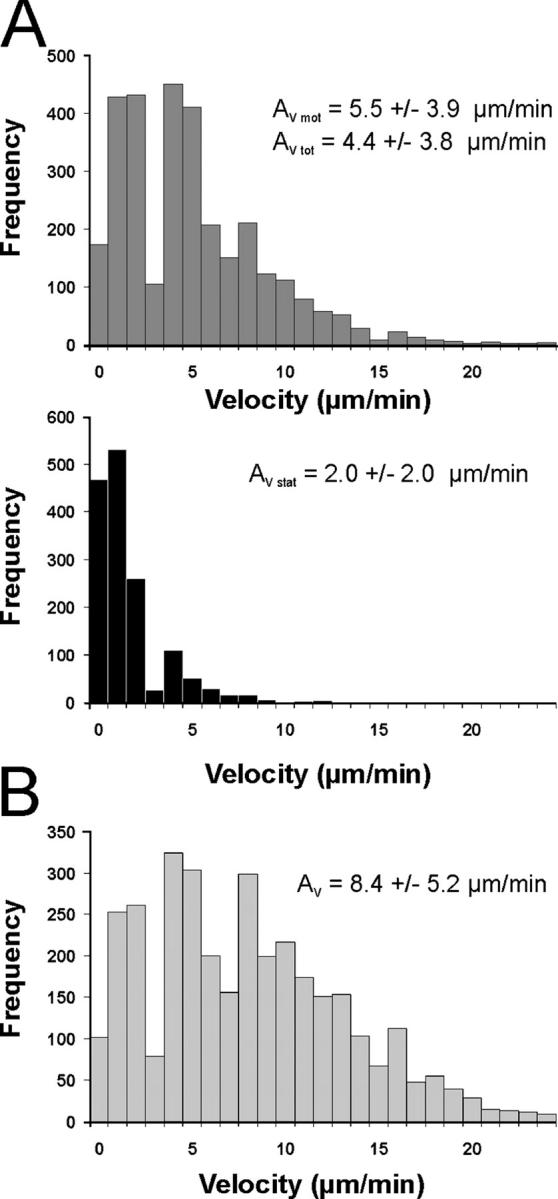
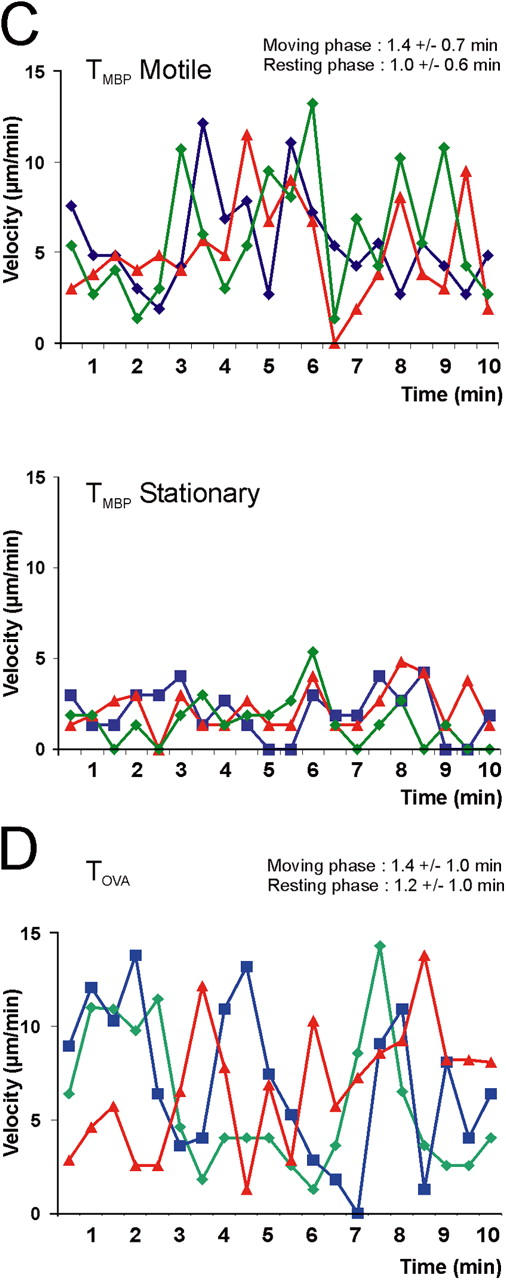
Movement pattern of TGFP cells within the CNS. (A, B) Velocity of TGFP cells in EAE lesions analyzed by fluorescence video microscopy. (A) TMBP-GFP cells were tracked in acute spinal cord slices 4 d after transfer, and the locomotion speed of motile (top histogram) and stationary (bottom histogram) cells was calculated. Instantaneous T cell velocities of 236 cells (160 motile and 76 stationary cells) determined at 10-s intervals up to 10 min (4,616 time points) are shown. Average velocity (Av) is indicated. AV mot: AV of motile TMBP-GFP cells, AV stat: AV of stationary TMBP-GFP cells, AV tot: AV of all analyzed TMBP-GFP cells. (B) Instantaneous velocities of TOVA-GFP cells in the CNS. 188 cells were analyzed every 30 sec up to 10 min (3,375 time points). (C, D) “Stop and go” motility mode of TGFP cells. (C) TMBP-GFP cells displayed characteristic transitions from moving to resting phases and vice versa on their way through the CNS tissue (determined by the velocity of the cells over time). Resting phases were defined as <5 μm/min, and moving phases were defined as >5 μm/min. The duration of these phases is indicated within the graph. Top graph: motile TMBP-GFP cells; bottom graph: stationary TMBP-GFP cells. Six representative cells out of 236 cells are shown. (D) Moving pattern of TOVA-GFP cells within the CNS. Three representative cells out of 188 cells are shown. Analysis by fluorescence video microscopy.
It is tempting to speculate that migratory encephalitogenic T cells scan the target tissue in search of “their” autoantigen as presented by local APCs, and that their stationary counterparts have found the autoantigen (i.e., they are in the process of recognition). This hypothesis makes several predictions: (a) only T cells with receptors for CNS autoantigens should enter a stationary phase; T cells specific for an antigen absent from the CNS should be permanently migrant; (b) the stationary MBP-reactive T cells should form structural features that reflect antigen recognition (e.g., immune synapse-like TCR polarizations); and (c) MBP-specific T cells, but not nonspecific T cells, should be reactivated within the CNS.
Motility of nonencephalitogenic T cells in EAE lesions
We studied first the behavior of CNS-nonspecific T cells. These do not enter the CNS spontaneously in substantial numbers (7). Only after local application of antigen do these cells accumulate in the CNS (10). However, also without artificial manipulations, CNS-nonspecific T cells can be lured into the CNS under two conditions: the CNS must be primed to become receptive for large number of T cells. Priming is achieved in a 3- to 4-d prodromal period between transfer of encephalitogenic effector T cells and onset of clinical EAE (7, 11). In addition, the nonspecific T cells must assume a functional profile (“migratory phenotype”) that enables them to go through a primed blood–brain barrier (7). Both conditions are fulfilled by cotransferring GFP-expressing OVA-specific T cells (TOVA-GFP cells) as reporters along with nonlabeled MBP-specific T cells, which prime the CNS (12). Such green OVA-specific T cells entered the CNS on day 4 after transfer, and distributed through the tissue just like their encephalitogenic counterparts (Fig. 1 B; reference 7). Also similar to MBP-specific T cells, the migratory tracks of TOVA-GFP cells within CNS lesions were random (Fig. 3 B), and their locomotion was saltatory (moving phase: 1.4 ± 1 min; resting phase: 1.2 ± 1 min; Fig. 4, B and D). However, TOVA-GFP cells differed strikingly from MBP-specific T cells by their high proportion of motile cells (95 ± 1%; Fig. 2, C and D; Video 5, available at http://www.jem.org/cgi/content/full/jem.20050011/DC1), as reflected in their higher average velocity (8 μm/min of the OVA-specific T cells versus 4 μm/min of the MBP-specific T cells) and the mean square displacement plots (Figs. 3 D and 4 B). The difference in motility patterns within the CNS between encephalitogenic and control antigen-specific T cells could not be attributed to intrinsic properties of the cells. The maximal velocity of OVA- and MBP-specific T cells in the CNS was identical (Fig. 4, A and B, and Fig. S2, available at http://www.jem.org/cgi/content/full/jem.20050011/DC1).
T cell motility within the CNS is dependent on the presence of antigen and MHC class II
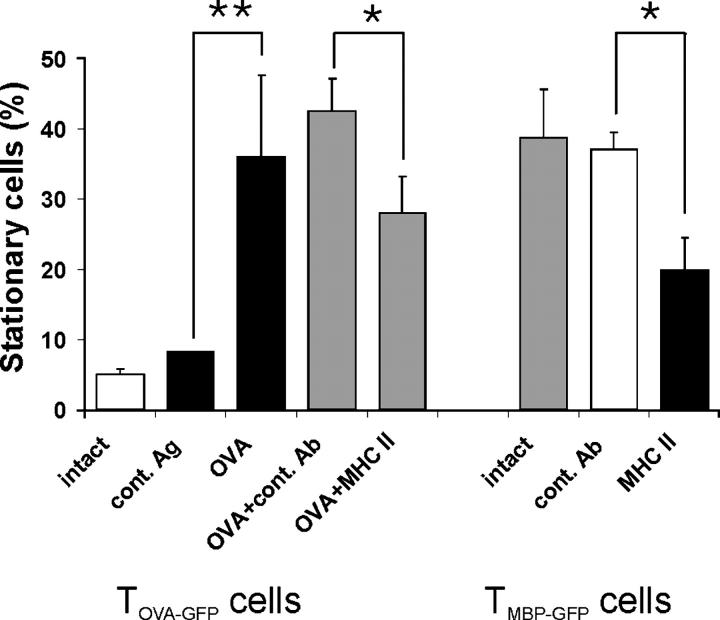
TOVA cells became stationary as soon as OVA was presented within the CNS. At the peak of their invasion into the CNS—4 d after coinjection with TMBP cells—soluble OVA or control antigen was applied intrathecally into the cisterna magna. After an additional 3 h, the motility of TOVA-GFP cells was analyzed in slices. In tissue treated with OVA, but not with control antigen, more than one third of the TOVA-GFP cells (36 ± 11%) had become stationary (Fig. 5). Conversely, we used antibodies against MHC class II to manipulate migration of TGFP cells. Intrathecal infusion of anti–MHC class II antibodies decreased the proportion of stationary TMBP-GFP cells (3 h after antibody injection) by 50% and of stationary TOVA-GFP cells by 30% after coinjection with OVA (Fig. 5).
Figure 5.
T cell motility depends on the presence of antigen and MHC class II. TOVA-GFP cells become stationary after intrathecal OVA injection. Live imaging of acute spinal cord slices 4 d after cotransfer of TMBP and TOVA-GFP cells. Left five bars: proportion of stationary TOVA-GFP cells without manipulation (white bar) or 3 h after intrathecal injection of the control antigen BSA (cont. Ag), OVA, OVA plus isotype Ig control (OVA + cont. Ab), or OVA plus anti-MHC class II antibody (OVA + MHC II). Means ± SD of 412 cells from eight videos and five independent experiments. *P < 0.02; **P < 0.002. Right three bars: blocking anti-MHC class II antibody reduces the number of stationary TMBP-GFP cells in the CNS. Proportion of stationary TMBP-GFP cells in spinal cord slices 3 h after intrathecal injection of anti-MHC class II antibodies (MHC II, black bar). No manipulation (intact) or injection of isotype control antibody (cont. Ab) served as controls. Means ± SD of 320 analyzed cells. Video recording of six videos of three independent experiments (P < 0.001). Statistical significances were evaluated using Student's t test.
Synapse-like structures of encephalitogenic T cells at their fix point
If stationary T cells are involved in a process of antigen recognition, they should form specialized contacts with putative APCs—“immune synapses” (13–15). As observed in cell culture or immune organs, such contacts could be transient or long-lasting, but they should entail polarized condensation of T cell receptors at the intercellular contact site. We analyzed living and fixed spinal cord tissue 4 d after transfer of TMBP-GFP cells using antibodies to TCR and LFA-1 epitopes, both essential components of immune synapses (Fig. 6). An unequivocally polarized pattern of TCR/LFA-1 was found in 27% (± 11%) of TMBP-GFP cells, whereas 73% (± 11%) displayed an even distribution. In three-dimensional reconstructions these “synapse-like” TCR/LFA-1 polarizations displayed a more dispersed pattern instead of the “classic” concentric, circularized compartmentalization of the molecules (Fig. 6, A–C, and Fig. S3, available at http://www.jem.org/cgi/content/full/jem.20050011/DC1). Notably, TCR polarizations of the autoreactive effector T cells regularly occurred at the contact zone with MHC class II+ cells (Fig. 6 D). To test if T cell motility correlated with TCR/LFA-1 distribution pattern, we analyzed immunohistochemically labeled living spinal cord slices (Fig. 6 E; Videos 6 and 7, available at http://www.jem.org/cgi/content/full/jem.20050011/DC1). Importantly, the antibody label did not alter the motility pattern of the cells substantially. The vast majority (97% ± 6%) of cells, which initially displayed a polarized TCR/LFA-1 formation, were stationary. Polarization of TCR/LFA-1 was localized at the fixed pole of the stationary cells (Fig. 6 E, Videos 6 and 7). However, 35% ± 7% of cells with an evenly distributed TCR/LFA-1 staining pattern also were stationary; this indicated that polarization of TCR/LFA-1 is highly predictive but is not required for cells to become stationary. TOVA-GFP cells that were recruited to the CNS after cotransfer with MBP-specific T cells did not show a polarized distribution pattern of TCR/LFA-1 (<3% ± 2%).
Figure 6.
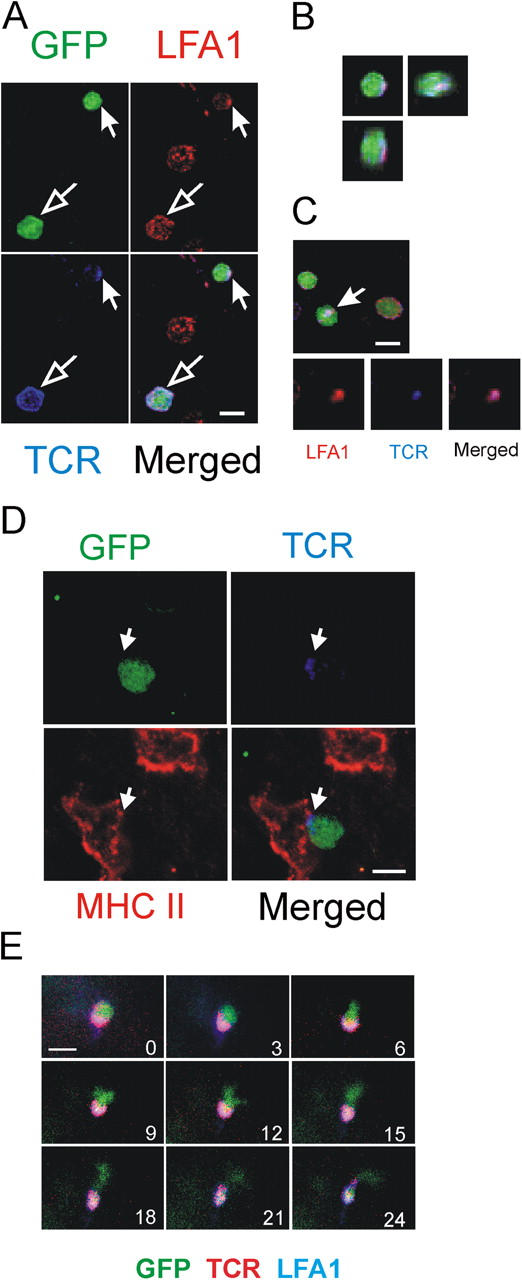
Immune synapses-like membrane structures in the CNS. (A) Polarization of TCR/LFA-1 in TMBP-GFP cells 4 d after transfer in spinal cord slices. Confocal imaging, immunostaining with TCR/LFA-1. GFP (green), LFA-1 (red), TCR (blue). TMBP-GFP cells with polarized (closed arrow) and evenly distributed (open arrow) TCR/LFA-1 pattern. (B) Three-dimensional reconstruction of the synapse-like–forming TMBP-GFP cell (indicated cell from Fig. 6 A). (C) Contact plane of a TMBP-GFP cell with synapse-like TCR/LFA-1 polarization (arrow). (D) TMBP-GFP cell (green) contacting a MHC class II+ cell (red). Note the polarization of TCR (blue) at the contact point of the cells. (E) TMBP-GFP cells that form synapse-like TCR/LFA-1 polarizations are “stationary.” Fluorescence video microscopy of living spinal cord tissue 4 d after transfer stained with anti-TCR/LFA-1 antibodies. Numbers indicate the time points of image acquisition. Overlay of GFP (green), TCR (red), and LFA1 (blue) is shown. Bars, 10 μm.
DISCUSSION
This is the first life imaging study of autoantigen-specific CD4+ effector T cells in developing EAE lesions. Our work was prompted by the recent discovery that the inflammatory immune infiltrates are initiated by a mass invasion of effector T cells into the CNS parenchyma (7). We used optical imaging approaches to analyze the behavior of intraparenchymal autoimmune T cells and we made several unexpected observations. The effector cells did not ooze into the compact CNS tissue but moved with high speed and with a peculiar locomotion pattern. Furthermore, a surprisingly high percentage (>30%) of the autoimmune effector T cells were in the process of antigen recognition. These cells were spinning around fixed points and forming long-lasting, synapse-like contacts with MHC class II–expressing cells.
We used two well-established live imaging techniques—two-photon microscopy and fluorescence video microscopy—to track the effector T cells in EAE lesions. These techniques complement each other and lead to equivalent results (Table S1, available at http://www.jem.org/cgi/content/full/jem.20050011/DC1). In particular, the proportion of stationary and motile cells and the calculated cell velocities were comparable. Although phototoxicity and photo-bleaching set serious limitations to conventional video microscopy, within the observation period of 1 h we did not observe such substantial effects. Video microscopy allowed recording of large observation fields with fast acquisition rates; however, as expected, it was limited to lower penetration depths (∼50 μm) than two-photon microscopy (100–150 μm). Again, this limitation did not affect the results, which indicated that T cells close to the slice surface move similarly to T cells that are deep within the tissue.
How can effector T cells move through compact CNS tissue as fast as through “fluid” lymphoid tissues? Which driving forces push the cells forward, and which mechanisms clear their way through the parenchyma? It must be considered that we studied living spinal cord tissue explants. Disconnection from the blood stream may have influenced migratory behaviors. Two facts argue against this possibility; first, the CNS parenchyma is separated from blood flow by a dense endothelial blood–brain barrier which does not permit free diffusion of blood-borne cells and molecules. Second, even in lymphoid organs with their porous vasculature, no gross differences of lymphocyte migration have been noted between organs that were studied in situ or those that were explanted in culture (16). The random tracks of fast migrating T cells argue against long-distance chemotactic gradients, but they do not rule out local chemotaxis via soluble signals that are secreted by the cells which form the local milieus. It is known that many CNS cells, glia, and even neurons produce chemokines, in particular following proinflammatory induction. Alternatively, contact-dependent locomotor signals (“haptotaxis”) may play a role. The fast opening of migratory tracks through compact tissue is another mystery. The CNS parenchyma is a compact tissue which is composed of myelinated axons embedded in glia cells, and these cells are interconnected by extracellular matrix to form the “perineuronal net” (17). This makes it difficult to imagine that mere mechanical force opens the way. There may be additional, positively acting factors at work, including proteolytic enzymes. In fact, recent screening studies of gene expression profiles by intralesional effector T cells using microarray approaches, demonstrated up-regulation of broad panels of proteases (unpublished data).
We interpret the data of this study to suggest that the immobilized MBP-specific T cells within EAE lesions are in the process of antigen recognition and become reactivated. Activation of encephalitogenic T cells has been documented in situ and ex vivo (7). The ultimate outcome of this reactivation process (T cell proliferation and activation-induced cell death) has not been addressed by our present work (18, 19). However, our finding that OVA-specific T cells that are recruited to the CNS are not locally reactivated but show similar apoptosis rates (Fig. S1), may favor an environmental, rather than reactivation-related proapoptotic mechanism.
Previous reports characterized the initial contacts between naive T cells and APCs as multiple and short-lived (20). Later in the antigen-priming process, longer-lasting contacts were observed. Interestingly, there were no gross differences between the behavior of naive CD4+ and CD8+ T cells (21). In the EAE lesions that were studied here, the contacts between T cells and stroma were long-lasting and solid. Compared with OVA-specific T cells, motile MBP-specific T cells moved more slowly (Figs. 3 and 5). In the presence of antigen, however, OVA-specific T cells reduced their velocity and assumed the behavior of motile MBP-specific T cells (Fig. S2). Whether this deceleration reflects formation of multiple, antigen-dependent ephemeral contacts of effector cells and APCs or is due to a general reduction of velocity remains to be established.
Although it is possible that early, ephemeral contacts remained undetected for technical reasons, our model differs substantially from the systems that were used by previous investigators. The effector T cells that were used in our studies were antigen-experienced CD4+ T line cells which had been activated in vitro before transfer, and had undergone a complex rearrangement of their gene expression pattern on the way to the CNS and within the target tissue. Further, most potential target cells in inflammatory spinal cord were facultative, not constitutive APCs, which required proinflammatory signals to become capable of processing and presenting protein (auto-)antigens, and they are virtually ubiquitous within the CNS tissues.
A recent report described synapse-like contacts between GFP-transgenic CD8+ T cells with lymphocytic choriomeningitis virus specific receptors and infected CNS cells in fixed tissue samples (22). Reflecting the viral expression pattern, the T cells were concentrated in the leptomeninges and the choroid plexus, but rarely penetrated the brain parenchyma. Our study demonstrates countless synapse-like contacts within the CNS tissue. Each of these contacts may trigger profuse secretion of cytokines, chemokines, and other soluble mediators.
Our findings may help to explain the abrupt development of clinical EAE after a symptom-free prodromal period. We reported previously that the CNS tissues are invaded by millions of autoimmune T cells during the initial phases of EAE (7). A large proportion of these cells becomes activated there, and the level of reactivation dictates the clinical severity of the ensuing EAE (23). Our live imaging studies show, for the first time, the dynamic nature of effector cell invasion. Encephalitogenic effector T cells invade into all areas of the CNS tissue (Table S2, available at http://www.jem.org/cgi/content/full/jem.20050011/DC1). The affected tissue is zigzagged permanently by a major part of these effector cells, whereas another, somewhat minor part of the cells gets arrested and forms contacts with local MHC class II+ APCs (Table S2). Both processes may be required to set the stage for the development of clinical EAE. Penetration of the compact, highly vulnerable CNS tissue by millions of effector T cells may break up organized structures via mere mechanical force and/or enzymatic digestion. Disruption of the perineuronal net, which stabilizes synapses in the adult brain, should affect interneuronal communication directly and lead to neurological deficiency. Our recent observation that CNS autoreactive T cells with low pathogenic potential intensively infiltrate the CNS, but do not become highly activated (23), may argue against T cell migration as a prevalent mechanism in the acute inflammatory pathogenesis.
More important may be the effect of antigen recognition by the infiltrated effector cells. Considering the amazing density of immune synapse-like contacts between T cells and target tissue, there should be a correspondingly high level of T cell-derived proinflammatory mediators. We propose that these mediators act directly on neuronal cells; indirectly by activating local glial cells; and finally, by attracting and stimulating blood-borne monocytes/macrophages.
These data are of relevance for the understanding of disease mechanisms in multiple sclerosis and other organ-specific autoimmune diseases. Furthermore, these findings may open new targets for successful therapeutic strategies.
MATERIALS AND METHODS
Animals and antigens
Lewis rats were obtained from the animal breeding facilities of the Max-Planck-Institute for Neurobiology and were kept under standardized conditions. Antigen-specific T cell clones used in the study were specific for guinea pig MBP and OVA. MBP was purified from guinea pig brains as described (24). Hen egg OVA and BSA were obtained from Sigma-Aldrich. All animal experiments were performed with the license of the Regierung von Oberbayern (No: 209.1/211-2531-56/99).
Generation of T cells and EAE induction
MBP- and OVA-specific CD4+ T cells that were engineered retrovirally to express the marker gene EGFP were generated as described previously (8). For EAE induction, 5 × 10⁶ cells were injected intravenously into healthy recipient rats. In coinjection experiments, 5 × 10⁶ nonlabeled MBP-specific T cells were transferred together with 10 × 106 GFP+ OVA-specific T cells. The animals were monitored daily by measuring weight and examining disease scores (8).
Acute spinal cord slices
Animals were killed under deep anesthesia and spinal cords were explanted. Acute slices (thickness: 300 μm) of spinal cords were prepared with a tissue chopper (Mickle Laboratory Engineering) and immediately transferred into ice cold artificial cerebral–spinal fluid buffer (ACSF: 1.25 mM NaH2PO4, 26 mM NaHCO3, 126 mM NaCl, 2.5 mM CaCl2, 2.5 mM KCl, 1 mM MgCl2, 10 mM glucose, 1 mM pyruvate, 50 μM glycine) oxygenized with 95% O2 5% CO2.
Live cell imaging
Two-photon system.
Time-lapse two-photon laser-scanning microscopy was used to produce time-lapse images of the movements of EGFP-positive T cells in all three spatial dimensions. Spinal cord slices were placed in a custom-made chamber maintained at 35°C and continuously superfused with carbogenated ACSF (95% O2 5% CO2). The red excitation light (λ = 840 nm) from a 5 W Mira-Verdi laser system (Coherent) was routed through a Fluoview 200 scanner (Olympus), a suitable dichroic mirror (LOT Oriel), and a 40×, 1.2 numerical aperture (NA) water immersion objective (Carl Zeiss Microimaging, Inc.) mounted on an inverted IX70 microscope (Olympus). The power of the excitation light could be adjusted continuously by an acousto-optical modulator (Polytec); its average value at the objective was set to 10–20 mW. The fluorescence was detected by an external photomultiplier tube (R6357, Hamamatsu). Image acquisition and online analysis was performed by Fluoview software (Olympus) and image stacks were saved to disk for off-line analysis. The image resolution was 691 nm/pixel in x-y, with a field of view of 383 × 383 μm2. A piezoelectrical actuator (Physik Instrumente) was used to move the objective in the z-axis (Δz = 3 μm) over a total depth of 60 μm. Images were Kalman-averaged over three frames. The stacks were acquired every 3 min or where indicated every 30 s for 1 h. For the higher acquisition rates, the image was Kalman-averaged over two frames and the field was reduced to 190 × 190 μm2 in the x-y direction and 30 μm in depth.
Image analysis.
Four-dimensional (x,y,z,t) image stacks were processed and analyzed using the Imaris 4 software (Bitplane). Individual stacks were subjected to a Gaussian spatial filter, rescaled, and baseline-subtracted. To facilitate overview, the three-dimensional stacks were volume-rendered as two-dimensional images; however, all image analysis was done by visual inspection of the individual image sections. Cell trajectories and cell velocity were evaluated using the Imaris software.
For statistical evaluation of the respective movements, 21,198 mean square displacement steps (of 50 stationary and motile MBP-specific T cells, respectively) were analyzed for MBP-specific T cells and 9,347 steps were analyzed for OVA-specific T cells. The distribution function for square displacements was analyzed by applying the microscopic theory of diffusion, according to Fick's second law. All plots were fitted by using Origin software (Microcal; reference 25). Mean square displacements were calculated with the following formula: P(r2,t) = 1−exp(−r2/r1 2) where P = probability, r = displacements, t = time, and r1 = fitting parameter. Motile and stationary mean square displacement were fitted to y = 4 • D • x + (v • x)2 and y = r2c • {1−A1 • exp[(-4 • A2 • D • x)/r2c]}, respectively, where r2c = square of confined radius and A1 and A2 are fitting parameters.
Fluorescence video microscopy.
Acute slices were prepared and treated as described above. Time-lapse recordings were performed at an inverted microscope (Zeiss, Axiovert 200M) equipped with a 20×, 0.4 NA objective and a 40×, 0.6 NA objective (Zeiss). Images were acquired using a Coolsnap-HQ camera (Photometrics, Roper Scientific) in 30-s time intervals and analyzed using MetaMorph (Visitron Systems) and Image J software (Freeware, provided by Wayne Rasband, National Institutes of Health, Bethesda, MD).
Intrathecal antigen and antibody applications
Stereotactic intrathecal injection was performed into the cisterna magna of anesthetized rats (300 mg/kg chloralhydrate, Merck; reference 23). Antigens (30 μg of OVA or BSA as control antigen; Sigma-Aldrich) or antibodies (30 μg anti-MHC class II or isotype control antibody) were injected 3 h before spinal cord preparation. For blocking experiments with intrathecal OVA and MHC class II antibodies, 10 μg OVA and 30 μg anti-MHC class II antibody/isotype control antibody were injected.
Fluorescence immunolabeling
Spinal cord slices were incubated for 30 min with anti-TCR (R73), anti–LFA-1, or anti-MHC class II (OX-6) Mab (dilution 1:300) in PBS 5% FCS. The antibodies were obtained from Becton Dickinson. After washing for 10 min in PBS 5% FCS, secondary staining was performed with Cy3-conjugated anti–mouse antiserum (dilution 1:1,000, Dianova). For double staining, biotin-conjugated anti-TCR antibody (diluted 1:300, Becton Dickinson) detected by cy5-conjugated streptavidine (dilution 1:1,000; Molecular Probes) was used. All staining steps were performed at 4°C. The slices were imaged under cooled conditions followed by time-lapse recordings after rewarming to 35°C. Means ± SD from four independent experiments, including >400 cells, are shown.
For staining with annexin V and active caspase 3, TMBP-GFP or TOVA-GFP cells were isolated from spinal cords 4 d after transfer as described (7). Allophycocyanin-labeled annexin V was obtained from Becton Dickinson. Staining was performed according to the manufacturer's recommended protocol. Rabbit anti-active caspase 3 antiserum (clone AF835) was purchased from R&D Systems. After isolation from spinal cords, T cells were fixed for 20 min in 2% PFA. Blocking and permeabilization was performed with PBS 0.1% Triton X-100 (Sigma-Aldrich) containing 5% FCS. Active caspase 3 antiserum (dilution 1:100) was incubated overnight at 4°C followed by detection of specific binding with PE-labeled goat anti–rabbit antiserum (Dianova; dilution 1:500). Analysis was performed with FACSCalibur (Becton Dickinson).
Confocal analysis
Immunohistochemical staining with Topro (Molecular Probes) of spinal cord sections after fixation with 4% paraformaldehyde was performed as described previously (7). For visualization of blood vessels, Texas red labeled dextran (Molecular Probes) was injected 0.5 h before preparation of spinal cord slices and fluorescence analysis. Fluorescence staining was evaluated using confocal laser-scanning microscopy equipped with 40×, 1.25–0.75 NA or 63×, 1.4–0.6 NA oil objectives (Leica).
Online supplemental material
Table S1 shows a comparative analysis of motility of encephalitogenic T cells in EAE lesions analyzed by two-photon microscopy and fluorescence video microscopy. Table S2 depicts the proportions of stationary and motile encephalitogenic T cells in different areas of the inflamed CNS. Fig. S1 shows the apoptosis rate (annexin V, active caspase 3) of TMBP and TOVA GFP cells in inflamed spinal cord lesions. Fig. S2 depicts the influence of antigen on the velocity of motile nonencephalitogenic T cells in EAE lesions. Fig. S3 supplements Fig. 6 E. Online supplemental material is available at http://www.jem.org/cgi/content/full/jem.20050011/DC1.
Acknowledgments
We thank I. Haarmann and S. Kosin for excellent technical assistance and T. Endress and C. Bräuchle for help with statistical analysis. We are grateful to Drs. D. Jenne and E. Meinl for critically reading the text.
This work was supported by the Deutsche Forschungsgemeinschaft (SFB 455), the European Community (Mechanisms of Brain Inflammation: QLG3-CT-2002-00712), and by funds from the Grand Prix Louis D awarded to H. Wekerle by the Institut de Frances. The authors also acknowledge the technical help within the collaboration between the BIZ, University of Munich, TILL Photonics GmbH, and the Max-Planck-Institute.
The authors have no conflicting financial interests.
Abbreviations used: CNS, central nervous system; EAE, experimental autoimmune encephalomyelitis; MBP, myelin basic protein; NA, numerical aperture.
References
- 1.Steinman, L. 1996. A few autoreactive cells in an autoimmune infiltrate control a vast population of nonspecific cells: A tale of smart bombs and the infantry. Proc. Natl. Acad. Sci. USA. 93:2253–2256. [DOI] [PMC free article] [PubMed] [Google Scholar]
- 2.Ben-Nun, A., H. Wekerle, and I.R. Cohen. 1981. The rapid isolation of clonable antigen-specific T lymphocyte lines capable of mediating autoimmune encephalomyelitis. Eur. J. Immunol. 11:195–199. [DOI] [PubMed] [Google Scholar]
- 3.Wekerle, H., K. Kojima, J. Lannes-Vieira, H. Lassmann, and C. Linington. 1994. Animal models. Ann. Neurol. 36:S47–S53. [DOI] [PubMed] [Google Scholar]
- 4.Delovitch, T.L. and B. Singh. 1997. The nonobese diabetic mouse as a model of autoimmune diabetes: Immune dysregulation gets the NOD. Immunity. 7:727–738. [DOI] [PubMed] [Google Scholar]
- 5.Wekerle, H., C. Linington, H. Lassmann, and R. Meyermann. 1986. Cellular immune reactivity within the CNS. Trends Neurosci. 9:271–277. [Google Scholar]
- 6.Hickey, W.F., B.L. Hsu, and H. Kimura. 1991. T lymphocyte entry into the central nervous system. J. Neurosci. Res. 28:254–260. [DOI] [PubMed] [Google Scholar]
- 7.Flügel, A., T. Berkowicz, T. Ritter, M. Labeur, D. Jenne, Z. Li, J. Ellwart, M. Willem, H. Lassmann, and H. Wekerle. 2001. Migratory activity and functional changes of green fluorescent effector T cells before and during experimental autoimmune encephalomyelitis. Immunity. 14:547–560. [DOI] [PubMed] [Google Scholar]
- 8.Flügel, A., M. Willem, T. Berkowicz, and H. Wekerle. 1999. Gene transfer into CD4+ T lymphocytes: Green fluorescent protein engineered, encephalitogenic T cells used to illuminate immune responses in the brain. Nature Med. 5:843–847. [DOI] [PubMed] [Google Scholar]
- 9.Miller, M.J., S.H. Wei, M.D. Cahalan, and I. Parker. 2003. Autonomous T cell trafficking examined in vivo with intravital two-photon microscopy. Proc. Natl. Acad. Sci. USA. 100:2604–2609. [DOI] [PMC free article] [PubMed] [Google Scholar]
- 10.Westland, K.W., J.D. Pollard, S. Sander, J.G. Bonner, C. Linington, and J.G. McLeod. 1999. Activated non-neural specific T cells open the blood-brain barrier to circulating antibodies. Brain. 122:1283–1291. [DOI] [PubMed] [Google Scholar]
- 11.Bauer, J., M. Bradl, W.F. Hickey, S.J. Forss-Petter, H. Breitschopf, C. Linington, H. Wekerle, and H. Lassmann. 1998. T cell apoptosis in inflammatory brain lesions. Destruction of T cells does not depend on antigen recognition. Am. J. Pathol. 153:715–724. [DOI] [PMC free article] [PubMed] [Google Scholar]
- 12.Tabi, Z., P. McCombe, and M.P. Pender. 1995. Antigen-specific down-regulation of myelin basic protein-reactive T cells during spontaneous recovery from experimental autoimmune encephalomyelitis: Further evidence of apoptotic deletion of autoreactive T cells in the central nervous system. Int. Immunol. 7:967–973. [DOI] [PubMed] [Google Scholar]
- 13.Grakoui, A., S.K. Bromley, C. Sumen, M.M. Davis, A.S. Shaw, P.M. Allen, and M.L. Dustin. 1999. The immunological synapse: A molecular machine controlling T cell activation. Science. 285:221–227. [DOI] [PubMed] [Google Scholar]
- 14.Monks, C.R., B.A. Freiberg, H. Kupfer, N. Sciaky, and A. Kupfer. 1998. Three-dimensional segregation of supramolecular activation clusters in T cells. Nature. 395:82–86. [DOI] [PubMed] [Google Scholar]
- 15.Bromley, S.K., W.R. Burack, K.G. Johnson, K. Somersalo, T.N. Sims, C. Sumen, M.M. Davis, A.S. Shaw, P.M. Allen, and M.L. Dustin. 2001. The immunological synapse. Annu. Rev. Immunol. 19:375–396. [DOI] [PubMed] [Google Scholar]
- 16.Sumen, C., T.R. Mempel, I.B. Mazo, and U.H. von Andrian. 2004. Intravital microscopy: Visualizing immunity in context. Immunity. 21:315–329. [DOI] [PubMed] [Google Scholar]
- 17.Fox, K. and B. Caterson. 2002. Freeing the brain from the perineuronal net. Science. 298:1187–1189. [DOI] [PubMed] [Google Scholar]
- 18.Schmied, M., H. Breitschopf, R. Gold, H. Zischler, G. Rothe, H. Wekerle, and H. Lassmann. 1993. Apoptosis of T lymphocytes—a mechanism to control inflammation in the brain. Am. J. Pathol. 143:446–452. [PMC free article] [PubMed] [Google Scholar]
- 19.Pender, M.P., K.B. Nguyen, P.A. McCombe, and J.F.R. Kerr. 1991. Apoptosis in the nervous system in experimental allergic encephalomyelitis. J. Neurol. Sci. 104:81–87. [DOI] [PubMed] [Google Scholar]
- 20.Miller, M.J., A.S. Hejazi, S.H. Wei, M.D. Cahalan, and I. Parker. 2004. T cell repertoire scanning is promoted by dynamic dendritic cell behavior and random T cell motility in the lymph node. Proc. Natl. Acad. Sci. USA. 101:998–1003. [DOI] [PMC free article] [PubMed] [Google Scholar]
- 21.Mempel, T.R., S.E. Henrickson, and U.H. von Andrian. 2004. T-cell priming by dendritic cells in lymph nodes occurs in three distinct phases. Nature. 427:154–159. [DOI] [PubMed] [Google Scholar]
- 22.McGavern, D.B., U. Christen, and M.B.A. Oldstone. 2002. Molecular anatomy of antigen-specific CD8+ T cell engagement and synapse formation in vivo. Nature Immunol. 3:918–925. [DOI] [PMC free article] [PubMed] [Google Scholar]
- 23.Kawakami, N., S. Lassmann, Z. Li, F. Odoardi, T. Ritter, T. Ziemssen, W.E.F. Klinkert, J. Ellwart, M. Bradl, K. Krivacic, et al. 2004. The activation status of neuroantigen-specific T cells in the target organ determines the clinical outcome of autoimmune encephalomyelitis. J. Exp. Med. 199:185–197. [DOI] [PMC free article] [PubMed] [Google Scholar]
- 24.Eylar, E.H., P.J. Kniskern, and J.J. Jackson. 1979. Myelin basic proteins. Methods Enzymol. 32B:323–341. [PubMed] [Google Scholar]
- 25.Seisenberger, G., M.U. Ried, T. Endress, H. Büning, M. Hallek, and C. Bräuchle. 2001. Real-time single-molecule imaging of the infection pathway of an adeno-associated virus. Science. 294:1929–1932. [DOI] [PubMed] [Google Scholar]


