

Abstract
The transcription factors signal transducer and activator of transcription (STAT)1 and T-bet control the differentiation of interferon (IFN)-γ–producing T helper type (Th)1 cells. Here we compare the role of T-bet and STAT1 in the initiation and regulation of experimental autoimmune encephalomyelitis (EAE), a disease initiated by Th1 cells. T-bet–deficient mice immunized with myelin oligodendrocyte glycoprotein (MOG) were resistant to the development of EAE. This protection was also observed when T-bet−/− mice were crossed to the MOG-specific 2D2 T cell receptor transgenic strain. In contrast, although T-bet is downstream of STAT1, STAT1−/− mice were highly susceptible to EAE and developed more severe and accelerated disease with atypical neuropathologic features. The function of T-bet was dominant as mice deficient in both T-bet and STAT1 were also protected from EAE. CD4+ CD25+ regulatory T cells from these two mice strains were fully competent and do not explain the difference in disease susceptibility. However, enhanced EAE in STAT1−/− mice was associated with continued generation of IFN-γ–producing Th1 cells and up-regulation of selective chemokines responsible for the increased recruitment of macrophages and neutrophils in the central nervous system. Although the two transcription factors, STAT1 and T-bet, both induce IFN-γ gene transcription, our results demonstrate marked differences in their function in regulating pathogenic Th1 cell responses.
Keywords: MOG, 2D2 TCR transgenic mice, Th1 cell, IL-10, chemokines
Introduction
After encounter with antigen, naive CD4+ T cells differentiate into two different subsets, Th1 and Th2 cells, characterized by distinct functions and cytokine profiles. Th1 cells secrete IFN-γ and mediate delayed-type hypersensitivity responses. Th2 cells produce IL-4, IL-5, and IL-13, provide help to B cells, and mediate protection against extracellular pathogens (1). The differentiation of Th cells into Th1 or Th2 cell subsets is controlled by a number of different factors including the strength of TCR signal, the type of APCs, and costimulatory molecule engagement. However, cytokines and the transcription factors that lie downstream of them play a dominant role in T cell differentiation. More specifically, the transcription factors T-bet, signal transducer and activator of transcription (STAT)1, STAT4, and c-Rel are essential for the development of Th1 cells while GATA3, c-maf, JunB and STAT6 transcription factors are involved in the differentiation of Th2 cells (2–4).
Experimental autoimmune encephalomyelitis (EAE) is a T cell–mediated autoimmune disease of the central nervous system (CNS), which serves as an animal model for multiple sclerosis. EAE is typically characterized by lymphocytic and mononuclear cell inflammatory infiltrates and demyelination throughout the CNS (5, 6). There is strong evidence indicating that Th1 cells are critical for the initiation of the disease in immunocompetent animals. First, Th1 cell–type cytokines are present in inflammatory EAE lesions in the CNS during active disease and are down-regulated during remission (7, 8). Furthermore, adoptive transfer experiments show that encephalitogenic T cell clones possess a typical Th1 cell phenotype (9, 10). Although the pathogenic role of Th1 cells in EAE has been established, the role of IFN-γ, a key cytokine for Th1 cell development and effector functions, is poorly understood. Previous data indicate that IFN-γ−/− and IFN-γR−/− mice are more susceptible to EAE induction, suggesting a protective rather than a disease-promoting role of IFN-γ (11–14).
T-bet has been identified as a key transcription factor for the development of Th1 cells and the induction of IFN-γ production (3, 15). When ectopically expressed, T-bet induces Th1 cell differentiation of Th precursor cells and of polarized Th2 cells. In addition, mice deficient for T-bet do not develop Th1 cells and fail to control Th1 cell–dependent protozoan infection (16). IFN-γR signaling with subsequent STAT1 phosphorylation is critical for the induction of T-bet in T cells (17, 18). These results suggest that the activation of naive T cells with specific antigen/MHC ligands in the presence of IFN-γ is sufficient for T-bet expression. Lighvani et al. (17) suggest the presence of a positive feedback loop between IFN-γ STAT1 and T-bet by which IFN-γ STAT1–driven T-bet expression induces further IFN-γ production in Th1 cells.
We have evaluated the role of the STAT1–T-bet circuit in EAE using mice selectively deficient in the transcription factors T-bet or STAT1. We show that T-bet–deficient mice are resistant to EAE development and that STAT1-deficient mice, like IFN-γ−/− mice, are highly susceptible to EAE. CD4+ T cells from STAT1−/− and T-bet−/− mice proliferate equally well in response to the encephalitogenic peptide myelin oligodendrocyte glycoprotein (MOG) 35-55, but T-bet−/− mice completely fail to generate Th1 cells In contrast, STAT1−/− mice retain a significant number of IFN-γ–producing Th1 cells. Mice lacking both T-bet and STAT1 are also protected from the development of EAE. Taken together, these data provide strong evidence for a key role of T-bet in regulating pathogenic T cells in EAE. In addition, our results suggest that lack of IFN-γ signaling in STAT1−/− mice results in the up-regulation of chemokines mediating the recruitment of macrophages and neutrophils in the CNS.
Materials and Methods
Animals.
C57Bl/6 2D2 TCR transgenic mice are transgenic for a TCR recognizing the CNS autoantigen MOG and have been described previously (19). 129S6/SvEv STAT1−/− (20) and 129S6/SvEv control mice were obtained from Taconic. T-bet−/− mice have been backcrossed onto C57Bl/6 for at least five generations and have been described previously (16). 2D2 STAT1−/− mice have been backcrossed onto the C57Bl/6 strain for one generation. T-bet−/− STAT1−/− mice were generated by intercrossing T-bet−/+ STAT1−/+ mice. To generate 2D2 TCR transgenic mice selectively deficient in T-bet or STAT1 and their littermate controls, T-bet−/− or STAT1−/− mice were crossed with 2D2 TCR transgenic mice. 2D2+ T-bet+/− or 2D2+ STAT1+/− mice were then crossed with 2D2− T-bet+/− or 2D2− STAT1−/+ mice, respectively, to generate 2D2+ T-bet−/−, 2D2+ T-bet+/+ mice and 2D2+ STAT1−/−, 2D2+ STAT1+/+ mice. Mice were housed in a specific pathogen-free, viral antibody-free animal facility at the Harvard Institutes of Medicine. All breeding and experiments were performed in accordance with the guidelines of the committee on Animals of Harvard Medical School.
Antigens.
The peptide MOG 35-55 (MEVGWYRSPFSRVVHLYRNGK) was synthesized by D. Teplow (Center for Neurologic Diseases, Boston, MA).
Purification of CD4+ T Cells.
CD4+ T cells were purified from lymph nodes and spleens using anti-CD4 columns according to the manufacturer's instructions (Miltenyi Biotec).
Flow Cytometry and Cell Sorting.
After purification, CD4+ T cells were stained with anti-CD4 FITC and anti-CD25 PE antibodies (PC61; BD Biosciences) and sorted using a FACS Vantage™ SE to obtain CD4+ CD25+ and CD4+ CD25− T cells. The purity of the cell suspensions was typically >98%.
Proliferation Assays and Cytokine ELISA.
A sorted population of CD4+ CD25− lymphocytes (2.5 × 10⁴/well), CD4+ CD25+ T cells, and γ-irradiated APCs (4 × 10⁴/well) were cultured for 3 d in the presence of 1 μg/ml anti-CD3 (clone 2C11; Becton Dickinson). Cells were grown in RPMI supplemented with 10% FCS, β-mercaptoethanol, l-glutamine, gentamicin sulfate, and penicillin/streptomycin. For total CD4+ T cell proliferation assay, 2.5 × 10⁵/ml CD4+ cells and 2.5 × 10⁶/ml irradiated C57Bl/6 spleen cells were cultured for 72 h in 96-well plates in the presence of different concentrations of the MOG 35-55 peptide. Cells were pulsed with 1 μCi [3H]thymidine for the last 16 h of incubation. Mean thymidine incorporation in triplicate wells was measured using a β counter (model LS 5000; Beckman Coulter). For analysis of cytokine production, 5 × 10⁵ CD4+ T cells were cultured in serum-free HL-1 medium (BioWhittaker) and stimulated with 5 × 10⁶ syngeneic irradiated APCs and 100 μg MOG 35-55 peptide 1 wk after the initial stimulation. The concentrations of cytokines IFN-γ, IL-4, IL-5, IL-10 (BD Biosciences), and TGF-β (R&D Systems) were determined from these culture supernatants by cytokine ELISA according to the manufacturer's instructions 48 h after the stimulation.
Induction and Assessment of EAE.
Two different protocols were used to induce EAE. Transcription factor–deficient and control mice were immunized with 100 μg MOG 35-55 emulsified in CFA (CFA supplemented with 4 mg/ml of Mycobacterium tuberculosis) and injected intravenously on days 0 and 2 with 150 ng pertussis toxin. 2D2 TCR transgenic mice received only an injection of pertussis toxin. Clinical assessment of EAE was performed daily and mice were scored for disease according to the following criteria: 0, no disease; 1, decreased tail tone; 2, hind limb weakness or partial paralysis; 3, complete hind limb paralysis; 4, front and hind limb paralysis; 5, moribund state. Transcription factor–deficient and control mice crossed with the 2D2 TCR transgenic mice were also observed daily for the development of spontaneous EAE according to these criteria.
Histology.
Animals were killed at the termination of the induced disease or after signs of spontaneous EAE. Brains and spinal cords were removed and fixed in 10% formalin. Paraffin-embedded sections were stained with hematoxylin and eosin, Luxol fast blue stains, and by Bielschowsky preparation for light microscopy as described previously (19).
Analysis of Chemokines by Real-Time PCR.
Groups of STAT1−/−, STAT1+/+, T-bet+/+, and T-bet−/− mice were immunized with MOG 35-55 and injected with pertussis toxin as described above. At the first signs of EAE, animals with EAE scores of 2–3 (for STAT1−/− and STAT1+/+ mice) were anesthetized and perfused with PBS. Brains from these animals were removed and homogenized individually in TRIzol reagent (Invitrogen). RNA was prepared according to the manufacturer's instructions. After treatment with DNase (Zymo Research), 2 μg mRNA was reverse transcribed (Bio-Rad Laboratories). Real-time PCR was performed on each cDNA in duplicate using specific primers and probes.
Results
T-bet−/− Mice Are Resistant to EAE Development.
Because T-bet has been described as a major regulator of Th1 cell differentiation, we first evaluated its role in the development of EAE by using mice selectively deficient in T-bet. Groups of T-bet−/− and T-bet−/+ mice were immunized with the encephalitogenic MOG 35-55 peptide for the development of EAE. The majority (86%) of T-bet−/+ mice developed severe EAE with a high maximal score of 3.0 (Fig. 1 A, a, and Table I A). The disease was so severe that 5 out of 21 (24%) of these animals died. By contrast, most T-bet−/− mice were resistant to the development of EAE (Fig. 1 A, a, and Table I A). Only a small proportion (26%) of T-bet–deficient mice showed mild signs of disease and none died as a consequence of EAE. Differences in the clinical disease severity were reflected in differences in numbers of CNS inflammatory foci in the two groups (Table I A).
Figure 1.

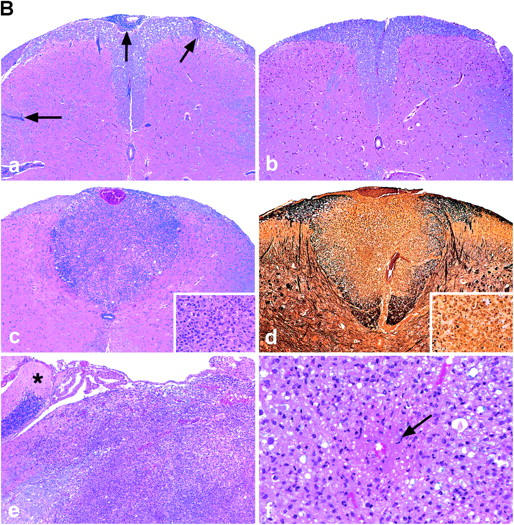
T-bet–deficient mice are resistant to EAE induction, whereas STAT1−/− mice develop fulminant EAE. (A) EAE development in T-bet– and STAT1-deficient mice. Groups of T-bet−/− and T-bet−/+ mice and STAT1−/− and 129 wild-type mice (6–7 mice per group) were immunized with MOG 35-55 and injected with pertussis toxin (a and c). T-bet−/− or T-bet+/+ 2D2 MOG-specific TCR transgenic mice were injected with pertussis toxin (b). Mice were observed daily for the development of EAE. (B) Histology of 2D2 TCR transgenic mice with spontaneous EAE. (a) Posterior spinal cord of a 2D2 × T-bet+/+ mouse with spontaneous EAE. There are small numbers of typical mononuclear cell perivascular infiltrates in leptomeninges and parenchyma (arrows). There were similar infiltrates in 2D2 × STAT1+/+ mice (not depicted). Magnification, 57. (b) Posterior spinal cord of 2D2 × T-bet−/− mouse. There are no inflammatory lesions. Magnification, 57. (c) Posterior spinal cord of 2D2 × STAT1−/− mouse with severe clinical disease. There is a large symmetric destructive inflammatory lesion in the posterior columns. Inset, higher power demonstrates confluent parenchymal inflammatory cell infiltration, predominantly by neutrophils. Magnification, 57; magnification of inset, 450. (d) Adjacent section to (c) demonstrating absence of axons in lesion center. Inset, higher power demonstrates neutrophils and complete loss of axons. Intact black fibers are axons on the periphery of the lesion. Magnification, 57; magnification of inset, 450. (e) Brain stem of 2D2 × STAT1−/− mouse with atypical disease. A large subpial/subependymal inflammatory lesion adjacent to the lateral foramen in the pons fills most of the field. Myelinated fibers (blue) are preserved in the lower left. *, cerebellum; magnification, 71. (f) Higher power of brain stem lesion in (e) with fibrin exudation from a vessel (arrow). Neutrophils and foamy macrophages are the predominant inflammatory cells. Magnification, 286. a–c, e, and f, Luxol fast blue/hematoxylin and eosin stain; d, Bielschowsky silver impregnation for axons.
Table I.
Induced and Spontaneous EAE in T-bet– and STAT1-deficient MiceB
| Clinical EAE
|
Histological EAE
|
||||
|---|---|---|---|---|---|
| Incidence | Mortality | Mean maximal score | Mean day of onset | Mean number of inflammatory foci | |
| A. Induced EAE | |||||
| T-bet−/+ | 18/21 (86%) | 5/21 (24%) | 3.0 ± 0.4 | 16.6± 0.7 | 54.5 ± 16.4 |
| T-bet−/− | 5/19 (26%)a | 0/19 (0%)c | 0.4 ± 0.2e | 19.8 ± 2.7 | 11.6 ± 2.8g |
| 129 WT | 12/18 (67%) | 2/18 (11%) | 1.9 ± 0.4 | 20.2 ± 1.3 | 55.2 ± 10.7 |
| STAT1−/− | 19/20 (95%)b | 9/20 (45%)d | 3.9 ± 0.3f | 19.7 ± 1.1 | 105.4 ± 20.5g |
| B. Spontaneous EAE | |||||
| 2D2 × T-bet−/− | 0/52 (0%)h | NAj | NAj | NDk | 0 ± 0 |
| 2D2 × T-bet+/+ | 3/41 (7%) | 1.7 ± 0.3 | 67.7 ± 7.9 | ND | 8.0 ± 0 |
| 2D2 × STAT1−/− | 15/35 (43%)i | 2.5 ± 0.3 | 53.5 ± 9.3 | ND | 99.8 ± 18.2 |
| 2D2 × STAT1+/+ | 2/40 (5%) | 1.0 ± 0 | 73.5 ± 2.0 | ND | 21.0 ± 14.0 |
(A) Mice were immunized with 100 μg MOG 35-55 and injected twice with 150 ng pertussi toxin. The results of three separate experiments are shown. Results for clinical EAE show the number of mice that developed EAE (incidence), the number of mice that died from EAE (mortality), the mean clinical score ± SE of each group, and the mean day of onset of EAE ± SE among mice with EAE. Results for histological EAE are expressed as mean number of meningeal and parenchymal inflammatory foci ± SE in the brain and spinal cord of the group.
P < 0.005 when compared to T-bet−/+ or STAT1−/− group by Chitest.
P < 0.05 when compared to 129 WT, P < 0.005 when compared to T-bet−/− group by Chitest.
P < 0.05 when compared to T-bet−/+ or STAT1−/− group by Chitest.
P < 0.05 when compared to 129 WT and T-bet−/+ group by Chitest.
P < 0.005 when compared to T-bet−/+ and STAT1−/− group by t test.
P < 0.005 when compared to 129 WT and T-bet−/+ group by t test.
Mice were observed for a period of at least 3 mo for the development of clinical signs of EAE. The total number of mice observed in each group was between 35 and 52 mice. Severity represents the mean maximal score of mice with EAE in each group. The mean age (in days) of spontaneous EAE onset is given for the mice that develop EAE in the group.
P < 0.005 between T-bet−/− and STAT1−/− group measured by t test.
P < 0.05 compared to 2D2 × T-bet+/+ by Chitest and P < 0.005 compared to 2D2 × STAT1−/−.
P < 0.005 compared to 2D2 × STAT1−/− and 2D2 × T-bet+/+ groups by Chitest.
Not applicable.
Not determined.
One possible mechanism for the low incidence of EAE in T-bet−/− mice could be a low frequency or a lack of expansion of myelin-specific T cells in these mice. To address this issue, we crossed the T-bet−/− mice with the MOG-specific TCR transgenic 2D2 mice in which CD4+ T cells are specific for the encephalitogenic MOG 35-55 peptide. We previously reported that 2D2 TCR transgenic mice develop EAE when injected with pertussis toxin without immunization with MOG antigen (19). When injected with pertussis toxin, the majority of 2D2 × T-bet+/+ wild-type mice developed severe EAE (Fig. 1 A, b). However, 2D2 × T-bet−/− mice were protected from the development of EAE. We also previously reported that 2D2 transgenic mice develop spontaneous EAE with a low frequency. Consistent with this observation, we found that only 7% of 2D2 × T-bet+/+ developed signs of spontaneous EAE (Table I B). However, we did not observe signs of spontaneous EAE in 2D2 × T-bet−/− mice up to 3 mo of age (Table I B). Therefore, despite harboring pathogenic myelin-reactive T cells in their repertoire, 2D2 × T-bet−/− mice were resistant to both induced and spontaneous EAE.
2D2 × STAT1−/− Mice Are Susceptible to Induced EAE and Develop Fulminant Spontaneous EAE.
Recent studies indicate that STAT1 is critical for the induction of T-bet (17, 18). Therefore, we analyzed EAE susceptibility in STAT1−/− and wild-type 129 control mice immunized with MOG 35-55. The 129/SvEv mouse strain is relatively resistant to the development of EAE with MOG 35-55 immunization and therefore develops disease with low incidence and severity. In this study, 67% of wild-type 129/SvEv mice immunized with MOG 35-55 developed EAE but with a mean maximal score of 1.9 (Fig. 1 A, c, and Table I B). In contrast to wild-type and T-bet−/− mice, the vast majority (95%) of STAT1−/− mice developed very severe disease (mean clinical score of 3.9). Indeed, the disease in this group was so fulminant that it resulted in the death of 45% of the animals (Table I A).
To compare the development of EAE between T-bet−/− and STAT1−/− mice and to standardize the autopathogenic repertoire between these two strains, we also generated STAT1−/− × 2D2 TCR transgenic mice. 2 out of 40 (5%) 2D2 × STAT1+/+ mice developed spontaneous EAE (Table I A). The 2D2 × STAT1+/+ mice that developed EAE had a mild disease (mean clinical score of 1) at 73.5 d of age. The incidence and severity of spontaneous EAE in 2D2 × T-bet+/+ mice and 2D2 × STAT1+/+ mice were similar. However, in contrast to the 2D2 × STAT1+/+ mice, a large proportion of 2D2 × STAT−/− mice (43%) developed spontaneous EAE with very high severity (Table I B).
Histopathological examination of the brains and spinal cords of 2D2 × T-bet+/+ mice and 2D2 × STAT1+/+ wild-type control mice showed small numbers of typical mononuclear cell meningeal and parenchymal inflammatory foci throughout the CNS (Fig. 1 B, a, Table I), as described previously (19). In contrast, CNS tissues of 2D2 × T-bet−/− mice that did not develop spontaneous EAE showed no evidence of histologic disease (Fig. 1 B, b, Table I). All but 1 of the 11 2D2 × STAT1−/− mice examined had a distinct neuropathologic phenotype consisting of large abscess-like confluent inflammatory/demyelinating lesions localized in a restricted CNS anatomic distribution. The lesions were found in the posterior columns of the spinal cord in six mice (Fig. 1 B, c and d) and in the lateral aspect of the brain stem, often adjacent to trigeminal ganglia, in eight mice (Fig. 1 B, e). Some of these lesions were partially necrotic and showed extensive destruction of axons as well as of myelin (Fig. 1 B, d). The inflammatory infiltrates in these lesions were predominantly neutrophils, rather than lymphocytes, and there were many foamy macrophages. In six mice, there was marked microvascular destruction and fibrin exudation from microvessels (Fig. 1 B, f). Other portions of the CNS, i.e., cerebrum, basal ganglia, and cerebellum, were normal. One 2D2 × STAT1−/− mouse had the typical perivascular mononuclear cell lesion pattern usually observed in EAE. Thus, although most 2D2 TCR transgenic mice do not develop spontaneous EAE, loss of STAT1 resulted in the development of spontaneous EAE in a large proportion of the animals. This is in sharp contrast to 2D2 × T-bet−/− mice, in which the majority of TCR transgenic mice lacking T-bet did not develop EAE. Because STAT1 induces T-bet, it is surprising that loss of STAT1 enhanced EAE, whereas loss of T-bet prevented mice from developing EAE.
CD4+ CD25+ T Cells from Both STAT1−/− and T-bet−/− Mice Are Able to Suppress T Cell Proliferation.
CD4+ CD25+ regulatory T cells can provide protection by suppressing proliferation of effector CD4+ CD25− T cells. They have been shown to play a crucial role in maintaining self-tolerance and in protecting against autoimmune disease (21). A recent study shows that enhanced EAE in STAT1−/− mice might be due to inefficient regulatory function of CD4+ CD25+ cells. Therefore, we have analyzed the number of regulatory CD4+ CD8− CD25+ cells in the thymus of STAT1+/+ and STAT1−/− mice, but did not find any difference between the two mouse strains (unpublished data). To investigate whether there was a difference in the regulatory function of CD4+ CD25+ T cells that could account for the difference in EAE susceptibility between STAT1−/− and T-bet−/− mice, we separated CD4+ CD25+ and CD4+ CD25− T cells from STAT1-deficient, T-bet–deficient, or their respective wild-type littermates, and tested the proliferative response of the different CD4+ CD25− effector populations in the presence of CD4+ CD25+ regulatory cells obtained from either STAT1−/−, T-bet−/−, or wild-type mice. None of the CD4+ CD25+ cell populations proliferated in response to anti-CD3 stimulation (Fig. 2). Proliferation of CD4+ CD25− T cells from STAT1+/+ or STAT1−/− mice could be suppressed in a dose-dependent manner by the addition of either STAT1+/+ CD4+ CD25+ T cells or STAT1−/− CD4+ CD25+ T cells (Fig. 2, A and B). In all conditions, the regulatory activity of the STAT1−/− CD4+ CD25+ T cells was not impaired. If anything, CD4+ CD25+ from STAT1−/− mice showed an enhanced ability to suppress wild-type CD4+ CD25− effector cell proliferation (91 vs. 52% with CD4+ CD25+ from STAT1+/+). Similarly, CD4+ CD25+ T cells from T-bet–deficient mice were also more efficient at suppressing proliferation of T-bet+/+ and T-bet−/− effector CD4+ CD25− T cells than CD4+ CD25+ from T-bet wild-type mice (Fig. 2, C and D). Because the function of CD4+ CD25+ regulatory cells from STAT1−/− mice is unimpaired, these cells are unlikely to account for the differences in EAE susceptibility between STAT1−/− and T-bet−/− mice.
Figure 2.

CD4+ CD25+ from both T-bet– and STAT1-deficient mice can suppress the proliferation of effector CD4+ T cells. CD4+ CD25+ and CD4+ CD25− T cells from STAT1−/−, T-bet−/−, and respective wild-type littermates were purified from the spleens and lymph nodes as described in Materials and Methods. Proliferation of CD4+ CD25− cells in the presence of irradiated APCs, 1 μg/ml anti-CD3 antibody, and different ratio of CD4+ CD25+ T cells (from STAT1 knockout, bold hatched bars; STAT1 wild-type, hatched bars; T-bet knockout, closed bars; T-bet wild-type, dotted bars) was determined by thymidine incorporation. These results are representative of four independent experiments.
In the Absence of T-bet, STAT1−/− Mice Are Resistant to EAE Development.
Although STAT1 seems to be important for optimal T-bet induction in CD4+ T cells, residual T-bet expression has been detected in CD4+ T cells of STAT1−/− mice with EAE (unpublished data) and of STAT1−/− mice infected with Toxoplasma gondii (22). To formally test the hypothesis that residual T-bet expression plays a crucial role for the generation of pathogenic cells in STAT1−/− mice, we generated mice deficient for both T-bet and STAT1 and studied the development of EAE in these animals. This also allowed us to determine whether effects of STAT1 or T-bet are dominant. Groups of STAT1−/−, T-bet−/−, and (T-bet × STAT1)−/− mice were immunized with MOG 35-55 and the development of EAE was scored over time. Consistent with our data, STAT1−/− mice developed very severe disease, whereas T-bet−/− mice were more resistant to EAE induction (Fig. 3). Mice deficient in both T-bet and STAT1 were also resistant to EAE (Fig. 3), thereby recapitulating the phenotype of the T-bet−/− strain. These data indicate that the loss of T-bet expression is dominant over STAT1 deficiency and can prevent the development of EAE.
Figure 3.

In absence of T-bet, STAT1−/− mice are protected from EAE. Groups of T-bet−/− (n = 14), STAT1−/− (n = 13), and STAT1−/− T-bet−/− (n = 13) mice were immunized with MOG 35-55 and injected with pertussis toxin. The development of EAE was followed over time. The data represent two independent experiments.
T-bet−/− Mice, But Not STAT1−/− Mice, Fail to Develop Th1 Cells.
To investigate the basis for the difference in EAE susceptibility between these two mouse strains, we analyzed proliferative responses and cytokine production of T cells derived from 2D2 × T-bet−/−, 2D2 × STAT1−/−, and double deficient 2D2(T-bet × STAT1)−/− mice and compared them to those of their 2D2 wild-type littermates. CD4+ T cells were purified from the spleen and lymph nodes and incubated with syngenic irradiated APCs and MOG 35-55 peptide. 2D2 × T-bet−/−, 2D2 × STAT1−/−, and 2D2(T-bet × STAT1)−/− CD4+ T cells proliferated better in response to the encephalitogenic MOG 35-55 peptide than their respective 2D2 × T-bet+/+, 2D2 × STAT1+/+, 2D2(T-bet × STAT1)+/+ wild-type littermates (Fig. 4 A). However, there was no difference in proliferation between CD4+ T cells from 2D2 × T-bet−/− and 2D2 × STAT1−/− mice. Thus, resistance to EAE in the 2D2 × T-bet−/− mice did not result from a lack of activation or expansion of transgenic CD4+ T cells specific for the MOG peptide.
Figure 4.

Proliferative response and cytokine production of T cells from T-bet– and STAT1-deficient mice. CD4+ T cells from naive 2D2 × STAT1−/−, 2D2 × T-bet−/−, 2D2 (T-bet × STAT1)−/− mice, and relative wild-type littermates were stimulated in vitro with MOG 35-55 peptide and syngeneic APCs. Proliferation was measured 72 h later by [3H]thymidine incorporation (A). The data are representative of at least four independent experiments. IFN-γ, IL−10, IL-5, IL-4, and TGF-β (B) produced in the culture supernatant was measured by ELISA 48 h after stimulation with peptide MOG 35-55 and APCs. (C) Ratio of IL-10/IFN-γ production in CD4+ T cells from 2D2 × T-bet−/−, 2D2 × T-bet+/+, 2D2 × STAT1−/−, 2D2 × STAT1+/+, 2D2 (T-bet × STAT1)−/−, and 2D2 (T-bet × STAT1)+/+. The data are presented as the average between three representative experiments ± SE.
Next, we analyzed the cytokines produced by CD4+ T cells from these different strains in response to MOG 35-55. Most significantly, we found residual IFN-γ production in CD4+ T cells from STAT1−/− mice but not from T-bet−/− or (T-bet × STAT1)−/− mice. We observed reproducibly elevated levels of IL-10 in T-bet−/− and (T-bet × STAT1)−/− CD4− cells. Thus, upon activation with peptide, CD4+ T cells from 2D2 × T-bet+/+, 2D2 × STAT1+/+, and 2D2 × (T-bet, STAT1)+/+ mice (littermate controls for the knockout mice) produced large amounts of IFN-γ (Fig. 4 B). However, little if any IFN-γ was detected in the cultures of CD4+ T cells from either 2D2 × T-bet−/− mice or 2D2 × (T-bet × STAT1)−/− mice. In contrast, CD4+ T cells from 2D2 × STAT1−/− mice produced significant amounts of IFN-γ, as much as 10 ng/ml in response to MOG 35-55, although these levels were lower than those produced by 2D2 × STAT1+/+ mice (Fig. 4 B). There was no major difference in the amount of TGF- β produced by the different mouse strains. Levels of Th2 cell cytokines (IL-4, IL-5, and IL-10) were reproducibly increased in all T-bet and double deficient mice compared with their relative wild-type littermates. Although the levels of IL-10 in the STAT1−/− mice were more variable than in the T-bet–deficient or (T-bet × STAT1) double deficient strain, the IL-10/IFN-γ ratio remained quite consistent and was substantially decreased in STAT1−/− mice but increased in T-bet−/− mice and (T-bet × STAT1)−/− mice, correlating with the protection against EAE observed in these strains (Fig. 4 C). Further, both the STAT1- and T-bet–deficient CD4+ T cells exhibit a hyperproliferative phenotype (Fig. 4 A), which might further potentiate the skewed cytokine production. However, this finding does not fully explain why STAT1−/− mice have exacerbated disease compared with STAT1+/+ mice.
Up-regulation of Chemokines in CNS Tissues of STAT1−/− Mice.
Histological examination of brains and spinal cords from STAT1−/− mice with EAE show atypical infiltration dominated by neutrophils and macrophages rather than T cells (Fig. 1 B). These observations suggested that there was a differential recruitment of these cell populations in the CNS in the absence of STAT1. Because chemokines play an important role in cell migration, we analyzed their expression in the CNS of mice with EAE. Groups of STAT1+/+, STAT1−/−, and T-bet−/− mice were immunized with MOG 35-55 and pertussis toxin. At the first attack of EAE, mice were perfused and brains were harvested. The expression of different chemokines was determined by quantitative real-time RT-PCR (Fig. 5). The expression of IP-10, MCP-1, and RANTES was decreased in STAT1−/− mice during EAE compared with STAT1+/+ mice. The decrease in these IFN-γ–inducible chemokines is consistent with the absence of IFN-γ signaling in the STAT1−/− mice. In contrast, macrophage inflammatory protein (MIP)-1α, MIP-1β, and MIP-2 were significantly increased in STAT1−/− mice compared with STAT1+/+ mice. In comparison, T-bet–deficient mice with no EAE and hence no infiltrating leukocytes had decreased levels of these chemokines (unpublished data). MIP-1α and MIP-1β are involved in the recruitment of macrophages, whereas MIP-2 is thought to attract neutrophils to the site of inflammation (23–25). Therefore, the enhanced production of MIP-1α, MIP-1β, and MIP-2 in combination with a residual population of Th1 cells in STAT1−/− mice may partly account for the massive and distinct infiltration of macrophages and neutrophils into the CNS of these mice and the consequent exacerbated clinical disease.
Figure 5.

Chemokine expression in the brain of T-bet– and STAT1-deficient mice during EAE. Groups of STAT1−/− and STAT1+/+ mice (five mice/group) were immunized with MOG 35-55 and pertussis toxin. During the first attack of EAE, the brain from these mice was removed and chemokine expression was determined by real-time PCR. The results represent the mean relative mRNA expression (2-ΔΔCT × 1,000) of a particular chemokine within a group ± SE between samples of this group.
Discussion
In this report, we have analyzed the roles played by two transcription factors, T-bet and STAT1, in the induction and regulation of EAE. Like IFN-γ−/− and IFN-γR−/− mice, we show that STAT1−/− mice are highly susceptible to EAE. Further, STAT1−/− mice crossed with MOG-specific TCR transgenic 2D2 mice developed fulminant spontaneous EAE. In contrast, T-bet−/− mice did not develop disease after immunization with MOG 35-55 peptide and no MOG-specific TCR transgenic T-bet−/− mice developed signs of spontaneous EAE. Therefore, the absence of T-bet protected mice from EAE in all experiments. Furthermore, although induction of T-bet is largely dependent on STAT1, we found that T-bet played a dominant role in controlling disease because mice lacking both T-bet and STAT1 were resistant to EAE. CD4+ CD25+ T cells are thymically derived regulatory T cell subtypes that mediate peripheral tolerance and loss of this specific subtype of regulatory cells results in multiple organ autoimmunity (21). A recent report proposed that increased EAE in STAT1−/− mice results from a decrease in the number and activity of CD4+ CD25+ T cells (26). In contrast to this report, our experiments show that CD4+ CD25+ T cells from STAT1−/− mice are quite efficient at suppressing the proliferation of effector cells from either STAT1−/− or STAT1+/+ mice. In fact, in our hands, CD4+ CD25+ T cells from both STAT1−/− and T-bet−/− mice showed enhanced suppressive activity compared with wild-type mice. Therefore, a defect in the function of CD4+ CD25+ regulatory cells is unlikely responsible for the difference in disease susceptibility between T-bet and STAT1-deficient mice.
The severe clinical EAE observed in the STAT1−/− mice is similar to the exacerbated disease reported in IFN-γ– and IFN-γR–deficient mice. Previous reports showed that CD4+ T cells from IFN-γ−/− and STAT1−/− mice had higher antigen-specific proliferative responses compared with wild-type mice, suggesting that IFN-γ may have antiproliferative effects and limit the expansion of CD4+ pathogenic T cells (14, 27, 28). Indeed, consistent with an antiproliferative role of IFN-γ, we found that MOG-specific T cells from STAT1−/−, T-bet−/−, and (T-bet × STAT1)−/− mice had higher proliferative responses to MOG 35-55 compared with control wild-type mice. However, this was unlikely to account for the difference in disease susceptibility between T-bet−/− and STAT1−/− mice because T cells from T-bet−/− and STAT1−/− mice proliferated equally well.
However, there are several other possible explanations for the observed differences in the EAE phenotypes. First, STAT1−/− mice do have small amounts of residual T-bet protein in Th cells that might be sufficient to induce IFN-γ–producing Th1 cells and EAE. In favor of this hypothesis, we found significant amounts of T-bet in CD4+ T cells of 2D2 STAT1−/− mice with spontaneous EAE. A recent report also showed that CD4+ T cells from T. gondii–infected STAT1−/− mice express T-bet (22). In addition, we and others (26) have shown that CD4+ T cells from STAT1−/− mice can differentiate, albeit poorly, into IFN-γ–producing Th1 cells. Residual T-bet expression in STAT1−/− mice probably accounts for the generation of pathogenic Th1 cells capable of initiating EAE in these mice because (STAT1 × T-bet)−/− mice do not produce any IFN-γ and were also resistant to the development of EAE. Analysis of Th2 cell cytokines produced by CD4+ T cells revealed that T-bet−/− and (T-bet × STAT1)−/− double deficient mice displayed increased IL-10 production compared with wild-type. Although amounts of IL-10 produced by STAT1−/− mice varied at different backcross generations, the ratio between IL-10/IFN-γ production was always consistent and markedly different between these different mice strains. The IL-10/IFN-γ ratio was very high in T-bet−/− and (T-bet × STAT1)−/− mice and much lower in STAT1−/− mice. These results suggest that a balance between IFN-γ–producing Th1 cells and IL-10–producing Tr1 cells may explain the resistant phenotype.
In addition, we have recent evidence that STAT1 is not the only upstream regulator of T-bet in other cell types such as NK cells (29). Thus, a pathogenic function for T-bet in these cell types might exist in STAT1−/− mice. Finally, T-bet transcripts are undetectable in macrophages (30), a cell type in which STAT proteins have vital functions (31). It is possible that the fulminant EAE observed in the absence of IFN-γ signaling arises from cellular mechanisms distinct from those observed in typical EAE. Indeed, 2D2 × STAT1−/− mice with spontaneous EAE had a distinct neuropathologic phenotype with a more restricted distribution of large abscess-like confluent inflammatory/demyelinating lesions composed predominantly of neutrophils and foamy macrophages, rather than lymphocytes. During EAE, we found a substantial alteration in the pattern of chemokines expressed in the brains of STAT1−/− mice compared with wild-type mice. IFN-γ–inducible chemokines such as IP-10 were down-regulated in the brain of STAT1−/− mice, consistent with a lack of IFN-γ signaling in these mice. In contrast, we found an increase in the level of MIP-1α and MIP-1β in the brain of STAT1−/− mice. These chemokines are involved in the recruitment of macrophages to inflamed sites and previous data have shown that activated macrophages mediate most of the tissue injury during EAE. Thus, it is possible that increased infiltration of activated macrophages in the CNS is responsible for the enhanced disease observed in STAT1−/− mice. MIP-2 was also significantly up-regulated in the brain of STAT1−/− mice. Similar up-regulation of MIP-2 has been reported in IFN-γ−/− mice with EAE (14). MIP-2 is specifically involved in the recruitment and chemotaxis of neutrophils to the site of inflammation (23–25). Although the up-regulation of MIP-1 and MIP-2 may increase infiltration of foamy macrophages, MIP-2 might be specifically responsible for the infiltration of neutrophils and the generation of abscess-like lesions in the brains of STAT1−/− mice.
Together, our observations show that loss of STAT1 in STAT1-deficient mice does not prevent the generation of autopathogenic Th1 cells, but loss of downstream transcription factor T-bet completely eliminates the generation of Th1 cells. Our data on STAT1−/− mice suggest that elimination of the IFN-γ signaling pathway creates a dysequilibrium in the balance of IL-10/IFN-γ and chemokines leading to differential recruitment of cell populations to target tissues with resultant enhanced inflammation. However, our data show that T-bet has a pivotal role in the generation of pathogenic Th1 cells and induction of EAE. Therefore, T-bet rather than STAT1 may provide an important target for manipulation of CNS autoimmune diseases.
Acknowledgments
We would like to thank Michael Nazareno for screening the mice.
This work was supported by grants from the National Institutes of Health (1RO1NS35685-06, 2R37NS30843-11, 1RO1AI44880-03, 2P01AI39671-07, and 1PO1NS38037-04 to V.K. Kuchroo; AI48126 to L.H. Glimcher; and NS 046414 to R.A. Sobel), the National Multiple Sclerosis Society (RG-2571-D-9 to V.K. Kuchroo), a grant from the Juvenile Diabetes Research Foundation (to L.H. Glimcher), and a grant from the Wadsworth Foundation (to E. Bettelli). S.J. Szabo is a recipient of the Burroughs Wellcome Foundation Career Development Award.
Abbreviations used in this paper: CNS, central nervous system; EAE, experimental autoimmune encephalomyelitis; MIP, macrophage inflammatory protein; MOG, myelin oligodendrocyte glycoprotein; STAT, signal transducer and activator of transcription.
References
- 1.Seder, R.A., and W.E. Paul. 1994. Acquisition of lymphokine-producing phenotype by CD4+ T cells. Annu. Rev. Immunol. 12:635–673. [DOI] [PubMed] [Google Scholar]
- 2.Murphy, K.M., W. Ouyang, J.D. Farrar, J. Yang, S. Ranganath, H. Asnagli, M. Afkarian, and T.L. Murphy. 2000. Signaling and transcription in T helper development. Annu. Rev. Immunol. 18:451–494. [DOI] [PubMed] [Google Scholar]
- 3.Szabo, S.J., S.T. Kim, G.L. Costa, X. Zhang, C.G. Fathman, and L.H. Glimcher. 2000. A novel transcription factor, T-bet, directs Th1 lineage commitment. Cell. 100:655–669. [DOI] [PubMed] [Google Scholar]
- 4.O'Garra, A., and N. Arai. 2000. The molecular basis of T helper 1 and T helper 2 cell differentiation. Trends Cell Biol. 10:542–550. [DOI] [PubMed] [Google Scholar]
- 5.Wekerle, H. 1993. Experimental autoimmune encephalomyelitis as a model of immune-mediated CNS disease. Curr. Opin. Neurobiol. 3:779–784. [DOI] [PubMed] [Google Scholar]
- 6.Zamvil, S.S., and L. Steinman. 1990. The T lymphocyte in experimental allergic encephalomyelitis. Annu. Rev. Immunol. 8:579–621. [DOI] [PubMed] [Google Scholar]
- 7.Baker, D., J.K. O'Neill, and J.L. Turk. 1991. Cytokines in the central nervous system of mice during chronic relapsing experimental allergic encephalomyelitis. Cell. Immunol. 134:505–510. [DOI] [PubMed] [Google Scholar]
- 8.Khoury, S.J., W.W. Hancock, and H.L. Weiner. 1992. Oral tolerance to myelin basic protein and natural recovery from experimental autoimmune encephalomyelitis are associated with downregulation of inflammatory cytokines and differential upregulation of transforming growth factor beta, interleukin 4, and prostaglandin E expression in the brain. J. Exp. Med. 176:1355–1364. [DOI] [PMC free article] [PubMed] [Google Scholar]
- 9.Baron, J.L., J.A. Madri, N.H. Ruddle, G. Hashim, and C.A. Janeway, Jr. 1993. Surface expression of alpha 4 integrin by CD4 T cells is required for their entry into brain parenchyma. J. Exp. Med. 177:57–68. [DOI] [PMC free article] [PubMed] [Google Scholar]
- 10.Kuchroo, V.K., C.A. Martin, J.M. Greer, S.T. Ju, R.A. Sobel, and M.E. Dorf. 1993. Cytokines and adhesion molecules contribute to the ability of myelin proteolipid protein-specific T cell clones to mediate experimental allergic encephalomyelitis. J. Immunol. 151:4371–4382. [PubMed] [Google Scholar]
- 11.Willenborg, D.O., S. Fordham, C.C. Bernard, W.B. Cowden, and I.A. Ramshaw. 1996. IFN-gamma plays a critical down-regulatory role in the induction and effector phase of myelin oligodendrocyte glycoprotein-induced autoimmune encephalomyelitis. J. Immunol. 157:3223–3227. [PubMed] [Google Scholar]
- 12.Willenborg, D.O., S.A. Fordham, M.A. Staykova, I.A. Ramshaw, and W.B. Cowden. 1999. IFN-gamma is critical to the control of murine autoimmune encephalomyelitis and regulates both in the periphery and in the target tissue: a possible role for nitric oxide. J. Immunol. 163:5278–5286. [PubMed] [Google Scholar]
- 13.Ferber, I.A., S. Brocke, C. Taylor-Edwards, W. Ridgway, C. Dinisco, L. Steinman, D. Dalton, and C.G. Fathman. 1996. Mice with a disrupted IFN-gamma gene are susceptible to the induction of experimental autoimmune encephalomyelitis (EAE). J. Immunol. 156:5–7. [PubMed] [Google Scholar]
- 14.Tran, E.H., E.N. Prince, and T. Owens. 2000. IFN-gamma shapes immune invasion of the central nervous system via regulation of chemokines. J. Immunol. 164:2759–2768. [DOI] [PubMed] [Google Scholar]
- 15.Mullen, A.C., F.A. High, A.S. Hutchins, H.W. Lee, A.V. Villarino, D.M. Livingston, A.L. Kung, N. Cereb, T.P. Yao, S.Y. Yang, et al. 2001. Role of T-bet in commitment of TH1 cells before IL-12-dependent selection. Science. 292:1907–1910. [DOI] [PubMed] [Google Scholar]
- 16.Szabo, S.J., B.M. Sullivan, C. Stemmann, A.R. Satoskar, B.P. Sleckman, and L.H. Glimcher. 2002. Distinct effects of T-bet in TH1 lineage commitment and IFN-gamma production in CD4 and CD8 T cells. Science. 295:338–342. [DOI] [PubMed] [Google Scholar]
- 17.Lighvani, A.A., D.M. Frucht, D. Jankovic, H. Yamane, J. Aliberti, B.D. Hissong, B.V. Nguyen, M. Gadina, A. Sher, W.E. Paul, et al. 2001. T-bet is rapidly induced by interferon-gamma in lymphoid and myeloid cells. Proc. Natl. Acad. Sci. USA. 98:15137–15142. [DOI] [PMC free article] [PubMed] [Google Scholar]
- 18.Afkarian, M., J.R. Sedy, J. Yang, N.G. Jacobson, N. Cereb, S.Y. Yang, T.L. Murphy, and K.M. Murphy. 2002. T-bet is a STAT1-induced regulator of IL-12R expression in naive CD4+ T cells. Nat. Immunol. 3:549–557. [DOI] [PubMed] [Google Scholar]
- 19.Bettelli, E., M. Pagany, H.L. Weiner, C. Linington, R.A. Sobel, and V.K. Kuchroo. 2003. Myelin oligodendrocyte glycoprotein-specific T cell receptor transgenic mice develop spontaneous autoimmune optic neuritis. J. Exp. Med. 197:1073–1081. [DOI] [PMC free article] [PubMed] [Google Scholar]
- 20.Meraz, M.A., J.M. White, K.C. Sheehan, E.A. Bach, S.J. Rodig, A.S. Dighe, D.H. Kaplan, J.K. Riley, A.C. Greenlund, D. Campbell, et al. 1996. Targeted disruption of the Stat1 gene in mice reveals unexpected physiologic specificity in the JAK-STAT signaling pathway. Cell. 84:431–442. [DOI] [PubMed] [Google Scholar]
- 21.Hori, S., T. Takahashi, and S. Sakaguchi. 2003. Control of autoimmunity by naturally arising regulatory CD4+ T cells. Adv. Immunol. 81:331–371. [DOI] [PubMed] [Google Scholar]
- 22.Lieberman, L.A., M. Banica, S.L. Reiner, and C.A. Hunter. 2004. STAT1 plays a critical role in the regulation of antimicrobial effector mechanisms, but not in the development of Th1-type responses during toxoplasmosis. J. Immunol. 172:457–463. [DOI] [PubMed] [Google Scholar]
- 23.Kernacki, K.A., R.P. Barrett, J.A. Hobden, and L.D. Hazlett. 2000. Macrophage inflammatory protein-2 is a mediator of polymorphonuclear neutrophil influx in ocular bacterial infection. J. Immunol. 164:1037–1045. [DOI] [PubMed] [Google Scholar]
- 24.Tessier, P.A., P.H. Naccache, I. Clark-Lewis, R.P. Gladue, K.S. Neote, and S.R. McColl. 1997. Chemokine networks in vivo: involvement of C-X-C and C-C chemokines in neutrophil extravasation in vivo in response to TNF-alpha. J. Immunol. 159:3595–3602. [PubMed] [Google Scholar]
- 25.Diab, A., H. Abdalla, H.L. Li, F.D. Shi, J. Zhu, B. Hojberg, L. Lindquist, B. Wretlind, M. Bakhiet, and H. Link. 1999. Neutralization of macrophage inflammatory protein 2 (MIP-2) and MIP-1alpha attenuates neutrophil recruitment in the central nervous system during experimental bacterial meningitis. Infect. Immun. 67:2590–2601. [DOI] [PMC free article] [PubMed] [Google Scholar]
- 26.Nishibori, T., Y. Tanabe, L. Su, and M. David. 2004. Impaired development of CD4+ CD25+ regulatory T cells in the absence of STAT1: increased susceptibility to autoimmune disease. J. Exp. Med. 199:25–34. [DOI] [PMC free article] [PubMed] [Google Scholar]
- 27.Chu, C.Q., S. Wittmer, and D.K. Dalton. 2000. Failure to suppress the expansion of the activated CD4 T cell population in interferon γ–deficient mice leads to exacerbation of experimental autoimmune encephalomyelitis. J. Exp. Med. 192:123–128. [DOI] [PMC free article] [PubMed] [Google Scholar]
- 28.Refaeli, Y., L. Van Parijs, S.I. Alexander, and A.K. Abbas. 2002. Interferon γ is required for activation-induced death of T lymphocytes. J. Exp. Med. 196:999–1005. [DOI] [PMC free article] [PubMed] [Google Scholar]
- 29.Townsend, M.J., A.S. Weinmann, J. Matsuda, R. Saloman, P. Farnham, C.A. Biron, L. Gapin, and L.H. Glimcher. 2004. T-bet regulates the terminal maturation and homeostasis of NK and V_14i NKT cells. Immunity. 20:477–494. [DOI] [PubMed] [Google Scholar]
- 30.Lugo-Villarino, G., R. Maldonado-Lopez, R. Possemato, C. Penaranda, and L.H. Glimcher. 2003. T-bet is required for optimal production of IFN-gamma and antigen-specific T cell activation by dendritic cells. Proc. Natl. Acad. Sci. USA. 100:7749–7754. [DOI] [PMC free article] [PubMed] [Google Scholar]
- 31.Decker, T., S. Stockinger, M. Karaghiosoff, M. Muller, and P. Kovarik. 2002. IFNs and STATs in innate immunity to microorganisms. J. Clin. Invest. 109:1271–1277. [DOI] [PMC free article] [PubMed] [Google Scholar]