Abstract
Dendritic cells (DCs) are much more potent antigen (Ag)-presenting cells than resting B cells for the activation of naive T cells. The mechanisms underlying this difference have been analyzed under conditions where ex vivo DCs or B cells presented known numbers of specific Ag–major histocompatibility complex (MHC) complexes to naive CD4+ T cells from T cell antigen receptor (TCR) transgenic mice. Several hundred Ag–MHC complexes presented by B cells were necessary to elicit the formation of a few T–B conjugates with small contact zones, and the resulting individual T cell Ca2+ responses were all-or-none. In contrast, Ag-specific T cell Ca2+ responses can be triggered by DCs bearing an average of 30 Ag–MHC complexes per cell. Formation of T–DC conjugates is Ag-independent, but in the presence of the Ag, the surface of the contact zone increases and so does the amplitude of the T cell Ca2+ responses. These results suggest that Ag is better recognized by T cells on DCs essentially because T–DC adhesion precedes Ag recognition, whereas T–B adhesion requires Ag recognition. Surprisingly, we also recorded small Ca2+ responses in T cells interacting with unpulsed DCs. Using DCs purified from MHC class II knockout mice, we provide evidence that this signal is mostly due to MHC–TCR interactions. Such an Ag-independent, MHC-triggered calcium response could be a survival signal that DCs but not B cells are able to deliver to naive T cells.
Keywords: dendritic cells, B cells, T cells, Ca2+ imaging, contact zone
Naive T cells can be efficiently stimulated by dendritic cells (DCs)1 or by activated B cells, but not by resting B cells (1–4). This phenomenon has major consequences not only in the initiation of normal immune responses against infections, but also in the strategies used for cancer immunotherapy (5–7). The particularly high efficiency of DCs as APCs in vivo results from a combination of factors. Their motility, the expression of high levels of MHC and accessory molecules, and their ability to release T cell– attracting chemokines may all contribute to the overall efficiency in Ag presentation and subsequent activation of T cells (for a review, see reference 1).
The efficiency of B cells and DCs in activating T cells is generally compared by monitoring a late readout (proliferation or cytokine production) for different ratios of APC to T cells, or after pulsing the APCs with different concentrations of Ag. However, the characteristics of the Ca2+ responses induced in T cells by the two types of APCs have never been compared. The importance of Ag-independent adhesion of T cells to DCs has been underlined (2, 3, 8, 9), but the relationship between this phenomenon and the efficiency of Ag recognition has not been established precisely and quantitatively.
Comparing T cell responses evoked by B cells and by DCs under conditions where the number of specific Ag– MHC complexes per APC is known is of interest for two reasons. The first is that it allows the relative importance, for T cell activation, of the expression of MHC versus adhesion/costimulation molecules in the two cell types to be estimated. The second is that the minimum number of Ag– MHC complexes necessary for T cell activation has been evaluated at between 100 and 400 in the initial reports (10– 12), and at between 1 and 10,000 in a more recent study (13). However, as these estimations were obtained using cell lines as APCs and/or T cells, their relevance to naive T cell stimulation remains largely unknown.
To address these questions, we monitored early and late responses of naive CD4+ T cells from TCR transgenic (Tg) mice to Ag presentation by ex vivo DCs or resting B cells. The number of specific Ag–MHC complexes per APC was precisely measured by flow cytometry through the use of a biotinylated version of the peptide and of calibration beads. Under these well-defined stimulating conditions, the data from proliferation assays and from three sets of images (dynamic series of transmission light images to monitor the percentage of interacting cells and the formation of contact zones; dynamic series of fluorescence images to monitor single cell Ca2+ responses; and electron microscopy images to quantify the size of the contact zones) were plotted as a function of the number of specific Ag–MHC complexes borne by both types of APC.
Analysis of these data led us to conclude that ∼30 Ag– MHC complexes are sufficient for a DC to activate a naive T cell, whereas even with 10 times this number, the efficacy of B cells is still low. The most relevant characteristic of a DC, when presenting small amounts of Ag, is its ability to allow the formation of a small contact zone with the T cell before the Ag is detected, and to increase the size of the contact zone after Ag-specific signaling.
We also measured reproducible Ca2+ responses in T cells interacting with unpulsed DCs from wild-type mice. Experiments using DCs from I-Aβ−/− mice indicated that this Ag-independent signal is MHC triggered. The functional relevance of this DC-specific, Ag-independent Ca2+ signal will be discussed.
Materials and Methods
Mice.
The HNT-TCR Tg mice were generated and used as described (14–16). C57BL/6 (B6; H-2b) mice were provided by IffaCredo (L'Arbresle, France). MHC class II knockout mice (Aβ−/−) have been described previously (17).
Peptides.
Hemagglutinin (HA) peptide has been used previously (16). Here, we used a biotinylated version of this peptide referred to as HA-biot (a gift from Dr. J. Rothbard, Stanford University School of Medicine, CA). It was obtained by adding a biotin molecule to the NH2-terminal histidine.
Purification of APCs and CD4+ T Cells.
CD4+ Tg T cells and B cells were purified as described (16). DCs were purified according to the protocol of Steinman and colleagues (18). In brief, after mechanical dissociation and collagenase (type IV; Sigma Chemical Co., St. Louis, MO) digestion, cells were isolated on a gradient of BSA (Bovine Albumin Cohn Fraction V; Biomex, Mannheim, Germany), and further enriched by two rounds of plastic adherence. Adherent cells were pulsed with Ag overnight at 37°C in complete medium, and the DCs that detached during this 16– 18-h incubation were harvested for experiments.
Flow Cytometry.
Single cell suspensions were stained as described (16). B cell staining was performed using FITC-conjugated B220 mAb (PharMingen, San Diego, CA). For DC staining, we used N418 antibody specific for CD11c integrin, and revealed by using goat anti–hamster-PE (Caltag Laboratories, Inc.). For the 33D1 antibody, N418 was purified from a supernatant produced by hybridoma cells provided by Dr. B. Salomon (University of Chicago, IL) and concentrated using saturated ammonium sulfate (19). Biotinylated mAbs specific for I-Ad, B7.1, or B7.2 (PharMingen) were also used and revealed with streptavidin-TC (Caltag Laboratories, Inc.).
Quantitative FACS® analyses were performed using five sets of 9-μm-diameter calibration beads (Biocytex, Marseille, France) presenting 500, 2,500, 5,500, 8,000, or 19,000 biotin molecules. In parallel, DCs and B cells incubated overnight with 30 ng–30 μg/ml of HA-biot were washed twice and analyzed. Biotin molecules were revealed by streptavidin-PE (Molecular Probes, Inc., Eugene, OR). Data (5,000 events) were analyzed on a FACScan® flow cytometer (Becton Dickinson, San Jose, CA). Dead cells were excluded based on forward- and side-scatter parameters or based on propidium iodide labeling.
Single Cell Ca2+ Video Imaging.
APCs were incubated overnight with different concentrations of antigenic peptide in complete medium. They were washed once in mammalian saline (20) buffer and allowed to adhere for 20 min on glass coverslips pretreated with 2 μg/ml polylysine (Sigma Chemical Co.) for 10 min. CD4+ T cells (5 × 10⁵) were incubated for 20 min at 37°C with 1 μM Fura-2/AM (Molecular Probes, Inc.). Measurements of intracellular calcium concentration ([Ca2+]i) were performed at 37°C in mammalian saline buffer with a Diaphot 300 microscope (Nikon Inc., Melville, NY) and an IMSTAR imaging system as described previously (20). Only responding cells were included in the averages. When several Ca2+ traces were averaged, the rising phases of the traces were first synchronized so that the time course of the average was not “filtered” by the asynchrony of the different responses. Transmission light images acquired to visualize the APCs interacting with the T cells were taken every 12 s in turn with fluorescence images.
Electron Microscopy.
Unpulsed or pulsed (30 μg/ml HA-biot) APCs were prepared as for the Ca2+ mobilization experiments. CD4+ T cells were similarly added to the APC monolayer, and both cell types were allowed to interact in mammalian saline buffer at 37°C for 25 min. DC–T conjugates were subsequently fixed with glutaraldehyde 2% (TAAB, Berkshire, UK) in cacodylate buffer 0.1 M, pH 7.4, at room temperature for 1 h. After washing with cacodylate buffer, cells were postfixed with a mixture of osmic acid (OsO4) 1% and potassium ferrocyanate 1.5% in cacodylate buffer for 30 min at 4°C. Cells were dehydrated in increasing concentrations of ethanol and embedded with a mixture of epon and araldite, while still on coverslips. After polymerization at 60°C, the coverslips were removed from the solidified blocks containing the cells. Ultrathin sections were prepared, counterstained with uranyl acetate, then observed and photographed with an electron microscope (model CM120; Philips, Eindhoven, The Netherlands).
In the experiments in which B cells were immunogold labeled, incubation with antibodies and gold probes were performed after the fixation of cells with paraformaldehyde 4% in phosphate buffer 0.2 M, pH 7.4. B cells were stained using a three-step procedure with B220, rabbit anti–rat mAb (DAKO Corp., Carpinteria, CA), and protein A coupled to 10-nm gold particles (PAG 10; Department of Cell Biology, University of Utrecht, The Netherlands). After washing with PBS, cells were fixed with glutaraldehyde 1% in PBS for 1 h and processed for electron microscopy as described above.
Electron micrographs of T–APC conjugates were scanned using an Arcus scanner (Agfa, Montsel, Belgium), and the length of T–APC contacts was measured using NIH Image software. The average surface of the contact zones was estimated under the assumption that an elementary contact is circular, and taking into account the average number of elementary contacts per section and the distribution of the lengths in these elementary contacts. Given that the average section through a disk of diameter D is D × π/4, the average surfaces of the contact zones were estimated in the different conditions.
T Cell Proliferation Assay.
The CD4+ purified Tg T cells (105/well) were stimulated with positively purified B cells (6 × 10⁵/well) or with DCs (105/well) in the presence of various concentrations of HA-biot peptide in 96-well U-bottomed microtiter plates. After 60 h, cultures were pulsed with 1 μCi of [3H]thymidine and harvested 20 h later.
Statistics.
Data are expressed as mean ± SE, and the significance of differences between two series of results was assessed using the two-tailed Student's t test.
Results
Characterization of the Cells and Ligand Used in Ag Presentation.
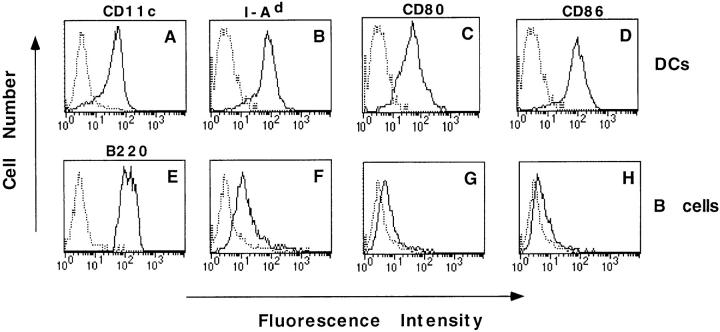
The DCs used in this study were purified from mouse spleen cells, as described by Steinman and colleagues (18, 21). These cells express the CD11c integrin, a classical marker of murine DCs (22, 23; Fig. 1 A). They also express high levels of MHC class II molecules (Fig. 1 B) as well as CD80 (B7.1) and CD86 (B7.2) costimulation molecules (Fig. 1, C and D). They exhibit a typical dendritic morphology with motile veils, and do not remain adherent after an overnight incubation. Based on these phenotypic, morphologic, and functional (see below) features, one can conclude that the purified population is essentially (>90%) constituted by mature DCs.
Figure 1.
Surface phenotype of DCs (A–D) and B cells (E–H). Purified syngenic APCs were analyzed for surface expression of CD11c (A), B220 (E), I-Ad (B and F), CD80 (C and G), and CD86 (D and H). Solid line, Specifically labeled APCs. Broken line, Staining with a control mAb.
A highly purified B cell population (95–98%; see Fig. 1 E) positive for B220 staining (3, 24) was obtained by either positive or negative selection. These cells display a small forward scatter and express MHC class II molecules (Fig. 1 F) to a 5.4-fold lower level than DCs. CD80 expression was weak (Fig. 1 G) or null, depending on the experiments. However, trace levels of CD86 (Fig. 1 H) were reproducibly detected. This pattern of B7 expression is typical of resting B cells (25).
Responding T cells used in this study were CD4+ T cells freshly purified from HNT-TCR mice. The vast majority of these cells express the transgenic TCR specific for the HA(126-138)–I-Ad complex and have mainly a naive phenotype (14, 16).
We have recently characterized the response of Tg CD4+ T cells to HA-pulsed B cells (16). The antigenic peptide used in the present work was a biotinylated form of the cognate HA 126-138 peptide, referred to as HA-biot, which allows the quantification of the number of HA(126-138)-biot–I-Ad complexes at the surface of the APCs. HA- or HA-biot– pulsed APCs elicited similar T cell Ca2+ responses and proliferation (data not shown). This indicates that HA-biot is a bona fide agonist peptide for Tg CD4+ T cells.
Single Cell Analysis of T Cell Ca2+ Responses Elicited by DCs or B Cells.
Fig. 2 illustrates the earliest events that can be detected in T cells interacting with DCs, i.e., the formation of a contact zone rapidly followed by a Ca2+ rise. Similar events were observed with HA-biot–pulsed B cells (not shown). In the absence of Ag, B cells never form stable conjugates nor do they trigger Ca2+ responses in naive CD4+ T cells. In contrast, DC-induced T cell responses can be observed not only with HA-biot–pulsed DCs (Fig. 2, top) but, unexpectedly, also in the absence of Ag (Fig. 2, bottom). Ag-independent, DC-induced Ca2+ responses are characterized by their small amplitude and their late appearance after T–DC conjugation. As shown in Fig. 2 (top), a single DC can activate two or more T cells. This was observed in ∼25% of the cases, whereas a similar phenomenon was observed in <1% of T–B conjugates.
Figure 2.
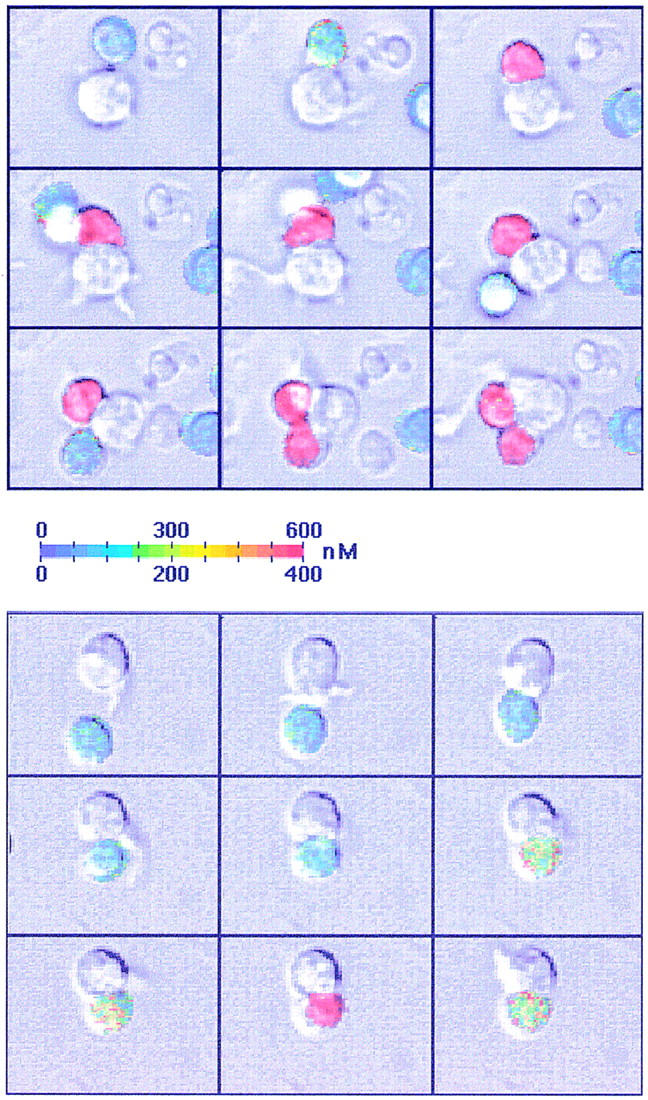
DC-induced T cell Ca2+ responses. Transmitted light images were superimposed on the color-coded Ca2+ images. Top, The DCs have been pulsed with 0.3 μg/ml HA-biot; two naive T cells were successively activated by the same DC. Bottom, Response of a T cell in the absence of Ag. Interval between two images: 47 s (top) and 93 s (bottom). The [Ca2+]i scale is 0–600 nM (top) or 0–400 nM (bottom).
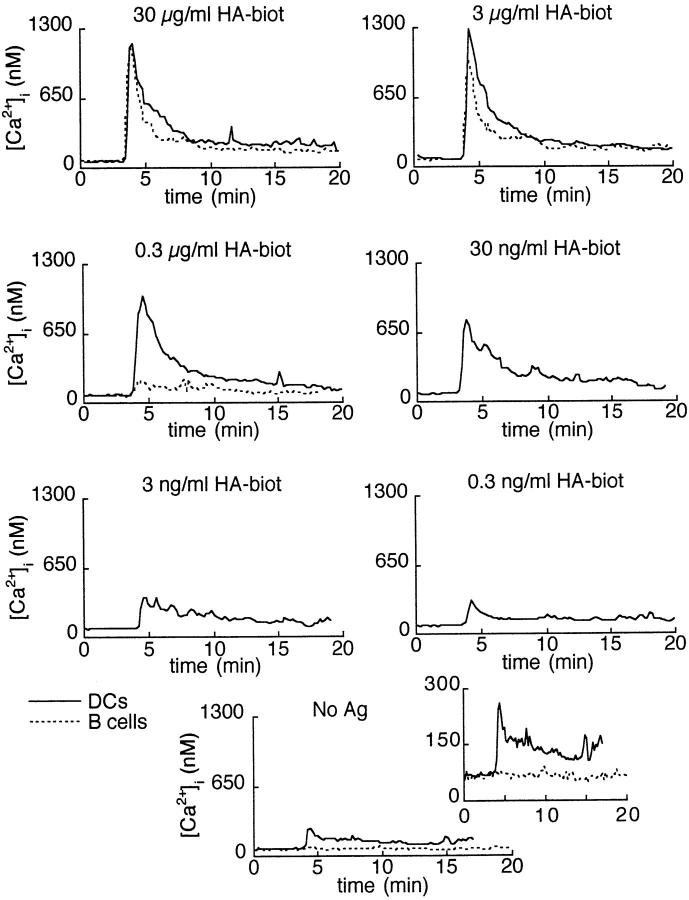
Fig. 3 shows the mean Ca2+ responses of Tg CD4+ T cells to different concentrations of HA-biot presented by DCs or resting B cells. The individual, stereotyped Ca2+ responses elicited in T cells by Ag-pulsed APCs (not shown) were quite similar to the averages shown in Fig. 3. They consisted of a rapid peak followed by a lower plateau resulting from the partial inactivation of the initial response (16). At high peptide concentrations (3–30 μg/ml), the Ca2+ responses elicited by resting B cells or by DCs looked very similar. When taking into account only those T cells that showed a Ca2+ response, the average peak amplitudes were not statistically different after stimulation with B cells or with DCs (Ca2+ peaks were 1,043 ± 86 nM, n = 43, and 1,220 ± 120 nM, n = 49, respectively). However, the Ca2+ responses elicited by resting B cells were much more dependent on the Ag concentration than the responses elicited by DCs. Using low concentrations of HA-biot peptide to load the APCs (<0.3 μg/ml), Ca2+ responses could only be induced by DCs.
Figure 3.
Average T cell Ca2+ responses triggered by different concentrations of peptide presented by DCs (solid line) or B cells (broken line). 4–49 individual Ca2+ responses from 3–4 independent experiments were included in these results.
Two parameters might contribute to the superiority of DCs over B cells at low Ag concentrations: a higher absolute number of MHC class II molecules and/or stronger costimulatory signals, leading to higher numbers of specific Ag–MHC complexes per cell.
Quantification of the Number of Specific Ag–MHC Complexes Present on Both APC Types.
To address this question, we used HA-biot to quantify by flow cytometry the number of HA-biot–I-Ad complexes at the cell surface of the APCs pulsed with different Ag concentrations. Signals were calibrated with beads coated with known numbers of biotin molecules.
The mean fluorescence intensity (MFI) of calibration beads was related linearly to the number of biotin molecules present on these beads (Fig. 4 A). MFI of HA-biot– pulsed APCs were determined in parallel and corrected for the background fluorescence of nonbiotinylated HA peptide–pulsed APCs (Fig. 4 B). The weak unspecific fluorescence of I-Ad− cells pulsed with HA-biot was subtracted for the quantification. In Fig. 4 C, the number of HA-biot–I-Ad complexes per APC was determined by combining the data of Fig. 4, A and B. The fit shows that in our experimental conditions, the maximum number of Ag– MHC complexes that can be formed by loading an unprocessed peptide was 23,000 for a DC and 5,000 for a B cell. Hereafter, the curve fitting of the data in Fig. 4 B has been used to convert the concentrations of peptide used to load the APCs into numbers of specific Ag–MHC complexes per cell. For peptide concentrations ≥30 ng/ml, the number of Ag–MHC complexes was estimated directly. For lower concentrations, it was estimated by extrapolation of the fitted data. At low Ag concentration, the observed parallelism between the two lines fits with the law of mass action: it implies that the number of Ag–MHC complexes at the surface of both DCs and B cells increases proportionally with the concentration of HA-biot.
Figure 4.
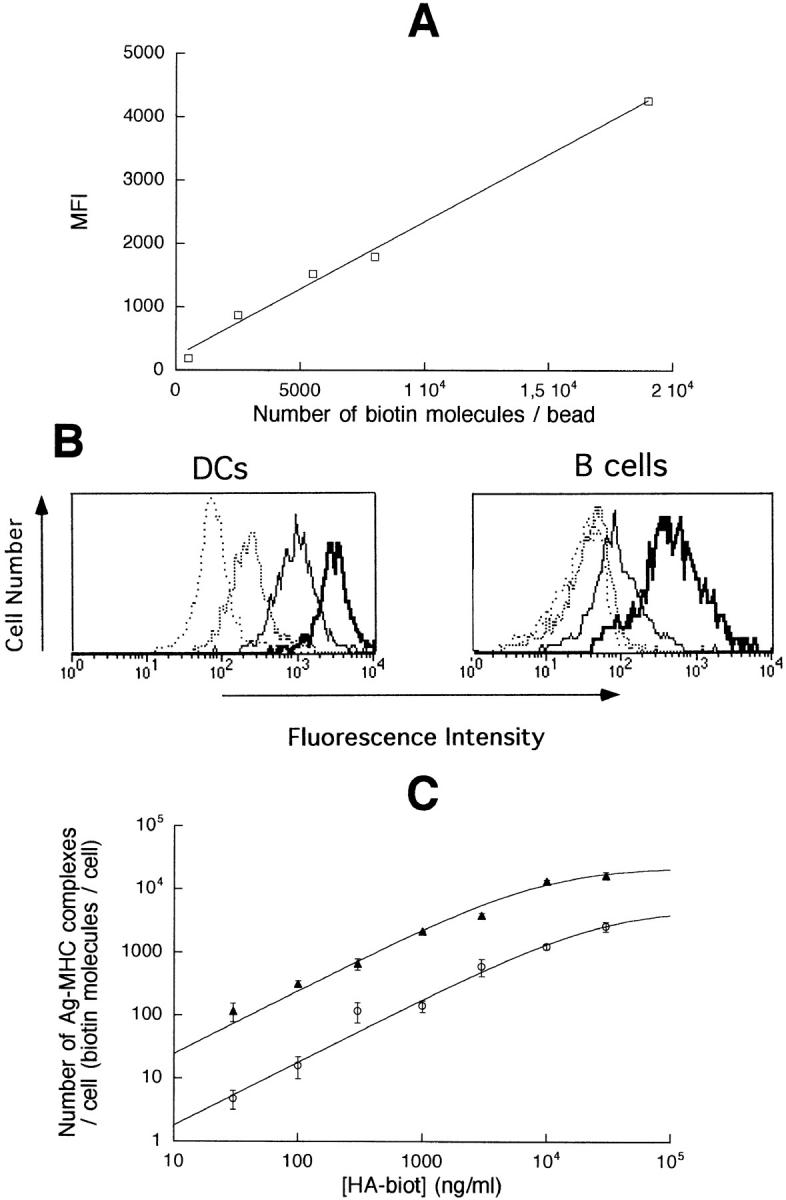
Quantification of the number of Ag molecules present on both APC types. (A) MFI of calibration beads bearing different numbers of biotin molecules. (B) Staining of APCs pulsed with 30 μg/ml HA (negative control, spaced broken line), 0.3 μg/ml HA-biot (broken line), 3 μg/ml HA-biot (solid line), and 30 μg/ml HA-biot (heavy solid line). (C) Number of biotin molecules on B cells (open circles) or DCs ( filled triangles) pulsed with different concentrations of HA-biot. Data are derived from five independent experiments.
Ag Dependence of T Cell Ca2+ Responses.
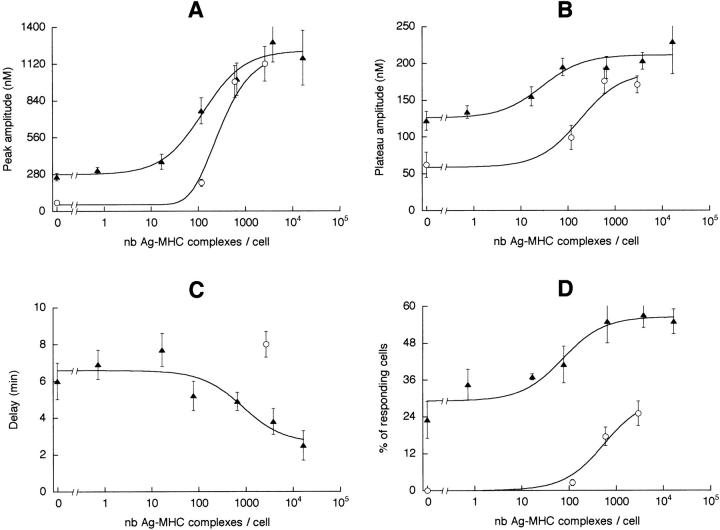
From the data of Figs. 3 and 4, one can derive the relation between the average amplitude of the T cell Ca2+ response and the number of Ag–MHC complexes per B cell or per DC, as shown in Fig. 5, A (Ca2+ peak) and B (Ca2+ plateau). For small numbers (10–100) of specific Ag–MHC complexes per cell, an Ag-dependent Ca2+ response could only be induced by DCs. With 100–1,000 specific Ag–MHC complexes per cell, the responses induced by DCs were still several times higher than those induced by B cells. The difference was abolished when the number of complexes was >1,000 per APC. As a result, the number of specific Ag– MHC complexes required to elicit a half-maximal Ca2+ response was larger with B cells than with DCs (Table 1).
Figure 5.
Characteristics of the T cell Ca2+ responses triggered by different numbers of specific peptide–MHC complexes present on DCs ( filled triangles) or B cells (open circles). (A) Amplitude of the peak. (B) Amplitude of the plateau measured 10 min after the peak. (C) Delay. For B cells, given the large dispersion of the delays, data obtained with Ag concentrations of 3 and 30 μg/ml have been pooled in order to average a sufficient number of measurements. (D) Percentage of responding T cells. nb, Number.
Table 1.
Concentration of HA-biot or Number of HA-biot–MHC Complexes Per Cell Necessary to Induce a Half-maximal Response in T Cells
| B cells | DCs | |||||||
|---|---|---|---|---|---|---|---|---|
| Ag concentration | No. of Ag–MHC complexes/B cell | Ag concentration | No. of Ag–MHC complexes/DC | |||||
| ng/ml | ng/ml | |||||||
| Proliferation | 328 | 41 | 5 | 37 | ||||
| Ca2+ plateau | 510 | 180 | 6 | 28 | ||||
| Ca2+ peak | 1,014 | 344 | 30 | 126 | ||||
| % responding cells | 1,450 | 570 | 13 | 73 | ||||
An index of the efficacy of Ag presentation can be concluded from the time necessary for a T cell to find a partner, i.e., by the delay between the arrival of the T cells in the plane of the APC monolayer and the beginning of the Ca2+ responses (Fig. 5 C). The shortest average delay (2.5 ± 0.8 min, n = 23) was observed with 17,000 peptide–MHC complexes presented by DCs. With lower peptide loading, this delay became longer, up to a plateau value of 6–7 min. With B cells, this delay was always longer than with DCs (two to four times longer under optimal conditions).
The Ca2+ responses elicited by DCs or resting B cells differed also in their probability of occurrence. Fig. 5 D shows the percentage of responding T cells, i.e., T cells in which [Ca2+]i > 200 nM. For the largest Ag loading condition, the percentage of responding cells was more than two times larger after stimulation by DCs than by B cells (55 ± 4%, n = 3 vs. 25 ± 4%, n = 4; P < 0.01). In the absence of Ag, the percentage of T cells responding to DCs was still 23 ± 6% (n = 4), whereas it was undetectable with B cells. The number of peptide–MHC complexes allowing the Ag-specific activation of a half-maximal percentage of T cells was about eight times smaller with DCs than resting B cells (Table 1).
T Cell Proliferation Induced by DCs and B Cells.
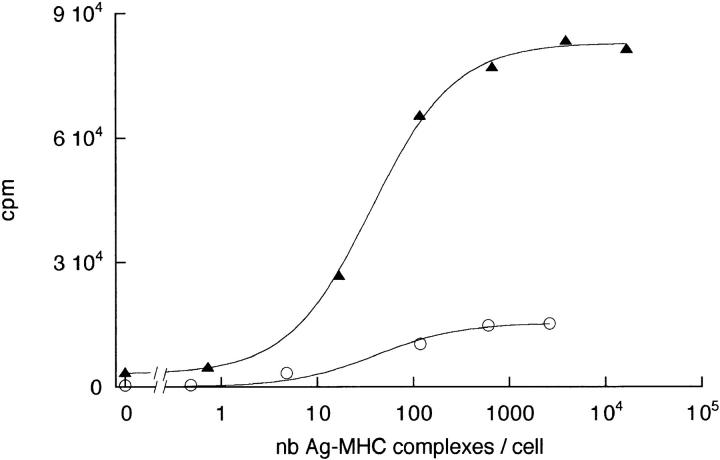
To compare early and late T cell responses, proliferation assays were performed with APCs loaded with defined numbers of peptide–MHC complexes. B cells were highly purified (98%) by positive selection in order to minimize their contamination by other APCs. A T to B ratio ≤1:6 was necessary to observe a modest T cell proliferation. However, T cell proliferation induced by DCs was intense, with a T to DC ratio of 1:1 (Fig. 6). The background proliferation level observed in the absence of HA-biot peptide was reproducibly higher with DCs compared with B cells. In three different experiments, the maximum proliferation was three to five times larger with DCs than with B cells, and the number of Ag–MHC complexes leading to a half-maximal proliferation was about the same for B cells and for DCs (Table 1). At any given number of Ag–MHC complexes, and despite the fact that the APC to T ratio was larger for B cells than for DCs, the proliferation induced by DCs was always more vigorous than that induced by B cells.
Figure 6.
T cell proliferation in response to B cells (open circles) or DCs ( filled triangles) presenting different numbers (nb) of peptide–MHC complexes. The T to APC ratio is 1:6 with B cells and 1:1 with DCs.
Conjugates and Ag Concentration.
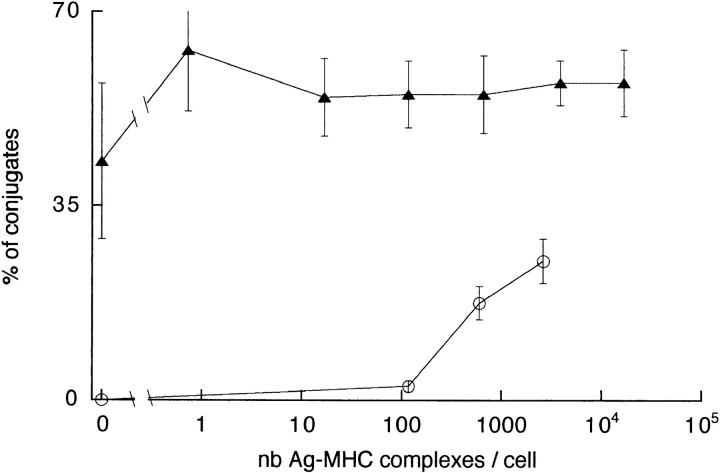
To establish the Ag dependence of conjugates between naive T cells and the two types of APCs, formation of T–APC conjugates was evaluated from series of transmission light images. Fig. 7 reveals a major qualitative difference between DCs and B cells. The formation of T–B conjugates was strictly proportional to the number of peptide–MHC complexes on the B cell. On the contrary, the formation of T–DC conjugates was largely independent of the amount of peptide–MHC complexes. In particular, in the absence of peptide, 43 ± 14% (n = 3) of the naive T cells formed conjugates with DCs, and this Ag-independent contact induced a marked T cell ruffling.
Figure 7.
Percentage of T cells involved in T–B (open circles) or T–DC ( filled triangles) conjugates as a function of the number (nb) of peptide– MHC complexes presented.
Analysis of T–APC Contacts by Electron Microscopy.
With the spatial resolution of the transmitted light images of an imaging system, no difference can be detected in the size of the contact zones formed in the different experimental situations. This parameter can be measured on electron micrographs of T–APC conjugates (Fig. 8). DCs could be easily distinguished from T cells, based on the smaller size and the larger nucleus of the latter. However, it was necessary to immunostain B cells with the B220 mAb in order to clearly distinguish B–T conjugates from possible B–B or T–T conjugates.
Figure 8.
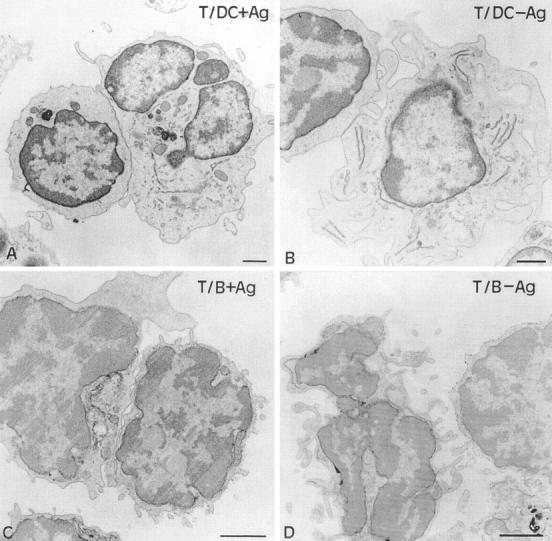
Analysis by electron microscopy of conjugates between T cells and either DCs with (A) or without (B) Ag, or immunogold-stained B cells with (C) or without (D) Ag. For each image, the T cell engaged in the conjugate is at the left of the APC. Bars, 1 μm.
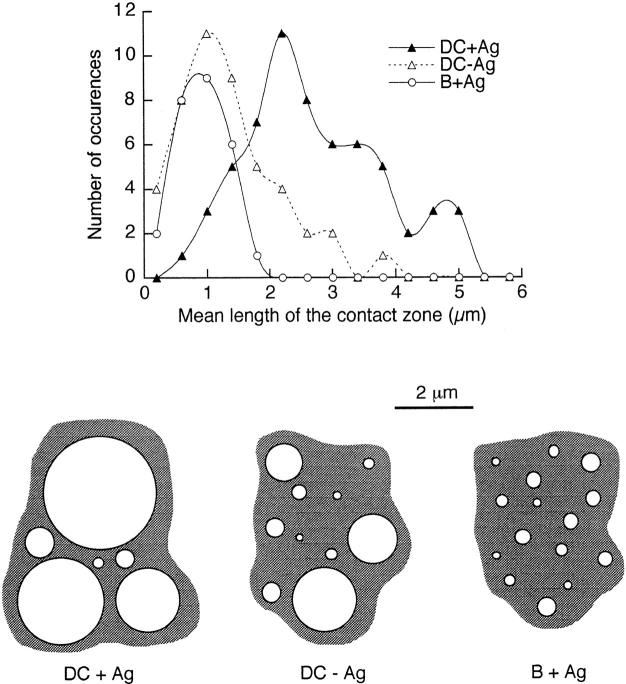
In the contact zone, the membranes of the two cells were considered to be in close apposition when they were <30 nm apart. A sectioned contact zone between a DC and a T cell showed several (three as a mean) distinct regions of close apposition separated by brief regions where the membranes were not apposed. In the absence of Ag, the mean length of each elementary apposition was 0.44 ± 0.05 μm (n = 142), and their cumulative length was 1.35 ± 0.12 μm (n = 46). The presence of 30 μg/ml HA-biot peptide mainly affected the length of the elementary apposition (1.11 ± 0.08 μm, n = 144) and thus their cumulative length (2.67 ± 0.14 μm, n = 60). The difference between the measurements in the absence and presence of Ag is highly significant (P < 0.001).
In the presence of 30 μg/ml HA-biot peptide, a sectioned T–B contact zone usually showed four very short elementary contacts (0.23 ± 0.01 μm, n = 102); the resulting contact zones were smaller (0.9 ± 0.07 μm, n = 26; P < 0.01) and looser than those measured with pulsed and even unpulsed DCs. In the absence of Ag, as mentioned previously, no contact zone between B and T cells could be observed (Fig. 8 D). Fig. 9 (top) shows the distribution of the total lengths of the contact zones between T cells and B cells or DCs. Fig. 9 (bottom) is a schematic view of the two-dimensional structure of these contact zones, underlining the fragmented nature of a contact zone. In each contact zone represented in Fig. 9, the mean number of elementary contacts, their mean diameter and surface are quantitatively accurate and consistent with the measurements performed on several tens of T–APC pairs in each condition. The cumulative average surfaces of the close appositions in the contact zones were estimated (see Materials and Methods) at 16.2 or 6 μm2 for DCs (with or without Ag) and 1.5 μm2 for B cells plus Ag. These close apposition surfaces, where intercellular molecular interactions really take place, represent a small fraction of the total cell surface (1% for B cells and 6% for DCs plus Ag), much smaller than the apparent contact zone visible in transmission light images.
Figure 9.
Analysis of the sizes of contact zones. Top, Distribution of the lengths of the contact zones between T cells and either DCs (with or without 30 μg/ml HA-biot) or B cells (30 μg/ml HA-biot). Bottom, Schematic two-dimensional views of contact zones, based on the average number of elementary contacts per section and on the lengths of the elementary contacts, representative of the experimental means and variabilities.
Origin of the T Cell Ca2+ Responses Elicited by Unpulsed DCs.
As mentioned previously, unpulsed DCs could not only form conjugates with T cells, but also could trigger small Ca2+ responses in these T cells. The same phenomenon took place when polyclonal CD4+ T cells were used instead of Tg T cells (not shown).
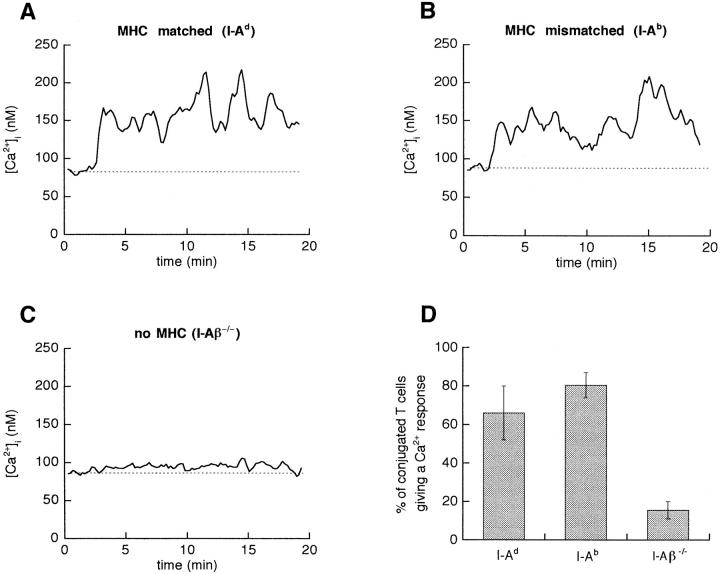
In a last series of experiments, we examined to what extent these responses depended on MHC molecules on the DCs. To this end, DCs expressing either a different MHC allele (H-2b) or no MHC at all (I-Aβ−/− DCs) were purified, and their ability to form conjugates with Tg T cells and to elicit Ca2+ responses in the absence of Ag was compared with that of DCs expressing the restricting molecule (I-Ad). The percentage of T–DC conjugates was not statistically different in the three conditions (between 45 and 60%). More importantly, DCs expressing either the d or b MHC haplotype elicited Ca2+ responses of similar amplitude (Fig. 10, A and B) in a similar proportion of conjugates (Fig. 10 D; 66 ± 14 vs. 80.5 ± 6.5%). However, DCs lacking MHC class II molecules failed to elicit any significant Ca2+ signal (Fig. 10 C). In only 15.5 ± 4.5% of T–DC couples were some Ca2+ transients observed (Fig. 10 D). When using polyclonal CD4+ T cells from B6 mice instead of Tg T cells, again, the Ca2+ responses observed after interaction with I-Aβ−/− DCs were scanty, and smaller than those elicited by H-2b DCs (not shown).
Figure 10.
Analysis of Tg T cell Ca2+ responses activated by unpulsed DCs. Typical single cell Ca2+ responses of T cells interacting with DCs expressing either MHC class II of the correct haplotype (I-Ad, A), or a mismatched MHC (I-Ab, B) or no MHC (I-Aβ−/−, C). (D) Percentage of T cells engaged in a T–DC conjugate which give a Ca2+ response. Data from two to five independent experiments.
Thus, it appears that MHC molecules at the DC surface are important not only to present peptides, and thus to elicit Ag-specific signals, but also to elicit small Ca responses in most T cells, even in the absence of specific Ag recognition.
Discussion
In this paper, we compared the responses triggered in naive CD4+ T cells by two physiological APCs, i.e., DCs and resting B cells presenting known numbers of specific peptide–MHC complexes per cell, whereas most previous comparisons of T cell stimulation have been performed with various concentrations of peptide added to the APCs (see, e.g., references 4 and 26). In addition, quantitative analysis of the contact zones in Nomarski images and in electron micrographs, combined with early (rise in [Ca2+]i) and late (proliferation) responses of the T cell, allowed us to point to qualitative differences and to better understand the unequal efficacy with which the two types of APCs can activate naive T cells.
By loading a synthetic peptide, the maximum number of peptide–MHC complexes that could be formed was estimated at 23,000 on DCs and 5,000 on resting B cells. It is striking that the ratio of these numbers is practically the same as the ratio of the MHC class II levels on the two cell types (∼5). A ratio of 5–10-fold more MHC molecules on DCs than on small B cells has previously been reported (3, 27). Since there are a few million MHC molecules per DC (27, 28), the fraction of the molecules which can be loaded with a given peptide is ∼1%. Most previous estimates of the number of Ag–MHC complexes necessary for T cell activation used radiolabeled peptides and determined that 1–300 peptide–MHC complexes were required to activate CTL responses (13, 29). A comparison between the relative levels of specific Ag–MHC complexes offered by DCs and B cells, after the processing and presentation of a protein, has recently been reported (30) with the use of an Ag– MHC complex–specific mAb. In these conditions, it can be estimated that the antibody-detected Ag–MHC complexes were only 20–30% more abundant on DCs than on B cells. This discrepancy with our present results could be due to the fact that we used an antigenic peptide that did not require processing.
The number of peptide–MHC complexes per APC necessary to evoke a half-maximal Ca2+ response has been determined here for the first time with ex vivo APCs and T cells. It was 200–600 for B cells, depending on the readout (Ca2+ peak, plateau, or percentage of responding cells; see Table I), and 30–130 for DCs. Thus, DCs need ∼6 times fewer peptide–MHC complexes than B cells to induce Ca2+ responses in T cells, and the appropriate peptide loading requires 30–100 times more peptide for B cells than for DCs. No different ratio was found when using proliferation as a readout. Moreover, for both B cells and DCs, fewer complexes were required to induce proliferation compared with Ca2+ responses (in particular, ∼40 complexes per DC to induce a half-maximal proliferation). Thus, T cell proliferation can be induced under conditions where the Ca2+ response is far from maximal, which is in line with some (31, 32) but not all reports (33, 34). This issue has yet to be settled, since a recent report showed that a wide range of effector functions can be elicited in naive T cells above the same threshold peptide concentration (35).
Our data show that when DCs and B cells are loaded with Ag in such a way that they present the same number of specific Ag–MHC complexes per cell, DCs remain better APCs than B cells. This suggests that the abundance of MHC molecules on DCs is not determinant for Ag detection. This conclusion is strengthened if one considers that when a T cell interacts with an APC, the relevant parameter is likely to be the density of Ag–MHC complexes at the cell surface rather than the total number of complexes per cell. Based on transmitted light images and electron micrographs, we have estimated that the surface of a DC is 2–2.5 times larger than that of a B cell. If the maximal number of Ag–MHC complexes is 5 times larger on DCs than on B cells, the maximal density of such complexes per surface unit is only 2–2.5 times larger on DCs than on B cells. This feature should only confer a minor advantage to DCs. However, the high expression level of MHC molecules on DCs could be important to present a larger spectrum of different peptides, since presentation of a given antigenic peptide can be efficiently performed when it is bound to <0.001% of surface MHC class II molecules.
We have shown that in the absence of Ag, DCs form conjugates with T cells, trigger a small Ca2+ response in ∼70% of the conjugates, and induce a small T cell proliferation. In addition, T cells detect more easily the presence of a few peptide–MHC complexes on DCs than on B cells. The combination of these results strongly suggests that T cells can recognize small numbers of peptide–MHC complexes on DCs because they do not need the Ag to form conjugates. By contrast, the first weakness of B cells is that their adhesion to T cells must be initiated by an Ag-specific signal (16; see also reference 2). In addition, adhesion molecules are probably involved in the stabilization and duration of the T–APC interaction, which has been shown to control T cell commitment for activation (26).
This work confirms and develops the notion put forward by several groups (2, 9, 36, 37), that the Ag-independent clustering of T cells by DCs favors Ag recognition. This initial Ag-independent adhesion, true for DCs, has sometimes been considered as a general property of all bona fide APCs (38). We have shown that it is not the case for resting B cells. Our data suggest that naive T cells use their TCRs first to adhere to the B cells; when the number of TCRs engaged is sufficient for cell–cell adhesion, it is also sufficient to trigger a maximal Ca2+ response, which explains why the B cell–induced Ca2+ response is practically all-or-none. On the contrary, DC-induced response is directly related to the number of TCRs present in the “nest” corresponding to the preformed contact zone. Moreover, it may be easier to amplify an already existing Ca2+ response such as that observed in T cells engaged in conjugates with unpulsed DCs. This probably explains the graded Ag- dependent Ca2+ response elicited by DCs, starting at very low numbers of specific Ag–MHC complexes.
It has been shown that the Ag-independent binding of naive T cells to DCs depends upon LFA-1, CD2, and CD28 on the T cell (9), but it has also been reported that clusters between T cells and DCs are not affected by anti– LFA-1 antibodies (3). Moreover, it is known that engagement of CD28 both contributes to T–DC adhesion (9) and turns on intracellular signaling such as activation of phosphatidylinositol-3-kinase (39) and, in some cases, Ca2+ mobilization (40, 41). It is interesting to note that LFA-1 and CD2 also elicit a Ca2+ rise when cross-linked by specific mAbs (42–45). Although one cannot exclude that accessory molecules may bring a minor contribution to the generation of Ca2+ signals, the data we obtained with DCs lacking MHC class II molecules demonstrate rather that MHC molecules play a key role in these responses.
It is tempting to relate these results with previous in vivo data showing that the survival of CD4+ (46, 47) or CD8+ (48) T cells in the periphery requires the expression of MHC molecules. Strikingly, a recent paper has shown that expression of MHC class II molecules on DCs alone was sufficient to restore the survival of CD4+ T cells (49). Taken together, these results suggest that MHC expression on DCs may be required for the maintenance of peripheral T cells.
We have not examined the ability of macrophages to cluster T cells, but previous results reported that macrophages, like B cells, are unable to cluster naive T cells in an Ag-independent manner (2). In addition, it has recently been suggested that Ag-specific Ca2+ responses elicited in naive T cell by macrophages are an all or none phenomenon (50). In the present study, we have interpreted the all or none Ca2+ responses elicited by B cells as the lack of T–B adhesion preceding Ag recognition.
Thus, two features of DCs might contribute to their potency as APCs. One is the expression of adhesion molecules allowing DCs to form conjugates with T cells in the absence of Ag, and even in the absence of MHC molecules as previously observed (37). The second is the intense MHC class II expression, useful not only for Ag presentation but also for the delivery of a Ca2+ signal. Our results provide the first measurement of a signal delivered to T cells by the interaction with unpulsed DCs. Although not proven, it is quite possible that the small Ca2+ responses elicited by DCs in T cells in the absence of Ag lead to a minute activation that contributes to T cell survival.
In conclusion, we have characterized several specific functional features of DCs. These cells seem to have a unique ability to form conjugates with naive T cells, thanks to adhesion molecules. Then, by generating in T cells an MHC-triggered Ca2+ response, DCs provide a low intensity stimulus that could be a survival signal. In addition, this basal activation could contribute to enhance the detection sensitivity such that a very small number of specific peptide–MHC complexes are sufficient for DCs to efficiently prime naive T cells.
Acknowledgments
The authors thank Geneviève Boulla, Liliane Tompe, and Béatrice Brémont for excellent technical support; Dr. Benoit Salomon for providing 33D1 and N418 mAb–producing hybridomas and helpful advice for DC purification; Drs. Christophe Benoist and Diane Mathis for kindly providing I-Aβ−/− mice; Dr. Ron Germain for helpful discussions; and Drs. Clotilde Randriamampita, Georges Bismuth, Anne Hosmalin, and Eric Vivier for critical reading of the manuscript.
This study was supported by Centre National de la Recherche Scientifique, INSERM, Agence Nationale de Recherche sur le SIDA, and Association pour la Recherche contre le Cancer. J. Delon is supported by fellowships from Fondation pour la Recherche Médicale and Association pour la Recherche contre le Cancer. N. Bercovici is supported by a fellowship from Ministère de l'Enseignement et de la Recherche.
Abbreviations used in this paper
- [Ca2+]i
intracellular calcium concentration
- DC
dendritic cell
- HA
hemagglutinin
- MFI
mean fluorescence intensity
- Tg
transgenic
References
- 1.Steinman RM. The dendritic cell system and its role in immunogenicity. Annu Rev Immunol. 1991;9:271–296. doi: 10.1146/annurev.iy.09.040191.001415. [DOI] [PubMed] [Google Scholar]
- 2.Inaba K, Steinman RM. Accessory cell–T lymphocyte interactions. Antigen-dependent and -independent clustering. J Exp Med. 1986;163:247–261. doi: 10.1084/jem.163.2.247. [DOI] [PMC free article] [PubMed] [Google Scholar]
- 3.Metlay JP, Pure E, Steinman RM. Distinct features of dendritic cells and anti-Ig activated B cells as stimulators of the primary mixed leukocyte reaction. J Exp Med. 1989;169:239–254. doi: 10.1084/jem.169.1.239. [DOI] [PMC free article] [PubMed] [Google Scholar]
- 4.Croft M, Duncan DD, Swain SL. Response of naive antigen-specific CD4+T cells in vitro: characteristics and antigen-presenting cell requirements. J Exp Med. 1992;176:1431–1437. doi: 10.1084/jem.176.5.1431. [DOI] [PMC free article] [PubMed] [Google Scholar]
- 5.Young JW, Inaba K. Dendritic cells as adjuvants for class I major histocompatibility complex–restricted antitumor immunity. J Exp Med. 1996;183:7–11. doi: 10.1084/jem.183.1.7. [DOI] [PMC free article] [PubMed] [Google Scholar]
- 6.Girolomoni G, Ricciardi-Castagnoli P. Dendritic cells hold promise for immunotherapy. Immunol Today. 1997;18:102–104. doi: 10.1016/s0167-5699(97)01030-x. [DOI] [PubMed] [Google Scholar]
- 7.Hsu FJ, Benike C, Fagnoni F, Liles TM, Czerwinski D, Taidi B, Engleman EG, Levy R. Vaccination of patients with B-cell lymphoma using autologous antigen-pulsed dendritic cells. Nat Med. 1996;2:52–58. doi: 10.1038/nm0196-52. [DOI] [PubMed] [Google Scholar]
- 8.Inaba K, Steinman RM. Monoclonal antibodies to LFA-1 and to CD4 inhibit the mixed lymphocyte reaction after the antigen-dependent clustering of dendritic cells and T lymphocytes. J Exp Med. 1987;165:1403–1417. doi: 10.1084/jem.165.5.1403. [DOI] [PMC free article] [PubMed] [Google Scholar]
- 9.Hauss P, Selz F, Cavazzana-Calvo M, Fischer A. Characteristic of antigen-independent and antigen- dependent interaction of dendritic cells with CD4+T cells. Eur J Immunol. 1995;25:2285–2294. doi: 10.1002/eji.1830250826. [DOI] [PubMed] [Google Scholar]
- 10.Harding CV, Unanue ER. Quantitation of antigen-presenting cell MHC class II/peptide complexes necessary for T-cell stimulation. Nature. 1990;346:574–576. doi: 10.1038/346574a0. [DOI] [PubMed] [Google Scholar]
- 11.Demotz S, Grey HM, Sette A. The minimal number of class II MHC-antigen complexes needed for T cell activation. Science. 1990;249:1028–1030. doi: 10.1126/science.2118680. [DOI] [PubMed] [Google Scholar]
- 12.Vitiello A, Potter TA, Sherman LA. The role of β2-microglobulin in peptide binding by class I molecules. Science. 1990;250:1423–1426. doi: 10.1126/science.2124002. [DOI] [PubMed] [Google Scholar]
- 13.Kageyama S, Tsomides TJ, Sykulev Y, Eisen HN. Variations in the number of peptide-MHC class I complexes required to activate cytotoxic T cell responses. J Immunol. 1995;154:567–576. [PubMed] [Google Scholar]
- 14.Scott B, Liblau RS, Degerman S, Marconi AL, Caton AJ, McDevitt HO, Lo D. A role for non-MHC genetic polymorphism in susceptibility to spontaneous autoimmunity. Immunity. 1994;1:72–83. doi: 10.1016/1074-7613(94)90011-6. [DOI] [PubMed] [Google Scholar]
- 15.Liblau RS, Tisch R, Shokat K, Dumont N, Yang X-D, McDevitt HO. Intravenous injection of high-dose soluble antigen induces thymic and peripheral T cell apoptosis. Proc Natl Acad Sci USA. 1996;93:3031–3036. doi: 10.1073/pnas.93.7.3031. [DOI] [PMC free article] [PubMed] [Google Scholar]
- 16.Delon J, Bercovici N, Liblau R, Trautmann A. Imaging antigen recognition by naive CD4+ T cells: compulsory cytoskeletal alterations for the triggering of a Ca2+response. Eur J Immunol. 1998;28:716–729. doi: 10.1002/(SICI)1521-4141(199802)28:02<716::AID-IMMU716>3.0.CO;2-E. [DOI] [PubMed] [Google Scholar]
- 17.Cosgrove D, Gray D, Dierich A, Kaufman J, Lemeur M, Benoist C, Mathis D. Mice lacking MHC class II molecules. Cell. 1991;66:1051–1066. doi: 10.1016/0092-8674(91)90448-8. [DOI] [PubMed] [Google Scholar]
- 18.Swiggard, W.J., R.M. Nonacs, M.D. Witmer-Pack, R.M. Steinman, and K. Inaba. 1992. Enrichment of dendritic cells by plastic adherence and EA rosetting. In Current Protocols in Immunology. J.E. Coligan, A.M. Kruisbeek, D.H. Marguiles, E.M. Shevach, and W. Strober, editors. John Wiley & Sons, New York. 3.7.1.
- 19.Andrew, S.M., and J.A. Titus. 1991. Purification and fragmentation of antibodies. In Current Protocols in Immunology. J.E. Coligan, A.M. Kruisbeek, D.H. Marguiles, E.M. Shevach, and W. Strober, editors. John Wiley & Sons, New York. 2.7.1.
- 20.Renard V, Delon J, Luescher IF, Malissen B, Vivier E, Trautmann A. The CD8β polypeptide is required for the recognition of an altered peptide ligand as an agonist. Eur J Immunol. 1996;26:2999–3007. doi: 10.1002/eji.1830261227. [DOI] [PubMed] [Google Scholar]
- 21.Steinman RM, Kaplan G, Witmer MD, Cohn ZA. Identification of a novel cell type in peripheral organs of mice. V. Purification of spleen dendritic cells, new surface markers, and maintenance in vitro. J Exp Med. 1979;149:1–16. doi: 10.1084/jem.149.1.1. [DOI] [PMC free article] [PubMed] [Google Scholar]
- 22.Crowley MT, Inaba K, Witmer MD, Gezelter S, Steinman RM. Use of the fluorescence activated cell sorter to enrich dendritic cells from mouse spleen. J Immunol Methods. 1990;133:55–66. doi: 10.1016/0022-1759(90)90318-p. [DOI] [PubMed] [Google Scholar]
- 23.Metlay JP, Witmer-Pack MD, Agger R, Crowley MT, Lawless D, Steinman RM. The distinct leukocyte integrins of mouse spleen dendritic cells as identified with new hamster monoclonal antibodies. J Exp Med. 1990;171:1753–1771. doi: 10.1084/jem.171.5.1753. [DOI] [PMC free article] [PubMed] [Google Scholar]
- 24.Johnson P, Greenbaum L, Bottomly K, Trowbridge IS. Identification of the alternatively spliced exons of murine CD45 (T200) required for reactivity with B220 and other T200-restricted antibodies. J Exp Med. 1989;169:1179–1184. doi: 10.1084/jem.169.3.1179. [DOI] [PMC free article] [PubMed] [Google Scholar]
- 25.June CH, Bluestone JA, Nadler LM, Thompson CB. The B7 and CD28 receptor families. Immunol Today. 1994;15:321–331. doi: 10.1016/0167-5699(94)90080-9. [DOI] [PubMed] [Google Scholar]
- 26.Iezzi G, Karjalainen K, Lanzavecchia A. The duration of antigenic stimulation determines the fate of naive and effector cells. Immunity. 1998;8:89–95. doi: 10.1016/s1074-7613(00)80461-6. [DOI] [PubMed] [Google Scholar]
- 27.Cella M, Engering A, Pinet V, Pieters J, Lanzavecchia A. Inflammatory stimuli induce accumulation of MHC class II complexes on dendritic cells. Nature. 1997;388:782–787. doi: 10.1038/42030. [DOI] [PubMed] [Google Scholar]
- 28.Bhardwaj N, Young JW, Nisanian AJ, Baggers J, Steinman RM. Small amounts of superantigen, when presented on dendritic cells, are sufficient to initiate T cell responses. J Exp Med. 1993;178:633–642. doi: 10.1084/jem.178.2.633. [DOI] [PMC free article] [PubMed] [Google Scholar]
- 29.Sykulev Y, Joo M, Vturina I, Tsomides TJ, Eisen HN. Evidence that a single peptide-MHC complex on a target cell can elicit a cytolytic T cell response. Immunity. 1996;4:565–571. doi: 10.1016/s1074-7613(00)80483-5. [DOI] [PubMed] [Google Scholar]
- 30.Zhong G, Reis e Sousa C, Germain RN. Antigen-unspecific B cells and lymphoid dendritic cells both show extensive surface expression of processed antigen–major histocompatibility complex class II complexes after soluble protein exposure in vivo or in vitro. J Exp Med. 1997;186:673–682. doi: 10.1084/jem.186.5.673. [DOI] [PMC free article] [PubMed] [Google Scholar]
- 31.Donnadieu E, Bismuth G, Trautmann A. The intracellular Ca2+concentration optimal for T cell activation is quite different after ionomycin or CD3 stimulation. Pflügers Arch. 1995;429:546–554. doi: 10.1007/BF00704160. [DOI] [PubMed] [Google Scholar]
- 32.Negulescu PA, Shastri N, Cahalan D. Intracellular calcium dependence of gene expression in single T lymphocytes. Proc Natl Acad Sci USA. 1994;91:2873–2877. doi: 10.1073/pnas.91.7.2873. [DOI] [PMC free article] [PubMed] [Google Scholar]
- 33.Rabinowitz JD, Beeson C, Wülfing C, Tate K, Allen P, Davis MM, McConnell HM. Altered T cell receptor ligands trigger a subset of early T cell signals. Immunity. 1996;5:125–135. doi: 10.1016/s1074-7613(00)80489-6. [DOI] [PubMed] [Google Scholar]
- 34.Valitutti S, Müller S, Dessing M, Lanzavecchia A. Different responses are elicited in cytotoxic T lymphocytes by different levels of T cell receptor occupancy. J Exp Med. 1996;183:1917–1921. doi: 10.1084/jem.183.4.1917. [DOI] [PMC free article] [PubMed] [Google Scholar]
- 35.Bachmann MF, Oxenius A, Speiser DE, Mariathasan S, Hengartner H, Zinkernagel RM, Ohashi PS. Peptide-induced T cell receptor down-regulation on naive T cells predicts agonist/partial agonist properties and strictly correlates with T cell activation. Eur J Immunol. 1997;27:2195–2203. doi: 10.1002/eji.1830270912. [DOI] [PubMed] [Google Scholar]
- 36.Inaba K, Romani N, Steinman RM. An antigen-independent contact mechanism as an early step in T cell–proliferative responses to dendritic cells. J Exp Med. 1989;170:527–542. doi: 10.1084/jem.170.2.527. [DOI] [PMC free article] [PubMed] [Google Scholar]
- 37.Green J, Jotte R. Interactions between T helper cells and dendritic cells during the rat mixed leukocyte reaction. J Exp Med. 1985;162:1546–1560. doi: 10.1084/jem.162.5.1546. [DOI] [PMC free article] [PubMed] [Google Scholar]
- 38.Davis MM, Chien Y. Topology and affinity of T-cell receptor mediated recognition of peptide-MHC complexes. Curr Opin Immunol. 1993;5:45–49. doi: 10.1016/0952-7915(93)90079-8. [DOI] [PubMed] [Google Scholar]
- 39.Pagès F, Ragueneau M, Rottapel R, Truneh A, Nunes J, Imbert J, Olive D. Binding of phosphatidylinositol-3-OH kinase to CD28 is required for T-cell signalling. Nature. 1994;369:327–329. doi: 10.1038/369327a0. [DOI] [PubMed] [Google Scholar]
- 40.Abe R, Vanderberghe P, Craighead N, Smoot DS, Lee KP, June CH. Distinct signal transduction in mouse CD4+ and CD8+splenic T cells after CD28 receptor ligation. J Immunol. 1995;154:985–997. [PubMed] [Google Scholar]
- 41.Ohnishi H, Ledbetter JA, Kanner SB, Linsley PS, Tanaka T, Geller AM, Kotb M. CD28 cross-linking augments TCR-mediated signals and costimulates superantigen responses. J Immunol. 1995;154:3180–3193. [PubMed] [Google Scholar]
- 42.Pardi R, Bender JR, Dettori C, Giannazza E, Engleman EG. Heterogeneous distribution and transmembrane signaling properties of lymphocyte function-associated antigen (LFA-1) in human lymphocyte subsets. J Immunol. 1989;143:3157–3166. [PubMed] [Google Scholar]
- 43.Kanner SB, Grosmaire LS, Ledbetter JA, Damle NK. β2-integrin LFA-1 signaling through phospholipase C-γ1 activation. Proc Natl Acad Sci USA. 1993;90:7099–7103. doi: 10.1073/pnas.90.15.7099. [DOI] [PMC free article] [PubMed] [Google Scholar]
- 44.Van Kooyk Y, Weder P, Heije K, de Waal R, Malefijt, Figdor CG. Role of intracellular Ca2+levels in the regulation of CD11a/CD18 mediated cell adhesion. Cell Adhes Commun. 1993;1:21–32. doi: 10.3109/15419069309095679. [DOI] [PubMed] [Google Scholar]
- 45.Liu SJ, Hahn WC, Bierer BE, Golan DE. Intracellular mediators regulate CD2 lateral diffusion and cytoplasmic Ca2+mobilization upon CD2-mediated T cell activation. Biophys J. 1995;68:459–470. doi: 10.1016/S0006-3495(95)80207-9. [DOI] [PMC free article] [PubMed] [Google Scholar]
- 46.Takeda S, Rodewald HR, Arakawa H, Bluethmann H, Shimizu T. MHC class II molecules are not required for survival of newly generated CD4+T cells, but affect their long-term life span. Immunity. 1996;5:217–228. doi: 10.1016/s1074-7613(00)80317-9. [DOI] [PubMed] [Google Scholar]
- 47.Kirberg J, Berns A, von Boehmer H. Peripheral T cell survival requires continual ligation of the T cell receptor to major histocompatibility complex–encoded molecules. J Exp Med. 1997;186:1269–1275. doi: 10.1084/jem.186.8.1269. [DOI] [PMC free article] [PubMed] [Google Scholar]
- 48.Tanchot C, Lemonnier FA, Pérarnau B, Freitas AA, Rocha B. Differential requirements for survival and proliferation of CD8 naive or memory T cells. Science. 1997;276:2057–2062. doi: 10.1126/science.276.5321.2057. [DOI] [PubMed] [Google Scholar]
- 49.Brocker T. Survival of mature CD4 T lymphocytes is dependent on major histocompatibility complex class II– expressing dendritic cells. J Exp Med. 1997;186:1223–1232. doi: 10.1084/jem.186.8.1223. [DOI] [PMC free article] [PubMed] [Google Scholar]
- 50.Bachmann MF, Mariathasan S, Bouchard D, Speiser DE, Ohashi PS. Four types of Ca2+ signals in naive CD8+cytotoxic T cells after stimulation with T cell agonists, partial agonists and antagonists. Eur J Immunol. 1997;27:3414–3419. doi: 10.1002/eji.1830271241. [DOI] [PubMed] [Google Scholar]


