

Abstract
Many retinal ganglion cells are coupled via gap junctions with neighboring amacrine cells and ganglion cells. We investigated the extent and dynamics of coupling in one such network, the OFF α ganglion cell of rabbit retina and its associated amacrine cells. We also observed the relative spread of Neurobiotin injected into a ganglion cell in the presence of modulators of gap junctional permeability. We found that gap junctions between amacrine cells were closed via stimulation of a D1 dopamine receptor, while the gap junctions between ganglion cells were closed via stimulation of a D2 dopamine receptor. The pairs of hemichannels making up the heterologous gap junctions between the ganglion and amacrine cells were modulated independently, so that elevations of cAMP in the ganglion cell open the ganglion cell hemichannels, while elevations of cAMP in the amacrine cell close its hemichannels. We also measured endogenous dopamine release from an eyecup preparation and found a basal release from the dark-adapted retina of approximately 2 pmol/min during the day. Maximal stimulation with light increased the rate of dopamine release from rabbit retina by 66%. The results suggest that coupling between members of the OFF α ganglion cell/amacrine cell network is differentially modulated with changing levels of dopamine.
Keywords: Gap junction, Connexin, Tracer coupling, Retina, Neurobiotin, Adaptation
Introduction
Many types of retinal ganglion cells are coupled by gap junctions. The evidence comes from demonstrations of correlated spiking (Mastronarde, 1983a, 1983b; Meister et al., 1995; DeVries, 1999), tracer coupling (Vaney, 1991; Dacey & Brace, 1992; Xin & Bloomfield, 1997, 1999), light microscopy (Hidaka et al., 2002, 2004; Schubert et al., 2005a, 2005b), and electron microscopy (Jacoby et al., 1996). Some ganglion cells are coupled to their neighbors of the same type, some are coupled to amacrine cells, and some are coupled to both. However, both the cellular mechanisms that regulate coupling and the anatomical details are incompletely understood. Bloomfield et al. (Hu & Bloomfield, 2003; Ackert et al., 2006) have recently shown for two types of ganglion cell in the rabbit retina that gap junctional coupling increases synchronized firing between neighboring pairs of a given type. In this study, we investigate the mechanisms underlying the modulation of coupling by dopamine and suggest how this contributes to ganglion cell function.
The ganglion cell type that we have studied, the OFF α ganglion cell, is ubiquitous in mammalian retinas (Peichl et al., 1987), stratifies in sublamina a of the inner plexiform layer, and is also called the OFF Y, or brisk transient ganglion cell. Neurobiotin injections in this ganglion cell label two distinct populations of amacrine cells as well as other ganglion cells presumed to belong to the same type (Vaney, 1991; Xin & Bloomfield, 1997). In rabbit retinas, the presence of short latencies in the peak of spike cross-correlograms of OFF α ganglion cells, which are tracer-coupled, but not in ON α ganglion cells, which are not, suggest that OFF α ganglion cells are directly coupled to one another (DeVries, 1999; Hu & Bloomfield, 2003). Moreover, there is evidence from rat retina that there are direct gap junctions between α ganglion cells (Hidaka et al., 2002, 2004). The OFF α ganglion cell connexin appears to be connexin36 in rats (Hidaka et al., 2002), but the identity of the connexin is controversial in mice (Schubert et al., 2005a; Völgyi et al., 2005). The connexin used by the amacrine cells to which they are connected is not known.
Other retinal gap junctions change their permeability in response to changes in background light intensity, and dopamine mediates many of these effects (Piccolino et al., 1984; Teranishi et al., 1984; McMahon et al., 1989; DeVries & Schwartz, 1989; Hampson et al., 1992; Bloomfield et al., 1997; Mills & Massey, 1995). We undertook this series of experiments in order to determine whether dopamine influenced coupling of OFF α ganglion cells and amacrine cells. We injected Neurobiotin into single OFF α ganglion cells and measured the amount of tracer in the coupled ganglion and amacrine cells. The movement of tracer is determined by the coupling rates across the various gap junctions and the geometry of the coupled network. Hence, by quantitative analysis of the kinetics of tracer movement, we identified the coupling pathways in the network. We have found this coupling to be sensitive to the concentration of dopamine, its agonists and antagonists, to the second messenger, 3′-5′ cyclic adenosine monophosphate (cAMP), and to modulators of endogenous phosphatase activity.
In order to correlate our results with previous studies of the effects of light and dark adaptation on coupling of retinal neurons, we also measured dopamine release as a function of light intensity. This has never been studied systematically in any mammalian retina, but there is indirect evidence suggesting that there is a U-shaped relationship between dopamine release and light intensity in the rabbit retina. The gap junctions between AII amacrine cells, major targets of dopaminergic cells, are closed by dopamine (Hampson et al., 1992). AII cells are uncoupled when the retina is maintained either in total darkness or in light at the upper end of the scotopic range. However, in the lower scotopic range, light may inhibit dopamine release in the low scotopic range because AII amacrine cells are extensively coupled (Bloomfield et al., 1997; Bloomfield & Völgyi, 2004). Using a rabbit eyecup preparation, we found a basal release in dark adapted retina that was increased by both steady and flashing light. There was no range of light intensities for which dopamine release was decreased to levels below that seen in total darkness.
Materials and methods
Adult New Zealand White rabbits were deeply anesthetized with intra peritoneal (IP) urethane (Sigma-Aldrich, St. Louis, MO), and the orbit was infused with 2% lidocaine (Burns Veterinary Supply, Rockville, NY). This and all other procedures described below were in accordance with institutional Animal Welfare Committee approved protocols. The anesthesia began with an IP loading dose of urethane (40% w/v, 10 ml), followed 1 h later by smaller doses of urethane every 30 min until the toe-pinch withdrawal reflex was no longer present. In the dopamine release experiments, the rabbit was then intubated and placed on a heated blanket.
Measurement of dopamine release
The procedure for continuous superfusion of the rabbit retina, in vivo, has been described in detail previously (Massey & Redburn, 1982). Briefly, a support ring was sutured to the eye, and the cornea, iris, lens, and vitreous humor were removed. The eyecup was then superfused with Ames medium (Sigma-Aldrich) that included 200 μM ascorbic acid (Sigma-Aldrich), 10 μM nomifensine (Sigma-Aldrich), and 10 μM pargyline (Sigma-Aldrich) at 1 ml/min heated to 37°C by an in-line heater (SF-28, Warner Instrument Corporation, Hamden, CT). The experiments were done within a light-tight box, and the laboratory was also kept dark, with only essential red indicator lights remaining uncovered. The light stimulus was controlled and synchronized with the fraction collector from another room. All experiments began with 60 min of superfusion, which allowed the rabbit to recover from the surgery and the retina to adapt to the dark. Then two consecutive 5 min fractions of the superfusate were collected for each condition, starting with darkness and proceeding with stimuli of increasing intensity. All experiments were carried out in the middle of the day.
Light stimuli
The light source was an array of green light-emitting diodes (LEDs: peak output 560 nm) enclosed in a metal tube, 50 mm in length with a white matte surface (Robson & Frishman, 1995). The LEDs illuminated a white concave diffusing screen 35 mm in diameter at the other end of the metal tube. The screen was placed 130 mm above the rabbit eyecup. Separate LEDs produced the flickering and background stimuli. For the flickering stimuli, the output from the LEDs was sinusoidally modulated at 2 Hz with 50% contrast using a pulse-width modulation technique at a pulse frequency of 1 kHz. The luminance was altered by varying the number of LEDs activated, by varying the current in a few discrete steps, and by varying the pulse flash duration in increments of 0.4 μs. Varying the current altered the background luminance. The luminance (scotopic cd m−2) of the stimulator screen was calibrated using a photometer (International Light IL 1700, Peabody, MA) with a CIE scotopic correction filter. The photopic luminance provided by the green LEDs was close to the scotopic luminance assuming that the rods have a spectral peak of about 500 nm and the M cone peak is about 520 nm (DeMonasterio, 1978).
The light stimuli were sine waves with 50% contrast and an average light intensity (log cd m−2) of −5, −4, −3, −2, −1, 0, 1, and 2. When the intensity is corrected for the size and distance of the light source from the rabbit eyecup, 1 cd/m2 at the light source = (radius of the light source)2 (distance to the rabbit eyecup)−2 or 0.057 Lux. The average density of rod photoreceptors in the rabbit retina was estimated to be 215,000 rods/mm2 (Young & Vaney, 1991), and 1 Lux is equal to 1.5 × 10¹⁵ photons/m2/s. The stimulus strength was estimated under our conditions to produce 40 photoisomerizations (Rh*)/rod s−1 for each cd/m2 from the light source. We also measured dopamine release in total darkness and with a high intensity 2 Hz flashing white light (Grass PS22 Photic Stimulator with flash intensity 4) on a rod-saturating background of 4000 Rh*/rod/s generated by the green LEDs.
Dopamine extraction
The superfusate was collected into 125 μl of 1M HClO4 with 50 μl of 0.2 μM 3,4-dihydroxybenzylamine hydrobromide (DHBA, Sigma-Aldrich) in 200 μM ascorbic acid; the DHBA was used as an internal standard for the dopamine extraction procedure. Control samples that were spiked with 50 μl of 0.2 μM dopamine were also included.
Dopamine was extracted and concentrated from the superfusate using a method described previously (Raggi et al., 1999). Buffer A consisted of 500 mg diphenylboric acid 2-aminoethyl ester (DPB), 3g tetrabutylammonium bromide (TBA), 0.5% ethylenediamine-tetraacetic acid (EDTA), and 26.75 g NH4Cl made up to 250 ml with water (pH = 8.5 with 30% NH3). Buffer B consisted of 200 mg TBA, 0.05% EDTA, and 535 mg NH4Cl made up to 50 ml with water (pH = 8.5 with 30% NH3). The fractions were each combined with an equal volume of buffer A and incubated for 20 min at 4°C. Oasis HLB cartridges (Waters, Milford, MA, 30 mg) were conditioned using 2 × 1 ml of methanol, 2 × 1 ml of water, and then 2 × 1 ml of buffer A through the column immediately prior to the extraction. Then the combined fractions from each lighting condition (10 min) were run through preconditioned cartridges under vacuum at approximately 0.5 ml/min. The columns were washed with 2 × 1 ml of buffer A, 2 × 1 ml of 1:1 buffer B and methanol. Then the dopamine and DHBA were eluted from the column with 0.5 ml of a buffer consisting of 2.5% methanol in an aqueous solution with 10.5 g/l citric acid, 200 mg/L EDTA, 1-octanesulfonic acid sodium monohydrate 20mg/l buffered to pH = 2.9 with 1 M NaOH. These samples were then frozen until the levels of dopamine could be measured by HPLC.
HPLC analysis of dopamine
On the day of analysis, superfusion-sample extracts were diluted 1:1 with ice-cold, deoxygenated mobile phase, mixed, spun for 2 min at 14,000 g, and the supernatant injected directly into the HPLC system. The analytical column was a 10-cm C18 reversed-phase catecholamine column (HRA-80, ESA, Wiggens, MA), preceded by a 7-mm guard column (1.5 cm, ODS, BAS, West Lafayette, IN); the detector was a glassy carbon electrode set at + 0.7 V versus Ag/AgCl. The mobile phase was 50 mM NaH2PO4, with 3 mg/l sodium octylsulfate, 23.2 mg/l heptanesulfonic acid, 8 mg L-1 EDTA, and 10% methanol, pH 3.0 (Witkovsky et al., 1993). The mobile phase was deoxygenated with argon, filtered, then maintained under argon throughout the analysis; flow rate was 1.2 ml/min. The concentrations of DA and DHBA in each sample extract were assessed by comparison with known standards. Every sample was spiked with 2 nM DHBA to assess recovery during the concentration step; two additional samples of elution medium were spiked with both DA and DHBA (2 nM) to determine the relative recovery for each substance. These data were used to calculate the amount of DA originally in each sample of superfusate.
Tracer injection experiments
The retina from enucleated eyes was isolated, mounted on filter paper photoreceptor side down and continuously superfused with oxygenated Ames solution (Mills & Massey, 1991). Ganglion cells were stained with the vital nuclear fluorescent dye acridine orange (Sigma-Aldrich). OFF α ganglion cells were selected by their large elliptical nuclei. Cells were impaled with microelectrodes containing 0.5% Lucifer Yellow CH (Molecular Probes, Eugene, OR) and 3.5% Neurobiotin (Vector Laboratories, Burlingame, CA) in 0.05% PBS. Some ganglion cells were injected with 500 μM PoPro-1 (Invitrogen Inc., Carlsbad, CA) in order to target the coupled amacrine cells for Neurobiotin injection. Successful impalement and confirmation of the cell's identity were established by a few seconds of iontophoresis of Lucifer Yellow with negative current and was followed by iontophoresis of Neurobiotin with positive current (3 nA, 10 min., 3 Hz). Pharmacological agents were superfused for 15 min before any injections were made. The time between initiation of iontophoresis and tissue fixation was recorded, as this is an important parameter in modeling the diffusion process. Following tissue fixation (4% paraformaldehyde, 1 h) and rinsing, cells were visualized with 1:600 streptavidin-Cy3 (Jackson ImmunoResearch, West Grove, PA). Brightness calibrations and rate coefficients were calculated as described previously (Mills & Massey, 1998), assuming a passive diffusion model with coefficients for delivery rate and junctional permeability.
Fig. 1 shows the general method for obtaining quantitative measurements of tracer flux throughout the coupled network, which is closely analogous to that used in previous studies (Mills & Massey, 1998; Xia & Mills, 2004). Fig. 1A shows an example of a well-coupled OFF α ganglion cell injected with Neurobiotin. Neurobiotin injection typically stained two types of amacrine cell and a few coupled ganglion cells. The fluorescent intensity of each soma was measured and converted to an absolute Neurobiotin concentration. These values are plotted in Fig. 1B as a function of the distance from the injected cell. In this and all other figures, the absolute distance in microns was divided by the radius of the OFF α ganglion cell to facilitate comparison of different-sized cells. The measurement of absolute Neurobiotin concentration in each soma was made by measuring the radiant intensity of each cell on a confocal microscope (Zeiss LSM 410), as described in the following section.
Fig. 1.

(A) Neurobiotin injection into an OFF α ganglion cell stains not only the injected cell, but also other OFF α ganglion cells (arrow) and two types of amacrine cell over an area much wider than the dendritic field of the injected cell. (B) Measurement of the fluorescent intensity of each soma shows the distribution of tracer following diffusion. Amacrine cell brightness varies over more than 2 log units and declines with distance from the injected cell. (C) A surface plot shows that two types of amacrine cells can be discriminated. Type AC1 (arrowheads) has a bright, elliptical soma, while type AC2 (small arrows) is dim with a round soma.
Changes in gap junctional permeability were examined following bath application of dopamine, the D1 antagonist SCH 23390, D1 agonist SKF38393, D2 antagonist sulpiride, D2 agonist quinpirole, the phosphatase inhibitor okadaic acid (all obtained from Sigma-Aldrich) and the cAMP analogs Sp-8-cpt-cAMPs and Rp-8-cpt-cAMPs (Biolog, La Jolla, CA).
Quantification and modeling
These methods have been described previously (Mills & Massey, 1998; Xia & Mills, 2004); changes were measured in Neurobiotin diffusion coefficients in homologous and heterologous retinal networks. The concentration of Neurobiotin in each soma in a coupled patch of cells was estimated by comparing its brightness with that of a group of standards imaged identically. The standards are HeLa cells which were filled with known concentrations of Neurobiotin via diffusion from patch pipettes. A lookup table in the program SigmaScan Pro (SPSS, Inc., Chicago, IL) converts the confocal image into a table of distances and brightnesses from which we estimate diffusion coefficients.
In this study, we adopted a model similar to that of the AII amacrine cell–ON cone bipolar cell mosaic. A MatLab program iteratively estimates diffusion coefficients by evaluating ordinary differential equations describing the geometry of the network (see Xia & Mills, 2004 for the fullest explanation). The present model estimates coefficients for ganglion-AC1 diffusion (kGA), for diffusion among neighboring AC1 amacrine cells (kAA), and for direct ganglion-ganglion diffusion (kGG). A two-dimensional (2D) flow model was constructed based upon the connectivity of hexagonal arrays of ganglion cell and amacrine cell mosaics. A one-dimensional (1D) model was also tested for generality, which produced similar results. The 2D model was constructed using measured parameters relating ganglion and amacrine cell density, and the relative decline in ganglion-amacrine cell coupling efficiency with distance from the injected cell. A unique combination of kGA, kAA, and kGG, together with the delivery rate parameter that determined the overall brightness of the patch of stained cells, best fit each coupled data set. The delivery rate parameter is the amount of tracer delivered to the injected cell per second. Changes in this parameter determine the overall brightness of the stained patch without altering the diffusion coefficients. This is adjusted to match the overall brightness of the modeled data to that of the actual data, while the diffusion coefficients are adjusted to match the relative intensities of the cells within the stained patch.
The differential equations were as follows:
| (1) |
| (2) |
| (3) |
| (4) |
where dCG(i)/dt and dCA(i)/dt are the changes in concentration of each ganglion and amacrine cell, wij is the relative weight from each amacrine cell to each ganglion cell based upon the distance between the two cells, and the decrease in diffusion coefficient we measured as a function of that distance (Fig. 4D). Cinj is the delivery rate parameter, which represents the amount of Neurobiotin added to the injected ganglion cell for the duration of iontophoresis. kGA, kGG, and kAA are the diffusion coefficients between ganglion and amacrine cells, between pairs of ganglion cells, and between pairs of amacrine cells, respectively. The numerical coefficients 1.5, 2.5, 6, etc. represent the average number of neighbors that share the same distance from the cell whose flux is being calculated, based upon the geometry of the mosaic.
Fig. 4.
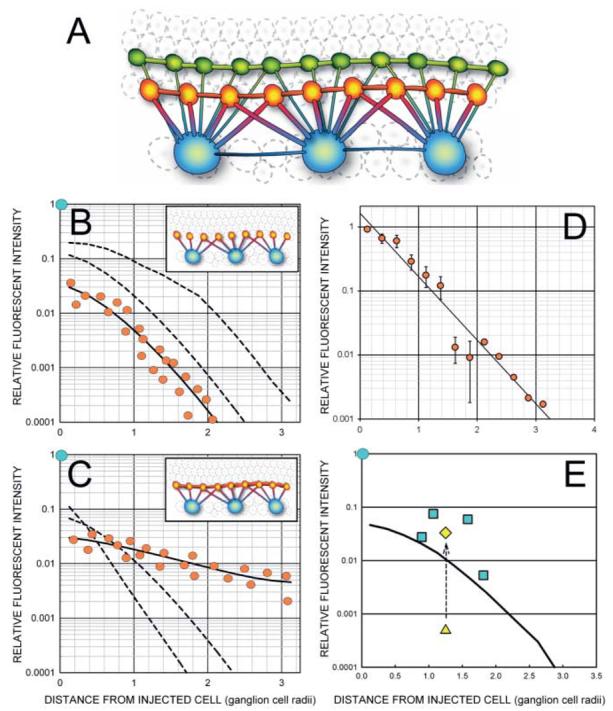
(A) The three types of coupled neurons stained by injection of Neurobiotin into an OFF α ganglion cell may be interconnected by as many as 6 possible pathways. (B) Increased diffusion from the injected ganglion cell to the AC1 amacrine cell results in a brightness shift that is reflected in an upward translation (dashed lines) on a log brightness axis. Some flattening of the curve occurs as the concentration gradients of the nearer cells approach that of the ganglion cell. (C) Increased diffusion between AC1 amacrine cells results in more similar levels of Neurobiotin across the AC1 population and is seen as a flattening of the AC1 staining profile. (D) There is a maximum rate of decline of AC1 intensities found either at short diffusion times, when the AC1 cells have had little time to pool tracer, or when the AC1 gap junctions are closed by drugs. The data shown is the mean and standard error of 11 injections of 20 min or less. Six were in control media and 5 contained drugs (SKF38393, Sp-8-cpt-cAMPs, and okadaic acid) that closed AC1 gap junctions. (E) The diffusion coefficient for coupling between ganglion cells was calculated from the amount of direct diffusion required to predict the average staining intensity of coupled ganglion cells. The triangle shows the predicted value after diffusion from the amacrine cells was accounted for, while the diamond shows the predicted value after the direct coefficient, kGG, is added to the equation. The curved line is the average of the AC1 amacrine cells in this field.
The total amount ofsuperfusion time for each cell was entered as a fixed parameter in the model that determined each diffusion coefficient. We have consistently examined the stability of the diffusion coefficient as a function of diffusion time and found that it was stable within comparable treatment groups, except at very short diffusion times not used in this study. The use of a wide range of diffusion times gives the results greater generality and requires the model to perform adequately over a much larger and varied data surface. While this might be a minor consideration for homologous gap junctional networks, the interaction of the separate pathways in a complex heterologous network is unlikely to be adequately sampled at any single fixed diffusion time.
With the light-adapted conditions we used, we have consistently found, on average, 40–45 AC1 amacrine cells in the dendritic field of each OFF α ganglion cell across all measured eccentricities. This appears to be the maximum number—short diffusion times and pharmacological manipulations lowered the total number. We modeled AC1-AC1 coupling as a standard homologous network (Mills & Massey, 1998), where tracer flows from a cell to its six nearest neighbors proportionally to the concentration gradient and the diffusion coefficient, kAA, and indirectly from there. The ganglion cells were assumed to be coupled to their ganglion cell neighbors similarly proportionally to the kGG coefficient. Ganglion cells were coupled to all amacrine cells proportionally to the kGA diffusion coefficient, weighted by their distance from the injected ganglion cell.
AC2 amacrine cells were distinguished from AC1 amacrine cells by their shape and brightness. A plot of amacrine cell intensities within any of these well-stained patches was distinctly bimodal (not shown). To separate the AC1 population from the AC2 population, we divided the area of the coupled patch of cells into shells whose diameters were at 20% increments of the dendritic field diameter, i.e., 20%, 40%…300%. For each of these shells, the expected number of AC1 amacrine cells was calculated. The brightest amacrine cells in each shell were designated AC1, up to this predicted density. The remainder, if any, were designated AC2. As would be expected, AC2 amacrine cells were not found as far from the injected ganglion cell as the brighter AC1 amacrine cells.
Results
Dopamine release
In order to gain an appreciation of the relationship between adaptation state and the changes we observed in coupling, we measured dopamine outflow as a function of light intensity using an eyecup preparation. We found that, after 60 min of dark adaptation, dopamine was released from the rabbit retina at a rate of 2.08 ± 0.09 pmol/min (n = 5). Dopamine release was significantly increased by 66% to 3.14 ± 0.23 pmol/min (p < 0.0001, n = 4) under photopic conditions (rod saturating background that produced 4000 Rh*/rod/s) with a high intensity flashing light, a stimulus known to increase dopamine release in macaque retina (Boelen et al., 1998).
We also studied the rate of dopamine release over a range of lower mean luminances using a sinusoidally-modulated stimulus. A significant linear trend was found in the rate of dopamine release with the log of photo-isomerization rates from 0.0004 to 4000 Rh*/rod/s using a generalized linear model with repeated measures (Fig. 2). If the relationship is, in fact, linear, this represents an increase of 4.7% in the rate of dopamine release for each tenfold increase in light intensity. The rate of dopamine release increased significantly compared to the rate of dopamine release in darkness at 400 Rh*/rod/s to 2.76 ± 0.34 pmol/min (p = 0.004, n = 5) and at 4000 *Rh/rod/s to 2.76 ± 0.17 pmol/min (p = 0.014, n = 4).
Fig. 2.
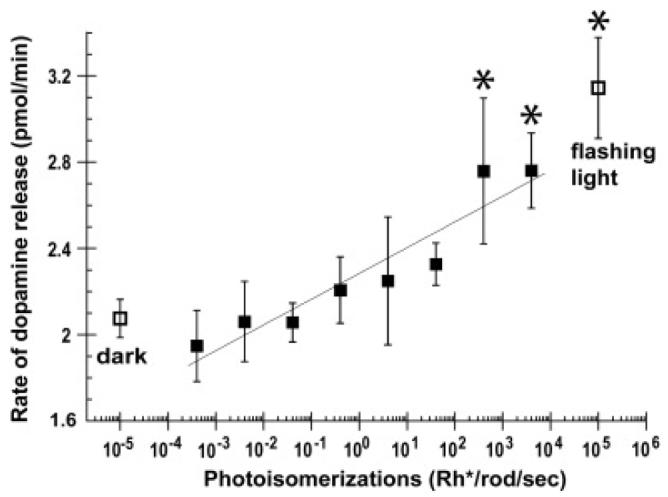
The mean dopamine concentration in the superfusate is shown as a function of average stimulus strength (filled squares). The mean dopamine concentration in darkness (left, open squares) and the mean dopamine concentration after a 2 Hz photopic light (right, open squares) are included for comparison. Dopamine release rates indicated with asterisks were significantly different from those in the dark.
Staining patterns
Neurobiotin injection into OFF α ganglion cells almost invariably stained at least some amacrine cells and often other ganglion cells (Fig. 1). Our results are therefore consistent with previous findings (Vaney, 1991; Xin & Bloomfield, 1997). The number of injected cells showing no coupling was very low (< 3%), and the few failures were from injections with short periods of diffusion and lowered permeability due to pharmacological treatment.
The coupling pattern in Fig. 1A resulted from injection of an OFF α ganglion cell with Neurobiotin for 10 min, followed by an additional 55 min of superfusion before fixation. The distribution of Neurobiotin concentrations calculated from the amacrine cell intensities (Fig. 1B) shows the relative decline of AC1 and AC2 cell brightnesses. If the connexin type and adaptive state is the same for all the ganglion/amacrine channels across the dendritic field, then any differences in permeability of the gap junctions between the injected ganglion cell and the amacrine cells must be determined by the area of the gap junctions they share. As the diffusion coefficient between the ganglion cell and the amacrine cells it contacts declines regularly with distance from the injected soma, then this decline describes the decline in gap junctional area between the amacrine and ganglion cells. Fig. 1C is a surface plot that shows that the coupled amacrine cells were of two basic types, discriminable by shape and intensity. The brighter cells at any given location (AC1) had two primary dendrites emerging from each end of their elliptical somata. The other labeled amacrine cells, AC2, had round somata and was substantially dimmer than neighboring AC1 cells.
The number of stained cells increases with increased diffusion time
Diffusion coefficients are calculated based upon the assumption that tracer moves between coupled cells via passive diffusion. Evidence for this assumption comes from experiments showing that once tracer is injected into a cell, further movement through the network of coupled cells is a function of the time allowed for the tracer to diffuse before tissue fixation. We have shown this directly in networks of A- and B-type horizontal cells (Mills & Massey, 1998), and we have also found it to be true for all other cell types tested, including amacrine, and here, ganglion cells. Multiple injections were made in each retina and, almost without exception; each group of stained cells was of larger radius and contained more cells than other groups from that retina with shorter diffusion times. This was true across all pharmacological treatments, for both types of amacrine cells and for coupled ganglion cells.
Distinguishing between coupled amacrine cell types
From the first reported injections of Neurobiotin in α retinal ganglion cells, it was recognized that more than a single type of amacrine cell was present, based on differences in staining intensity and apparent morphology (Vaney, 1991). Xin and Bloomfield (1997) showed drawings of two different morphological types of amacrine cell and found a bimodal distribution of soma diameters. The more intensely-stained amacrine cell, which we call AC1, was, on the average, the larger of the two. Fig. 1C illustrates this difference.
What are the relative magnitudes of AC1 and AC2 coupling?
The less bright amacrine cell, AC2, does not appear in patches with short diffusion times or reduced coupling rates. Assuming from these observations that this cell receives tracer directly from the injected ganglion cell, the relative coupling rate from ganglion cells to AC2's can be estimated by adding these cells to the model. Adjusting relative coupling rates from the injected ganglion cell to AC1 and AC2 amacrine cells leads to an estimate of a coupling rate from ganglion cell-to-AC2 less than 6% of the corresponding rate to AC1's. This type of cell was therefore not analyzed further.
Type AC1 amacrine cells are coupled to one another
Evidence for direct coupling between neighboring AC1 cells comes from Xin and Bloomfield (1997), who injected cells resembling AC1 cells morphologically and found coupling to neighboring cells of the same type, with or without additional coupling to ganglion cells. However, it was uncertain whether the cells they injected were the same type as those coupled of OFF α ganglion cells. Therefore, we also injected Neurobiotin directly into AC1 amacrine cells identified by tracer coupling to more closely examine their distribution and morphology. First, as described by Hoshi et al. (2006), we injected OFF α ganglion cells with the tracer PoPro-1, which, like Neurobiotin, stains both amacrine cells and neighboring ganglion cells. Using this technique, we injected fluorescent amacrine cell somas with Neurobiotin and found the density and morphology of this type. Fig. 3A shows one such injection. The injected amacrine cell was an AC1 and Neurobiotin-coupled to its neighbors of like type. The AC1 is an axon-bearing (polyaxonal) type. Neurobiotin injection into an AC1 usually stained a coupled OFF α ganglion cell. Coupling to the other type of amacrine cell, AC2 was sometimes seen.
Fig. 3.

(A) AC1 amacrine cells are labeled by injection of Popro-1 into OFF α ganglion cells, followed by direct Neurobiotin injection into one of the fluorescent somas revealed by diffusion of Popro-1 from the ganglion cell. (B) The morphology and density of the cells in (A) match those stained by diffusion of Neurobiotin from an injected OFF α ganglion cell.
Fig. 3B shows a portion of a coupled patch of cells labeled by injection of Neurobiotin into an OFF α ganglion cell. Comparison with Fig. 3A shows that the general morphology and density of the cells matches well whether filled directly from injection of the PoPro-1 fluorescent amacrine cell or indirectly through coupling from an injected OFF α ganglion cell. The injections into AC1 cells identified by PoPro-1 definitively establish that AC1 amacrine cells are coupled to one another and that tracer can pass from amacrine to ganglion cells.
The kinetics of tracer movement were used to dissect network geometry
The sites of the gap junctions underlying the staining patterns we have described are unknown. Direct gap junctions might exist between all combinations of the three types of coupled cells, including: ganglion-ganglion, ganglion-AC1, ganglion-AC2, AC1-AC1, AC2-AC2, and AC1-AC2. These potential pathways can be analyzed by making the assumption that the brighter amacrine cell (AC1) is the best coupled to the injected ganglion cell. The brightest coupled cells are almost invariably AC1, especially at short diffusion times, a finding indicating that there is a direct path from the injected OFF α ganglion cell to AC1. This specificity allowed us to estimate the relative gap junctional area between the injected OFF α ganglion cell and AC1 cells within its dendritic field using the following procedure. The staining intensity was measured in AC1 cells as a function of their distance from the injected cell for short diffusion times (<20 min), both in control conditions and with modulators that reduce amacrine-amacrine cell diffusion. Tracer movement to cells separated by two or more gap junctions takes more time to occur because of the increased number of gap junctions to traverse. The assumption that Neurobiotin movement through the dendritic arbor is very short compared to movement across the gap junctions was tested previously (Mills & Massey, 1998). At short diffusion times, therefore, the differences in tracer concentration in AC1 cells across the dendritic field will closely reflect the relative gap junctional area between the individual AC1's and the injected ganglion cell.
Any modulator which reduces coupling from the ganglion cell to AC1's within its field will cause a reduction in AC1 staining across the field, but it is proportional for all such cells. The curve of staining intensity translates downward by a fixed amount on a logarithmic intensity axis, but the slope and form of the curve does not change. This phenomenon is illustrated in Fig. 4D, which shows the mean of 10 normalized AC1 intensity curves from injections into OFF α ganglion cells whose diffusion times were less than 20 min. There was no difference in slope between treatments that preferentially closed amacrine-amacrine gap junctions and those that do not; in both cases, kAA was negligibly small. As there is no reason to believe that the connexin type or adaptive state of the gap junctions changes across the dendritic field of the ganglion cell, and because intracellular diffusion is rapid, the differences in staining intensity can only reflect the different gap junctional areas these amacrine cells make with the ganglion cell.
The curve in Fig. 4D provides a measure of relative coupling between a ganglion cell and the AC1 cells that overlap its dendritic field. We then use this function to calculate the average gap junctional area of AC1's with neighboring OFF α ganglion cells. For any given amacrine cell, this function describes the amount of gap junctional area of any amacrine cell with any nearby OFF α ganglion cell. Once the diffusion coefficient kAA is estimated by fitting the data, those two parameters predict the movement of tracer throughout the circuit.
Because AC1 cells are coupled to one another, the kinetics of tracer flow is different than in a network where each AC1 receives Neurobiotin solely from ganglion cells. The lines in Figs. 4B, 4C show how staining patterns differ over time with changes in coupling rate between ganglion cell-to-AC1 versus changes in AC1-to-AC1. Coupling to other ganglion cells and to AC2 cells was omitted because the fraction of tracer that moves to these other two types of cells is small compared to that transferred to and between AC1 cells. The lines in Fig. 4B show the effect of changes in the coupling rate from ganglion cell-to-AC1 (kGA), when the coupling rate between AC1 cells (kAA) is zero. Each point on the curve represents amacrine cells located within a fixed range of distances from the injected cell, normalized for dendritic field radius. In the absence of amacrine-amacrine cell coupling, all stained amacrine cells must be directly coupled to the ganglion cell. Therefore, the relative amount of tracer is a function of the gap junctional area with the ganglion cell, which is proportional to this radial distance, and the amount of time allowed for diffusion to occur. The effect of changes in kGA is to translate the curve up or down on a logarithmic plot of staining intensity, as each cell simply receives more or less tracer per unit time. The slope of the AC1 intensity curves flattens with extended diffusion time as the ganglion cell and AC1 cells equilibrate or at high values of kGA; changes in kGA typically leads to a parallel shift on the logarithmic axis.
Fig. 4C shows the effect of changes in the coupling rate between neighboring AC1 cells. At any given value of kGA, increasing kAA reduces concentration differences between the amacrine cells and hence flattens the curve of AC1 intensities across the stained patch of cells. Changes in kGA and kAA are therefore easily discriminated, as kGA is determined by the brightness difference between the injected ganglion cell and the group of AC1 cells, while kAA is determined by the slope of decline of these AC1 cells.
Is there a direct gap junctional pathway between neighboring OFF α ganglion cells?
Hidaka et al. (2002; 2004) reported evidence for direct gap junctions between α ganglion cells in rat retina. In this study, we found that coupled ganglion cells in rabbit retina were occasionally brighter than any coupled amacrine cells. Although these occurrences were rare (4/168 injected cells), they provide evidence for a direct gap junctional pathway between ganglion cells, because an indirectly coupled ganglion cell should not exceed the brightness of the cells which supply it. We concluded that ganglion-ganglion gap junctions regularly occur between rabbit α ganglion cells as in rat, but the amount of tracer that traverses these gap junctions is usually much less than that which comes indirectly from AC1 cells.
Estimating a direct coupling rate between ganglion cells
We previously measured the relative diffusion rates between the injected ganglion cell and amacrine cells as a function of distance from the injected cell (Fig. 4D). Having measured the diffusion coefficient across ganglion-amacrine cell gap junctions, kAA, we could then calculate how much Neurobiotin neighboring ganglion cells should get from each amacrine cell in the patch. Fig. 4E illustrates the usual result. The coefficient kGA was calculated that best matched the drop in Neurobiotin concentration from the injected cell (blue circle) and the coupled amacrine cell patch (solid line), and the coefficient kAA that matched the slope of the amacrine cell patch was also calculated. The coefficient kGA and the distances from each amacrine cell to a ganglion cell were used to predict the staining intensity of coupled ganglion cells (triangle). This value was always low. A third diffusion coefficient kGG was calculated which reflect direct ganglion-ganglion cell coupling. This coefficient was increased until the new estimate of ganglion cell staining intensity (diamond) matched the mean of the coupled ganglion cells (squares). Therefore, there consistently appears to be a direct pathway between ganglion cells and kGG is used hereafter as a measure of diffusion across junctions between pairs of ganglion cells.
Pharmacogical modulators of amacrine-amacrine coupling
We investigated the influence of dopamine receptors with dopamine as well as D1 and D2 agonists and antagonists; in addition, we studied the PKA pathway directly using the cAMP analogs, Sp-8-CPT-cAMPs (a PKA stimulator) and Rp-8-CPT-cAMPs (a PKA competitive inhibitor). We measured the diffusion coefficient, kAA, between the AC1 amacrine cells resulting from the best fit to the data. Increases of coupling between AC1 amacrine cells were reflected in increases in kAA and a more gradual decline in AC1 brightnesses with distance from the injected cell. Fig. 5 shows characteristic staining patterns for some of the modulators, where the diffusion time following iontophoresis of Neurobiotin into each OFF α ganglion cell was held constant (100 ± 3 min). Antagonists of the D1 receptor (Fig. 5A) and PKA (Fig. 5C) produced greater diffusion of tracer than control injections (dashed line in each panel) of similar diffusion time, while a PKA agonist reduced diffusion (Fig. 5D). The D2 antagonist led to increased diffusion to amacrine cells directly coupled to ganglion cells. In combination with a D1 antagonist, diffusion was greatly enhanced within the dendritic field of the injected ganglion cell, but amacrine-to-amacrine cell diffusion was strongly reduced outside the dendritic field.
Fig. 5.

The relative distribution of tracer is altered by dopamine and its analogs and also by modulators of PKA activity. (A) SCH23390 (50 μM), a D1 antagonist, allows diffusion of Neurobiotin (NB) to amacrine cells far from the injected ganglion cell. (B) Sulpiride (50 μM), a D2 antagonist, enhances amacrine cell brightnesses within the dendritic field of the ganglion cell, but amacrine cell intensities fall off rapidly thereafter due to presence of the D1 agonist SKF38393 (50 μM), in the perfusate. (C) inhibition of PKA activity by a cAMP analog, Rp-8-CPT-cAMPs (4 μM), also increases lateral diffusion of tracer. (D) Stimulation of PKA activity by cAMP analog, Sp-8-CPT-cAMPs (2 μM), reduces lateral diffusion of tracer. Solid lines are the means of the amacrine cell data. The dashed line is the mean of four control injections (102 ± 5 min superfusion time).
We sought to verify that the modeling procedure accurately described the diagnostic visual trends in the data. To verify that the changes in slope and overall brightness result from changes in the three diffusion coefficient, the slope of the rate of decline of AC1 amacrine cells in the range from 0.5 to 2.0 ganglion cell radii was measured. We also measured the total radius of the stained AC1 patch. Both values were directly proportional to kAA, and both measures responded to drug treatment in the same way as the diffusion coefficient kAA.
The distribution of Neurobiotin was affected by dopamine and its analogs. Dopamine decreased kAA and the radius of the stained patch and increased the rate of decline of staining intensity with distance from the injected cell. The D1 antagonist SCH23390 increased kAA (Fig. 6A) and the radius of the stained patch of amacrine cells, and decreased the rate of decline of AC1 staining intensity. These are all signs of increased coupling between AC1 amacrine cells in response to SCH23390 and reduced coupling to dopamine. The D1 agonist SKF38393 had no effect on kAA, but it did decrease the radius of the stained patch and increased the rate of decline as measured by the slope. Table 1 lists the compounds used and their projected effects on gating of the AC1 and ganglion cell hemichannels.
Fig. 6.
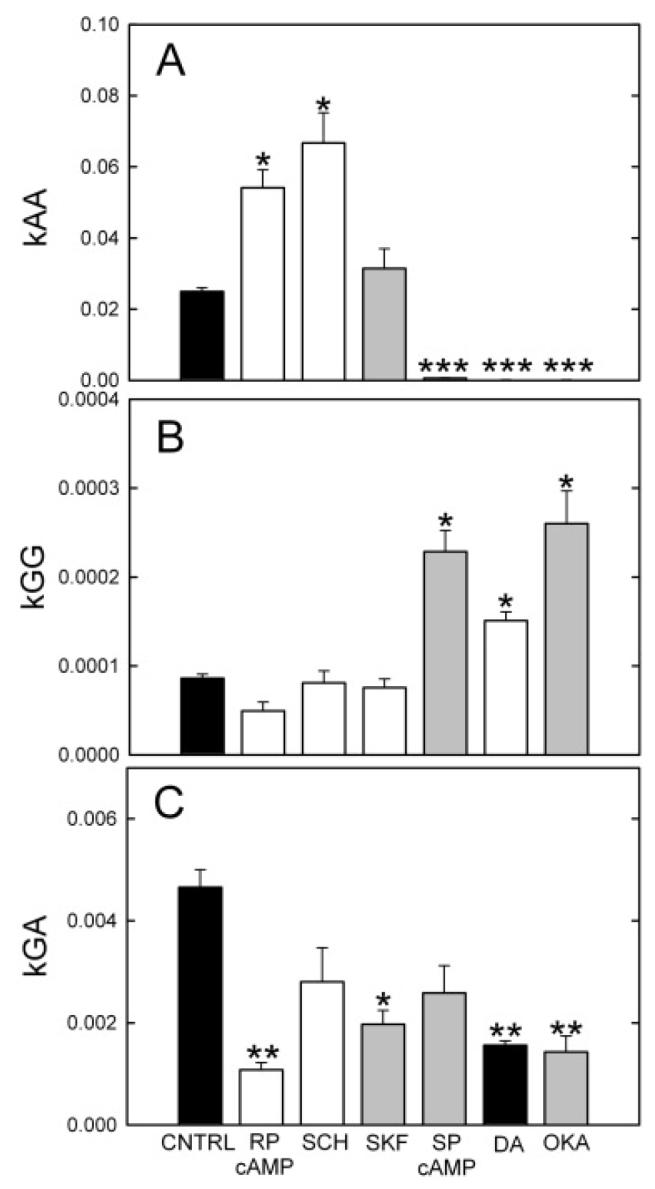
Dopamine analogs produce different patterns of Neurobiotin staining in this coupled network. Drugs with shaded (unshaded) bars should increase (decrease) phosphorylation of the respective channels. (A) The diffusion coefficient between AC1 amacrine cells, kAA, was strongly increased by the D1 antagonist SCH23390 (SCH; 50 μM) and the PKA inhibitor Rp-8-cpt-cAMPs (RP-cAMP; 4 μM), and was strongly decreased by the PKA stimulator Sp-8-cpt-cAMPs (SP-cAMP; 2 μM), by dopamine (DA) and by the phosphatase inhibitor okadaic acid (OKA). The means ± s.e. not visible in the plot are SP-cAMP, 0.00062 ± 0.000097, dopamine, 0.00015 ± 0.0000080, and okadaic acid, 0.00011 ± 0.000014 (t values L-R: 3.42, 3.53, 0.50, 8.00, 8.50, 8.56). (B) The diffusion coefficient between ganglion cell cells, kGG, was increased by SP-8-cpt-cAMPs, dopamine, and okadaic acid. D1 analogs were ineffective and Rp-8-cpt-cAMPs produced a minor decline (t values L-R: 5.10, 0.57, 1.49, 10.07, 9.15, 12.65). (C) The diffusion coefficient between the injected ganglion cell and AC1 amacrine cells, kGA, was reduced in all groups. Rp-8-cpt-cAMPs and okadaic acid produced the largest declines. (t values L-R:3.71, 0.57, 2.7, 1.18, 3.64, 2.47).
Table 1.
The effect on adenylate cyclase and PKA activity of the drugs used, and the projected effects on the opening of amacrine cell and ganglion cell hemichannels and their combinations of full channels. Abbreviations: AC, amacrine cell; GC, ganglion cell; Q, quinpirole; H or SCH, SCH23390; S, sulpiride; K or SKF, SKF38393; SPA, Sp-8-CPT-cAMPs; RPA, Rp-8-CPT-cAMPs; OKA, okadaic acid; C, hemichannel closure; O, hemichannel opening; +, activate or increase; −, inhibit or decrease; 0, no effect
| adenylate cyclase |
PKA activity |
hemichannel p(open) |
effect on channel |
||||||
|---|---|---|---|---|---|---|---|---|---|
| group(n) | GC (D2) | AC (D1) | GC | AC | GC | AC | kGA | kAA | kGG |
| QH (13) | − | − | − | − | − | + | CO | OO | CC |
| QK (13) | − | + | − | + | − | − | CC | CC | CC |
| SH (12) | + | − | + | − | + | + | OO | OO | OO |
| SK (12) | + | + | + | + | + | − | OC | CC | OO |
| SKF (11) | 0 | + | 0 | + | 0 | − | C | CC | 0 |
| SCH (9) | 0 | − | 0 | − | 0 | + | O | OO | 0 |
| SPA (9) | 0 | 0 | + | + | + | − | OC | CC | OO |
| RPA (7) | 0 | 0 | − | − | − | + | CO | OO | CC |
| dopamine (19) | − | + | − | + | − | + | CO | CC | CC |
| OKA (10) | 0 | 0 | ? | ? | + | − | OC | CC | OO |
Direct stimulation of protein kinase A (PKA) by membrane-permeant and hydrolysis-resistant analogs of cAMP produced the results seen in Figs. 5C, 5D, and 6A. The PKA inhibitor Rp-8-CPT-cAMPs increased kAA, extended the radius of coupling, and decreased the rate of decline. The PKA stimulator Sp-8-CPT-cAMPs dramatically lowered kAA and produced smaller patches with more rapid declines in AC1 brightnesses vs. distance.
These results were consistent with the idea that D1 receptors on AC1 amacrine cells activate adenylate cyclase, thereby increasing cAMP, activating PKA, phosphorylating gap junctional channels in AC1 cells, and decreasing their overall permeability to the tracer, as demonstrated previously for AII amacrine cells (Hampson et al., 1992; Mills & Massey, 1995). Paired comparisons of individual groups by t-test revealed that the all groups except for SKF38393 were significantly different from the control group. Dopamine, direct activation of PKA by the cAMP analog Sp-8-CPT-cAMPs, and the phosphatase inhibitor, okadaic acid, which produces increased phosphorylation of the gap junctional connexins, all decreased kAA. Conversely, increases in kAA were produced by the D1 antagonist SCH23390 and by inhibition of PKA by the cAMP analog Rp-8-CPT-cAMPs.
Sulpiride, a D2 antagonist, also increased the range of coupling (Hu & Bloomfield, 2000; our observations). The results differed from those obtained by D1/PKA antagonists in two ways. Fig. 5B shows a combination of sulpiride and the D1 agonist SKF38393. The dramatic increase in intensity of amacrine cells within the dendritic field of the ganglion cell is characteristic of D2 antagonists with or without D1 modulation, but not of SCH23390 or Rp-8-CPT-cAMPs. The combination of SKF38393 and sulpiride produced a rapid decline in amacrine cell intensities outside the dendritic field of the ganglion cell. This is due to a sulpiride-increased permeability of the ganglion cell-amacrine cell gap junctions, such that those in direct contact with the ganglion cell rapidly receive tracer from it combined with a decline in AC1-AC1 coupling, so that AC1 cells with little or no direct contact with the ganglion cell receive much less dye from other AC1 cells.
Pharmacogical modulators of ganglion-ganglion coupling
Results for kGG measurements are shown in Fig. 6B. They differ from the kAA measurements in two important ways: (1) Neither D1 agonists and antagonists nor the PKA inhibitor, Rp-8-cpt-cAMPs significantly alters kGG. (2) permeability was increased by manipulations that stimulate PKA and phosphorylate gap junctional channels. These included dopamine, the PKA activator, Sp-8-cpt-cAMPs, and okadaic acid, which inhibit phosphatase activity. Thus, okadaic acid had the opposite effect on channel opening than in AC1 amacrine cells, where permeability was decreased by stimulation of PKA.
Pharmacogical modulators of ganglion-amacrine coupling
Gap junctions between AC1 amacrine cells and OFF α ganglion cells were examined by estimating the diffusion coefficient between the OFF α ganglion cells and AC1 amacrine cells, kGA. Because each of these gap junctional channels is heterologous, comprised of a ganglion cell hemichannel coupled to an AC1 hemichannel, the two hemichannels are differentially regulated. This may be attributable to differences in connexin type or to the type of dopamine receptors present. Our results (Fig. 6C) show that kGA was lowered most by Rp-8-CPT-cAMPs, dopamine, okadaic acid, and SKF38393. These findings suggest that the ganglion cell hemichannels open in response to phosphorylation, while the amacrine cell hemichannels close in response to PKA phosphorylation. The ganglion-AC1 channels would therefore be regulated in a manner difficult to predict without full dose-response curves of the modulator drugs. The membrane-permeant drug Sp-8-CPT-cAMPs activates PKA in both cell types; the kGG and kAA results indicated that it opened the ganglion cell hemichannels and closed those in the amacrine cell. It did not maximally increase kGA, however, as would be predicted from those findings.
The effects of combined D1 and D2 activity
Hu and Bloomfield (2000) reported that the D2 antagonists spiperone and eticlopride dramatically increased staining of coupled ganglion cells in Neurobiotin-injected OFF α ganglion cells. Preliminary results with eticlopride and sulpiride confirmed this result. Our model, derived from the prior experiments and the initial D2 results, was that the gap junctional channels between AC1 amacrine cells were closed by dopamine via a D1 receptor, which increases adenylate cyclase activity, activates PKA, and phosphorylates the gap junctional channels, decreasing their permeability. The gap junctional channels of OFF α ganglion cells were not affected by D1 analogs, so it appears that, in these cells, dopamine acts through a D2 receptor, which is negatively coupled to adenylate cyclase and inhibits PKA. A surprising inference is that, in contrast to AC1 amacrine cells, ganglion cell hemichannels were closed by a decrease in phosphorylation.
Inspection of coupling patterns in the ganglion-amacrine cell mosaic following administration of D2 analogs revealed the following patterns: (1) The D2 antagonist sulpiride (50 μM) regularly increased the size of the coupled patch and the amount of tracer in the amacrine cells (Fig. 5B). Often, there was scarcely any decline in staining intensity of AC1 amacrine cells across the dendritic field of the ganglion cell. This was not due to an increase in kAA with pooling tracer across neighboring amacrine cells. Instead, it was attributable to an increase in ganglion-amacrine coupling that allowed all amacrine cells in the field to approach the ganglion cell concentration more quickly. The rate of decline of AC1's outside the dendritic field was under control of kAA, however, and it could be sharp or gradual according to the state of the AC1-AC1 channels (Fig. 5B).
In order to test the model further, OFF α ganglion cells were injected with Neurobiotin in the presence of a combination of D1 and D2 analogs. We used the D1 agonist, SKF38393, the D1 antagonist, SCH23390, the D2 agonist, quinpirole, and the D2 antagonist, sulpiride. D1 activation activates adenylate cyclase, elevates cAMP and thereby increases PKA activity; D2 activation has the opposite effect. The experiments with the combined D1 and D2 analogs were performed after the prior set of experiments. The four groups were designated QH (Quinpirole + SCH23390), QK (Quinpirole + SKF38393), SH (Sulpiride + SCH23390), and SK (Sulpiride + SKF38393). Additionally, they were done in a different apparatus and by a different experimenter due to changes in laboratory personnel and location. The amount of coupling overall was higher in this later period, and we therefore compared the results with controls from this same period.
We plotted the average intensity of the stained amacrine cells as a function of distance from the injected cell for each of the four groups. Fig. 7 shows these functions normalized to 1. For both of the D2 antagonist groups, SK and SH, the rate of decline within the ganglion cell dendritic field (distance ≤1 ganglion cell radius) is quite shallow. This is consistent with the results shown in Fig. 5B and the hypothesis that D2 antagonists increase diffusion from the ganglion cells by opening their hemichannels. The D2 agonist groups, QK and QH, both showed a more rapid rate of decline within the dendritic field of the ganglion cell.
Fig. 7.

The distribution of Neurobiotin in AC1 amacrine cells after injection into OFF α ganglion cells in the presence of combinations of D1 and D2 agonists and antagonists, all at 50 μM. The four groups were designated QH (Quinpirole + SCH23390), QK (Quinpirole + SKF38393), SH (Sulpiride + SCH23390), and SK (Sulpiride + SKF38393). Sulpiride, a D2 antagonist, increases diffusion to AC1 amacrine cells directly coupled to the ganglion cell and thereby stains AC1 cells within its dendritic field nearly equally (SK, SH curves). Quinpirole, a D2 agonist, reduces diffusion through this pathway, causing a steeper decline in staining intensity within the ganglion cell dendritic field (QK, QH curves). SCH23390, a D1 antagonist, increases diffusion between coupled AC1 amacrine cells, causing a shallower rate of decline away from the ganglion cell (QH, SH curves). SKF38393, a D1 agonist, decreases diffusion between coupled AC1 amacrine cells, causing a steeper rate of decline away from the ganglion cell (QK, SK curves). In fact, the decline of the QK and SK curves beyond the ganglion cell dendritic field is similar to the measured direct coupling rate of amacrine cells to the ganglion cell due to their declining area of gap junctional contact (solid lines), indicating very little direct AC1-AC1 coupling in these groups. By contrast, the rate of decline over this region in the QH and SH groups is more gradual and similar in magnitude between the two groups.
In contrast, the rate of decline beyond the ganglion cell dendritic field was sensitive to D1, but not D2 analogs. Both the D1 antagonist groups, QH and SH, had a distinctly shallower rate of decline than the D1 agonist groups. The rate of decline was similar between the groups exposed to SCH23390 (dashed lines) and shallower than the groups exposed to SKF38393. These latter groups are fit by the solid lines, which are of the same slope as the overall decline in gap junctional area we measured (Fig. 4D). This suggests that the gap junctions between AC1 amacrine cells were closed nearly to the maximum possible extent.
Discussion
Quantitative analysis of the patterns of tracer localization resulting from Neurobiotin injection into OFF α ganglion cells revealed several important features of the coupled network of OFF α ganglion cells and two populations of amacrine cells. (1) The brighter of the two populations of amacrine cells, AC1, is the best coupled to the ganglion cells. AC2 amacrine cells are coupled to the OFF α ganglion cell approximately 6% as effectively as the AC1 cells. (2) AC1 amacrine cells are also well coupled to one another. (3) The amount of tracer found in coupled ganglion cells is greater than that predicted by unrestricted movement from the amacrine cells to the ganglion cells; therefore a direct coupling pathway between the ganglion cells is present. (4) The various coupling pathways are differentially modulated by dopamine, such that phosphorylation of the AC1 amacrine cell channels leads to a decrease in coupling, while phosphorylation of the ganglion-ganglion cell channels leads to an increase in coupling. (5) Modulation of OFF α ganglion cell gap junction occurs via a cAMP-dependent pathway initiated by a D2-like dopamine receptor. (6) Modulation of AC1 hemichannels occurs via a cAMP-dependent pathway initiated by a D1-like receptor. (7) Gap junctional channels between AC1 amacrine cells and OFF α ganglion cells are likely comprised of one hemichannel each of the AC1 and ganglion cell types, such that coupling is independently and often differentially modulated on each side of the channel. (8) We measured the release of endogenous dopamine from a rabbit eyecup preparation during the day and in total darkness, where dopamine release persisted. Light increased the rate of dopamine release by approximately 5% for each tenfold increase of intensity, up to a maximum of 66% more release than under fully dark adapted conditions.
Dopamine release
There was a basal release of endogenous dopamine from the dark-adapted rabbit retina in total darkness, approximately 2 pmol/min. A recent study of dopamine release from an isolated rabbit retina preparation found a resting rate of 0.22 pmol/min/retina, approximately 10-fold lower than the value reported here (Neal et al., 2003). Two possible explanations for the higher value detected in our study were the more intact preparation and the higher concentration of nomifensine in the superfusate
Endogenous dopamine was also released from the rabbit retina under dim, red light, and because rabbits do not have long wavelength sensitive cones, this stimulus was probably equivalent to darkness (Godley & Wurtman, 1988). Endogenous dopamine is also released from retinas of Xenopus (Boatright et al., 1989, 1994; Witkovsky et al., 1993), rats (Gibson, 1990, 1992), and macaques (Boelen et al., 1998) in darkness. Retinal dopamine turns over in darkness (Parkinson & Rando, 1983), and 0.5 to 1% of the preloaded tritiated dopamine is released per minute in darkness (Bauer et al., 1980). It is possible that the release of dopamine in darkness would have been lower if measured during the night because a circadian rhythm in dopamine metabolism has been observed in mice (Nir et al., 2000), and the same may be true in rabbits.
In the present study, maximal stimulation with light increased the basal rate of dopamine release from rabbit retina by 66%. The increase in the rate of tritiated dopamine release from rabbit retina by light stimulation is also modest (Bauer et al., 1980). The effects of light stimulation are also relatively small in other studies of endogenous dopamine release from mammalian retinas. A steady, photopic stimulus increased dopamine release from rabbit retina by 60% (Godley & Wurtman, 1988). A similar stimulus produced a 30% increase in dopamine release from the rat retina (Gibson, 1990), and a 3 Hz flashing light on a steady, photopic background increased dopamine release from macaque retina approximately twofold (Boelen et al., 1998). The changes in average extracellular dopamine levels in our studies in retina are similar to those observed with natural stimulation elsewhere in the central nervous system in microdialysis studies (reviewed by Wightman & Robinson, 2002).
In the present study, the rate of dopamine release increased by approximately 5% for each 10-fold increase in the mean intensity of the stimulus over a 7 log unit range from levels below absolute threshold for the rabbit (DeVries & Baylor, 1995) to low photopic levels. In rats, there is also a linear region in the curve describing the relationship of light intensity with DOPA accumulation and dopamine depletion, two indirect measures of dopamine release from the retina (Brainard & Morgan, 1987). In chickens, a similar log-linear relationship has been observed between light intensity and vitreal DOPAC accumulation, another indirect measure of retinal dopamine release (Megaw et al., 1998, 2001). However, because the stimuli were white lights in these other studies, it is difficult to compare the intensity of their stimuli directly with ours.
Probable junctional pathways in the OFF α ganglion cell network
Because there are three types of cell labeled by Neurobiotin injection into OFF α ganglion cells, there are six possible sites of gap junctions in the network (Fig. 4A). The presence of gap junctions between ganglion cells and the brighter population of amacrine cells, AC1 cells, is virtually certain, as brightness measurements indicate that this is the primary recipient of tracer from the injected ganglion cell.
The presence of direct gap junctions between α ganglion cells has been demonstrated in rat (Hidaka et al., 2002, 2004). The rabbit OFF α cells appear similar, as the existence of direct ganglion-ganglion gap junctions is suggested by the presence of short latency correlated spikes between pairs of OFF α ganglion cells (DeVries, 1999; Hu & Bloomfield, 2003), the occasional finding in this study of coupled ganglion cells brighter than any coupled amacrine cell, and the existence of a diffusion coefficient specific for direct ganglion-ganglion gap junctions that can be differentially modulated.
It also appears that there are gap junctions between the two types of amacrine cells. In some instances when AC1 amacrine cells were targeted by Popro 1 injection into OFF α ganglion cells and then filled with Neurobiotin, somata of amacrine cells that were distinctly different from AC1 cells were lightly labeled. These resembled AC2 amacrine cells in size and shape.
Parameter estimation in the OFF α ganglion cell network
Parameter estimation in the OFF α ganglion cell is a difficult task for several reasons. First, the relative volumes of the individual cell types are unknown and difficult to estimate. We made no correction for volume and therefore the coupling rates calculated are not absolute. Xia and Mills (2004) systematically examined the effect of different volume ratios on coupling rates and found that changes in the diffusion coefficients with modulation were not significantly affected by this limitation. Despite the dependence on volume of the absolute diffusion coefficients, the relative amounts by which they changed due to modulation were unaffected. We incorporated similar checks into the models used here with the same results. We further examined the suitability of the model in estimating kGG by changing the rate of decline of gap junctional contacts between ganglion and amacrine cells from that measured. While large changes in the slope of this function led to large changes in the absolute value of kGG, changes in the relative values of kGG across the treatments were minor. This is because the kGG coefficient is altered in all the groups to compensate for the change in flux due to the changes in gap junctional area. As this was consistent across groups, conclusions based on relative changes in kGG remained valid despite large changes in the fixed parameters.
A second problem was that, in a network of coupled cells of the same type, each neighboring pair yields an equivalent estimate of the coupling rate between cells of that type, whereas, in the OFF α ganglion cell network, the injected ganglion cell is the only ganglion cell which can be used to calculate kGA. There was little evidence, however, that the injected cell in other homologous networks we have measured previously was a poorer estimate of the overall coupling rate than any other cell in that homologous network (Mills & Massey, 1998; Xia & Mills, 2004).
Finally, coupling between ganglion cells, kGG, is derivative; it requires prior estimation of kGA and kAA to derive a prediction of coupled ganglion cell intensity. Nevertheless, the results obtained from modeling kGG in response to the pharmacological manipulations were consistent with and extend those obtained from the more direct measures.
Phosphorylation state of the ganglion cell gap junctions
Most gap junctions are closed by phosphorylation, but junctions from some connexin types are instead opened by phosphorylation (e.g., Moreno et al., 1994). There is precedent in the retina for the opening of gap junctions by phosphorylation. Mangel (2001) found that rod/cone coupling measured in fish horizontal cells during subjective night was increased by pharmacological agents that increase PKA phosphorylation in photoreceptors. Krizaj et al. (1998) found, on the other hand, that quinpirole increased coupling in recordings from Xenopus rods, as if this D2 agonist opened the channels by decreasing channel phosphorylation. We investigated the effects of phosphorylation using 25 nM okadaic acid, a phosphatase inhibitor in the superfusate. The coupling rates calculated using okadaic acid suggested that kGG was increased by phosphorylation, while kAA was decreased, suggesting that the ganglion-amacrine cell gap junctions are likely to be heterotypic and modulated differentially on each side of the channel.
Regulation of gap junctional channels in the OFF α ganglion cell network
Using our measurement techniques and parameter estimation, we confirmed and extended the conclusions of Hu and Bloomfield (2000, 2003) by identifying the sites of action of dopamine. The large patch of amacrine cells by Hu and Bloomfield (2003) using dark-adapted conditions suggests that the amacrine cells are relatively well coupled in this state. This finding suggests that D1 antagonists reproduce the level of amacrine cell coupling in the dark-adapted state. Presumably, the dopamine levels are insufficient to activate D1 receptors in darkness, but activation of D1 receptors increases with increasing background intensity. Hu and Bloomfield (2000) also reported that stimulation with a D2 dopamine antagonist dramatically increased the number and intensity of both coupled ganglion and amacrine cells. Our results suggest that the staining increase in both cell types produced by the D2 antagonists was a result of increases in kGA.
Because gap junctions in the OFF α ganglion cell and the AC1 amacrine cells are differentially regulated, it is possible to predict the effects of dopamine on gap junctional coupling in this network. When dopamine levels are at a minimum, such that neither D1 nor D2 receptors are stimulated, the channels in the AC1 are relatively unphosphorylated and hence more permeant than in their minimally open state. The channels in the ganglion cell are relatively phosphorylated due to a lack of D2 stimulation. They will also be open as a result of phosphorylation. The channels connecting the ganglion and AC1 cells will also be open, as both hemichannels are in this state and so the network is maximally coupled. If there is circadian modulation of dopamine metabolism in rabbits, as there is in mice (Nir et al., 2000), then this state would be achieved at night under dark-adapted conditions.
We measured a steady rate of dopamine release from dark-adapted retinas during the day. If D2 receptors were activated first as dopamine levels increase, then their inhibition of adenylate cyclase will lead to a decrease in phosphorylation of the ganglion cell channels and thereby lead to increased closure of the ganglion-ganglion channels. Ganglion-amacrine gap junctions would also be closed, though to a lesser extent, because there is only a single D2-sensitive hemichannel. D2 activation would therefore lead to ganglion cells which are uncoupled from one another and also reduce coupling to the AC1 population.
As dopamine levels increase with higher background intensities so that D1 receptors are also activated, PKA would be activated and phosphorylate the AC1 channels. This will close these channels, most effectively at AC1-AC1 channels, where there are two independent hemichannels, but also at the AC1-ganglion cell channels, where there is only one. The AC1 cells are then effectively uncoupled with respect to one another and from the ganglion cells.
We did not find evidence for modulation of coupling by D1 analogs on the ganglion cells or D2 analogs on the amacrine cells. However, the possibility remains that these receptors are present, but not involved in regulation of gap junctional conductance. For example, D1 receptors influence ganglion cell excitability (Vaquero et al., 2001; Hayashida & Ishida, 2004).
Functional considerations
There was no indication of a U-shaped function of dopamine release with stimulus intensity. Instead, dopamine release increased very gradually and monotonically as the stimulus intensity was increased. The activity of the dopaminergic neurons in the rabbit retina underlying these responses may be predicted from a recent study in mouse retina. The cells in the intact mouse retina fire bursts of action potentials in darkness, and there is a great deal of variability in both the firing rates and bursting characteristics. The responses of dopaminergic neurons in mice to photopic light stimuli also varied. One set had transient responses at light onset, another set had sustained responses at light onset, and a third set was unresponsive to light, continuing to fire bursts of action potentials as they had in darkness (Zhang et al., 2007). If dopaminergic neurons in the rabbit retina respond similarly, the spontaneously active cells would account for the dopamine release we observed in darkness, and a subset of dopaminergic neurons would remain spontaneously active under all of our stimulus conditions. The additional dopamine release in response to slowly varying, sinusoidal stimuli would be mediated primarily by the dopaminergic cells with sustained ON responses, and the responses of the cells with transient ON responses would be added to those when the flashing stimulus was superimposed on a photopic background.
A second interesting finding in these experiments is the existence of a gap junctional channel from hemichannels that are modulated in opposite directions in response to phosphorylation, which may seem counterintuitive. Fig. 8 uses Michaelis-Menten curves relating open probability to effector concentration to show a possible consequence of this complex relationship between modulator concentration and open probability. The three curves reflect the relative open probability of each type of channel, as calculated by multiplying the open probability of each of the types of hemichannel involved. The differences in dopamine receptor type and the opposite gating shift in response to PKA phosphorylation in these coupled cells, OFF α ganglion cells and AC1 amacrine cells combine to produce a multiphase response to dopamine concentration. In the dark, where dopamine levels are minimal, both types of hemichannels may be relatively open. As dopamine increases with background light, activation of D2 receptors initially closes channels between pairs of ganglion cells and, to a lesser extent, the ganglion-amacrine cell channels; activation of D1 receptors accelerates the closure of the ganglion-amacrine cell channels and begins uncoupling the amacrine cells as well.
Fig. 8.
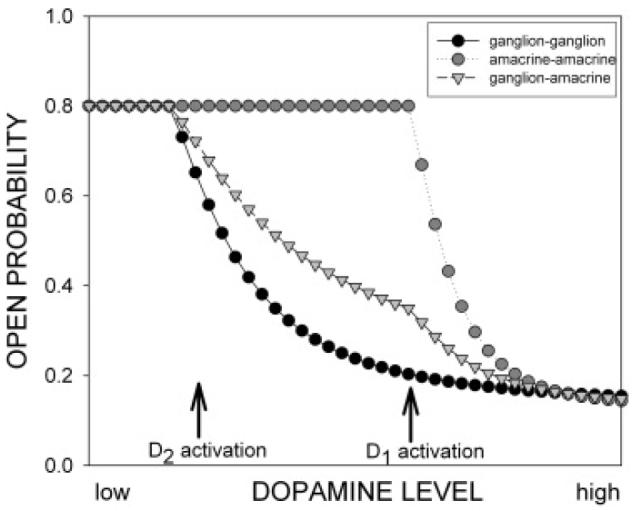
The differences in dopamine receptor type and the opposite gating shift in response to PKA phosphorylation in these coupled cells, OFF α ganglion cells and AC1 amacrine cells may produce a multiphasic response as a function of dopamine concentration. These theoretical curves were obtained by constructing a dose-response curve for closure of the hemichannels. The threshold response for ganglion cell hemichannels begins with D2 activation, while the responses of AC1 hemichannels occur with D1 activation. The open probability of the homologous channels was calculated as the square of the hemichannel open probability, while the ganglion-AC1 channel open probability was calculated as the product of the ganglion and AC1 hemichannel probabilities. In the dark adapted state at night, where dopamine levels are minimal, both types of hemichannels may be relatively open. As dopamine levels increase, according to the circadian clock and background light, activation of D2 receptors initially closes channels between pairs of ganglion cells and, to a lesser extent, the ganglion-amacrine cell channels. At higher light intensities, activation of D1 receptors accelerates the closure of the ganglion-amacrine cell channels and begins uncoupling the amacrine cells as well.
Conclusions
The network of OFF α ganglion cells and their coupled amacrine cells shows some unexpected features. Our data suggest that there are heterotypic gap junctions between the ganglion cell and one type of amacrine cell, with differential modulation of the two different hemichannels. This is the first naturally-occurring connexon to be shown to contain a hemichannel closed by phosphorylation on one side and opened by phosphorylation on the other. Differential modulation of the two hemichannels that comprise the heterologous gap junction is accomplished by employing different dopamine receptors and also opposite responses of the two hemichannels to PKA phosphorylation. Hu and Bloomfield (2003) showed that these circuit elements underlie synchronous firing of neighboring ganglion cells in dark-adapted retinas. Our results suggest that light adaptation alters the coupling properties of the network, so that the different types of coupled neurons are uncoupled at different light levels. Reductions in kGA, which serve to uncouple the AC1 network from the ganglion cells, would reduce the overall drive to the AC1 network, and uncoupling of the AC1-AC1 cells would reduce the spatial extent of their effect. Thus, dopamine would regulate both the strength and spatial extent of inhibition mediated by the coupled amacrine cells as well as the degree of synchronous firing of the ganglion cells.
Acknowledgments
This research was supported by NEI grants EY10121 (SLM), EY06472 (DWM), EY06671 (LJF), core grant EY10608 from the National Eye Institute, NS38310 (DWM) and NS36362 (MER) from the National Institute of Neurological Disorders and Stroke, an unrestricted award to the Department of Ophthalmology and Visual Science from Research to Prevent Blindness, postdoctoral fellowship PD01032 (SIF) from Fight for Sight and a grant from the Robert J. Kleberg, Jr. and Helen C. Kleberg Foundation (DWM). We wish to thank Dr. Paul Witkovsky for his encouragement in pursuing these experiments and Mei Lan Chao for excellent technical assistance in the HPLC analysis of dopamine.
References
- Ackert JM, Wu SH, Lee JC, Abrams J, Hu EH, Perlman I, Bloomfield SA. Light-induced changes in spike synchronization between coupled ON direction selective ganglion cells in the mammalian retina. Journal of Neuroscience. 2006;26:4206–4215. doi: 10.1523/JNEUROSCI.0496-06.2006. [DOI] [PMC free article] [PubMed] [Google Scholar]
- Bauer B, Ehinger B, Aberg L. [3H]-dopamine release from the rabbit retina. Albrecht Von Graefes Archive for Clinical and Experimental Ophthalmology. 1980;215:71–78. doi: 10.1007/BF00414464. [DOI] [PubMed] [Google Scholar]
- Bloomfield SA, Völgyi B. Function and plasticity of homologous coupling between AII amacrine cells. Vision Research. 2004;44:3297–3306. doi: 10.1016/j.visres.2004.07.012. [DOI] [PubMed] [Google Scholar]
- Bloomfield SA, Xin D, Osborne T. Light-induced modulation of coupling between AII amacrine cells in the rabbit retina. Visual Neuroscience. 1997;14:565–576. doi: 10.1017/s0952523800012220. [DOI] [PubMed] [Google Scholar]
- Boatright JH, Hoel MJ, Iuvone PM. Stimulation of endogenous dopamine release and metabolism in amphibian retina by light- and K+-evoked depolarization. Brain Research. 1989;482:164–168. doi: 10.1016/0006-8993(89)90555-6. [DOI] [PubMed] [Google Scholar]
- Boatright JH, Rubim NM, Iuvone PM. Regulation of endogenous dopamine release in amphibian retina by gamma-aminobutyric acid and glycine. Visual Neuroscience. 1994;11:1003–1012. doi: 10.1017/s095252380000393x. [DOI] [PubMed] [Google Scholar]
- Boelen MK, Boelen MG, Marshak DW. Light-stimulated release of dopamine from primate retina is blocked by 1-2-amino-4-phosphonobutyric acid (APB) Visual Neuroscience. 1998;15:97–103. doi: 10.1017/s0952523898151040. [DOI] [PubMed] [Google Scholar]
- Brainard GC, Morgan WW. Light-induced stimulation of retinal dopamine: A dose-response relationship. Brain Research. 1987;424:199–203. doi: 10.1016/0006-8993(87)91211-x. [DOI] [PubMed] [Google Scholar]
- Dacey DM, Brace S. A coupled network for parasol but not midget ganglion cells in the primate retina. Visual Neuroscience. 1992;9:279–290. doi: 10.1017/s0952523800010695. [DOI] [PubMed] [Google Scholar]
- DeMonasterio FM. Spectral interactions in horizontal and ganglion cells of isolated and arterially-perfused rabbit retina. Brain Research. 1978;150:239–258. doi: 10.1016/0006-8993(78)90278-0. [DOI] [PubMed] [Google Scholar]
- DeVries S. Correlated firing in rabbit retinal ganglion cells. Journal of Neurophysiology. 1999;81:908–920. doi: 10.1152/jn.1999.81.2.908. [DOI] [PubMed] [Google Scholar]
- DeVries SH, Baylor DA. An alternative pathway for signal flow from rod photoreceptors to ganglion cells in mammalian retina. Proceedings of the National Academy of Sciences USA. 1995;92:10658–10662. doi: 10.1073/pnas.92.23.10658. [DOI] [PMC free article] [PubMed] [Google Scholar]
- DeVries S, Schwartz EA. Modulation of an electrical synapse between solitary pairs of catfish horizontal cells by dopamine and second messengers. Journal of Physiology. 1989;414:351–375. doi: 10.1113/jphysiol.1989.sp017692. [DOI] [PMC free article] [PubMed] [Google Scholar]
- Gibson CJ. A simple perfusion system for measuring endogenous retinal dopamine release. Journal of Neuroscience Methods. 1990;32:75–79. doi: 10.1016/0165-0270(90)90074-p. [DOI] [PubMed] [Google Scholar]
- Gibson CJ. Tyrosine augments dopamine release in stimulated rat retina. Brain Research. 1992;595:201–205. doi: 10.1016/0006-8993(92)91050-o. [DOI] [PubMed] [Google Scholar]
- Godley BF, Wurtman RJ. Release of endogenous dopamine from the superfused rabbit retina in vitro: Effect of light stimulation. Brain Research. 1988;452:393–395. doi: 10.1016/0006-8993(88)90046-7. [DOI] [PubMed] [Google Scholar]
- Hampson ECGM, Vaney DI, Weiler R. Dopaminergic modulation of gap junction permeability between amacrine cells in mammalian retina. Journal of Neuroscience. 1992;12:4911–4922. doi: 10.1523/JNEUROSCI.12-12-04911.1992. [DOI] [PMC free article] [PubMed] [Google Scholar]
- Hayashida Y, Ishida AT. Dopamine receptor activation can reduce voltage-gated Na+ current by modulating both entry into and recovery from inactivation. Journal of Neurophysiology. 2004;92:3134–3141. doi: 10.1152/jn.00526.2004. [DOI] [PMC free article] [PubMed] [Google Scholar]
- Hidaka S, Kato T, Miyachi E. Expression of gap junction connexin36 in adult rat retinal ganglion cells. Journal of Integrative Neuroscience. 2002;1:3–22. doi: 10.1142/s0219635202000025. [DOI] [PubMed] [Google Scholar]
- Hidaka S, Akahori Y, Kurosawa Y. Dendrodendritic electrical synapses between mammalian retinal ganglion cells. Journal of Neuroscience. 2004;24:10553–10567. doi: 10.1523/JNEUROSCI.3319-04.2004. [DOI] [PMC free article] [PubMed] [Google Scholar]
- Hoshi H, O'Brien J, Mills SL. A novel fluorescent tracer for visualizing coupled cells in neural circuits of living tissue. Journal of Histochemistry and Cytochemistry. 2006;54:1169–1176. doi: 10.1369/jhc.6A6935.2006. [DOI] [PMC free article] [PubMed] [Google Scholar]
- Hu E, Bloomfield SA. Modulation of the tracer coupling pattern of alpha ganglion cells in the rabbit retina. Investigative Ophthalmology & Visual Science. 2000;41:S936. [Google Scholar]
- Hu E, Bloomfield SA. Gap junctional coupling underlies the short-latency spike synchrony of retinal alpha ganglion cells. Journal of Neuroscience. 2003;23:6768–6777. doi: 10.1523/JNEUROSCI.23-17-06768.2003. [DOI] [PMC free article] [PubMed] [Google Scholar]
- Jacoby R, Stafford D, Kouyama N, Marshak D. Synaptic inputs to ON parasol ganglion cells in the primate retina. Journal of Neuroscience. 1996;16:8041–8056. doi: 10.1523/JNEUROSCI.16-24-08041.1996. [DOI] [PMC free article] [PubMed] [Google Scholar]
- Krizaj D, Gabriel R, Owen WG, Witkovsky P. Dopamine D2 receptor-mediated modulation of rod-cone coupling in the Xenopus retina. Journal of Comparative Neurology. 1998;398:529–538. [PMC free article] [PubMed] [Google Scholar]
- Mangel SC. Circadian clock regulation of neuronal light responses in the vertebrate retina. Progress in Brain Research. 2001;131:505–518. doi: 10.1016/s0079-6123(01)31040-3. [DOI] [PubMed] [Google Scholar]
- Massey SC, Redburn DA. Tonic gamma-aminobutyric acid-mediated inhibition of cholinergic amacrine cells in rabbit retina. Journal of Neuroscience. 1982;2:633–643. doi: 10.1523/JNEUROSCI.02-11-01633.1982. [DOI] [PMC free article] [PubMed] [Google Scholar]
- Mastronarde DN. Correlated firing of cat retinal ganglion cells. I. Spontaneously active inputs to X- and Y-cells. Journal of Neurophysiology. 1983a;49:303–324. doi: 10.1152/jn.1983.49.2.303. [DOI] [PubMed] [Google Scholar]
- Mastronarde DN. Correlated firing of cat retinal ganglion cells. II. Responses of X- and Y-cells to single quantal events. Journal of Neurophysiology. 1983b;49:325–349. doi: 10.1152/jn.1983.49.2.325. [DOI] [PubMed] [Google Scholar]
- McMahon DG, Knapp AG, Dowling JE. Horizontal cell gap junctions: Single-channel conductance and modulation by dopamine. Proceedings of the National Academy of Science USA. 1989;86:7639–7643. doi: 10.1073/pnas.86.19.7639. [DOI] [PMC free article] [PubMed] [Google Scholar]
- Megaw PL, Morgan IG, Boelen MK. Complex dependence of dopamine release on light in chicken retina. Proceedings of the Australian Neuroscience Society. 1998;8:175. [Google Scholar]
- Megaw P, Morgan I, Boelen M. Vitreal dihydroxyphenylacetic acid (DOPAC) as an index of retinal dopamine release. Journal of Neurochemistry. 2001;76:1636–1644. doi: 10.1046/j.1471-4159.2001.00145.x. [DOI] [PubMed] [Google Scholar]
- Meister M, Lagnado L, Baylor DA. Concerted signaling by retinal ganglion cells. Science. 1995;270:1207–1210. doi: 10.1126/science.270.5239.1207. [DOI] [PubMed] [Google Scholar]
- Mills SL, Massey SC. Labeling and distribution of AII amacrine cells in the rabbit retina. Journal of Comparative Neurology. 1991;304:491–501. doi: 10.1002/cne.903040312. [DOI] [PubMed] [Google Scholar]
- Mills SL, Massey SC. Differential properties of two gap junctional pathways made by AII amacrine cells. Nature. 1995;377:734–737. doi: 10.1038/377734a0. [DOI] [PubMed] [Google Scholar]
- Mills SL, Massey SC. The kinetics of tracer movement through homologous gap junctions in the rabbit retina. Visual Neuroscience. 1998;15:765–777. doi: 10.1017/s0952523898154159. [DOI] [PMC free article] [PubMed] [Google Scholar]
- Moreno AP, Saez JC, Fishman GI, Spray DC. Human connexin43 gap junction channels: Regulation of unitary conductances by phosphorylation. Circulation Research. 1994;74:1050–1057. doi: 10.1161/01.res.74.6.1050. [DOI] [PubMed] [Google Scholar]
- Neal M, Cunningham J, Lever I, Pezet S, Malcangio M. Mechanism by which brain-derived neurotrophic factor increases dopamine release from the rabbit retina. Investigative Ophthalmology and Visual Science. 2003;44:791–798. doi: 10.1167/iovs.02-0557. [DOI] [PubMed] [Google Scholar]
- Nir I, Haque R, Iuvone PM. Diurnal metabolism of dopamine in the mouse retina. Brain Research. 2000;870:118–125. doi: 10.1016/s0006-8993(00)02409-4. [DOI] [PubMed] [Google Scholar]
- Parkinson D, Rando RR. Effect of light on dopamine turnover and metabolism in rabbit retina. Investigative Ophthalmology & Visual Sciences. 1983;24:84–88. [PubMed] [Google Scholar]
- Peichl L, Ott H, Boycott BB. Alpha ganglion cells in mammalian retinae. Proceedings of the Royal Society of London B Biological Sciences. 1987;231:169–197. doi: 10.1098/rspb.1987.0040. [DOI] [PubMed] [Google Scholar]
- Piccolino M, Neyton J, Gerschenfeld HM. Decrease of gap junction permeability induced by dopamine and cyclic adenosine 3′:5′-monophosphate in horizontal cells of turtle retina. Journal of Neuroscience. 1984;4:2477–2488. doi: 10.1523/JNEUROSCI.04-10-02477.1984. [DOI] [PMC free article] [PubMed] [Google Scholar]
- Raggi MA, Sabbioni C, Casamenti G, Gerra G, Calonghi N, Masotti L. Determination of catecholamines in human plasma by high-performance liquid chromotography with electrochemical detection. Journal of Chromatography B. 1999;730:201–211. doi: 10.1016/s0378-4347(99)00213-3. [DOI] [PubMed] [Google Scholar]
- Robson JG, Frishman LJ. Response linearity and dynamics of the cat retina: The bipolar cell component of the dark-adapted ERG. Visual Neuroscience. 1995;12:837–850. doi: 10.1017/s0952523800009408. [DOI] [PubMed] [Google Scholar]
- Schubert T, Maxeiner S, Kruger O, Willecke K, Weiler R. Connexin45 mediates gap junctional coupling of bistratified ganglion cells in the mouse retina. Journal of Comparative Neurology. 2005a;490:29–39. doi: 10.1002/cne.20621. [DOI] [PubMed] [Google Scholar]
- Schubert T, Degen J, Willecke K, Hormuzdi SG, Monyer H, Weiler R. Connexin36 mediates gap junctional coupling of alpha-ganglion cells in mouse retina. Journal of Comparative Neurology. 2005b;485:191–201. doi: 10.1002/cne.20510. [DOI] [PubMed] [Google Scholar]
- Teranishi T, Negishi K, Kato S. Regulatory effect of dopamine on spatial properties of horizontal cells in carp retina. Journal of Neuroscience. 1984;4:1271–1280. doi: 10.1523/JNEUROSCI.04-05-01271.1984. [DOI] [PMC free article] [PubMed] [Google Scholar]
- Vaney DI. Many diverse types of retinal neurons show tracer coupling when injected with biocytin or Neurobiotin. Journal of Neuroscience Letters. 1991;125:187–190. doi: 10.1016/0304-3940(91)90024-n. [DOI] [PubMed] [Google Scholar]
- Vaquero CF, Pignatelli A, Partida GJ, Ishida AT. A dopamine- and protein kinase A-dependent mechanism for network adaptation in retinal ganglion cells. Journal of Neuroscience. 2001;21:8624–8635. doi: 10.1523/JNEUROSCI.21-21-08624.2001. [DOI] [PMC free article] [PubMed] [Google Scholar]
- Völgyi B, Abrams J, Paul DL, Bloomfield SA. Morphology and tracer coupling pattern of alpha ganglion cells in the mouse retina. Journal of Comparative Neurology. 2005;492:66–77. doi: 10.1002/cne.20700. [DOI] [PMC free article] [PubMed] [Google Scholar]
- Wightman RM, Robinson DL. Transient changes in mesolimbic dopamine and their association with ‘reward’. Journal of Neurochemistry. 2002;82:721–735. doi: 10.1046/j.1471-4159.2002.01005.x. [DOI] [PubMed] [Google Scholar]
- Witkovsky P, Nicholson C, Rice ME, Bohmaker K, Meller E. Extracellular dopamine concentration in the retina of the clawed frog, Xenopus laevis. Proceedings of the National Academy of Sciences USA. 1993;90:5667–5671. doi: 10.1073/pnas.90.12.5667. [DOI] [PMC free article] [PubMed] [Google Scholar]
- Xia X-B, Mills SL. Gap junctional regulatory mechanisms in the AII amacrine cell of the rabbit retina. Visual Neuroscience. 2004;21:791–805. doi: 10.1017/S0952523804045122. [DOI] [PMC free article] [PubMed] [Google Scholar]
- Xin D, Bloomfield SA. Tracer coupling pattern of amacrine and ganglion cells in the rabbit retina. Journal of Comparative Neurology. 1997;383:512–528. doi: 10.1002/(sici)1096-9861(19970714)383:4<512::aid-cne8>3.0.co;2-5. [DOI] [PubMed] [Google Scholar]
- Xin D, Bloomfield SA. Dark- and light-induced changes in coupling between horizontal cells in mammalian retina. Journal of Comparative Neurology. 1999;405:75–87. doi: 10.1002/(sici)1096-9861(19990301)405:1<75::aid-cne6>3.0.co;2-d. [DOI] [PubMed] [Google Scholar]
- Young HM, Vaney DI. Rod-signal interneurons in the rabbit retina: 1. Rod bipolar cells. Journal of Comparative Neurology. 1991;310:139–153. doi: 10.1002/cne.903100202. [DOI] [PubMed] [Google Scholar]
- Zhang DQ, Zhou TR, McMahon DG. Functional heterogeneity of retinal dopaminergic neurons underlying their multiple roles in vision. Journal of Neuroscience. 2007;27:692–699. doi: 10.1523/JNEUROSCI.4478-06.2007. [DOI] [PMC free article] [PubMed] [Google Scholar]