

Abstract
Growth factors can cause cells to proliferate, differentiate, survive, or die. Distinguishing between these responses is difficult in multicellular, multiparameter systems. Yet this is essential to understand the impact on cells like hematopoietic stem cells (HSCs), which have strict and still poorly understood growth factor requirements. Single cell plating in serum-free medium allows direct assessment of growth factor responses. The range of tested factors can be expanded if the cells are protected from growth factor deprivation–induced apoptosis. BCL-2 is overexpressed in HSCs of H2K-BCL-2 transgenic mice, protecting them from many apoptotic stimuli. The response of single wild-type and transgenic HSCs to stimulations with individual factors was tested. Surprisingly, we find that high level BCL-2 expression does not prevent rapid death under serum-free conditions, even though it does in the presence of serum. We also find that transgenic, but not wild-type cells, survive and proliferate rapidly in response to steel factor (Kit ligand). These studies show that two separate signals are necessary to prevent apoptosis in HSCs, and that Kit ligand by itself provides a strong proliferative stimulus to HSCs. However, the proliferative response does not result in self-renewal, but in differentiation to all known hematopoietic oligolineage progenitors.
Keywords: hematopoietic stem cell, transgenic mice, flow cytometry, stem cell factor, serum-free medium
Introduction
Hematopoietic stem cells (HSCs) in mice have been described using different surface marker combinations (for a review, see reference 1). Using monoclonal antibodies, all HSC activity in mouse bone marrow resides within Thy-1.1low, Sca-1pos, Linneg/low, and c-Kitpos cells 2 3 4. Although representing only ∼1/2,000 bone marrow cells, this is still a heterogeneous population. In the mouse, these cells can be divided by surface phenotype into cells that have long-term multilineage reconstitution potential and which can function for the lifetime of the animal (long-term HSCs [LT-HSCs]) and those that have only short-term multilineage reconstitution potential (short-term HSCs [ST-HSCs]), typically 8–12 wk in mice 5. LT-HSCs, ∼0.01–0.02% of bone marrow, are characterized by the total absence of lineage markers (Linneg), whereas cells with short-term reconstitution potential are characterized by low level staining of some of these markers (Linlow [5]). ST-HSCs are derived from LT-HSCs 6. The limit dilution titration (dose at which recipient animals are reconstituted by one cell on average) for both populations is ∼10 cells 5. This shows that these populations are (virtually) homogenous with respect to reconstitution activity, taking into account that only ∼10% of injected HSCs home to the bone marrow 7. It should be noted that HSC surface marker profiles can differ between strains 8, alleles 9, developmental stages 10, and activation stages 11 12. Most of the experiments described here compare a transgenic model with wild-type littermates. Transgenic HSCs cannot be assumed to display the same surface markers as wild-type mice. However, we have previously extensively characterized the HSCs in H2K-BCL-2 transgenic mice and found that they have the same surface markers as wild-type mice. Both LT-HSCs and ST-HSCs can be purified to the same degree, and their in vivo reconstitution potential is at least as good as that of their wild-type littermates 13.
HSCs are characterized by their ability to both self-renew and differentiate, and thus give rise to the various kinds of mature hematopoietic cells 14. Self-renewal is readily apparent in vivo. For example, the number of functional HSCs that can be isolated from mice after HSC transplantation clearly exceeds input numbers 6 15 16. Expansion under these conditions can be manipulated by coinjection of growth factors such as Kit ligand (Kitl) and IL-11 16. However, despite extensive efforts, methods to expand HSCs in vitro to an appreciable extent have to our knowledge not yet been reported 17. The characterization of multiple growth factors, stroma cell lines, and culture systems has failed to yield a culture system in which more than maintenance or possible minor expansions occur. This severely limits the use of HSCs for retroviral gene transfer experiments as well as for clinical use, especially when limited numbers of HSCs are available.
After cell division, HSCs are subject to three different cell fates: self-renewal, differentiation, and apoptosis 1 13. To expand HSCs (symmetric self-renewing divisions), the stimuli offered to the cells must not only stimulate proliferation, but also prevent differentiation and apoptosis. Blocking of apoptosis is not enough to maintain HSCs. Overexpression of Bcl-2 prevents apoptosis in hematopoietic cells 18, but does not prevent spontaneous differentiation in a progenitor cell line, even in the absence of growth factors 19. Overexpression of BCL-2 in HSCs in vivo in a transgenic mouse model 13 20 results in protection from apoptosis, but only in a moderate (twofold) expansion, even though these HSCs outcompete wild-type HSCs after reconstitution 13. This model demonstrates that apoptosis is an important factor in the regulation of HSCs. However, BCL-2 overexpression is not sufficient for massive expansion of HSCs. The presence of other signals, presumably those regulating differentiation, as well as apoptosis that is not prevented by Bcl-2 overexpression, may account for this.
To obtain more insight into the functions of growth factors on HSCs, blocking of apoptosis versus stimulation of proliferation or differentiation, we have studied HSCs from H2K-BCL-2 transgenic mice, which overexpress BCL-2 13 20. Growth factor stimulations were studied using single cell platings in vitro, under serum-free conditions. This makes it possible to determine the response rate of individual cells, a method which has been used to study the symmetry of HSC divisions and the surface phenotype of daughter cells during initial divisions 21 22. We find that HSCs that are blocked in apoptosis by BCL-2 overexpression respond to several individually assayed growth factors (thrombopoietin [Tpo], IL-3, and Kitl) in a more pronounced way than wild-type HSCs. Most dramatic is the response to Kitl, which induces rapid proliferation in the majority of the plated transgenic, but not wild-type, cells. However, although single factor stimulation of HSCs overexpressing BCL-2 in vitro can lead to rapid proliferation, there is no evidence for expansion of cells with the HSC phenotype. Neither Kitl nor BCL-2 actively maintains the undifferentiated state of HSCs. The combination of H2K-BCL-2 transgenic HSCs and the culture conditions described here form a powerful tool to study HSC growth factor requirements. They are used here to demonstrate that HSCs depend on two signals to prevent apoptosis.
Materials and Methods
Transgenic Mice.
H2K-BCL-2 transgenic mice have been described 20. Transgenic status was determined by flow cytometric screening for human BCL-2 protein in peripheral blood cells. Mice from three independent founder lines (1038, 1043, and 1053) were used to prevent integration site–specific phenotypes from obscuring the results. The transgenic mice were backcrossed at least 10 times onto C57Bl/Ka Thy-1.1 mice. All mice were bred at the animal care facility at the Stanford University School of Medicine. Mice were maintained on acidified water (pH 2.5).
Tissue Culture.
One or two LT-HSCs (Thy-1.1lowLinnegSca-1posc-Kithigh) or ST-HSCs (Thy-1.1lowLinlowSca-1posc-Kithigh) derived by two successive sorts were deposited per well in 60-well Terasaki plates (Nunc) using the single cell deposition unit and Clone-cyt™ software (Becton Dickinson) on a modified FACS Vantage™. The wells contained 10 μl of serum-free medium (Xvivo15; BioWhittaker) supplemented with 5 × 10⁻⁵ M β-mercaptoethanol and experimentally added growth factors. The cells in each well were counted under an inverted microscope at regular intervals. Factors tested include IL-1 (5 ng/ml; GIBCO BRL), IL-2 (100 U/ml; Collaborative Research), IL-3 (300 ng/ml; Genzyme), IL-4, IL-6 (10 ng/ml; GIBCO BRL), IL-7 (30 ng/ml; Genzyme), IL-11 (25 ng/ml; Stem Cell Technologies), Kitl (30 ng/ml; R&D Systems), Flt3 ligand (Flt3-L, 30 ng/ml; R&D Systems), Tpo (100 ng/ml; Genzyme), G-CSF (100 ng/ml; Amgen), GM-CSF (10 ng/ml; Genzyme), TNF-α, TGF-β (100 ng/ml; R&D Systems), macrophage inflammatory protein (MIP)-1α (100 ng/ml; Genzyme), bone morphogenetic protein 4 (BMP-4) (100 ng/ml; R&D Systems), leukemia inhibitory factor (LIF, 104 U/ml; GIBCO BRL), oncostatin M (OSM, 250 ng/ml; R&D Systems), erythropoietin (Epo, 1 U/ml; Ortho), basic fibroblast growth factor (bFGF, 100 ng/ml; GIBCO BRL), epidermal growth factor (EGF, 100 ng/ml; R&D Systems), and vascular endothelial growth factor (VEGF)164 (40 ng/ml; R&D Systems). For some experiments (growth factor deprivation experiments) serum-containing medium (M5300; Stem Cell Technologies) was used.
Cytospin Staining and Photography.
Cells were collected on slides using a cytospin (Shandon) directly after sorting or after culture. The slides were air dried and stained with May-Grünwald (Fluka) for 3 min followed, after washing, by a 20-min incubation in Giemsa stain (Fluka), diluted 1:20 in water. Photographs were taken on Ektachrome slide film (100 ASA; Eastman Kodak Co.) using a Microphot FXA microscope (Nikon). Slides were digitized using a Coolscan III (Nikon). Representative cells were selected from digitized photographs using Adobe Photoshop® 4.0.1 and labeled using Deneba Canvas® 7.0.1 software run on Power Macintosh G3 and G4 computers.
Flow Cytometry.
Sorting of HSCs was modified from previously published protocols (see, for example, reference 20). In brief, bone marrow cells are stained with FITC-19XE5 (anti-Thy1.1), lineage cocktail, Texas red–E13-161-7 (anti–Sca-1), allophycocyanin (APC)-2B8 (anti–c-Kit), and biotin-3C11 (anti–c-Kit). The cells are enriched for c-Kit+ cells using MACS columns and streptavidin microbeads (Miltenyi Biotec). Enriched cells are sorted as described. The lineage cocktail consists of the following antibodies: KT31.1 (anti-CD3), GK1.5 (anti-CD4), 53-7.8 (anti-CD5), 53-6.7 (anti-CD8), 6B2 (anti-B220), Ter119 (anti-TER119), M1/70 (anti–Mac-1), and 8C5 (anti–Gr-1). They are used either directly conjugated to PE, or are visualized by secondary antibodies (anti–rat PE or anti–rat Cy5PE). Labeled cells were analyzed and sorted with a dual laser FACS Vantage™ (Becton Dickinson), made available through the FACS® shared user group at Stanford University. Flow cytometry data were analyzed using FACS®/Desk (Stanford University) or FlowJo (Treestar Inc.). Dead cells were excluded from analysis by their propidium iodide staining characteristics. Two parameter data are presented as 5% probability plots with outliers.
The rat antibodies 53-7.3 (anti-CD5), 53-6.7 (anti-CD8), Ter-119 (anti-erythro), GK1.5 (anti-CD4), KT31.1 (anti-CD3), 6B2 (anti-B220), M1/70 (anti–Mac-1), 8C5 (anti–GR-1), E13-161 (anti–Sca-1), 3C11 (anti–c-Kit), and 2B8 (anti–c-Kit) were prepared from the respective hybridoma clones, as were their conjugates. Secondary antibodies were obtained from Caltag. Avidin–Texas red was obtained from Cappel. Anti–human BCL-2 (clone 124) was purchased from Dako.
CFU–Spleen Assays.
The lethal preconditioning regimen for CFU–spleen (CFU-S) assays was 9.5 Gy total body irradiation, given in two doses with a 3-h interval using a 200-kV x-ray machine. Host mice, 8–12-wk-old C57Bl/Ka mice, were given antibiotic water (1.1 g/liter neomycin sulfate and 106 U/liter polymyxin B sulfate) after irradiation. Spleens were harvested at day 12 and colonies were counted after fixation in Tellesniczky fixative (75% ethanol, 3.75% acetic acid, and 7.5% formalin).
Results
Experimental Model to Test Growth Factor Responses of Single HSCs.
We have previously extensively characterized the HSCs present in H2K-BCL-2 transgenic mice. We have shown that these HSCs express the same surface markers as wild-type HSCs. Reconstitution experiments in vivo have demonstrated that HSCs isolated from transgenic mice behave similar to wild-type HSCs in that they reconstitute donors as efficiently as cells from wild-type mice, and short-term and long-term HSCs still behave as ST-HSCs and LT-HSCs. Transgenic HSCs express the transgene and are protected against apoptosis. H2K-BCL-2 transgenic mice have more (approximately twofold) HSCs than wild-type mice, and these HSCs cycle slower; that is, fewer transgenic HSCs than wild-type cells have >2n DNA (approximately twofold reduction) 13 20. Fig. 1 A shows in detail the extent to which H2K-BCL-2 transgenic LT-HSCs and ST-HSCs are protected from growth factor deprivation in the presence of serum.
Figure 1.
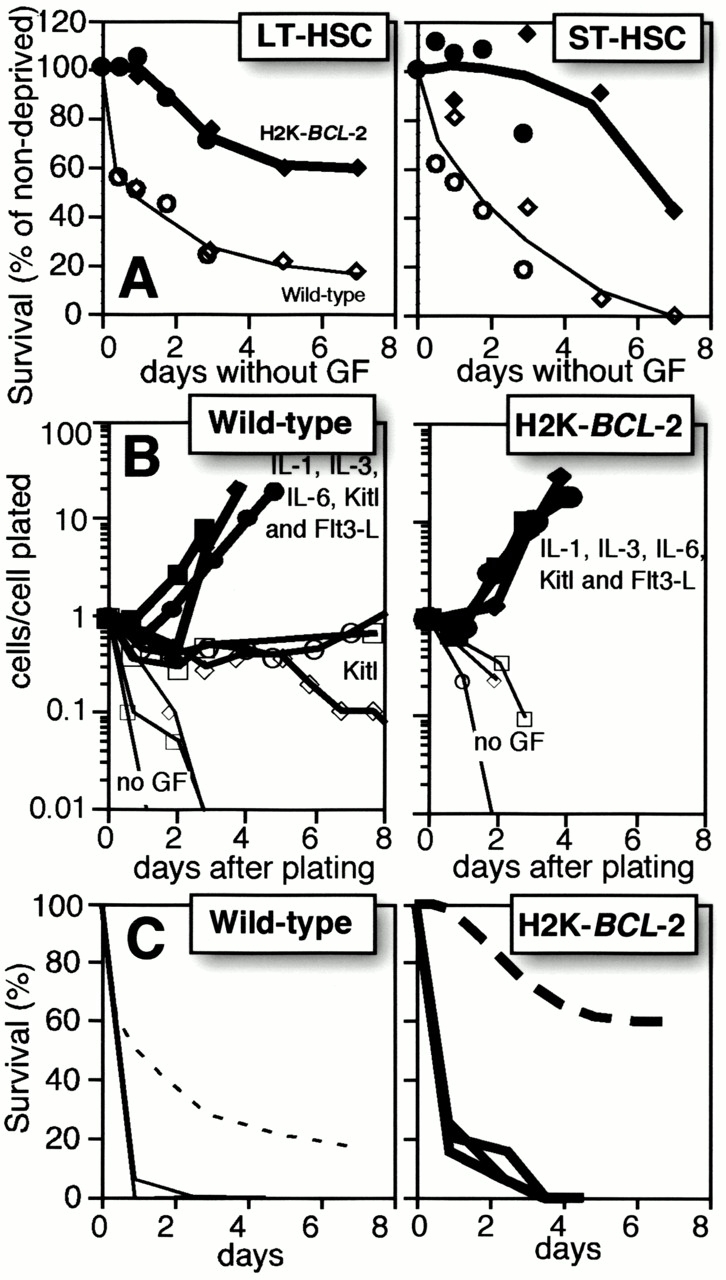
Assay parameters for single cell plating of HSCs in Terasaki wells. (A) Factor deprivation–induced apoptosis in the presence of serum. Linneg (left) and Linlow (right) HSCs were deposited as single cells in Terasaki wells with serum-containing M5300 medium without factors. At the indicated time points, a mixture of recombinant murine (rm)Kitl, rmFlt3-L, rmIL-6, and rmTpo was added and the wells with proliferating cells were counted 5–7 d later. 60–120 cells were plated per genotype per time point. Filled symbols and thick lines show transgenic cells, and open symbols and thin lines show wild-type cells. Circles and diamonds indicate separate sets of experiments. 100% is the plating efficiency of cells to which growth factors are added at time 0. (B) Single LT-HSCs are clone sorted into wells of Terasaki plates containing serum-free medium (Xvivo15) without growth factors (thin lines and small open symbols), with 30 ng/ml rmKitl (medium lines and large open symbols), or a mixture of IL-1, IL-3, IL-6, Kitl, and Flt3-L (thick lines and filled symbols). Data from three separate experiments are shown, with 20 cells plated per condition per experiment. Cell numbers at each time point are plotted as total cell numbers present in all wells divided by the number of cells plated initially in the experiment. (C) Comparison of survival times of LT-HSCs plated in the presence of serum (dashed lines; data from A) or in the absence of serum (solid lines). The assays in serum-free medium were done as described in B but show data from three additional experiments with 20 plated cells each.
The growth factor responses of single plated HSCs were tested in serum-free medium. LT-HSCs and ST-HSCs were sorted as described previously 13. The sorted HSCs are resorted in clone-sort mode, and single cells are deposited into the wells of 60-well Terasaki plates containing 10 μl Xvivo15 serum-free medium, with or without added growth factors. Fig. 1 B illustrates the response range in this assay. Depending on the factor(s) added, the plated HSCs will either die rapidly (no factors), a subset will remain present without extensive proliferation (Kitl added), or most or all cells will proliferate rapidly and extensively (cocktail of factors added). The difference between transgenic and wild-type HSCs is minimal; both have a similar response range. The delay in cell cycle entry that BCL-2 overexpression can cause 23 24 and that results in slower cycling, as detected by 5-bromo-2′-deoxyuridine (BrdU) labeling of H2K-BCL-2 HSCs in vivo 13, is not detectable under these conditions. Cell death in serum-free medium without added factors happens much more rapidly for H2K-BCL-2 transgenic HSCs than in the presence of serum (Fig. 1 C). This shows that BCL-2 overexpression by itself is not enough to ensure survival under serum-free culture conditions; other stimuli are necessary.
The Response of HSCs to Single Factor Stimulation.
This experimental model was used to study the effect of single factor stimulations to identify factor(s) that can collaborate with BCL-2. As the most important function of several cytokines seems to be preventing apoptosis (for reviews, see references 1 and 25), transgenic HSCs might be able to respond to cytokines whose function does not include prevention of apoptosis. A large number of cytokines were tested in Xvivo15 medium. As expected, most, including IL-1, IL-2, IL-4, IL-6, IL-7, IL-11, Flt3-L, G-CSF, GM-CSF, TNF-α, TGF-β, MIP-1α, BMP-4, LIF, OSM, Epo, bFGF, EGF, and VEGF, did not elicit a response from either genotype. Fig. 2 A (top) shows GM-CSF as an example. Tpo, Kitl, and IL-3 did elicit a response (Fig. 2 A). Both wild-type and transgenic HSCs respond to IL-3 with vigorous proliferation (Fig. 2 A, bottom). A very limited response, stronger for transgenic than for wild-type cells, to Tpo alone is seen. Cell numbers never exceed input numbers, averaged over the plated cells per experiment.
Figure 2.
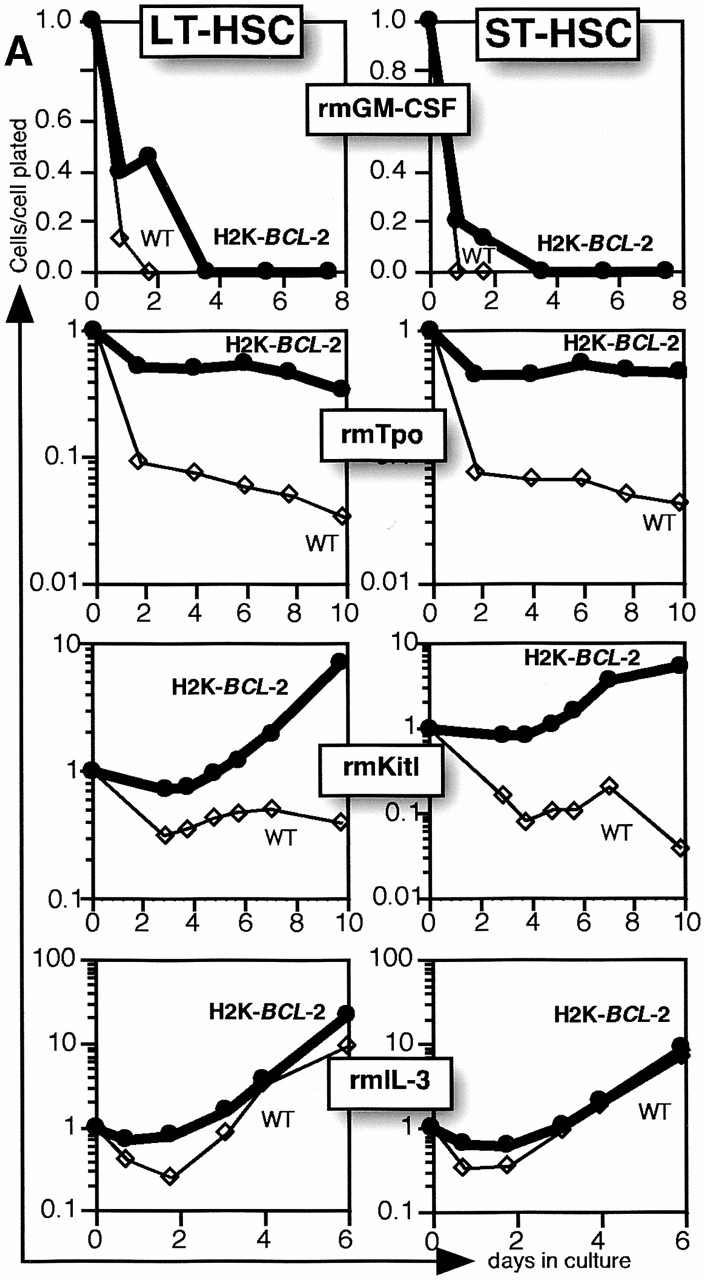
Single factor stimulations of LT-HSCs and ST-HSCs. (A) Single HSCs were clone sorted into wells of Terasaki plates in serum-free medium (Xvivo15) with a single added factor, as indicated. Thin lines and open symbols show data for wild-type cells, and thick lines and filled symbols show data for H2K-BCL-2 transgenic HSCs. Cell numbers at each time point are plotted as total cell numbers present in all wells divided by the number of cells plated initially in the experiment. Representative experiments are shown. (B) Cell growth after plating of a single LT-HSC in a Terasaki well. Numbers indicate days in culture. The pictures illustrate growth of one H2K-BCL-2 transgenic LT-HSC stimulated with Kitl.
The most dramatic difference between wild-type and transgenic HSCs was seen in Kitl stimulations. Wild-type HSCs plated in serum-free medium supplemented with Kitl responded by maintaining cell numbers at ∼20% of input numbers for at least 1 wk with limited proliferation in a subset of wells (see below). Eventually, in a few wells this can be followed by more pronounced proliferation. In contrast, wells with single H2K-BCL-2 transgenic HSCs display a much more vigorous response. Fig. 2 B illustrates the response of a single H2K-BCL-2 transgenic LT-HSCs stimulated with Kitl. LT-HSCs and ST-HSCs respond similarly to the factors tested.
More H2K-BCL-2 HSCs Respond to Single Factor Stimulation.
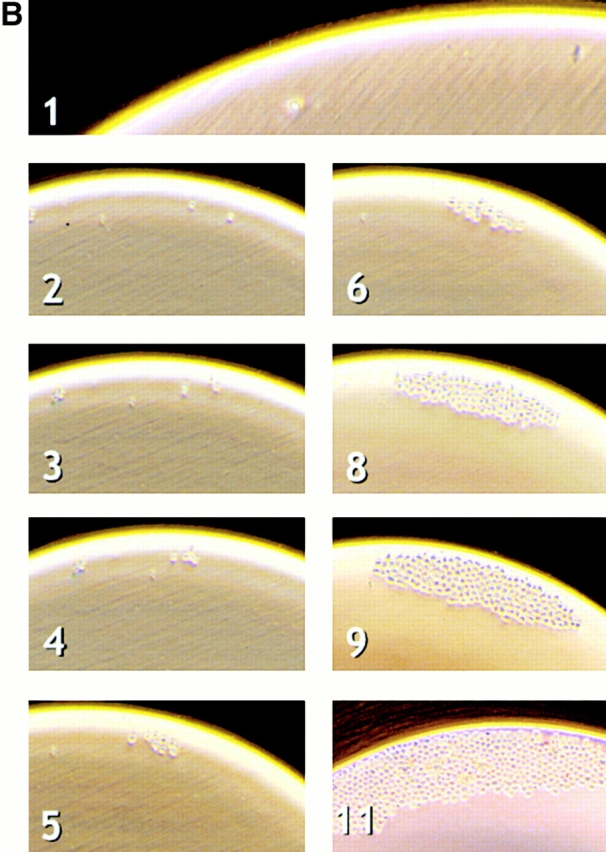
The increased cell numbers derived from transgenic HSCs under these conditions can represent increased proliferation of a subset of cells, or an increased number of cells responding. As HSCs are plated as single cells, it is possible to distinguish between these options. Fig. 3 A shows the percentage of plated cells that undergoes cell division, that is, the percentage of wells in which two or more cells are present after the plating of one cell. In the absence of added growth factors, or in the presence of factors that do not elicit a response, cell division is (virtually) absent. The lowest positive response of LT-HSCs (Fig. 3 A, top) is to stimulation with Tpo; <1% of wild-type, and ∼10% of transgenic cells divide, and the average clone size is very small. The highest response rate of LT-HSCs is to Kitl. Although only ∼10% of wild-type LT-HSCs divide, not different from the response to IL-3, >50% of the plated transgenic LT-HSCs divide. In addition, the clone sizes are often large. ST-HSCs (Fig. 3 A, bottom) behave similar to LT-HSCs. There is both early and delayed Kitl induced initiation of proliferation of HSCs. As depicted in Fig. 3 B, additional H2K-BCL-2 transgenic LT-HSCs are continuously induced into initiating proliferation, even after prolonged (at least up to 3 wk) dormancy (in the presence of Kitl) in culture. In contrast, proliferation induced by factors such as IL-3 happens within a few days of plating, independent of the transgenic status. There is no evidence that proliferation of transgenic HSCs is delayed, despite the fact that fewer transgenic HSCs are in cycle when isolated 13.
Figure 3.
Proliferation in response to single factor stimulation. (A) The panels show the percentage of proliferating cells (wells with two or more cells per well after plating a single cell) after incubation in Xvivo15 with rmTpo, rmIL-3, or rmKitl. Bold lines and filled symbols show H2K-BCL-2 HSCs, and thin lines and open symbols show wild-type cells. The figure shows data for 180 plated cells per genotype per condition (Tpo and IL-3) or 60 plated cells (Kitl). Representative experiments are shown. (B) Cell numbers in individual wells after plating of wild-type (left) or H2K-BCL-2 (right) LT-HSCs as single cells into Terasaki plates containing Xvivo15 and 60 ng/ml rmIL-3, or Xvivo15 and 30 ng/ml rmKitl. Data are from 60 cells plated per experimental condition. The figure only shows the traces for wells in which at least one cell division occurred; traces for wells without proliferation basically coincide with the x-axis.
Kitl Does Not Expand H2K-BCL-2 LT-HSCs.
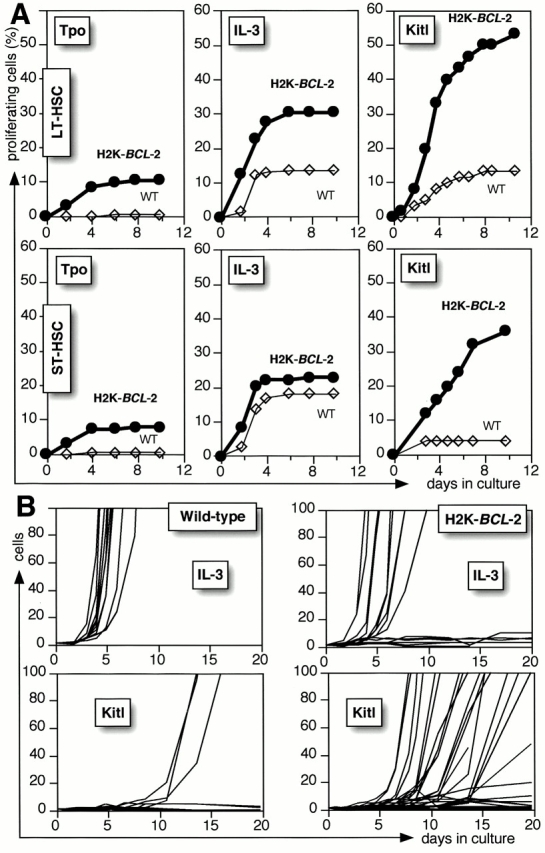
HSCs that proliferate under the conditions described do not maintain their phenotype, but differentiate primarily into early myeloid cells. Fig. 4 A shows typical wells in which a single H2K-BCL-2 transgenic LT-HSC was cultured in Tpo, IL-3, or Kitl. Tpo-stimulated wells have few cells, some of which are extremely large. IL-3–stimulated wells have many medium-sized cells. Kitl-stimulated wells have a wide range of cell numbers, but the cells are typically smaller than in IL-3–stimulated wells. This is confirmed by cytospins (Fig. 4 B). Tpo-stimulated cultures contain mature-looking megakaryocytes and IL-3–stimulated cultures contain well-differentiated myeloid cells of various lineages, whereas Kitl-stimulated cells, even after 14 d in culture, contain mainly undifferentiated blast cells, in addition to poorly differentiated myeloid cells. The cells are larger than freshly isolated LT-HSCs, in line with their rapid cycling. There is no clear difference in IL-3– or Tpo-induced differentiation between transgenic and wild-type cultures.
Figure 4.
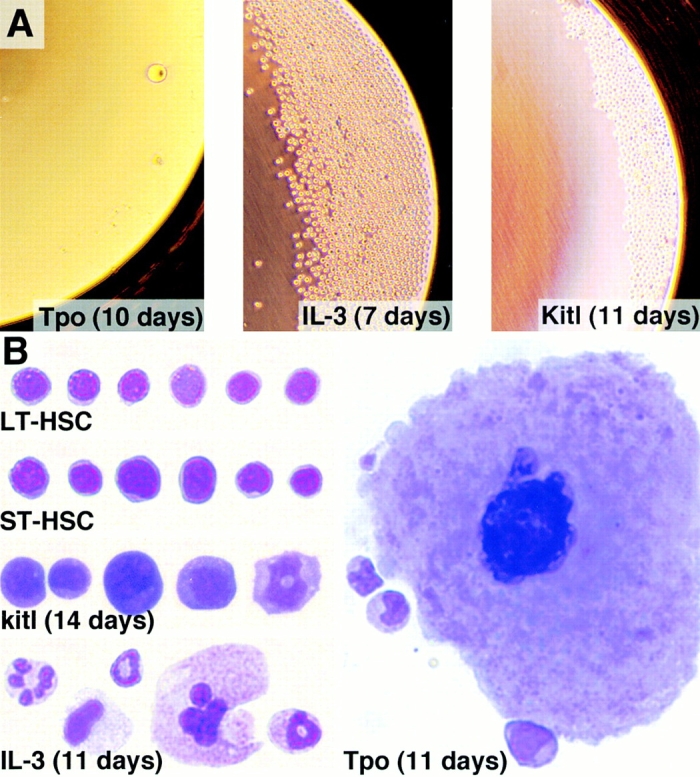
Cell morphology of H2K-BCL-2 LT-HSCs exposed to Tpo, IL-3, or Kitl. (A) Overview of the wells grown serum free with the cytokines as indicated. The cultures were initiated by deposition of a single, double-sorted, H2K-BCL-2 transgenic LT-HSC. (B) Morphology of the cells growing in IL-3–, Tpo-, and Kitl-stimulated serum-free cultures. The cultured cells are compared with freshly isolated LT-HSCs and ST-HSCs. The cell cultures were initiated from H2K-BCL-2 transgenic LT-HSCs. For staining and photography, see Materials and Methods. Representative cells are shown.
Flow cytometric analysis (Fig. 5) of LT-HSCs cultured in serum-free medium plus Kitl confirms their slow differentiation. The top left panel of Fig. 5 depicts the difference in cell numbers of wild-type (thin lines) and H2K-BCL-2 transgenic (bold lines) LT-HSCs in a typical experiment. When cultures are tested for maintenance of day 12 CFU-S, as a measure for maintenance of HSCs and multipotent progenitors, CFU-S activity drops rapidly in wild-type cultures, as expected (Fig. 5, second panel, top). Transgenic cultures show an initial increase, but numbers drop rapidly as the cells increase their proliferation rate. The third and consecutive panels do not take into account the difference in cell numbers between wild-type and transgenic cultures (first panel), which makes the actual difference considerably larger. Phenotypic HSCs (Thy-1.1lowLinneg/lowSca-1posc-Kitpos) decline rapidly in wild-type cultures. In transgenic cultures the decline is slower but, even taking the difference in absolute numbers into account, still present. This confirms the CFU-S data: H2K-BCL-2 transgenic HSCs do not expand under these conditions. Other progenitors studied include common lymphoid progenitors (CLPs), which can give rise to B, T, and NK cells 26, common myeloid progenitors (CMPs), which can give rise to all myeloid lineages 27, and the more restricted megakaryocyte/erythrocyte progenitors (MEPs) and granulocyte/macrophage progenitors (GMPs [27]). Cells with CLP phenotype appear late and are present in very low numbers. However, sorting and replating of these cells on AC6 stroma cells supplemented with IL-7 show that they, like bone marrow CLPs, will give rise to B cells (B220+ CD19+; data not shown). Myeloid progenitors appear earlier and in larger numbers in these cultures, with the balance gradually shifting towards GMPs. The vast majority of the cells differentiate into myeloid cells (Gr-1– and/or Mac-1–positive; Fig. 5, bottom right panel). TER119+ erythroid cells and B lymphoid cells (not shown) remain near background levels. However, this analysis excludes mature erythrocytes.
Figure 5.

Differentiation in response to Kitl stimulation. The top left panel shows total cell numbers after plating of single LT-HSCs in Xvivo15 medium plus Kitl. Cell numbers at each time point are plotted as total cell numbers present in all wells divided by the number of cells (60 cells) plated initially in the experiment. The second top panel depicts CFU-S day 12 activity of LT-HSCs cultured for various periods of time in Kitl. For each time point the cells from four wells (1,000 cells plated) were collected and injected into five lethally irradiated mice to determine the CFU-S day 12 activity. The third and top right panels show flow cytometric analysis enumerating, as percentage of live cells, the populations indicated. The bottom right panel shows the presence of cells with more mature surface markers Gr-1/Mac-1 and TER119. Myeloid progenitors (CMPs, MEPs, and GMPs) express Mac-1 at low levels and partially overlap with the Gr-1/Mac-1 lineage–positive cells shown in the bottom right panel. All panels: thin lines and open symbols show wild-type data, and thick lines and filled symbols show H2K-BCL-2 transgenic data. All cultures were in Xvivo15 plus 30 ng/ml rmKitl. Gray areas indicate background staining. The left two panels of the top row show data from a single sort, and the other panels show combined data from four separate sorts. Cells were cultured in 96-well plates (500–1,000 cells/well) with daily medium change, and single wells were used for staining. The left two panels of the top row were cultured in Terasaki plates.
There are no clear differences between H2K-BCL-2 transgenic and wild-type cultures with respect to the relative levels of progenitors and more mature cells or in the timing of their appearance. However, there are differences in the absolute levels. H2K-BCL-2 transgenic cultures also differ from wild-type cultures in the rate with which cells with HSC phenotype, and CFU-S activity, disappear and in the numbers of cells present in the cultures.
Multifactor Stimulation Will Increase the Proliferation Rate of Wild-Type HSCs.
Stimulation with Kitl allows efficient growth of H2K-BCL-2 transgenic but not wild-type HSCs. Both grow fast when stimulated by multiple factors. Several factors were tested for their ability to augment Kitl-induced growth of wild-type HSCs to transgenic levels (Fig. 6). LIF and Flt-3L do not affect the proliferation rate of Kitl-stimulated cultures. However, although Tpo by itself does not induce rapid growth in wild-type HSCs, in combination with Kitl it leads to vigorous growth, indistinguishable from that seen in transgenic cultures. A similar effect can be seen with IL-6 (results not shown).
Figure 6.
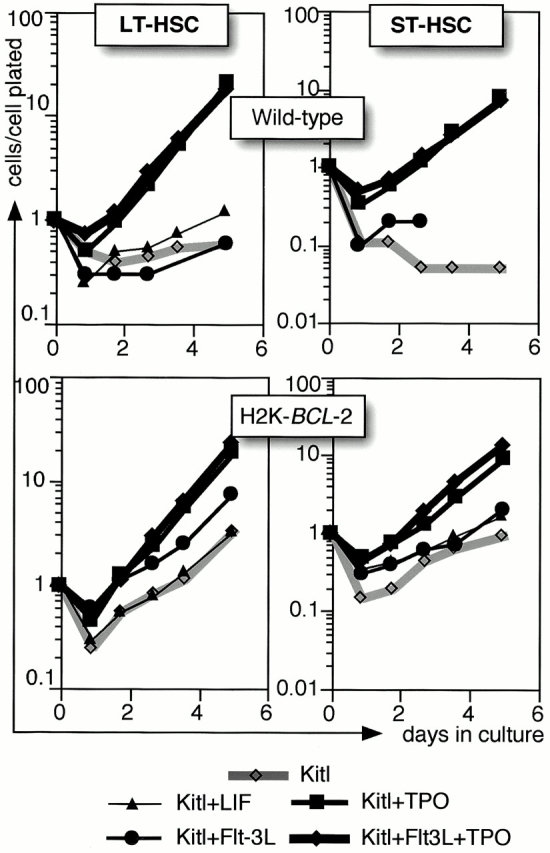
A comparison of H2K-BCL-2 and wild-type: dual factor stimulations. Single HSCs are clone sorted into Terasaki wells containing Xvivo15 and growth factors as indicated. Gray lines show stimulation with Kitl only, and black lines show cultures with factor combinations as indicated. Cell numbers at each time point are plotted as total cell numbers present in all wells divided by the number of cells plated initially in the experiment. A representative experiment is shown.
BCL-2 Cannot Rescue a c-Kit Deficiency In Vivo.
To study the interaction between the BCL-2 and c-Kit in vivo, H2K-BCL-2 transgenic mice were crossed with mice carrying the c-KitW41 allele 28 29. c-KitW41/W41 mice have a white spotted appearance, are fertile, and have decreased numbers of peritoneal mast cells. The W41 phenotype, e.g., coat color, is similar in the presence of the H2K-BCL-2 transgene. Multiparameter flow cytometric analysis of blood, bone marrow, spleen, thymus, and peritoneal cavity revealed only minor differences between W41 and wild-type mice (such as decreased numbers of c-Kit bright cells in the peritoneal cavity). These differences were not rescued by the H2K-BCL-2 transgene (Table ), despite the fact that the transgene is expressed, and functional, in bone marrow–derived mast cells (BMMCs [20]). Cytospins from W41 mice show a highly significant reduction of mast cells in the peritoneal cavity of W41 mice compared with wild-type mice (P = 0.0001, t test; Fig. 7 and Table ). Their numbers are not rescued by the H2K-BCL-2 transgene. There are no significant differences between wild-type and H2K-BCL-2 transgenic mice (P = 0.1248) and between c-KitW41/W41and H2K-BCL-2/c-KitW41/W41mice with respect to mast cell numbers (P = 0.9432). The mutant c-Kit allele in W41 mice does not impair the effects of BCL-2 overexpression. H2K-BCL-2/c-KitW41/W41 mice have increased spleen and thymus sizes, comparable to those caused by the transgene on a wild-type background.
Table 1.
Relative Mast Cell Numbers in the Peritoneal Cavity
| Wild-type | H2K-BCL-2 | W41/W41 | H2K-BCL-2 + W41/W41 | |
|---|---|---|---|---|
| Cytospins | 1.9% | 1.0% | 0.3% | 0.3% |
| (30/1,593) | (11/1,057) | (4/1,423) | (4/1,353) | |
| c-Kithigh | 2.6% | 1.1% | 0.4% | 0.3% |
Cells with mast cell morphology present in cells washed from the peritoneal cavity were quantitated in random fields of May-Grünwald/Giemsa–stained cytospins as depicted in Fig. 7. c-Kit bright cells in the peritoneal cavity were quantitated by flow cytometry on 2–5 × 10⁴ cells per mouse analyzed.
Figure 7.
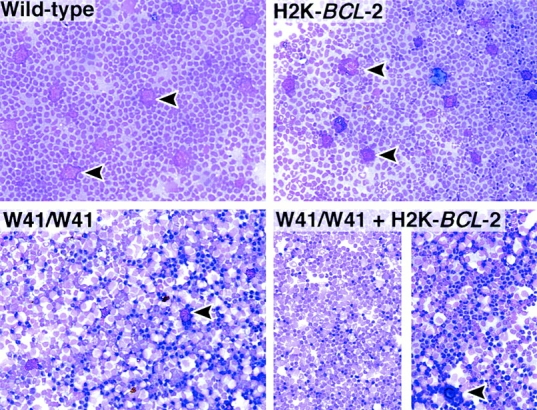
The H2K-BCL-2 transgene does not rescue the W41 c-Kit allele. May-Grünwald/Giemsa–stained cytospins of cells washed from the peritoneal cavity of wild-type (left) and H2K-BCL-2 transgenic mice (right). Top panels show mice with both wild-type c-Kit alleles, and the bottom panels show mice homozygous for the W41 allele. The split panel on the bottom right shows cytospins from two different mice. Arrowheads indicate mast cells, which are abundantly present in the top panels but almost absent in the bottom panels.
Discussion
Exposure of cells to a growth factor can result in alterations in proliferation, differentiation, or survival 30 31. It is difficult to distinguish between these effects in an environment in which multiple stimuli are presented simultaneously, all the more so because stimulation with a factor can have more than one outcome. To avoid this, HSCs were studied under serum-free conditions as single plated cells. However, growth factors that do not prevent apoptosis will not read out under these conditions. A wider range of responses can be observed when cells are prevented from undergoing growth factor deprivation–induced apoptosis. One method for achieving this is ectopic expression of proteins that block apoptosis, such as BCL-2. This was used to test whether stimuli that induce a growth response can be separated from those that prevent apoptosis in HSCs.
Overexpression of BCL-2 prevents a wide range of cells from undergoing apoptosis induced by a wide range of stimuli, including growth factor deprivation. Cell survival is one of the essential functions of growth factors, although it is certainly not the only function. The importance of cytokine-mediated survival of cells in vivo has been demonstrated most clearly in crosses between BCL-2 transgenic mice, and IL (receptor) null mutant mice. Providing survival signals can actually be the only essential function on subclasses of target cells 32 33 34 35. Some growth factors, even though they may have potent activities, are not efficient at preventing apoptosis. For example, Kitl is an important factor for many progenitors and stem cells but also for BMMCs, which will proliferate readily when stimulated by Kitl 36 37. However, BMMC cultures stimulated by Kitl only are much less stable than cultures stimulated by IL-3, and undergo rapid apoptosis upon factor withdrawal 38. One of the reasons for this difference may be the fact that Kitl does not induce expression of Bcl-2 family members in BMMCs 39. Kitl-induced protection against apoptosis seems to employ a separate biochemical pathway 40. Kitl-induced expression of Bcl-2 has been reported for NK cells 41.
Tpo, the ligand interacting with the c-Mpl receptor is a major regulator of megakaryocytopoiesis and thrombopoiesis, but also has potent effects on HSCs (for reviews, see references 42 43 44). We find that HSCs that overexpress BCL-2 have a higher plating efficiency when plated in Tpo as a single factor, indicating that Tpo stimulation alone is not sufficient to block apoptosis. IL-3 induces proliferation and rapid myeloid differentiation in a subset of plated HSCs, in agreement with published observations 45 46, although this may depend on exact culture conditions 47. The limited response to IL-3 may partially be a strain phenomenon; C57BL mice are known to be poor IL-3 responders 38 48.
Kitl/c-Kit signaling is important for dermal, gonadal, and hematopoietic development (for reviews, see references 49 and 50). Although there is debate about the existence of c-Kitneg HSCs (see, for example, reference 51), it is clear that HSC activity is present in c-Kitpos cells in untreated bone marrow of both wild-type and H2K-BCL-2 transgenic mice 5 13 52 53. c-Kit has been used as a selection marker for HSCs and all the plated cells are c-Kitpos. Although c-Kit null mutant mice have severe hematopoietic deficiencies, their HSCs do expand during fetal development, indicating that c-Kit is not essential for HSCs 54. Kitl collaborates with many other growth factors in stimulating cells; few cell types proliferate in response to Kitl only. Kitl acts on hematopoietic progenitor cells, where it is reported to increase survival, rather than recruitment into the cell cycle 55 56 57 58, although it has also been reported to shorten the dormant period of progenitor cells stimulated by additional factors 59.
The action of Kitl on BCL-2–overexpressing HSCs is remarkably different from that on wild-type cells. A few of the latter will undergo a limited number of cell divisions but the total number of cells remains below input numbers. However, the majority of transgenic cells will cycle, many of them extensively, and cell numbers exceed input numbers within days. Many of the cycling cells retain primitive characteristics, although most eventually lose their HSC phenotype, with respect to both surface markers and day 12 CFU-S activity. The initial increase in transgenic CFU-S activity most likely reflects differentiation of LT-HSCs, which are relatively inefficient at forming spleen colonies, into ST-HSCs, which do this with higher efficiency 5. In addition to progenitor cells, more mature myeloid cells are present after 2 wk of culturing; almost all cells express myeloid surface markers such as Gr-1 and/or Mac-1. However, some cells with the characteristics of HSCs remain present for >1 wk. Culturing of HSCs in growth factor combinations containing Kitl can abrogate the difference in proliferation between wild-type and transgenic HSCs. In line with other studies, we find that factors like Tpo and IL-6, when combined with Kitl, can recruit wild-type cells into rapid cycling 60 61. Flt3-L does not collaborate with Kitl in this respect, and neither does LIF.
Thus, provision of HSC survival via enforced expression of BCL-2 and Kitl/c-Kit signaling is sufficient not only to trigger HSC proliferation, but these proliferations result in expansion of differentiating progenitors along the myeloid line, without expansion of HSCs by self-renewal. Furthermore, the response of single HSCs is wildly asynchronous, with some HSCs showing the first proliferative response weeks after culture initiation. This differs from previously published data (see, for example, reference 59), which show an asynchronous response to IL-3, with addition of Kitl reducing the dormancy times. Possible explanations for this apparent discrepancy may be found in the different cell populations that were used: FACS®-purified LT-HSCs versus 5-fluorouracil–treated bone marrow. If we assume that BCL-2 provides only a survival function for single HSCs, and that the serum-free Xvivo15 medium contains no ligands for other HSC receptors, signal transduction via c-Kit on stem cells can open the cellular programs for myelopoiesis 30, or simply allow some self-autonomous process to take advantage of the states of survival and proliferation to exact its program, in line with previous suggestions 19 31. It is unlikely that Kitl would enforce myeloid-only differentiation in view of its importance in lymphoid differentiation 25. The lack of large numbers of lymphoid progeny from Kitl-stimulated HSCs does not reflect an inherent inability to undergo lymphoid differentiation: when cells with CLP phenotype are sorted away from the rest of the culture, they are capable of differentiating into B lymphoid cells. Rather, it may indicate an inhibitory activity from the majority of cells undergoing myeloid differentiation. Two determined oligopotent progenitors, the clonal CLPs 26 and the clonal CMPs 27, have been characterized by us. CMPs give rise, without self-renewal, to GMPs and MEPs. We show here that these progenitor classes (CLPs, CMPs, MEPs, and GMPs) are all present in Kitl-stimulated cultures initiated with LT-HSCs from H2K-BCL-2 transgenic mice. It will be important to follow the maturation pathways of H2K-BCL-2 HSCs in response to Kitl, especially to determine whether single HSCs can give rise to both CLPs and CMPs, and if so, whether this involves asymmetric divisions.
It is conceivable that single H2K-BCL-2 HSCs respond to Kitl by initiating production of hematopoietic cytokines and/or their cognate receptors. For example, signal transducer and activator of transcription (Stat)-5, which has been reported to be activated after Kitl/c-Kit signaling 50, can induce expression of immediate early genes, including IL-6 62. It will be important to test whether stimulated HSCs or their progeny produce cytokine transcripts, to block the effects of secreted autocrine factors by providing neutralizing antibodies or molecules in these cultures, and/or use cytokine mutant mouse HSCs. Conceivably, Kitl could lead H2K-BCL-2 HSCs to undergo self-renewing expansions of HSCs if the myelopoietic pathways are so blocked.
If wild-type HSCs cannot respond to Kitl, but H2K-BCL-2 HSCs can, it is reasonable to speculate that other factors or signals are normally functioning in vivo to promote HSC survival under conditions of stimulation. Although factors like Tpo, IL-6, and others readily do so in vitro, they also promote HSC differentiation. We are investigating other factors/receptors for such signals, including the Wnt/Frizzled 63 and the Jagged/Notch 64 ligand–receptor pairs.
Regulation of apoptosis in HSCs is very strict. Although many cells can be induced to undergo apoptosis by signaling through different pathways 65 66, HSCs need input from two signaling pathways to prevent apoptosis (Fig. 8). Similar observations have been made in serum-free cultures of certain other primary cells. Retinal pigmented epithelial cells need both Bcl-XL and FGF1/extracellular signal–regulated kinase (Erk) signaling; Bcl-XL alone is not sufficient to prevent apoptosis 67. This high level of control may help to prevent transformation. The cytokine that seems to be able to block both apoptosis pathways in HSCs, IL-3, also conveys a strong myeloid differentiation signal. A similar dual antiapoptosis signaling role has also been proposed for IL-6 in T cells 68. In this system, IL-6 induces Bcl-2 expression in a Stat-3–independent manner, but preventing apoptosis depends on the presence of functional Stat-3 protein. The Stat-3–dependent antiapoptotic signaling path seems to involve Pim-1 and Cdc48p/valosine-containing protein downstream of Stat-3 69. In HSCs, we find that IL-6 as a single factor is not sufficient, not even in H2K-BCL-2 transgenic HSCs; combined stimulation with Kitl is necessary for survival and proliferation. In our model (Fig. 8), this would indicate that only the Bcl-2–inducing part of IL-6 antiapoptosis signaling is functional in murine HSCs. It should be kept in mind that Fig. 8 necessarily only presents a subset of even the known interactions; apoptosis prevention by Kitl, for example, is not independent of Bcl-2 (family members) in all cells. Kitl has been reported to upregulate Bcl-2 in NK cells 41 and Mcl-1 in myeloid cells 70, and it can also functionally affect Bcl-2 by regulating Bad phosphorylation by the protein–serine/threonine kinase Akt 50 71.
Figure 8.
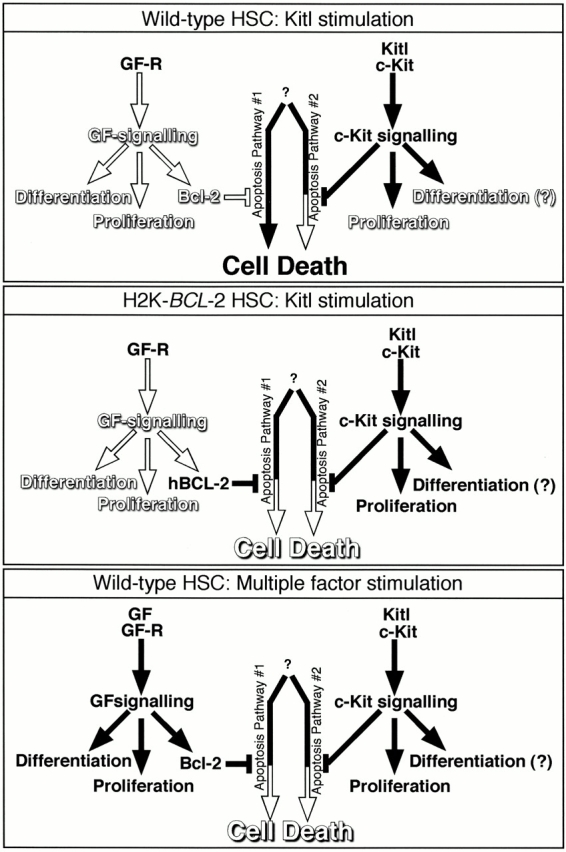
Model for apoptosis signaling in HSCs. The middle two arrows in each panel represent the two active apoptosis pathways that need to be blocked. It is currently unclear whether these represent two completely separate pathways, or two actions within one pathway. White arrows and text show the inactive pathway. Black arrows and text show the active signaling pathway. Bcl-2 is meant to represent antiapoptosis Bcl-2 family members. The top panel shows Kitl signaling in the wild-type HSCs. Although the proliferative signal from Kitl is conveyed, apoptosis is blocked only partially at best. In the middle panel, transgene-derived BCL-2, in combination with Kitl/c-Kit–transmitted signals, blocks apoptosis, allowing the Kitl-conveyed proliferation, and possibly differentiation-inducing activities to be seen. In the bottom panel, multifactor stimulation also completely blocks apoptosis and results in specific proliferation/differentiation, depending on the factor combination used.
H2K-BCL-2 transgenic mice should prove very useful in unravelling the growth factor requirements, and growth factor activities, not only for HSCs but also for various other multipotent and more lineage-restricted hematopoietic progenitor populations that also express the transgene 5 26 27, as well as cells in the nonhematopoietic lineages that express the transgene. Cells from H2K-BCL-2 transgenic mice allow the distinction between factors acting on survival and on proliferation/differentiation. They also facilitate factor characterization experiments through the inherently higher plating efficiencies. The culture conditions described here, single cell plating of HSCs in serum-free medium in the presence of Kitl, which allows the cells to differentiate into lymphoid and the various myeloid lineages, will be a powerful tool in these studies. We are currently using cells from these mice to look in more detail at the actions of various factors involved in the decision between apoptosis, proliferation, and differentiation.
Acknowledgments
We gratefully acknowledge Libuse Jerabek for excellent laboratory management, Veronica Braunstein for preparing many of the antibodies used, Lu Hidalgo and Bert Lavarro for animal care and management, and Kimberly Gandy for critical reading of the manuscript.
Parts of this work were supported by a fellowship grant from the Dutch Cancer Society/Koningin Wilhelmina Fonds (J. Domen). The major part of this work was supported by a grant from Systemix Inc., and by US Public Health Service grants CA42551 and P01 DK53074.
Footnotes
Abbreviations used in this paper: bFGF, basic fibroblast growth factor; BMMC, bone marrow–derived mast cell; CFU-S, CFU–spleen; CLP, common lymphoid progenitor; CMP, common myeloid progenitor; EGF, epidermal growth factor; GMP, granulocyte/macrophage progenitor; HSC, hematopoietic stem cell; LIF, leukemia inhibitory factor; LT-HSC, long-term HSC; MEP, megakaryocyte/erythrocyte progenitor; MIP, macrophage inflammatory protein; OSM, oncostatin M; Stat, signal transducer and activator of transcription; ST-HSC, short-term HSC; Tpo, thrombopoietin.
References
- Domen J., Weissman I.L. Self-renewal, differentiation or deathregulation and manipulation of hematopoietic stem cell fate. Mol. Med. Today. 1999;5:201–208. doi: 10.1016/S1357-4310(99)01464-1. [DOI] [PubMed] [Google Scholar]
- Spangrude G.J., Heimfeld S., Weissman I.L. Purification and characterization of mouse hematopoietic stem cells. Science. 1988;241:58–62. doi: 10.1126/science.2898810. [DOI] [PubMed] [Google Scholar]
- Uchida N., Weissman I.L. Searching for hematopoietic stem cellsevidence that Thy-1.1lo Lin− Sca-1+ cells are the only stem cells in C57BL/Ka-Thy-1.1 bone marrow. J. Exp. Med. 1992;175:175–184. doi: 10.1084/jem.175.1.175. [DOI] [PMC free article] [PubMed] [Google Scholar]
- Ikuta K., Ingolia D.E., Friedman J., Heimfeld S., Weissman I.L. Mouse hematopoietic stem cells and the interaction of c-kit receptor and steel factor. Int. J. Cell Cloning. 1991;9:451–460. doi: 10.1002/stem.1991.5530090503. [DOI] [PubMed] [Google Scholar]
- Morrison S.J., Weissman I.L. The long-term repopulating subset of hematopoietic stem cells is deterministic and isolatable by phenotype. Immunity. 1994;1:661–673. doi: 10.1016/1074-7613(94)90037-x. [DOI] [PubMed] [Google Scholar]
- Morrison S.J., Wandycz A.M., Hemmati H.D., Wright D.E., Weissman I.L. Identification of a lineage of multipotent hematopoietic progenitors. Development. 1997;124:1929–1939. doi: 10.1242/dev.124.10.1929. [DOI] [PubMed] [Google Scholar]
- Hendrikx P.J., Martens C.M., Hagenbeek A., Keij J.F., Visser J.W. Homing of fluorescently labeled murine hematopoietic stem cells. Exp. Hematol. 1996;24:129–140. [PubMed] [Google Scholar]
- Spangrude G.J., Brooks D.M. Mouse strain variability in the expression of the hematopoietic stem cell antigen Ly-6A/E by bone marrow cells. Blood. 1993;82:3327–3332. [PubMed] [Google Scholar]
- Spangrude G.J., Brooks D.M. Phenotypic analysis of mouse hematopoietic stem cells shows a Thy-1-negative subset. Blood. 1992;80:1957–1964. [PubMed] [Google Scholar]
- Morrison S.J., Hemmati H.D., Wandycz A.M., Weissman I.L. The purification and characterization of fetal liver hematopoietic stem cells. Proc. Natl. Acad. Sci. USA. 1995;92:10302–10306. doi: 10.1073/pnas.92.22.10302. [DOI] [PMC free article] [PubMed] [Google Scholar]
- Randall T.D., Weissman I.L. Phenotypic and functional changes induced at the clonal level in hematopoietic stem cells after 5-fluorouracil treatment. Blood. 1997;89:3596–3606. [PubMed] [Google Scholar]
- Sato T., Laver J.H., Ogawa M. Reversible expression of CD34 by murine hematopoietic stem cells. Blood. 1999;94:2548–2554. [PubMed] [Google Scholar]
- Domen J., Cheshier S.H., Weissman I.L. The role of apoptosis in the regulation of hematopoietic stem cellsoverexpression of Bcl-2 increases both their number and repopulation potential. J. Exp. Med. 2000;191:253–263. doi: 10.1084/jem.191.2.253. [DOI] [PMC free article] [PubMed] [Google Scholar]
- Weissman I.L. Stem cellsunits of development, units of regeneration and units in evolution. Cell. 2000;100:157–168. doi: 10.1016/s0092-8674(00)81692-x. [DOI] [PubMed] [Google Scholar]
- Pawliuk R., Eaves C., Humphries R.K. Evidence of both ontogeny and transplant dose-regulated expansion of hematopoietic stem cells in vivo. Blood. 1996;88:2852–2858. [PubMed] [Google Scholar]
- Iscove N.N., Nawa K. Hematopoietic stem cells expand during serial transplantation in vivo without apparent exhaustion. Curr. Biol. 1997;7:805–808. doi: 10.1016/s0960-9822(06)00341-1. [DOI] [PubMed] [Google Scholar]
- Audet J., Zandstra P.W., Eaves C.J., Piret J.M. Advances in hematopoietic stem cell culture. Curr. Opin. Biotechnol. 1998;9:146–151. doi: 10.1016/s0958-1669(98)80107-9. [DOI] [PubMed] [Google Scholar]
- Vaux D.L., Cory S., Adams J.M. Bcl-2 gene promotes haemopoietic cell survival and cooperates with c-myc to immortalize pre-B cells. Nature. 1988;335:440–442. doi: 10.1038/335440a0. [DOI] [PubMed] [Google Scholar]
- Fairbairn L.J., Cowling G.J., Reipert B.M., Dexter T.M. Suppression of apoptosis allows differentiation and development of a multipotent hemopoietic cell line in the absence of added growth factors. Cell. 1993;74:823–832. doi: 10.1016/0092-8674(93)90462-y. [DOI] [PubMed] [Google Scholar]
- Domen J., Gandy K.L., Weissman I.L. Systemic overexpression of BCL-2 in the hematopoietic system protects transgenic mice from the consequences of lethal irradiation. Blood. 1998;91:2272–2282. [PubMed] [Google Scholar]
- Goff J.P., Shields D.S., Greenberger J.S. Influence of cytokines on the growth kinetics and immunophenotype of daughter cells resulting from the first division of single CD34+ Thy-1+lin− cells. Blood. 1998;92:4098–4107. [PubMed] [Google Scholar]
- Huang S., Law P., Francis K., Palsson B.O., Ho A.D. Symmetry of initial cell divisions among primitive hematopoietic progenitors is independent of ontogenic age and regulatory molecules. Blood. 1999;94:2595–2604. [PubMed] [Google Scholar]
- Mazel S., Burtrum D., Petrie H.T. Regulation of cell division cycle progression by bcl-2 expressiona potential mechanism for inhibition of programmed cell death. J. Exp. Med. 1996;183:2219–2226. doi: 10.1084/jem.183.5.2219. [DOI] [PMC free article] [PubMed] [Google Scholar]
- O'Reilly L.A., Huang D.C., Strasser A. The cell death inhibitor Bcl-2 and its homologues influence control of cell cycle entry. EMBO (Eur. Mol. Biol. Organ.) J. 1996;15:6979–6990. [PMC free article] [PubMed] [Google Scholar]
- Baird A.M., Gerstein R.M., Berg L.J. The role of cytokine receptor signaling in lymphocyte development. Curr. Opin. Immunol. 1999;11:157–166. doi: 10.1016/s0952-7915(99)80027-2. [DOI] [PubMed] [Google Scholar]
- Kondo M., Weissman I.L., Akashi K. Identification of clonogenic common lymphoid progenitors in mouse bone marrow. Cell. 1997;91:661–672. doi: 10.1016/s0092-8674(00)80453-5. [DOI] [PubMed] [Google Scholar]
- Akashi K., Traver D., Miyamoto T., Weissman I.L. A clonogenic common myeloid progenitor that gives rise to all myeloid lineages. Nature. 2000;404:193–197. doi: 10.1038/35004599. [DOI] [PubMed] [Google Scholar]
- Geissler E.N., Russell E.S. Analysis of the hematopoietic effects of new dominant spotting (W) mutations of the mouse. II. Effects on mast cell development. Exp. Hematol. 1983;11:461–466. [PubMed] [Google Scholar]
- Nocka K., Tan J.C., Chiu E., Chu T.Y., Ray P., Traktman P., Besmer P. Molecular bases of dominant negative and loss of function mutations at the murine c-kit/white spotting locusW37, Wv, W41 and W. EMBO (Eur. Mol. Biol. Organ.) J. 1990;9:1805–1813. doi: 10.1002/j.1460-2075.1990.tb08305.x. [DOI] [PMC free article] [PubMed] [Google Scholar]
- Metcalf D. Lineage commitment and maturation in hematopoietic cellsthe case for extrinsic regulation. Blood. 1998;92:345–347. [PubMed] [Google Scholar]
- Enver T., Heyworth C.M., Dexter T.M. Do stem cells play dice? Blood. 1998;92:348–351. [PubMed] [Google Scholar]
- Kondo M., Akashi K., Domen J., Sugamura K., Weissman I.L. Bcl-2 rescues T lymphopoiesis, but not B or NK cell development, in common gamma chain-deficient mice. Immunity. 1997;7:155–162. doi: 10.1016/s1074-7613(00)80518-x. [DOI] [PubMed] [Google Scholar]
- Lagasse E., Weissman I.L. Enforced expression of Bcl-2 in monocytes rescues macrophages and partially reverses osteopetrosis in op/op mice. Cell. 1997;89:1021–1031. doi: 10.1016/s0092-8674(00)80290-1. [DOI] [PubMed] [Google Scholar]
- Akashi K., Kondo M., von Freeden-Jeffry U., Murray R., Weissman I.L. Bcl-2 rescues T lymphopoiesis in interleukin-7 receptor-deficient mice. Cell. 1997;89:1033–1041. doi: 10.1016/s0092-8674(00)80291-3. [DOI] [PubMed] [Google Scholar]
- Maraskovsky E., O'Reilly L.A., Teepe M., Corcoran L.M., Peschon J.J., Strasser A. Bcl-2 can rescue T lymphocyte development in interleukin-7 receptor-deficient mice but not in mutant rag-1−/− mice. Cell. 1997;89:1011–1019. doi: 10.1016/s0092-8674(00)80289-5. [DOI] [PubMed] [Google Scholar]
- Nocka K., Buck J., Levi E., Besmer P. Candidate ligand for the c-kit transmembrane kinase receptorKL, a fibroblast derived growth factor stimulates mast cells and erythroid progenitors. EMBO (Eur. Mol. Biol. Organ.) J. 1990;9:3287–3294. doi: 10.1002/j.1460-2075.1990.tb07528.x. [DOI] [PMC free article] [PubMed] [Google Scholar]
- Tsai M., Takeishi T., Thompson H., Langley K.E., Zsebo K.M., Metcalfe D.D., Geissler E.N., Galli S.J. Induction of mast cell proliferation, maturation, and heparin synthesis by the rat c-kit ligand, stem cell factor. Proc. Natl. Acad. Sci. USA. 1991;88:6382–6386. doi: 10.1073/pnas.88.14.6382. [DOI] [PMC free article] [PubMed] [Google Scholar]
- Domen J., van der Lugt N.M., Laird P.W., Saris C.J., Clarke A.R., Hooper M.L., Berns A. Impaired interleukin-3 response in Pim-1-deficient bone marrow-derived mast cells. Blood. 1993;82:1445–1452. [PubMed] [Google Scholar]
- Yee N.S., Paek I., Besmer P. Role of kit-ligand in proliferation and suppression of apoptosis in mast cellsbasis for radiosensitivity of white spotting and steel mutant mice. J. Exp. Med. 1994;179:1777–1787. doi: 10.1084/jem.179.6.1777. [DOI] [PMC free article] [PubMed] [Google Scholar]
- Gommerman J.L., Berger S.A. Protection from apoptosis by steel factor but not interleukin-3 is reversed through blockade of calcium influx. Blood. 1998;91:1891–1900. [PubMed] [Google Scholar]
- Carson W.E., Haldar S., Baiocchi R.A., Croce C.M., Caligiuri M.A. The c-kit ligand suppresses apoptosis of human natural killer cells through the upregulation of bcl-2. Proc. Natl. Acad. Sci. USA. 1994;91:7553–7557. doi: 10.1073/pnas.91.16.7553. [DOI] [PMC free article] [PubMed] [Google Scholar]
- Rasko J.E., Begley C.G. The thrombopoietic factor, Mpl-ligand. Int. J. Biochem. Cell Biol. 1998;30:657–660. doi: 10.1016/s1357-2725(97)00148-9. [DOI] [PubMed] [Google Scholar]
- Alexander W.S. Thrombopoietin and the c-Mpl receptorinsights from gene targeting. Int. J. Biochem. Cell Biol. 1999;31:1027–1035. doi: 10.1016/s1357-2725(99)00079-5. [DOI] [PubMed] [Google Scholar]
- Kaushansky K. Thrombopoietin and hematopoietic stem cell development. Ann. NY Acad. Sci. 1999;872:314–319. doi: 10.1111/j.1749-6632.1999.tb08475.x. [DOI] [PubMed] [Google Scholar]
- Trevisan M., Yan X.Q., Iscove N.N. Cycle initiation and colony formation in culture by murine marrow cells with long-term reconstituting potential in vivo. Blood. 1996;88:4149–4158. [PubMed] [Google Scholar]
- Matsunaga T., Hirayama F., Yonemura Y., Murray R., Ogawa M. Negative regulation by interleukin-3 (IL-3) of mouse early B-cell progenitors and stem cells in culturetransduction of the negative signals by betac and betaIL-3 proteins of IL-3 receptor and absence of negative regulation by granulocyte-macrophage colony-stimulating factor. Blood. 1998;92:901–907. [PubMed] [Google Scholar]
- Bryder D., Jacobsen S.E. Interleukin-3 supports expansion of long-term multilineage repopulating activity after multiple stem cell divisions in vitro. Blood. 2000;96:1748–1755. [PubMed] [Google Scholar]
- Kincade P.W. The lymphopoietic microenvironment in bone marrow. Adv. Cancer Res. 1990;54:235–272. doi: 10.1016/s0065-230x(08)60813-1. [DOI] [PubMed] [Google Scholar]
- Ashman L.K. The biology of stem cell factor and its receptor C-kit. Int. J. Biochem. Cell Biol. 1999;31:1037–1051. doi: 10.1016/s1357-2725(99)00076-x. [DOI] [PubMed] [Google Scholar]
- Linnekin D. Early signaling pathways activated by c-Kit in hematopoietic cells. Int. J. Biochem. Cell Biol. 1999;31:1053–1074. doi: 10.1016/s1357-2725(99)00078-3. [DOI] [PubMed] [Google Scholar]
- Ortiz M., Wine J.W., Lohrey N., Ruscetti F.W., Spence S.E., Keller J.R. Functional characterization of a novel hematopoietic stem cell and its place in the c-Kit maturation pathway in bone marrow cell development. Immunity. 1999;10:173–182. doi: 10.1016/s1074-7613(00)80018-7. [DOI] [PubMed] [Google Scholar]
- Orlic D., Fischer R., Nishikawa S., Nienhuis A.W., Bodine D.M. Purification and characterization of heterogeneous pluripotent hematopoietic stem cell populations expressing high levels of c-kit receptor. Blood. 1993;82:762–770. [PubMed] [Google Scholar]
- Osawa M., Hanada K., Hamada H., Nakauchi H. Long-term lymphohematopoietic reconstitution by a single CD34-low/negative hematopoietic stem cell. Science. 1996;273:242–245. doi: 10.1126/science.273.5272.242. [DOI] [PubMed] [Google Scholar]
- Ikuta K., Weissman I.L. Evidence that hematopoietic stem cells express mouse c-kit but do not depend on steel factor for their generation. Proc. Natl. Acad. Sci. USA. 1992;89:1502–1506. doi: 10.1073/pnas.89.4.1502. [DOI] [PMC free article] [PubMed] [Google Scholar]
- Katayama N., Clark S.C., Ogawa M. Growth factor requirement for survival in cell-cycle dormancy of primitive murine lymphohematopoietic progenitors. Blood. 1993;81:610–616. [PubMed] [Google Scholar]
- Li C.L., Johnson G.R. Stem cell factor enhances the survival but not the self-renewal of murine hematopoietic long-term repopulating cells. Blood. 1994;84:408–414. [PubMed] [Google Scholar]
- Gore S.D., Amin S., Weng L.J., Civin C.I. Steel factor supports the cycling of isolated human CD34+ cells in the absence of other growth factors. Exp. Hematol. 1995;23:413–421. [PubMed] [Google Scholar]
- Keller J.R., Ortiz M., Ruscetti F.W. Steel factor (c-kit ligand) promotes the survival of hematopoietic stem/progenitor cells in the absence of cell division. Blood. 1995;86:1757–1764. [PubMed] [Google Scholar]
- Tsuji K., Zsebo K.M., Ogawa M. Enhancement of murine blast cell colony formation in culture by recombinant rat stem cell factor, ligand for c-kit . Blood. 1991;78:1223–1229. [PubMed] [Google Scholar]
- Sitnicka E., Lin N., Priestley G.V., Fox N., Broudy V.C., Wolf N.S., Kaushansky K. The effect of thrombopoietin on the proliferation and differentiation of murine hematopoietic stem cells. Blood. 1996;87:4998–5005. [PubMed] [Google Scholar]
- Matsunaga T., Kato T., Miyazaki H., Ogawa M. Thrombopoietin promotes the survival of murine hematopoietic long-term reconstituting cellscomparison with the effects of FLT3/FLK-2 ligand and interleukin-6. Blood. 1998;92:452–461. [PubMed] [Google Scholar]
- Nosaka T., Kawashima T., Misawa K., Ikuta K., Mui A.L., Kitamura T. STAT5 as a molecular regulator of proliferation, differentiation and apoptosis in hematopoietic cells. EMBO (Eur. Mol. Biol. Organ.) J. 1999;18:4754–4765. doi: 10.1093/emboj/18.17.4754. [DOI] [PMC free article] [PubMed] [Google Scholar]
- Austin T.W., Solar G.P., Ziegler F.C., Liem L., Matthews W. A role for the Wnt gene family in hematopoiesisexpansion of multilineage progenitor cells. Blood. 1997;89:3624–3635. [PubMed] [Google Scholar]
- Varnum-Finney B., Purton L.E., Yu M., Brashem-Stein C., Flowers D., Staats S., Moore K.A., Le Roux I., Mann R., Gray G. The Notch ligand, Jagged-1, influences the development of primitive hematopoietic precursor cells. Blood. 1998;91:4084–4091. [PubMed] [Google Scholar]
- Strasser A., Harris A.W., Huang D.C., Krammer P.H., Cory S. Bcl-2 and Fas/APO-1 regulate distinct pathways to lymphocyte apoptosis. EMBO (Eur. Mol. Biol. Organ.) J. 1995;14:6136–6147. doi: 10.1002/j.1460-2075.1995.tb00304.x. [DOI] [PMC free article] [PubMed] [Google Scholar]
- Traver D., Akashi K., Weissman I.L., Lagasse E. Mice defective in two apoptosis pathways in the myeloid lineage develop acute myeloblastic leukemia. Immunity. 1998;9:47–57. doi: 10.1016/s1074-7613(00)80587-7. [DOI] [PubMed] [Google Scholar]
- Bryckaert M., Guillonneau X., Hecquet C., Courtois Y., Mascarelli F. Both FGF1 and bcl-x synthesis are necessary for the reduction of apoptosis in retinal pigmented epithelial cells by FGF2role of the extracellular signal-regulated kinase 2. Oncogene. 1999;18:7584–7593. doi: 10.1038/sj.onc.1203200. [DOI] [PubMed] [Google Scholar]
- Takeda K., Kaisho T., Yoshida N., Takeda J., Kishimoto T., Akira S. Stat3 activation is responsible for IL-6-dependent T cell proliferation through preventing apoptosisgeneration and characterization of T cell-specific Stat3-deficient mice. J. Immunol. 1998;161:4652–4660. [PubMed] [Google Scholar]
- Shirogane T., Fukada T., Muller J.M., Shima D.T., Hibi M., Hirano T. Synergistic roles for Pim-1 and c-Myc in STAT3-mediated cell cycle progression and antiapoptosis. Immunity. 1999;11:709–719. doi: 10.1016/s1074-7613(00)80145-4. [DOI] [PubMed] [Google Scholar]
- Huang H.M., Huang C.J., Yen J.J. Mcl-1 is a common target of stem cell factor and interleukin-5 for apoptosis prevention activity via MEK/MAPK and PI-3K/Akt pathways. Blood. 2000;96:1764–1771. [PubMed] [Google Scholar]
- Blume-Jensen P., Janknecht R., Hunter T. The kit receptor promotes cell survival via activation of PI 3-kinase and subsequent Akt-mediated phosphorylation of Bad on Ser136. Curr. Biol. 1998;8:779–782. doi: 10.1016/s0960-9822(98)70302-1. [DOI] [PubMed] [Google Scholar]