Abstract
We recently described a novel way to isolate populations of antigen-reactive CD4+ T cells with a wide range of reactivity to a specific antigen, using immunization with a fixed dose of nominal antigen and FACS® sorting by CD4high expression. Phenotypic, FACS®, functional, antibody inhibition, and major histocompatibility complex–peptide tetramer analyses, as well as T cell receptor Vβ sequence analyses, of the antigen-specific CD4high T cell populations demonstrated that a diverse sperm whale myoglobin 110–121–reactive CD4+ T cell repertoire was activated at the beginning (day 3 after immunization) of the immune response. Within 6 d of immunization, lower affinity clones were lost from the responding population, leaving an expanded population of oligoclonal, intermediate affinity (and residual high affinity) T cells. This T cell subset persisted for at least 4 wk after immunization and dominated the secondary immune response. These data provide evidence that CD4+ T cell repertoire selection occurs early in the immune response in vivo and suggest that persistence and expansion of a population of oligoclonal, intermediate affinity T cells is involved in CD4+ T cell memory.
Keywords: T cells, clonal selection, T cell receptor, major histocompatibility complex class II tetramers, immune response
Introduction
For over two decades a dominant approach to studying T cell function has been derivation of T cell clones with strong reactivity to a peptide antigen, followed either by the production of T cell hybridomas or the construction of TCR transgenic mice. These techniques employed a single TCR and varied the dose of antigen to determine T cell functional response. Further analyses of the dominant T cell clones investigated the response of the clones to altered peptide ligands, or suboptimal stimuli, applied in varying doses 1 2 3. These studies produced a steady increase in our knowledge of TCR-mediated cellular function. However, missing from this approach was a clear delineation of how the “dominant” TCR (used subsequently to make T cell clones, T cell hybridomas, and TCR transgenes) emerged from the preexisting T cell repertoire. It is now clear that a single “dominant” clone can respond to many ligands in addition to its natural ligand 4 5, which implies that many T cells should exist with the potential to react to any given peptide antigen 6 7. However, until recently there has not been an effective way to study the emergence of the dominant CD4+ T cell clone from the population of potentially reactive CD4+ T cells. This was due in part to the competitive technique for growing the dominant clone in vitro, which eliminated the other T cells. In addition, the study of T cell responses in vivo was hampered by the low precursor frequency of antigen-specific CD4+ T cells in the naive (unprimed) or even in the primed LNs (1/50,000–300,000 in unprimed mice, 1/1,000–10,000 in primed mice [8–11]). The study of the CD4+ T cell response in vivo has mainly relied on adoptive transfer of T cell clones or studies using cells from TCR-transgenic mice 12 13 14 15. However, all of the transferred T cells shared the same TCR, thus no direct studies could be performed on TCR repertoire development.
Recent work has begun to elucidate the development of the CD4+ T cell repertoire in vivo. The combination of flow cytometry and PCR-based amplification of particular dominant TCR V genes has allowed the examination of the development of an immune response in a nontransgenic animal 16 17 18 19 20 21 22 23, and PCR runoff assays have identified dominant T cell clonal expansions 24 25 26 27. The use of multimeric peptide– MHC class II staining reagents (tetramers) has produced new insights into CD4+ T cell responses in vivo 28 29 30. However, additional approaches are needed to clarify the question of when and how a dominant, restricted repertoire is selected during the CD4+ T cell immune response.
Recently, we described a novel way to isolate the murine antigen-specific CD4+ T cell subpopulation, both in vitro and in vivo 31. We used the DBA/2 response to the sperm whale myoglobin (SWM) peptide 110–121 to show that, upon antigen challenge, CD4+ T cells upregulated cell surface expression of CD4, and that the CD4high subpopulation in vivo, which represented <1% of the CD4+ population, contained the entire population of antigen-specific T cells 31. Subsequently, we have used the CD4high method to study antigen-specific immune responses in vivo to alloantigens 32 and autoantigens 33. Earlier studies from our lab characterized the CD4+ T cell response to SWM 110–121 in DBA/2 mice and had shown utilization of a limited pool of TCR Vβ chains 34 35 36 37 38. The vast majority (>90%) of CD4+ T cell clones and hybridomas derived from SWM 110–121 immune DBA/2 mice used TCR Vβ8.2 with a canonical CDR3 consisting of the amino acid sequence (A/G)WDWx(x) linked to the junctional region Jβ2.6 38 39. Here we characterize the CD4+ T cell clonal selection process using the CD4high marker to isolate the entire SWM 110–121–specific T cell population (not only the dominant responders) at sequential time points in vivo after immunization, assessing changes in the CD4+ T cell repertoire at each time point. Our results suggest that a diverse antigen-specific CD4+ T cell response, using many Vβ sequences and including both high and low affinity cells, was present at the beginning of the immune response (day 3 after immunization), from which intermediate reactivity T cell subsets with more homogenous Vβ8 usage expanded within 6 d after immunization. Functional and phenotypic analyses of these subsets suggested that peripheral selection was taking place in the CD4+ T cell compartment very early in the immune response, which resulted in the expansion of a constricted, intermediate affinity antigen-specific T cell repertoire.
Materials and Methods
Animals.
DBA/2 mice were purchased from The Jackson Laboratory. Females from 8–12 wk of age were used in all experiments.
Peptide.
SWM 110–121 (AIIHVLHSRHPG) was prepared and HPLC purified at the Protein and Nucleic Acid Facility (Beckman Center, Stanford University).
Antigen Proliferation Assays.
For proliferation assays with T cell clones, 2.5 × 10⁴ T cells were incubated in 96-well plates in either T cell media alone or containing two- or fourfold dilutions of SWM 110–121, ranging from 0.003 to 150 μM, and 5 × 10⁵ freshly irradiated syngeneic splenocytes. T cell medium consisted of RPMI 1640 supplemented with 2 mM l-glutamine, penicillin, and streptomycin, nonessential amino acids, sodium pyruvate, and 10 mM Hepes buffer (GIBCO BRL), 5 mM 2-ME (Sigma-Aldrich), and 5% FCS. After 48 h at 37°C, 5% CO2, cells were pulsed with 1 μCi of [3H]thymidine and harvested 18 h later for counting on a Beta plate (Wallac Inc.). Cell proliferation, as counts per minute, was plotted against antigen concentration, and ED50 values were derived by calculating the intercept of the antigen concentration leading to half-maximal proliferation. In the case of noncanonical T cell clones which did not reach a plateau of proliferation at 150 μM of antigen, the lowest possible calculated ED50 was assigned and thus may be an underestimate. For each T cell clone, a mean ED50 value was calculated from at least two independent proliferation assays. To calculate the statistical significance in ED50 value differences between both canonical and noncanonical T cell populations at day 3 after primary immunization, as well as between canonical T cell clones from day 6 after primary and day 4 after secondary immunization, a two sample t test, assuming unequal variances, was performed using Excel (Microsoft Corporation).
Ab Inhibition Assays.
For Ab inhibition assays with T cell clones, 2.5 × 10⁴ T cells were incubated in 96-well plates containing 5 × 10⁵ freshly irradiated syngeneic splenocytes, 30 μM SWM 110–121, and twofold dilutions of anti-Vβ8 Ab (F23.1) ranging from 0 to 2.5 μg/ml. The same medium was used as in the proliferation assays. After 48 h at 37°C, 5% CO2, cells were pulsed with 1 μCi of [3H]thymidine and harvested 18 h later for counting on a Beta plate (Wallac Inc.). The percentage of inhibition of proliferation was calculated for each dose of anti-Vβ8 Ab as follows: {[proliferation (cpm) without any added anti-Vβ8 Ab] − [proliferation (cpm) with anti-Vβ8 Ab]}/[proliferation (cpm) without any added anti-Vβ8 Ab].
FACS® and Limiting Dilution Analysis.
Groups of two to three mice were immunized at the base of the tail with 100 μg SWM 110–121 in CFA. 3, 6, 8, 14, and 28 d later, draining inguinal LN cells were removed and single cell suspensions were prepared. For studying the memory response, DBA/2 mice were first immunized with 100 μg SWM in CFA at the base of the tail, and 4 wk later, challenged through the same route with 100 μg of the same peptide in IFA. 2, 4, 6, 9, and 14 d later, draining inguinal LN cells were removed and single cell suspensions were prepared. The total number of LN cells was determined by counting three times with a hemocytometer. 4 × 10⁷ cells were stained for 20 min at 4°C with 10 μg PE-conjugated anti-CD4 Ab (Caltag) and with 10 μg FITC-conjugated anti-Vβ8 Ab (F23.1; BD PharMingen) in FACS® buffer (Dulbecco's PBS with 2% FCS). The cells were analyzed by FACS® and the highest 1% of CD4highVβ8+ or CD4highVβ8− subsets were sterile sorted. After sorting, small aliquots of positive and negative populations were resuspended in FACS® buffer and analyzed on the FACS® machine used for sorting to assess for percentage of purity of the sorted populations. The cells were placed in limiting dilution culture at 96 replicates per dilution in microwells containing 5 × 10⁵ irradiated DBA/2 spleen cells with 10 μM SWM and 10 U/ml IL-2 final concentrations. After 10 d of incubation (37°C, 5% CO2), individual microcultures were resuspended and divided equally into two new wells. Freshly irradiated DBA/2 spleen cells (5 × 10⁵/well) were then added either in the presence or absence of 10 μM SWM without IL-2. Cultures were incubated 48 h longer and pulsed with 1 μCi of [3H]thymidine during the last 18 h. Positive wells were defined as those exceeding the mean cpm in the absence of antigen by 3 SD. The percentage of negative wells was plotted against cells per plate and analyzed by least-squares linearization using Cricket Graph (Computer Associates, Inc.). The exponential curve-fitting function produced an equation of the form: y = (ω) × 10( z )( x ). ω and z were derived from the data, and the resultant precursor frequency (1/x) was calculated by setting y = 0.37 according to Poisson statistics. The total number of antigen-specific T cells present in the LN of each mouse after each immunization (n) was calculated as follows: n = (z/100)/x, where z is the total number of cells present in the immunized LN and 1/x is the precursor frequency of SWM 110–121–specific T cells in the CD4high population.
Limiting Dilution Analysis T Cell Clones.
At selected time points, duplicate plates were cultured at the time of restimulation; one plate was maintained in culture while the other one was used for proliferative response. Limiting dilution analysis (LDA) T cell clones were subsequently grown from LDA plates which, according to the Poisson statistical analysis, corresponded to ≤1 cell/well. LDA T cell clones were restimulated every 10–14 d with 20 × 106 freshly irradiated DBA/2 spleen cells and 10 μM SWM final concentration. LDA T cell clones were derived from three independent immunizations.
TCR Vβ PCR and Sequence Analysis.
T cells were Ficoll purified 3 d after restimulation with SWM 110–121, and PolyA+–mRNA was prepared using the Microfast Track™ method (Invitrogen). First-strand cDNA synthesis was performed on 2 μg mRNA using an oligo (dT) primer (Promega) and moloney murine leukemia virus reverse transcriptase (GIBCO BRL/Life Technologies). 4% of the reaction was used as a template for PCR amplification. The 5′ TCR Vβ8 primer was 5′-TAA GCG GCC GCG AGG CTG CAG TCA-3′ and the 3′ Cβ primer was 5′-CAG CTC AGC TCC ACG TGG TC-3′. The primer annealing was performed at 55°C for 1 min, the polymerase extension segment at 72°C for 2 min, and the junctional region of the Vβ8−-containing transcripts was amplified using these two primers in a thermal cycler (PerkinElmer) for 30 cycles. PCR products were directly sequenced using the Thermo Sequenase radiolabeled terminator cycle sequencing kit (Amersham Pharmacia Biotech/Life Science Inc.) and displayed on a 6% acrylamide gel.
SWM 110–121–specific Soluble EαAβ MHC Class II–SWM Tetramer Construction and Analysis.
PE-streptavidin–(IEAd SWM)tetramer (PESA–[IEAdSWM]tetramer) was prepared as described previously 36, with the following modifications.
The genes for IEα and IAβd were introduced into a single baculovirus. Sequences encoding the SWM peptide and a flexible peptide linker were attached to the 5′ end of the gene 40 41 42 and a sequence encoding a linker and peptide substrate for biotinylation was attached to the 3′ end of the gene 28.
Soluble IEAdSWM–BirA was purified from culture supernatants of infected High 5 insect cells (Invitrogen) using mAb 14-4-4 immunoaffinity chromatography. IEAdSWM–BirA was eluted with 50 mM NaCO3, pH 10.8, and neutralized with 0.88 M Tris, pH 6.9. Pepstatin (0.7 μg/ml), leupeptin (1 μg/ml), PMSF (0.1 mM), and SWM 110–121 peptide (0.34 mg/ml) were added, and eluted protein was centricon-30 concentrated and exchanged into 50 mM bicine, pH 8.3, containing pepstatin, leupeptin, and PMSF. Purified IEAdSWM–BirA was biotinylated with BirA enzyme (Avidity). 800 μg IEAdSWM–BirA at 1.6 mg/ml was incubated with 12 μg BirA enzyme and 25 μg SWM 110–121 peptide in 50 mM bicine, pH 8.3, with 10 mM ATP, 10 mM magnesium acetate, and 40 μM biotin, pepstatin (0.7 μg/ml), leupeptin (1 μg/ml), and PMSF (0.1 mM) overnight at room temperature. To remove reactants and nonmonomeric IEAdSWM–biotin (Bio), the reaction mixture was passed over a Superdex 200HR10/30 size exclusion column (Amersham Pharmacia Biotech) in PBS with 5 mM NaN3 (PBSA). Monomeric IEAdSWM-Bio was pooled and concentrated, and pepstatin, leupeptin, and PMSF were added. The extent of biotinylation was 96%, as determined by ELISA 28.
PESA–(IEAdSWM)tetramer was formed by incubating 130 μg IEAdSWM–Bio and 20 μg PESA (Rockland) in PBSA with pepstatin, leupeptin, and PMSF on ice for 30 min. The mixture was passed over a Superdex 200HR10/30 column to separate PESA–(IEAdSWM)tetramer from monomeric IEAdSWM. Pepstatin, leupeptin, and PMSF were added to fractions. The PESA–(IEAd SWM)tetramer peak was concentrated, and OD280 was determined. We assume 1 OD280 = 1 mg/ml. The monomer peak was analyzed for percentage of biotinylation, and found to contain ample biotinylated IEAdSWM. This finding indicated that the biotin-binding sites on the tetramer were saturated.
2 × 10⁵ clonal T cells or 105 hybridoma T cells in 30 μl CTM (medium for T cells) were incubated with 20 μl of PESA–(IEAd SWM)tetramer (diluted in T cell medium with 12.5 mM NaN3) at 50 μg/ml, for a final concentration of 20 μg/ml PESA–(IEAd SWM)tetramer. Incubation was in 10% humidified CO2 at 37°C. CD4-Cychrome was added to the wells, and the plate was kept for 20 min at 4°C. Cells were washed three times before analysis on an Epics XL flow cytometer (Beckman Coulter).
Results
Kinetics of the Antigen-specific CD4+ T Cell Response to SWM 110–121 In Vivo.
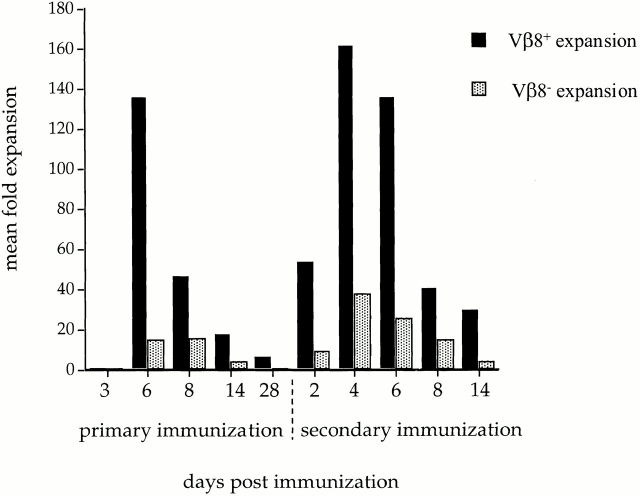
At various time points after primary or secondary immunization with SWM 110–121, LN cells from DBA/2 animals were harvested and stained for CD4high and Vβ8 expression. LDA established the precursor frequency of both CD4highVβ8+ and CD4highVβ8− T cell populations at each selected time point. Data presented in Table show the results of one of three or more LDA experiments performed at each selected time point for the CD4highVβ8+ population. The total number of antigen-specific T cells present in the draining LN was estimated from the calculated precursor frequencies and absolute numbers of CD4+ T cells in the LN preparation (Table ). The results of repeated LDA experiments are summarized in Fig. 1. These data demonstrate the relative expansion of antigen-specific T cells during the course of the primary and secondary immune response in both the CD4highVβ8− and CD4highVβ8+ populations. The antigen-specific precursor frequency of the CD4highVβ8+ T cells at day 3 after primary immunization (1/3,150) was near a baseline level at 33 antigen-specific T cells in the immunized LN 8 9 10 11. In the next 3 d, the number of antigen-specific T cells in the CD4highVβ8+ population increased rapidly to reach a maximum, at day 6, of >4,400 CD4highVβ8+ T cells in the draining LN, corresponding to a 136-fold expansion in the number of antigen-specific CD4highVβ8+ T cells from day 3 (Fig. 1). The number of antigen-specific T cells decreased threefold by day 8, and by day 28, only 5% of the peak antigen-specific CD4+ T cell number was still present (Fig. 1).
Table 1.
| Days after immunization | Precursor frequency | Number of LN cells | Total number of SWM-specific Vβ8+ cells | |
|---|---|---|---|---|
| 1/x | z × 106 | (z/100)/x | ||
| Primary | 3 | 1/3,150 | 10.23 | 33 |
| 6 | 1/38 | 12.8 | 3,368 | |
| 8 | 1/65 | 9.44 | 1,452 | |
| 14 | 1/362 | 15.6 | 431 | |
| 28 | 1/405 | 8.73 | 215 | |
| Secondary | 2 | 1/217 | 23.55 | 1,085 |
| 4 | 1/37 | 20.95 | 5,662 | |
| 6 | 1/42 | 20.00 | 4,762 | |
| 8 | 1/76 | 12.65 | 1,665 | |
| 14 | 1/125 | 10.35 | 828 |
Determination by LDA of antigen-specific precursor frequencies in the CD4highVβ8+ population. The total number of antigen-specific precursor cells present in the LNs during the primary and secondary response to SWM 110–112 in the Vβ8+ population was derived from the precursor frequency of antigen-specific T cells in the CD4highVβ8+ subset and from the total number of LN cells (z), using the equation n = (z/100)/x. CD4highVβ8+ cells were sorted from primed LNs at days 3, 6, 8, 14, and 28 after primary immunization and days 2, 4, 6, 8, and 14 after secondary immunization. LDA was performed and the precursor frequency (1/x) was derived by Poisson statistics as described in Materials and Methods. Shown are the results of one representative LDA experiment performed at each selected time point.
Figure 1.
Kinetics of antigen-specific precursor frequencies during the primary and secondary response in vivo. Mean fold expansion of antigen-specific CD4high Vβ8+ and Vβ8− T cells during the primary and memory response to SWM 110–121, starting at day 3 after primary immunization for the baseline precursor frequency. The total number of antigen-specific T cells present at each given time point was determined by LDA as shown in Table and described in Materials and Methods. The mean total number of antigen-specific T cells used to determine the expansion of antigen-specific T cells was the result of two or three independent LDA experiments. The expansion was then calculated by dividing the mean total number of antigen-specific T cells present on a given day by the number of antigen-specific precursor cells present in day 3 cultures after primary immunization.
To delineate the CD4+ T cell memory response, mice were reimmunized 28 d after primary immunization and the memory response was studied using CD4high T cells. The baseline precursor frequency in the CD4highVβ8+ population immediately before secondary challenge was 6.6-fold higher than the number of antigen-specific T cells present at baseline, day 3 after primary immunization (Fig. 1). The CD4+ T cell recall response reached its maximum precursor frequency 4 d after secondary challenge, 2 d earlier than in the primary response (Fig. 1). The total number of antigen-specific CD4+ T cells present at days 4 and 6 of the memory response was not statistically different from that seen at the peak of the primary response, and corresponded to a 24-fold expansion of the existing CD4highVβ8+ T cells present 28 d after priming. Not only was the memory response more rapid than the primary response, but it was also more sustained after the peak of the response was reached, taking longer for the number of CD4highVβ8+ T cell precursors to fall to levels similar to those seen after the primary response (Fig. 1).
The CD4highVβ8− population kinetics were similar to the CD4highVβ8+ kinetics, although the relative cell expansions were less. There was a 13.5-fold expansion in antigen-specific CD4highVβ8− T cells between days 3 and 6 of the primary response but, similar to the CD4highVβ8+ population, by 4 wk after primary immunization the precursor frequency of antigen-specific T cells in the CD4highVβ8− population decreased to 5.5% of the peak cell number (Fig. 1). The memory response in the CD4highVβ8− population was also more rapid and enhanced than the primary response, with a 37.5-fold increase in the number of precursors in the first 4 d after reimmunization and a peak which was 2.5 times higher than the peak of the primary response (Fig. 1). Data presented in Fig. 1 show the dominant expansion of the CD4highVβ8+ population compared with the CD4highVβ8− population. The presence of a significant antigen-specific response in the Vβ8− population of sorted CD4high cells was surprising; previously, our lab had only rarely been able to isolate SWM 110–121–reactive Vβ8− CD4+ T cells from bulk cultures in vitro 34 35 36 37 38 39.
The Antigen-specific CD4high T Cell Population Is Functionally Heterogeneous Early in the Immune Response but Rapidly Evolves towards Functional Homogeneity.
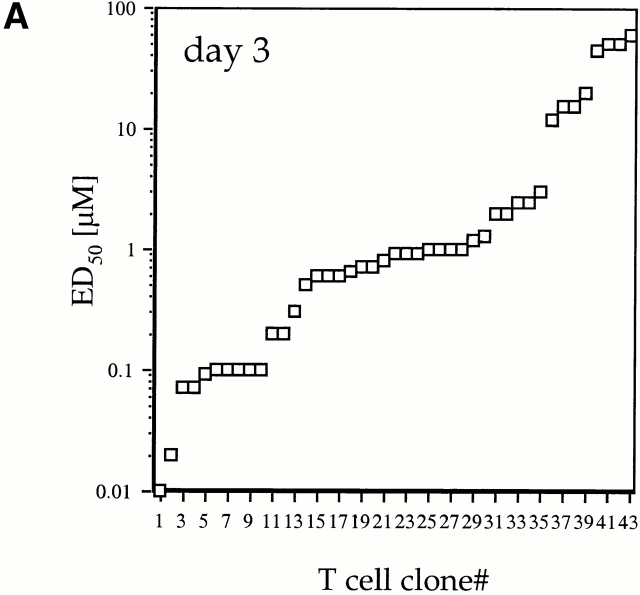
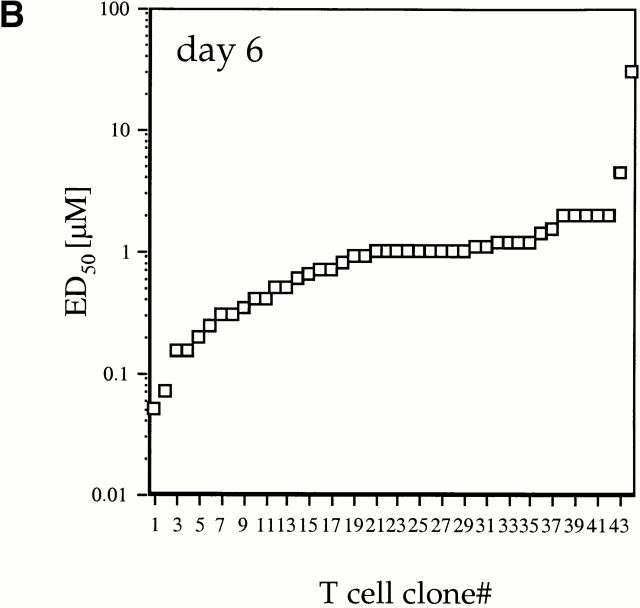
To test the hypothesis that the responding T cell population differed at day 3 and day 6 after priming, we produced a representative population of T cell clones at each time point by sorting CD4highVβ8+ T cells directly from LNs, performing LDA, and selecting cells for expansion from plates with precursor frequencies approximating one cell per well as calculated by Poisson statistics. This approach avoided potential tissue-culture artifacts due to competition for growth between different clones in the same well. The LDA T cell clones were tested for proliferative response. The proliferative responses of the day 3 LDA-derived clones, displayed in rank order, represented >3 logs of distribution in their ED50 values (Fig. 2 A). The ED50 values were stable in repeated assays (SEM ≤ 10%). The nature of the rank order distribution of ED50 values in the day 6 group was more homogenous: most of the responses were near a mean ED50 of 1 μM with a few outliers on each end (Fig. 2 B). Most of the contraction of the immune response was due to loss of high ED50 cells. This analysis of ED50 distribution raised the possibility that between days 3 and 6 after primary immunization, expansion of intermediate reactivity antigen-specific CD4+ T cells and loss of low reactivity antigen-specific CD4+ T cells had taken place.
Figure 2.
Distribution of ED50 values in CD4high LDA T cell clones. CD4highVβ8+ cells sorted from primed LNs 3 and 6 d after primary immunization were expanded from limiting dilution cultures. For each selected time point, T cell clones were derived from three independent immunizations. (A) 44 LDA clones derived from day 3 and (B) 44 LDA clones derived from day 6 cultures after primary immunization were tested for proliferative response, and the mean ED50 values were plotted in rank order. Each LDA clone was tested at least twice (SEM ≤ 10%) in order to determine a mean ED50 (as described in Materials and Methods).
TCR Sequence Analysis of the Antigen-specific TCR Repertoire during the Primary and Secondary Response.
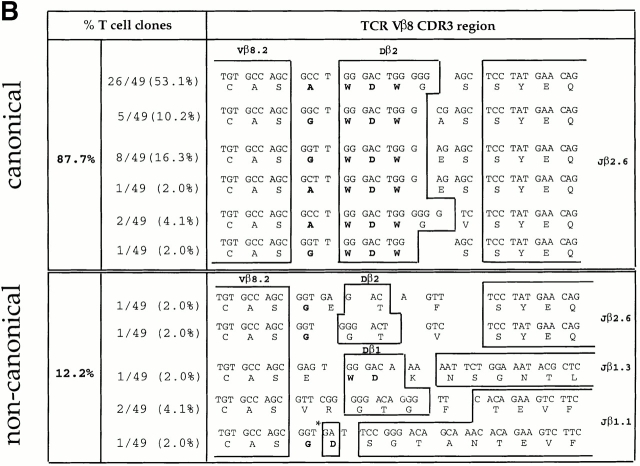
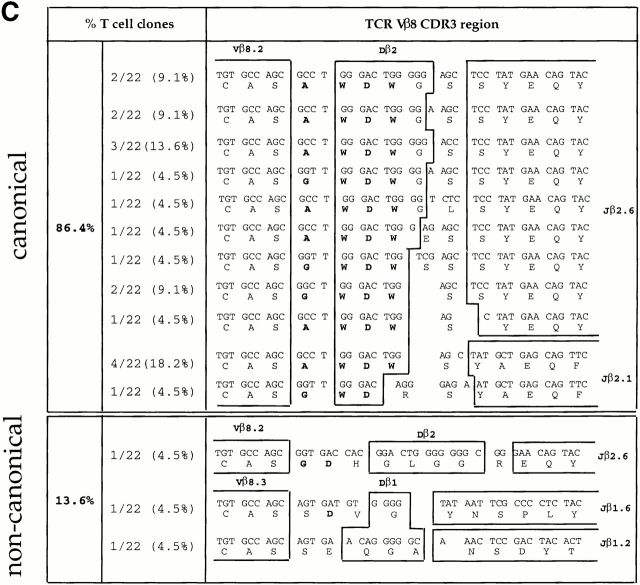
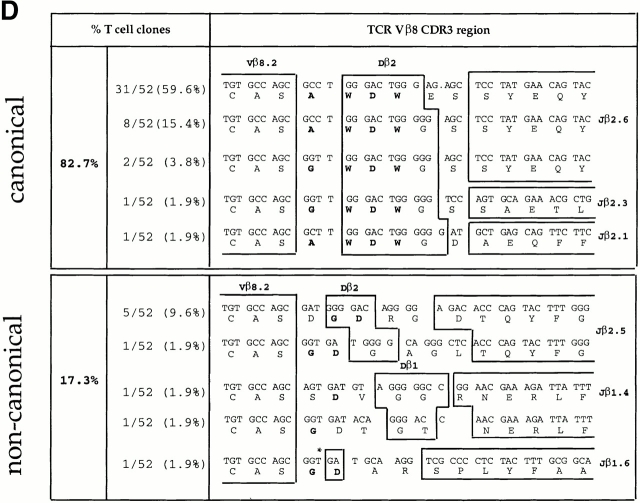
To determine whether clonal expansion occurred between days 3 and 6 of the primary response (as suggested by the emergence of a dominant ED50 value in the population; Fig. 2), we sequenced the junctional regions of the TCR Vβ chains of the Vβ8+ LDA clones. Almost half of the Vβ8+ LDA clones (42.6%) isolated at day 3 displayed “noncanonical” CDR3 junctional regions (Fig. 3 A). However, in agreement with previous studies from our lab, data presented in Fig. 3 B demonstrate that the majority (87.7%) of LDA clones found at the peak of the primary immune response (day 6) displayed the previously described canonical CDR3, consisting of the amino acid sequence (A/G) WDWx(x) linked to the junctional region Jβ2.6 (32 33; Fig. 3 B). Within the canonical group, 53.1% of the LDA clones displayed the identical specific clonotype AWDWGS (Fig. 3 B). The “memory” T cell clones found 4 wk after primary immunization, but before restimulation, displayed a majority (86.4%) of canonical CDR3 regions; however, no preference for a specific clonotype was found (Fig. 3 C). In contrast, at the peak of the recall response (4 d after restimulation with antigen in vivo) not only did the majority (82.7%, 43/52) of the LDA clones examined contain canonical CDR3 regions, but an obvious preference for the specific clonotype Vβ8.2-AWDWES-Jβ2.6 (59.6%, 31/52) was also found (Fig. 3 D). In summary, after day 6 of the primary response, no further shift in T cell repertoire towards T cells expressing the canonical TCR was observed; the canonical/noncanonical TCR ratio was the same at days 6, 28, and 32 (4 d after repriming; Fig. 3a Fig. b Fig. c Fig. d).
Figure 3.
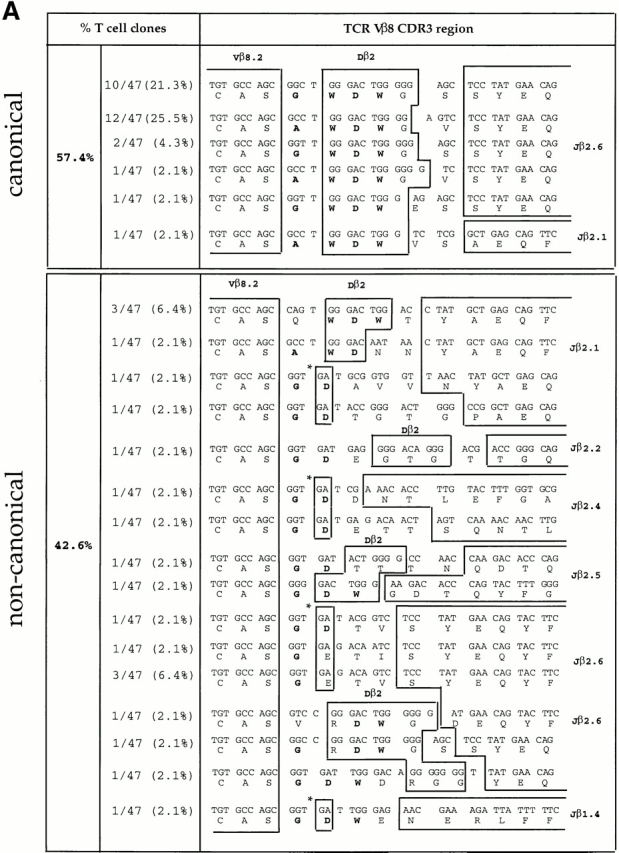
TCR Vβ CDR3 sequence analysis of CD4high LDA T cell clones. CD4highVβ8+ cells sorted from the primed LNs at days 3, 6, and 28 after primary immunization and at day 4 after secondary immunization with SWM 110–121 were expanded from limiting dilution cultures. For each selected time point, T cell clones were derived from three independent immunizations. TCR Vβ CDR3 sequence analysis was performed on (A) 47 LDA clones from day 3, (B) 49 LDA clones from day 6, (C) 22 LDA clones from day 28 after primary immunization, and (D) 52 LDA clones from day 4 after secondary immunization. Each clone was tested for antigen specificity in a proliferation assay (Fig. 4, and data not shown). The alignment is based on common use of the Vβ8 segment. Boxes separate germline sequences from N-region additions. Each TCR Dβ and Jβ assignment is displayed next to the corresponding sequence. The predicted amino acid sequence is displayed below each corresponding sequence. Sequences which contain the CDR3 amino acid composition (A/G)WDWx(x) (in bold) are listed as canonical; the other sequences are considered noncanonical. The numbers of clones displaying a particular clonotypic sequence as well as percentages of canonical and noncanonical sequences are listed. *No assignment to either a Dβ1 or a Dβ2 germline sequence could be made.
Functional Analysis of the Antigen-specific CD4high T Cell Population Directly Correlated TCR Sequence with TCR Reactivity.
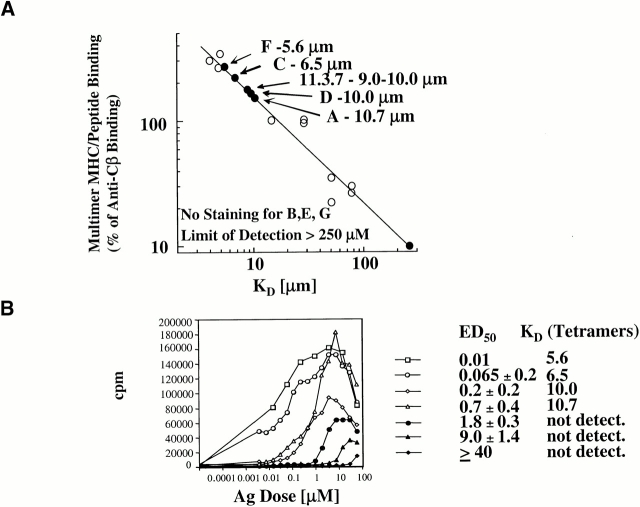
As the amino acid composition of the CDR3 loop of most canonical LDA clones isolated at day 6 was similar to the canonical clones seen at day 3 (Fig. 3a and Fig. b), we asked whether a functional difference between canonical and noncanonical LDA T cell clones was responsible for the expansion of clones containing the canonical CDR3 region observed between days 3 and 6 of the primary immune response. Our lab has shown that avidity differences in TCR–antigen–MHC interactions lead to shifts in ED50 values (the antigen dose required to reach half-maximal proliferation), with lower avidities leading to higher ED50 values and vice versa 1. In these experiments, antigen dose and the affinity of the peptide for the MHC were constants, and the TCR density was comparable on sampled T cell clones by FACS® analysis (data not shown). Therefore, the system described here could be used to provide information about the reactivity of the TCR of the T cell clones for the antigenic ligand SWM 110–121 by measuring their ED50 values in a proliferation assay.
44 LDA clones from day 3 cultures and 44 LDA clones from day 6 cultures were tested for proliferation in response to SWM 110–121 to determine their ED50 values compared with their TCR sequences (Table ). Generally, T cell clones with low ED50 values (<2 μM) contained the canonical CDR3 region, whereas T cell clones displaying high ED50 values (>10 μM) always expressed a noncanonical CDR3 region. In LDA clones from day 3 cultures, the mean ED50 value for all T cell clones with the canonical TCR (n = 27/44) was 24-fold lower than in the noncanonical group (P < 0.0036; Table ). In LDA clones from day 6 cultures, the mean ED50 value for all LDA clones displaying the canonical TCR (n = 40/44) was nine times lower than the group displaying the noncanonical TCRs (Table ). We next examined the ED50 values of LDA clones expressing the canonical TCR, derived 4 d after secondary immunization, to determine whether a further major shift in ED50 values occurred in the memory response. The mean ED50 of sampled LDA clones expressing the canonical TCR sequence obtained at the peak of the secondary response was statistically indistinguishable from that seen in the “canonical group” of day 6 LDA clones, obtained after primary immunization (0.86 and 0.36 μM [P = 0.96]).
Table 2.
| Number of clones | Mean ED50 ± SE | |
|---|---|---|
| 3 d after primary immunization | ||
| Canonical | 27/44 (61.4%) | 0.74 ± 0.15 |
| Noncanonical | 17/44 (38.6%) | 19.11 ± 5.4 (P < 0.0036) |
| 6 d after primary immunization | ||
| Canonical | 40/44 (91.0%) | 0.97 ± 0.15 |
| Noncanonical | 4/44 (9.0%) | 8.4 ± 7.2 |
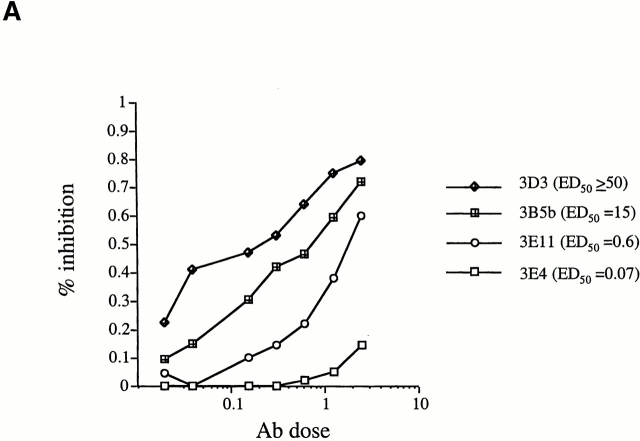
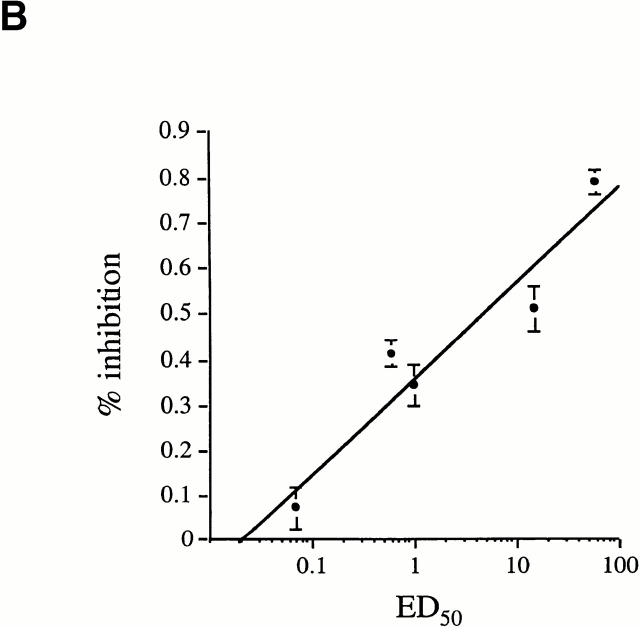
To correlate the ED50 value with the reactivity of the TCR for the antigenic ligand, it was necessary to demonstrate that the observed ED50 values resulted from a TCR signal. Comparable expression of major costimulatory molecules including CD28, B7-1, B7-2, and CD4, on T cell clones displaying higher and lower ED50 values could be seen by FACS® analysis (data not shown). In addition, a more direct assay was performed to demonstrate the role of the TCR in determining the proliferative capacity of the clones. Titrated doses of anti-Vβ8 Abs were used in Ab inhibition assays to inhibit the proliferative response of the T cell clones (which all used the Vβ8 TCR). Ab inhibition experiments were performed on Vβ8+ T cell clones displaying different ED50 values (over a range of 2 logs; 0.07–60 μM). Data presented in Fig. 4 A show inhibition curves for representative T cell clones, all with different ED50 values. At a fixed dose of SWM 110–121, a lower ED50 value of the T cell clone necessitated a higher Ab dose to reach the same threshold of inhibition (Fig. 4 A). Data presented in Fig. 4 B show the results of Ab inhibition assays for all T cell clones tested. A linear inverse correlation was found between the ED50 value of a T cell clone and the percentage of inhibition of the proliferative response. T cell clones displaying low ED50 values were inhibited less at a given dose of Ab than T cell clones displaying a higher ED50 (Fig. 4 B). Furthermore, inhibition curves of T cell clones displaying comparable ED50 values were superimposable in this inhibition assay. These results demonstrated that the distribution in ED50 values observed in the LDA T cell clone population resulted from an effect mediated by the TCR. In other words, the measured ED50 values were a direct result of the reactivity of a particular TCR for its ligand, as TCR density, antigen dose, and affinity of peptide for the MHC were kept constant.
Figure 4.
Direct correlation between TCR function and ED50 values. (A) Inhibition of proliferation in response to 30 μM SWM 110–121 by titrated doses of anti-Vβ8 Ab. Inhibition curves for four representative T cell clones are shown. The mean ED50 value of each respective T cell clone is 3D3 (ED50 ≥ 50 μM), 3B5b (ED50 = 15 μM), 3E11 (ED50 = 0.6 μM), and 3E4 (ED50 = 0.07 μM). (B) Shown is the correlation between the ED50 values of nine T cell clones and the percentage of inhibition of proliferative response to 30 μM SWM 110–121 when 1.25 μg/ml anti-Vβ8 Ab was added to the culture. At ED50 = 1 μM and ED50 = 50 μM, three different T cell clones displaying identical ED50 were tested to determine the percentage of inhibition of proliferation. Each T cell clone was tested at least twice. Error bars represent the SEM.
The results from proliferation assays, TCR Vβ sequence analysis, and TCR-specific Ab inhibition curves all suggested that the ED50 as measured by thymidine incorporation correlated with TCR affinity to MHC–peptide. To formally demonstrate this, we developed an MHC–SWM 110–121 tetramer reagent, whose binding has been shown to be directly proportional to biochemical affinity 29. Representative clones were assayed for tetramer binding compared with a panel of control (known) TCRs with established affinity, as well as to the previously generated SWM-reactive T cell hybridoma 11.3.7 (Fig. 5 A). The TCR dissociation constants (K D) were estimated for the SWM-reactive clones from these data (Fig. 5 A). The order of the estimated K D correlated precisely with the ED50, as measured by proliferation assays (Fig. 5 B). Notably, several noncanonical clones were below the limit of detection of the tetramer system despite having a measurable proliferative response to the SWM peptide. Previous studies in one of our labs had also demonstrated that low affinity/high ED50 T cell clones (reactive to the 3K peptide) failed to stain with their specific tetramer reagent despite producing IL-2 in response to the peptide 29. Using MHC-transfected L cells, we demonstrated that these low affinity, non–tetramer-binding SWM-reactive clones were restricted by the I-AαEβ restriction element, just as were the high affinity clones (data not shown). In addition, all clones were tested and shown to respond against whole SWM to prove that peptide reactivity corresponded to true SWM reactivity for each clone (data not shown). Collectively, the results demonstrated that ED50 was a reliable indicator of TCR affinity for MHC–SWM 110–121 in our system.
Figure 5.
Correlation between tetramer staining and TCR affinity. (A) SWM 110–121–specific MHC–SWM tetramers constructed as described in reference 36 and Materials and Methods were used to stain representative SWM reactive T cell clones. The corrected mean fluorescence intensity was normalized to the level of staining with a biotinylated anti-Cβ mAb detected with PESA. The normalized staining was used to estimate the K D of each clone TCR from a previously constructed standard (references 28 and 42) curve relating staining intensity to known TCR K D (reference 28). (B) Correlation between estimated K D and ED50. The clones are the same as used for tetramer analysis in A.
Discussion
The results presented here demonstrate that TCR-based selection in the peripheral CD4+ T cell compartment occurred early during an antigen-specific immune response in vivo. We determined the kinetics of the primary and secondary T cell immune response to SWM 110–121 in vivo, examining both the CD4highVβ8+ and CD4highVβ8− populations, by performing LDA on the CD4high population of primed LN cells using our recent finding that, upon antigen challenge, antigen-specific T cells upregulate cell surface expression of CD4 30 31 32 33. As expected from our previous studies, a dominant SWM 110–121–specific response was observed in the CD4highVβ8+ T cell population. A rapid increase in antigen-specific T cell precursor frequency was seen between days 3 and 6 of the primary immune response (Fig. 1). Within 2 wk of primary immunization, only 5% of the peak precursor number was present; however, this represented a 6.6-fold higher baseline precursor frequency of CD4highVβ8+ T cells at day 28 compared with day 3 (Table ). The secondary response in both the Vβ8+ and Vβ8− populations was more rapid and more sustained than the primary response (Fig. 1). The CD4high approach revealed the expected dominant antigen-specific Vβ8+ T cell population, but also demonstrated a Vβ8− antigen-specific T cell population reactive to SWM 110–121. This was surprising, as our lab and others (using T cell clones and hybridomas) had only rarely isolated Vβ8− SWM 110–121–specific T cells from bulk cultures 34 35 36 37 38 39. Combined with our previous studies, these data suggest that SWM 110–121–specific Vβ8− T cells cannot readily expand in bulk culture when Vβ8+ SWM 110–121–specific T cells (derived from a primary immunization) are present, consistent with the observation that the degree of heterogeneity in long term T cell lines is less than in freshly obtained LN cells, indicating that a selection process occurs in vitro 43.
Although the total number of antigen-specific T cells in the CD4highVβ8− and CD4highVβ8+ populations in vivo was comparable during the primary and secondary response, the kinetics demonstrate the dominant expansion of the Vβ8+ subset (Fig. 1). The dominance of the Vβ8+ T cells was not due to the fact that Vβ8+ SWM-reactive T cells outnumbered the Vβ8− cells at the onset of the immune response, as the number of total antigen-specific precursors (as determined by day 3 LDA) was 2.7-fold higher in the CD4highVβ8− population than the CD4highVβ8+ population (Fig. 1). However, selection of Vβ8+ SWM-reactive T cells occurred rapidly and by day 6, 3.7 times fewer Vβ8− than Vβ8+ cells were present. Between days 3 and 6 of the primary immune response, we observed a 136-fold expansion in the number of antigen-specific T cells in the CD4highVβ8+ subset compared with only a 13.5-fold expansion in the CD4highVβ8− T cells subset (Fig. 1). Therefore, our data suggest that in vivo, SWM 110–121–specific Vβ8+ T cells have a selective advantage compared with SWM 110–121–specific Vβ8− T cells.
We have presented four lines of evidence that support the idea that clonal maturation of the peripheral T cell repertoire occurs early during the immune response in vivo, and reflects a process of TCR-based selection of the antigen-specific T cells. First, as opposed to the continuous distribution in ED50 values of LDA T cell clones isolated at day 3 (which reflected the heterogeneous nature of the population of T cells seen after the primary immunization; Fig. 2 A), the majority of the Vβ8+ LDA clones from day 6 displayed similar ED50 values, with only a few outliers on each side (Fig. 2 B), suggesting that a selection for Vβ8+ LDA clones had taken place in vivo. Second, TCR sequence analysis performed on LDA clones derived from days 3, 6, and 28 of the primary response, and day 4 of the secondary response, indicated a strong bias towards selecting T cells containing the canonical amino acid composition (A/G)WDWx(x) in their CDR3. Third, our ED50 analysis showed that the skewing towards a “canonical” TCR sequence in the population correlated with a selection of T cells that displayed lower ED50 values (higher reactivity), i.e., a functional change in the T cell repertoire correlated precisely with a TCR structural change (Table ). Fourth, MHC–peptide tetramer analysis of the clones demonstrated a precise correlation between ED50 and TCR affinity (K D; Fig. 5), suggesting that selection was based on both sequence and affinity of the TCR Vβ CDR3 region.
Our data demonstrate that TCR-based repertoire selection for CD4+ T cells with an intermediate affinity for antigen takes place at the beginning of the primary immune response. TCR repertoire selection occurring in the CD4+ T cell repertoire during the first 6 d of a primary immune response is difficult to demonstrate, primarily due to lack of technical means for tracking a wide population of different antigen-specific CD4+ T cells at early time points after primary immunization. TCR repertoire maturation (i.e., narrowing in T cell repertoire) has been shown recently using different antigen immunization models to occur after secondary antigenic challenge 18 19 20 44. In their pigeon cytochrome c (PCC) immunization model, McHeyzer-Williams et al. demonstrated that the CD4+ T cell secondary (memory) response to PCC was more homogeneous than the primary response in terms of CDR3 loop length and amino acid composition 18 19 20 45. The overall kinetics of dominant expansion shown here are similar to those demonstrated in the PCC system 18 19. However, in our system, the TCR repertoire at the peak of the memory response was not demonstrably more homogeneous than that seen at the peak of the primary immune response. The only time we observed a major change in the proportion of “canonical” to “noncanonical” TCRs was at the beginning of the primary response (from days 3 to 6); the second McHeyzer-Williams study saw a similar early expansion of antigen-specific cells, although they reported a further narrowing in the secondary response in their PCC system 20. For at least 4 wk after primary immunization, we saw no changes in the percentage of canonical to noncanonical TCR expression, and the same canonical TCR seen at the peak of primary response was used at the peak of the memory response.
Anti-TCR Ab inhibition and MHC–SWM 110–121 tetramer assays demonstrated that the measured ED50 values, in this system, were directly controlled by the TCR of the T cell clones. This result is in agreement with results from several groups, which showed (using surface plasmon resonance to measure affinity) that the main signal event in T cell activation occurs through TCR engagement, and that there exists an extremely good correlation between the duration (half-life) of the TCR interaction with the ligand, peptide–MHC complex, and the biological (i.e., proliferative) response of the T cell 46 47 48 49 50. Of additional interest is our finding that low-affinity T cell clones can be undetectable by a tetramer-based detection system (Fig. 5), which has also been reported using other CD4+ T cell–tetramer systems 29. This points to inherent limits in the assays currently used to detect “antigen-specific” CD4+ T cells. Functional assays (such as those based on proliferation) may not detect all reactive cells (e.g., TCR-mediated cytokine stimulation in absence of cell cycling could be overlooked), whereas tetramer reagents may not bind TCRs of lower affinity. Both methods would then systematically underestimate precursor frequency. In this study, we found comparable expression of major costimulatory molecules (CD28, B7-1, B7-2, and CD4) among T cell clones displaying higher and lower ED50 values. Although adhesion molecules are important in bringing cells together for TCR engagement to occur 51 52, they are not central to the signaling event 53 54. Therefore, we conclude that in our experiments, the observed T cell proliferative response was a direct reflection of the TCR reactivity for its ligand. Our analysis showed that the ED50 values we found for memory phase–derived T cell clones expressing canonical CDR3 regions were indistinguishable from those of canonical LDA clones isolated on day 6 after primary immunization. These data suggest that the more rapid and enhanced memory response was not due to the ability of memory T cells to proliferate more efficiently upon encounter with the antigen (as they displayed ED50 values in vitro comparable to primary LDA clones), but to the elevated precursor frequency present at the end of the primary response.
Our results clearly demonstrate that a TCR repertoire selection process occurred early in the immune response in vivo, resulting in a relatively homogenous population of CD4+ T cells with a TCR-determined intermediate reactivity to antigen. The results of the MHC–SWM tetramer analysis suggest that the TCR-based, TCR sequence–dependent, intermediate reactivity demonstrated here should be referred to as “TCR affinity” (and hence the selection process demonstrated here described as “affinity selection”), although this is currently a matter of controversy, as both kinetics and affinities of TCR interactions are crucial in determining the biological reactivity of a T cell 30 49 55. The direct effect of the different TCR sequences on the function of T cells involved in the early immune response demonstrated here may also be mediated by the effect of TCR structure on the kinetics (half-life and off-rate) of the TCR–peptide interaction, and hence reflect “kinetic selection” mediated by the TCR, as recently reported by Savage et al. 30. This group showed that memory and primary T cell populations responsive to PCC differed in their binding kinetics to peptide–MHC tetramers, suggesting a kinetic basis for the TCR repertoire maturation observed previously 18 19 20 30. Our results differ from studies by both Savage et al. in a CD4+ system and Busch et al. in a CD8+ system in that we did not see a narrowing of the range of response after secondary antigen challenge 30 55. Furthermore, we saw a similar average antigen reactivity of the T cells in our secondary immune response: in our results, the same canonical sequence and ED50 values dominated at the peak of the primary and secondary responses.
Other antigen–MHC–TCR systems should be studied in the future by multiple approaches to clarify which system shows “typical” immune repertoire selection behavior in vivo. However, regardless of whether the TCR-based selection of the CD4+ T cell repertoire response to antigen challenge is due to TCR-based kinetics or TCR-based affinity, the process demonstrated here clearly fulfills the criteria of what Burnett envisioned as clonal selection in the CD4+ T cell compartment 56.
Acknowledgments
The authors wish to thank Drs. Dewey Kim and Dirk Brockstedt for reading and discussing the manuscript, Mrs. Robyn Kizer for her excellent secretarial assistance, and Ms. Cariel Taylor for technical assistance.
This work was sponsored by National Institutes of Health grants CA65237, DK39959, AI17134, and DK44837. W.M. Ridgway was supported by the Howard Hughes Medical Institute.
Footnotes
Abbreviations used in this paper: Bio, biotin; LDA, limiting dilution analysis; PCC, pigeon cytochrome c; SWM, sperm whale myoglobin.
References
- Kim D.T., Rothbard J.B., Bloom D.D., Fathman C.G. Quantitative analysis of T cell activationrole of TCR/ligand density and TCR affinity. J. Immunol. 1996;156:2737–2742. [PubMed] [Google Scholar]
- Sloan-Lancaster J., Allen P.M. Altered peptide ligand-induced partial T cell activationmolecular mechanisms and role in T cell biology. Annu. Rev. Immunol. 1996;14:1–27. doi: 10.1146/annurev.immunol.14.1.1. [DOI] [PubMed] [Google Scholar]
- Hampl J., Chien Y.H., Davis M.M. CD4 augments the response of a T cell to agonist but not to antagonist ligands. Immunity. 1997;7:379–385. doi: 10.1016/s1074-7613(00)80359-3. [DOI] [PubMed] [Google Scholar]
- Kersh G.J., Allen P.M. Essential flexibility in the T-cell recognition of antigen. Nature. 1996;380:495–498. doi: 10.1038/380495a0. [DOI] [PubMed] [Google Scholar]
- Garcia K.C., Degano M., Pease L.R., Huang M., Peterson P.A., Teyton L., Wilson I.A. Structural basis of plasticity in T cell receptor recognition of a self peptide-MHC antigen. Science. 1998;279:1166–1172. doi: 10.1126/science.279.5354.1166. [DOI] [PubMed] [Google Scholar]
- Casanova J.L., Maryanski J.L. Antigen-selected T-cell receptor diversity and self-nonself homology. Immunol. Today. 1993;14:391–394. doi: 10.1016/0167-5699(93)90140-G. [DOI] [PubMed] [Google Scholar]
- Ignatowicz L., Kappler J., Marrack P. The repertoire of T cells shaped by a single MHC/peptide ligand. Cell. 1996;84:521–529. doi: 10.1016/s0092-8674(00)81028-4. [DOI] [PubMed] [Google Scholar]
- Ford D., Burger D. Precursor frequency of antigen-specific T cellseffects of sensitization in vivo and in vitro. Cell. Immunol. 1983;79:334–344. doi: 10.1016/0008-8749(83)90075-8. [DOI] [PubMed] [Google Scholar]
- Gebel H.M., Scott J.R., Parvin C.A., Rodey G.E. In vitro immunization to KLH. II. Limiting dilution analysis of antigen-reactive cells in primary and secondary culture. J. Immunol. 1983;130:29–32. [PubMed] [Google Scholar]
- Kojima M., Cease K.B., Buckenmeyer G.K., Berzofsky J.A. Limiting dilution comparison of the repertoires of high and low responder MHC-restricted T cells. J. Exp. Med. 1988;167:1100–1113. doi: 10.1084/jem.167.3.1100. [DOI] [PMC free article] [PubMed] [Google Scholar]
- Weyand C.M., Goronzy J., Dallman M.J., Fathman C.G. Administration of recombinant interleukin 2 in vivo induces a polyclonal IgM response. J. Exp. Med. 1986;163:1607–1612. doi: 10.1084/jem.163.6.1607. [DOI] [PMC free article] [PubMed] [Google Scholar]
- Garside P., Ingulli E., Merica R.R., Johnson J.G., Noelle R.J., Jenkins M.K. Visualization of specific B and T lymphocyte interactions in the lymph node. Science. 1998;281:96–99. doi: 10.1126/science.281.5373.96. [DOI] [PubMed] [Google Scholar]
- Kearney E.R., Pape K.A., Loh D.Y., Jenkins M.K. Visualization of peptide-specific T cell immunity and peripheral tolerance induction in vivo. Immunity. 1994;1:327–339. doi: 10.1016/1074-7613(94)90084-1. [DOI] [PubMed] [Google Scholar]
- Khoruts A., Jenkins M.K. Studying immunological tolerance by physically monitoring antigen-specific T cells in vivo. Ann. NY Acad. Sci. 1996;778:72–79. doi: 10.1111/j.1749-6632.1996.tb21116.x. [DOI] [PubMed] [Google Scholar]
- Pape K.A., Kearney E.R., Khoruts A., Mondino A., Merica R., Chen Z.M., Ingulli E., White J., Johnson J.G., Jenkins M.K. Use of adoptive transfer of T-cell-antigen-receptor-transgenic T cell for the study of T-cell activation in vivo. Immunol. Rev. 1997;156:67–78. doi: 10.1111/j.1600-065x.1997.tb00959.x. [DOI] [PubMed] [Google Scholar]
- Davis M.M., McHeyzer-Williams M., Chien Y.H. T-cell receptor V-region usage and antigen specificity. The cytochrome c model system. Ann. NY Acad. Sci. 1995;756:1–11. doi: 10.1111/j.1749-6632.1995.tb44477.x. [DOI] [PubMed] [Google Scholar]
- MacDonald H.R., Casanova J.L., Maryanski J.L., Cerottini J.C. Oligoclonal expansion of major histocompatibility complex class I–restricted cytolytic T lymphocytes during a primary immune response in vivodirect monitoring by flow cytometry and polymerase chain reaction. J. Exp. Med. 1993;177:1487–1492. doi: 10.1084/jem.177.5.1487. [DOI] [PMC free article] [PubMed] [Google Scholar]
- McHeyzer-Williams M.G., Davis M.M. Antigen-specific development of primary and memory T cells in vivo. Science. 1995;268:106–111. doi: 10.1126/science.7535476. [DOI] [PubMed] [Google Scholar]
- McHeyzer-Williams M.G., Altman J.D., Davis M.M. Enumeration and characterization of memory cells in the TH compartment. Immunol. Rev. 1996;150:5–21. doi: 10.1111/j.1600-065x.1996.tb00693.x. [DOI] [PubMed] [Google Scholar]
- McHeyzer-Williams L.J., Panus J.F., Mikszta J.A., McHeyzer-Williams M.G. Evolution of antigen-specific T cell receptors in vivopreimmune and antigen-driven selection of preferred complementarity-determining region 3 (CDR3) motifs. J. Exp. Med. 1999;189:1823–1838. doi: 10.1084/jem.189.11.1823. [DOI] [PMC free article] [PubMed] [Google Scholar]
- Reiner S.L., Wang Z.E., Hatam F., Scott P., Locksley R.M. TH1 and TH2 cell antigen receptors in experimental leishmaniasis. Science. 1993;259:1457–1460. doi: 10.1126/science.8451641. [DOI] [PubMed] [Google Scholar]
- Walker P.R., Ohteki T., Lopez J.A., MacDonald H.R., Maryanski J.L. Distinct phenotypes of antigen-selected CD8 T cells emerge at different stages of an in vivo immune response. J. Immunol. 1995;155:3443–3452. [PubMed] [Google Scholar]
- Walker P.R., Wilson A., Bucher P., Maryanski J.L. Memory TCR repertoires analyzed long-term reflect those selected during the primary response. Int. Immunol. 1996;8:1131–1138. doi: 10.1093/intimm/8.7.1131. [DOI] [PubMed] [Google Scholar]
- Cibotti R., Cabaniols J.P., Pannetier C., Delarbre C., Vergnon I., Kanellopoulos J.M., Kourilsky P. Public and private V beta T cell receptor repertoires against hen egg white lysozyme (HEL) in nontransgenic versus HEL transgenic mice. J. Exp. Med. 1994;180:861–872. doi: 10.1084/jem.180.3.861. [DOI] [PMC free article] [PubMed] [Google Scholar]
- Cochet M., Pannetier C., Regnault A., Darche S., Leclerc C., Kourilsky P. Molecular detection and in vivo analysis of the specific T cell response to a protein antigen. Eur. J. Immunol. 1992;22:2639–2647. doi: 10.1002/eji.1830221025. [DOI] [PubMed] [Google Scholar]
- Dietrich P.Y., Caignard A., Lim A., Chung V., Pico J.L., Pannetier C., Kourilsky P., Hercend T., Even J., Triebel F. In vivo T-cell clonal amplification at time of acute graft-versus-host disease. Blood. 1994;84:2815–2820. [PubMed] [Google Scholar]
- Musette P., Pannetier C., Gachelin G., Kourilsky P. The expansion of a CD4+ T cell population bearing a distinctive beta chain in MRL lpr/lpr mice suggests a role for the fas protein in peripheral T cell selection. Eur. J. Immunol. 1994;24:2761–2766. doi: 10.1002/eji.1830241128. [DOI] [PubMed] [Google Scholar]
- Crawford F., Kozono H., White J., Marrack P., Kappler J. Detection of antigen-specific T cells with multivalent soluble class II MHC covalent peptide complexes. Immunity. 1998;8:675–682. doi: 10.1016/s1074-7613(00)80572-5. [DOI] [PubMed] [Google Scholar]
- Rees W., Bender J., Teague T.K., Kedl R.M., Crawford F., Marrack P., Kappler J. An inverse relationship between T cell receptor affinity and antigen dose during CD4+ T cell responses in vivo and in vitro. Proc. Natl. Acad. Sci. USA. 1999;96:9781–9786. doi: 10.1073/pnas.96.17.9781. [DOI] [PMC free article] [PubMed] [Google Scholar]
- Savage P.A., Boniface J.J., Davis M.M. A kinetic basis for T cell receptor repertoire selection during an immune response. Immunity. 1999;10:485–492. doi: 10.1016/s1074-7613(00)80048-5. [DOI] [PubMed] [Google Scholar]
- Ridgway W., Fasso M., Fathman C.G. Following antigen challenge, T cells up-regulate cell surface expression of CD4 in vitro and in vivo. J. Immunol. 1998;161:714–720. [PubMed] [Google Scholar]
- Krieger N.R., Fathman C.G., Shaw M.K., Ridgway W.M. Identification and characterization of the antigen-specific subpopulation of alloreactive CD4+ T cells in vitro and in vivo. Transplantation. 2000;69:605–609. doi: 10.1097/00007890-200002270-00023. [DOI] [PubMed] [Google Scholar]
- Lejon K., Fathman C.G. Isolation of self antigen-reactive cells from inflamed islets of nonobese diabetic mice using CD4high expression as a marker. J. Immunol. 1999;163:5708–5714. [PubMed] [Google Scholar]
- Ruberti G., Gaur A., Fathman C.G., Livingstone A.M. The T cell receptor repertoire influences V beta element usage in response to myoglobin. J. Exp. Med. 1991;174:83–92. doi: 10.1084/jem.174.1.83. [DOI] [PMC free article] [PubMed] [Google Scholar]
- Ruberti G., Livingstone A., Danska J.S., Gaur A., Fathman C.G. Analysis of the ternary complex of antigen, MHC and T-cell receptorthe influence of the T-cell receptor V beta repertoire on the V beta gene element usage. Res. Immunol. 1991;142:491–493. doi: 10.1016/0923-2494(91)90054-m. [DOI] [PubMed] [Google Scholar]
- Ruberti G., Sellins K.S., Hill C.M., Germain R.N., Fathman C.G., Livingstone A. Presentation of antigen by mixed isotype class II molecules in normal H-2d mice. J. Exp. Med. 1992;175:157–162. doi: 10.1084/jem.175.1.157. [DOI] [PMC free article] [PubMed] [Google Scholar]
- Ruberti G., Paragas V., Kim D., Fathman C.G. Selection for amino acid sequence and J beta element usage in the beta chain of DBA/2V beta b- and DBA/2V beta a-derived myoglobin-specific T cell clones. J. Immunol. 1993;151:6185–6194. [PubMed] [Google Scholar]
- Sellins K.S., Danska J.S., Paragas V., Fathman C.G. Limited T cell receptor beta-chain usage in the sperm whale myoglobin 110-121/E alpha dA beta d response by H-2d congenic mouse strains. J. Immunol. 1992;149:2323–2327. [PubMed] [Google Scholar]
- Danska J.S., Livingstone A.M., Paragas V., Ishihara T., Fathman C.G. The presumptive CDR3 regions of both T cell receptor alpha and beta chains determine T cell specificity for myoglobin peptides. J. Exp. Med. 1990;172:27–33. doi: 10.1084/jem.172.1.27. [DOI] [PMC free article] [PubMed] [Google Scholar]
- Kozono H., White J., Clements J., Marrack P., Kappler J. Production of soluble MHC class II proteins with covalently bound single peptides. Nature. 1994;369:151–154. doi: 10.1038/369151a0. [DOI] [PubMed] [Google Scholar]
- Kozono H., Parker D., White J., Marrack P., Kappler J. Multiple binding sites for bacterial superantigens on soluble class II MHC molecules. Immunity. 1995;3:187–196. doi: 10.1016/1074-7613(95)90088-8. [DOI] [PubMed] [Google Scholar]
- White J., Crawford F., Fremont D., Marrack P., Kappler J. Soluble class I MHC with beta2-microglobulin covalently linked peptidesspecific binding to a T cell hybridoma. J. Immunol. 1999;162:2671–2676. [PubMed] [Google Scholar]
- Gammon G., Klotz J., Ando D., Sercarz E.E. The T cell repertoire to a multideterminant antigen. Clonal heterogeneity of the T cell response, variation between syngeneic individuals, and in vitro selection of T cell specificities. J. Immunol. 1990;144:1571–1577. [PubMed] [Google Scholar]
- Busch D.H., Philip I., Palmer E.G. Evolution of a complex T cell receptor repertoire during primary and recall bacterial infection. J. Exp. Med. 1998;188:61–70. doi: 10.1084/jem.188.1.61. [DOI] [PMC free article] [PubMed] [Google Scholar]
- McHeyzer-Williams M.G., Altman J.D., Davis M.M. Tracking antigen-specific helper T cell responses. Curr. Opin. Immunol. 1996;8:278–284. doi: 10.1016/s0952-7915(96)80068-9. [DOI] [PubMed] [Google Scholar]
- Matsui K., Boniface J.J., Steffner P., Reay P.A., Davis M.M. Kinetics of T-cell receptor binding to peptide/I-Ek complexescorrelation of the dissociation rate with T-cell responsiveness. Proc. Natl. Acad. Sci. USA. 1994;91:12862–12866. doi: 10.1073/pnas.91.26.12862. [DOI] [PMC free article] [PubMed] [Google Scholar]
- Alam S.M., Travers P.J., Wung J.L., Nasholds W., Redpath S., Jameson S.C., Gascoigne N.R. T-cell-receptor affinity and thymocyte positive selection. Nature. 1996;381:616–620. doi: 10.1038/381616a0. [DOI] [PubMed] [Google Scholar]
- Lyons D.S., Lieberman S.A., Hampl J., Boniface J.J., Chien Y., Berg L.J., Davis M.M. A TCR binds to antagonist ligands with lower affinities and faster dissociation rates than to agonists. Immunity. 1996;5:53–61. doi: 10.1016/s1074-7613(00)80309-x. [DOI] [PubMed] [Google Scholar]
- Kersh G.J., Kersh E.N., Fremont D.H., Allen P.M. High- and low-potency ligands with similar affinities for the TCRthe importance of kinetics in TCR signaling. Immunity. 1998;9:817–826. doi: 10.1016/s1074-7613(00)80647-0. [DOI] [PubMed] [Google Scholar]
- Alam S.M., Davies G.M., Lin C.M., Zal T., Nasholds W., Jameson S.C., Hogquist K.A., Gascoigne N.R., Travers P.J. Qualitative and quantitative differences in T cell receptor binding of agonist and antagonist ligands. Immunity. 1999;10:227–237. doi: 10.1016/s1074-7613(00)80023-0. [DOI] [PubMed] [Google Scholar]
- Croft M., Dubey C. Accessory molecule and costimulation requirements for CD4 T cell response. Crit. Rev. Immunol. 1997;17:89–118. doi: 10.1615/critrevimmunol.v17.i1.40. [DOI] [PubMed] [Google Scholar]
- Singer S.J. Intercellular communication and cell-cell adhesion. Science. 1992;255:1671–1677. doi: 10.1126/science.1313187. [DOI] [PubMed] [Google Scholar]
- Davis M.M., Lyons D.S., Altman J.D., McHeyzer-Williams M., Hampl J., Boniface J.J., Chien Y. T cell receptor biochemistry, repertoire selection and general features of TCR and Ig structure. Ciba Found. Symp. 1997;204:94–100. doi: 10.1002/9780470515280.ch7. [DOI] [PubMed] [Google Scholar]
- Davis M.M., Boniface J.J., Reich Z., Lyons D., Hampl J., Arden B., Chien Y. Ligand recognition by alpha beta T cell receptors. Annu. Rev. Immunol. 1998;16:523–544. doi: 10.1146/annurev.immunol.16.1.523. [DOI] [PubMed] [Google Scholar]
- Busch D.H., Pamer E.G. T cell affinity maturation by selective expansion during infection. J. Exp. Med. 1999;189:701–710. doi: 10.1084/jem.189.4.701. [DOI] [PMC free article] [PubMed] [Google Scholar]
- Burnet, F.M. 1959. The Clonal Selection Theory of Acquired Immunity. Cambridge University Press.


