

Abstract
The quality of cargo proteins in the endoplasmic reticulum (ER) is affected by their motion during folding. To understand how the diffusion of secretory cargo proteins is regulated in the ER, we directly analyze the motion of a single cargo molecule using fluorescence imaging/fluctuation analyses. We find that the addition of two N-glycans onto the cargo dramatically alters their diffusion by transient binding to membrane components that are confined by hyperosmolarity. Via simultaneous observation of a single cargo and ER exit sites (ERESs), we could exclude ERESs as the binding sites. Remarkably, actin cytoskeleton was required for the transient binding. These results provide a molecular basis for hypertonicity-induced immobilization of cargo, which is dependent on glycosylation at multiple sites but not the completion of proper folding. We propose that diffusion of secretory glycoproteins in the ER lumen is controlled from the cytoplasm to reduce the chances of aggregation.
Introduction
During interphase, the ER is a single structure consisting of interconnected hollow tubes and cisternae extending throughout the cytoplasm. Nascent proteins are transported from their sites of synthesis through the lumen to specialized microdomains, which are referred to as ER exit sites (ERESs), and their folding is mostly completed during transit. The calnexin cycle and molecular chaperones such as BiP prevent nonproductive interactions of folding intermediates by repeatedly binding to the nascent proteins (Ellgaard and Helenius, 2003). Folding enzymes such as protein disulfide isomerase edit the molecules' structural organization. If folding cannot be completed properly, the nascent proteins tend to form aggregates as a result of interactions between exposed hydrophobic patches. Because the lumenal space of the ER is narrow, such aggregates could severely affect protein maturation. To prevent their accumulation, some terminally misfolded products are selectively retrotranslocated from the ER for proteasomal degradation (Lederkremer and Glickman, 2005).
Cells are constantly exposed to a wide variety of folding stresses, and reducing the frequency of nonproductive interactions must be critical for quality control. Because the frequency of collision is proportional to displacement of the molecule over time and because the structure of nascent proteins is unstable in general, the quality of the nascent secretory cargo should inversely correlate with the rate of diffusional motion. Thus, it is conceivable that regulation of molecular motion in the ER lumen may be an effective means to decrease molecular collisions. Although the lumen seems highly crowded, FRAP analysis of the diffusional motion of GFP indicated that motion in the ER is 20–30% of that in the cytoplasm (Dayel et al., 1999). This proportion is compatible with a random walk simulation assuming a unique reticular shape of the ER, where the lumen occupies 3–10% of the entire space (Olveczky and Verkman, 1998), and suggested that cargo proteins are freely diffusible. Membrane-bound chaperones such as calnexin should reduce the simple diffusion of some misfolded, soluble, glycosylated cargo proteins, but it remains unclear whether the ER contains general mechanisms to reduce the frequency of cargo collisions. Although it has long been thought that ER molecular chaperones associate with each other and may form a loose complex to provide a favorable environment for nascent proteins (Tatu and Helenius, 1997; Meunier et al., 2002), reversibly misfolded cargo proteins are fully mobile, and misfolding does not seem to severely affect translational diffusion (Nehls et al., 2000; Kamada et al., 2004). Indeed, molecular chaperones such as calreticulin, a soluble homologue of calnexin, are highly mobile (Snapp et al., 2006).
In this study, we explore the possibility that protein diffusion in the ER could be regulated, thus reducing the rate of collision. Using FRAP, we searched for an extreme but physiological condition that would disturb simple diffusion without affecting folding. Interestingly, we found that the mobilities of several cargo proteins were selectively abolished immediately after exposure to hypertonicity, and N-glycosylation was required for the immobilization. To understand whether this restriction occurs under growth conditions, we used fluorescence correlation spectroscopy (FCS) to directly analyze the movements of a single molecule in and out of a focal plane (Rigler and Elson, 2001). With FCS, the motion of the molecules can be measured at extremely high time resolution by averaging the time correlation of the fluctuation. However, this is limited to estimates of the mobile populations. To elucidate the reaction, we next analyzed the displacement and lifetime of the individual molecule illuminated by evanescent light. In general, observations using total internal reflection fluorescence microscopy (TIRFM) are performed on cell surface molecules because evanescent illumination exponentially decays along the z axis and is practically limited to molecules within ∼200 nm of the reflection surface (Toomre and Manstein, 2001). Because part of the ER is attached to the cell surface and the depth of evanescent illumination extends into the milieu, where light is scattered (Steyer and Almers, 1999), we reasoned that direct visualization of a single cargo protein might be possible. By analyzing the dynamics of single molecules, we show that the motion of cargo proteins in the ER lumen is regulated by the actin cytoskeleton through N-glycosylation.
Results
High osmolarity abolishes the diffusion of cargo proteins in the ER
We first addressed the question of whether the simple diffusion of cargo proteins in the ER could be abolished without inducing the formation of aggregates. We focused on osmotic stress, which is one of the most common physiological stresses. For example, renal medullary cells are constantly exposed to extreme conditions of hypertonicity consisting of 1,500 mOsm of urea and ∼1,000 mOsm of osmolytes such as sorbitol (Garcia-Perez and Burg, 1991). Osmotic disturbance causes a variety of responses in cells. Exposure to hypertonicity immediately activates the Rho family GTPases, triggering downstream pathways, including an increase in filamentous actin content as well as alterations in ion transport (Pedersen et al., 2001; Di Ciano-Oliveira et al., 2006). In addition, membrane traffic such as endocytosis (Heuser and Anderson, 1989) or ER to Golgi transport (Lee and Linstedt, 1999) is severely disturbed. Interestingly, it has been reported that Hsc/hsp70 are induced in the collecting ducts when exposed to 760–1,270 mOsm (Santos et al., 2003), suggesting that alterations in osmolarity may have severe effects on protein maturation.
When we studied the effects of osmolarity changes on cargo motion, we found that several cargo proteins were immobilized under hyperosmolarity. In normal growth medium, misfolded vesicular stomatitis virus glycoprotein (VSVG)–YFP showed rapid, near-complete recovery after photobleaching (Fig. 1 A). However, the recovery was almost completely abolished after placing the cells at 930 mOsm. The photobleached spots remained detectable even after 60 min. Averaged recovery curves are shown in Fig. 1 B. The same immobilization was observed when folded VSVG-YFP was measured in cells treated with brefeldin A, which prevents export of folded cargo from the ER. Thermally misfolded tyrosinase, a membrane protein that displays temperature-sensitive folding (Kamada et al., 2004), showed the same response to hypertonicity. When we tested the soluble, permanently misfolded cargo protein α1-antitrypsinnullHongKong (NHK), recovery was markedly suppressed, albeit to a lesser degree than the membrane proteins. In contrast, no such mobility changes were observed when cells were exposed to a hypoosmotic stress of 210 mOsm. The observed disturbance of diffusion was completely reversible, and full mobility immediately reappeared when the cells were returned to isotonicity.
Figure 1.

Diffusion of various cargo proteins in the ER was severely restricted by hypertonicity. (A) The indicated areas of a COS7 cell expressing VSVG-YFP at 40°C were photobleached as described in Materials and methods. Images of a whole cell before and after photobleaching are shown. After the first series of FRAP (top), the osmolarity was adjusted to 930 mOsm, and images were recorded at 1, 30, and 60 min. The pink arrowhead indicates a spot photobleached at 1 min, and the yellow arrowhead indicates a spot photobleached at 30 min. (B) Quantitative FRAP of various cargo proteins when exposed to hypertonicity. Cells expressing misfolded VSVG-YFP (40°C), folded VSVG-YFP (32°C) in the presence of 10 μM brefeldin A, NHK, or tyrosinase (40°C) were exposed to 930 mOsm. FRAP was recorded before (black) and 1 (red) or 60 min (green) after treatment. The normalized mean recovery rates are plotted. The number of experiments and mobile fractions are shown in Table I. Bars, 5 μm.
Next, we examined whether molecules other than secretory proteins might respond in a similar manner. We analyzed the mobility of the KDEL receptor, a multispanning membrane protein that recycles between the ER and Golgi apparatus. After hyperosmotic stress, FRAP analysis of KDEL receptor–YFP revealed a mobile fraction of 81.5% at 1 min and 82.8% at 60 min, although the recovery rates slowed (Fig. 2 A and Table I). The maximum recovery rates of three other ER-resident proteins, esterase, Ero1L, and BiP, also returned to levels similar to those at isotonicity after 60 min (Table I). When we examined the effects on the simplest fluorescent protein, EYFP-ER (YE), the mobile fraction was also unchanged, although the recovery kinetics were reduced, presumably as a result of the cell shrinking (Fig. 2 B, left; and Table I). Hyperosmotic stress had little effect on the motion of the lipid DiOC6 (Fig. 2 A).
Figure 2.

The obstruction of diffusion by hypertonicity requires the presence of two N-linked oligosaccharides. (A and B) FRAP of the YFP-KDEL receptor (A), DiOC6 (A), and YE variants (B). The translational diffusion was measured as for Fig. 1. YE(gly)1 or YE(gly)2 indicates a YE variant containing one or two glycans, respectively. The averaged recoveries of the indicated molecules are shown. (C) Deletion of VSVG N-glycosylation abolished the diffusional restriction caused by hypertonicity. YFP-fused VSVG variants (see Results) were expressed, and their sensitivity to hyperosmolarity was examined at 38°C using FRAP. Glycosylation of each molecule was examined by immunoblotting (top). The asterisk indicates a nonspecific band. Colors are as in Fig. 1.
Table I. Summary of mobile fractions of various ER molecules after hypertonicity treatment.
| +Sorbitol
|
|||
|---|---|---|---|
| 0 min | 1 min | 60 min | |
| % | % | % | |
| Cargo and ER-resident proteins |
|||
| VSVG (40°C) | 93.4 (12) | 10.8 (12) | 17.8 (12) |
| VSVG (32°C) | 97.5 (8) | 15.7 (8) | 9.5 (8) |
| VSVG(N336S) | 86.9 (10) | 60.3 (5) | 62.8 (8) |
| VSVG (null) | 87.6 (5) | 69.7 (5) | 71.1 (5) |
| Tyrosinase | 100.8 (8) | 7.2 (12) | 19.4 (12) |
| α1ATNHK | 89.3 (9) | 50.1 (8) | 27.1 (8) |
| KDELR | 91.8 (8) | 81.5 (8) | 82.8 (8) |
| Esterase | 72.9 (4) | 53.8 (4) | 70.2 (7) |
| Ero1L | 77.6 (5) | 64.7 (3) | 76.1 (4) |
| BiP | 81.5 (5) | 52.0 (6) | 81.7 (16) |
| Lectin-related proteins | |||
| Calnexin | 89.6 (17) | 44.0 (18) | 86.6 (13) |
| Calnexin(Y163F) | 82.4 (6) | 66.3 (3) | 79.7 (5) |
| ERGIC53 | 77.7 (5) | 49.3 (4) | 68.7 (9) |
| ERGIC53(N516A) | 74.3 (4) | 50.7 (3) | 69.4 (6) |
| VIP36 | 102.9 (3) | 88.9 (3) | 84.6 (6) |
| VIP36(N166A) | 96.1 (5) | 77.0 (3) | 94.1 (6) |
| VIPL | 95.2 (9) | 18.1 (8) | 18.1 (7) |
| VIPL(N163A) | 82.5 (5) | 44.8 (3) | 78.5 (6) |
| UGGT | 88.8 (3) | 31.2 (3) | 69.2 (5) |
| Artificial cargo | |||
| DiOC6 | 108.4 (12) | 94.3 (12) | 95.6 (12) |
| YE | 95.8 (7) | 99.3 (7) | 97.9 (7) |
| YE(gly)1 | 88.1 (4) | 77.9 (4) | 87.5 (4) |
| YE(gly)2 | 98.0 (9) | 32.8 (9) | 53.3 (9) |
| Y2E | 81.8 (9) | 71.3 (4) | 87.7 (5) |
n is given in parentheses for the number of measurements. Mobile fractions of various molecules in the ER before and after osmotic stress were estimated. All molecules except DiOC6 were fused to YFP.
Multiple N-linked oligosaccharides strongly influence the mobility of cargo proteins
Next, we tried to identify the common element in cargo immobilized by hyperosmolarity. Comparing the proteins listed in Table I revealed that all of the molecules showing potent immobilization were N-glycosylated on at least two sites; VSVG, tyrosinase, and NHK contain two, six or seven, and three oligosaccharides, respectively. In contrast, the KDEL receptor, BiP, and YE are not glycosylated, and both esterase and Ero1L contain only a single oligosaccharide. To test for a link between glycosylation and immobility under hypertonic conditions, we designed YE mutants containing N-linked oligosaccharides. Because the C terminus of YFP protrudes from the fluorophore, we inserted a single N-linked glycosylation site (Mellquist et al., 1998) between YFP and the KDEL motif. The monoglycosylated YE, YE(gly)1, showed a slight decrease in the mobile fraction 1 min after the addition of sorbitol; however, by 60 min, the recovery had almost returned to the level observed under isotonicity (Fig. 2 B). Marked immobilization was observed when a second N-glycosylation site was created in an external loop of YFP (see Materials and methods). The recovery rate of YE(gly)2 reached 32.8% at 1 min and 53.3% at 60 min (Table I). Because oligosaccharide chains are bulky (Petrescu et al., 1997), we tested whether the observed immobilization of the doubly glycosylated protein was caused by its increased hydrodynamic diameter by examining Y2E, a tandem YFP dimer (Fig. S5 B, available at http://www.jcb.org/cgi/content/full/jcb.200704078/DC1). However, the mobile fractions were comparable with those of YE (Table I).
These results suggest that it is the two N-glycans that are responsible for the hypertonicity-induced immobilization of VSVG-YFP. If so, the removal of a single N-glycan should rescue it unless the immobilization is the result of massive aggregation. To test this, we created two mutants: VSVG(N336S), which lacks the C-terminal glycosylation site, and VSVG(N336S/N179S), which contains no glycosylation site. The effects of the mutations were confirmed by immunoblotting (Fig. 2 C). Neither mutant exited the ER at 37°C, and the kinetics of the recovery rates were especially slowed in the nonglycosylated mutant (Fig. 2 C). Nonetheless, in growth medium, the maximum recovery rates for both mutants were comparable with those for VSVG. However, hypertonicity-induced immobilization was not observed in these mutants. These data are consistent with the results in Fig. 2 B and indicate that N-glycosylation but not folding or molecular crowding is essential for immobilization. Because most secretory proteins are N-glycosylated and the restriction of simple diffusion should be beneficial for avoiding nonproductive interactions, we hypothesized that the ER may be equipped with a mechanism that uses multiple N-glycans to limit the diffusion of cargo proteins. Indeed, examination using fluorescence loss induced by photobleaching (FLIP), in which an area of a narrow strip was repeatedly photobleached, also showed that the presence of double glycans markedly slowed long-range transport in the ER (Fig. S1, available at http://www.jcb.org/cgi/content/full/jcb.200704078/DC1).
If this hypothesis is correct, we should be able to detect the disturbance of the simple diffusion of cargo proteins in cells in growth medium. We used FCS to analyze cargo motion in detail. At a delay time of ∼1 ms, the decay profile of G(τ) for YE(gly)2 was clearly shifted to the right as compared with the nonglycosylated YE (Fig. 3 A). Fitting each G(τ) to a three-component model (Fig. 3 B) revealed that the slow components of YE(gly)2 were markedly increased compared with those of YE, and the population of freely diffusing molecules (the 0.207-ms component, which is equivalent to a diffusion coefficient of 27.2 μm2/s) was decreased by nearly half. In contrast, YE and YE(gly)2 had only slightly different diffusion times in cell lysates (Fig. 3 C). The decay curves fit well to a one-component model with diffusion times of 0.064 ms and 0.074 ms for YE and YE(gly)2, respectively. Because diffusion time is proportional to the cube of the molecule's diameter, this result suggests that the hydrodynamic diameter of YE(gly)2 is only 55% larger than that of YE and, therefore, would not account for the presence of slow components in the cells. Thus, the slow component of YE(gly)2 observed under conditions of isotonicity most likely represents a large cellular component, such as membranes.
Figure 3.

Diffusional motion of ER lumenal proteins is markedly affected by the attachment of two N-linked oligosaccharides. (A) The fluorescence of cells expressing each cargo was measured at 32°C. Mean G(τ) was obtained from 34 (YE; blue) or 58 (YE(gly)2; red) measurements. Means (line) and 95% confidence intervals (vertical bars) are shown. (inset) Fitting to a three-component model. Red crosses, averaged G(τ); blue dots, best fit. (B) Best-fit values of diffusion time and each subpopulation fraction. (C) Estimation of hydrodynamics diameter. Normalized G(t) was averaged from 10 cell lysates and is shown with 95% confidence intervals. YE, blue; YE(gly)2, red. The best fit in a one-component model was 0.064 μs and 0.074 μs for YE and YE(gly)2, respectively.
Direct visualization of a single molecule in the ER
To examine whether the binding that creates the slowly diffusing population is transient or static, we elected to study a single reaction in the ER using TIRFM. Although TIRFM has been used exclusively to analyze molecular events on the cell surface (Sako, 2006; Jaiswal and Simon, 2007), part of the ER network resides in enough proximity to the cell surface that it should be possible to visualize a thin optical section of the ER. When the ER was illuminated by a laser at a shallow angle to the CCD camera, YE(gly)2 was visible throughout the ER network (Fig. S2 A, available at http://www.jcb.org/cgi/content/full/jcb.200704078/DC1). However, when illuminated at steeper angles, the image of the ER contained spots, but not the network. A projection of 1,000 images confirmed that the spots were confined within the reticular structure. To confirm that the individual spots represented images of single proteins, we examined the photobleaching properties of fixed proteins (Fig. S2 B). In 500 sequential images, the sudden disappearance of a few immobile fluorescent spots was observed. Because it was unlikely that photobleaching of two molecules occurred simultaneously, this observation suggested that individual fluorescent spots mostly represented single molecules.
To examine whether translational movements can be measured, we analyzed sequential images of YE(gly)2 (Fig. 4 and Videos 1 and 2; available at http://www.jcb.org/cgi/content/full/jcb.200704078/DC1). We tracked the movement of a single molecule in consecutive images. Projection of streaming images showed that the spots were found throughout the reticular structure (Fig. 4 A), indicating that the fluorescent spots are not likely to represent colliding proteins at the three-way junction. Indeed, translational displacement of each spot was clearly detected when we compared consecutive images (Fig. 4 B). We quantitatively analyzed 557 molecules from four streaming images of YE(gly)2 (Videos 1 and 2). When the mean square displacements (MSDs) of each spot were plotted against time, the increments were linear (Fig. 4 C), indicating that the motion is diffusive. The apparent diffusion coefficient was estimated to be 1.68 ± 0.045 μm2/s, which is one order of magnitude lower than the simple diffusion components of YE and YE(gly)2 (27.2 μm2/s) obtained by FCS (Fig. 3 B) and most likely corresponds to the slow component.
Figure 4.

Analysis of the motion of a single YE(gly)2 molecule. Images of YE(gly)2 in the evanescent field were recorded at 32°C and a resolution of 15 ms (Videos 1 and 2, available at http://www.jcb.org/cgi/content/full/jcb.200704078/DC1). (A) Four sequential images from Video 1. A projection of 1,000 images reveals traces of a reticular network (bottom). (B) The displacement of each spot in sequential images (Video 2). An image (green) was compared with the next consecutive image (red). (C) Translational diffusion of YE(gly)2. Averaged MSD was plotted against time intervals (T). Error bars represent 95% confidence intervals. (D) Appearance and disappearance of single molecules (numbered arrows in A) over nine frames. (E) A one-dimensional image of a single pixel width of the video was aligned with the progression of time. The kymograph is an image of 7 s in length and 19 μm in distance. (F) Lifetime distribution of each spot. Lifetime of the fluorescence spots was determined from four streaming images, each of which was obtained over 15 s, and the time distribution was counted. The lifetime dataset was normalized, and the best-fit value of dA was calculated. Bar, 5 μm.
However, the lifetime of each spot was very short (Fig. 4, D and E). It is conceivable that the short residence time indicated the rapid dissociation from the slowly diffusing components. On the other hand, it is also likely that the rapid disappearance of the spots was caused by the movement of the cargo from the evanescent layer as a result of the depth of the ER because a cell surface protein can be tracked over seconds (Fig. S2, C–F; and Video 3, available at http://www.jcb.org/cgi/content/full/jcb.200704078/DC1). We reasoned that these possibilities could be distinguished if the lifetime distribution of the proteins was analyzed because they should follow the rule of probability measure, P(t), for freely moving particles in one dimension (Fig. S3, available at http://www.jcb.org/cgi/content/full/jcb.200704078/DC1). Let A be a one-dimensional reflected Brownian particle starting from x = a (0 < a < l/2) at t = 0 with a reflecting barrier at x = l/2, and let T 0 be its first passage time to x = 0 (see Materials and methods). On the basis of the reflection principle at the barrier, the distribution of T 0 is equal to that of the first passage time of the free Brownian particle from x = a to x = 0 or l. Therefore, if the diffusion coefficient of A is dA, the density of T 0 is equal to that of the first passage time of the one-dimensional diffusion motion M(t) = B(2dAt) (see Mobility measurements in living cells). Indeed, the simulated first passage time distribution is critically dependent on dA (Fig. S3). If we assume that YE(gly)2 is detected when it enters the evanescence layer from the upper boundary and reaches inside at distance a and that the lower boundary acts as the reflecting barrier, the lifetime measurement (Fig. 4 F) can be fitted to the density of the first passage time of M(t) from x = a to x = 0 or l, which is given by the following equation (see Mobility measurements in living cells):
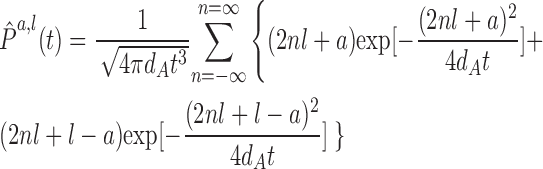 |
1 |
Regardless of a, the diffusion coefficient, dA, can be calculated from the thickness of the evanescent layer, l/2, or vice versa by using this equation if the normalized passage time (lifetime) distribution is given. Although the theoretical thickness of the evanescence layer in solution can be calculated from the optic parameters, the actual depth in cells cannot be predicted (Steyer and Almers, 1999). One way to estimate l in Eq. 1 is to determine dA from lifetime distribution because dA is theoretically identical to the mean translational diffusion coefficient. To obtain such a freely diffusing control molecule, we examined the model membrane protein inactive calnexin(Y163F), which lacks affinity for oligosaccharides (Kapoor et al., 2004). G(τ) of this mutant showed faster decay than the wild type presumably because of the loss of association with nascent proteins (Fig. 5 A). Assuming that the first passage time of calnexin(Y163F) (Fig. 5 B and Video 4, available at http://www.jcb.org/cgi/content/full/jcb.200704078/DC1) is solely determined by its diffusional motion at a rate of 1.64 μm2/s (Fig. 5 C), we can estimate the thickness of the evanescent layer to be 0.100 ± 0.0069 μm using Eq. 1 from the lifetime distribution (Fig. 5 D). This is in agreement with the typical theoretical thickness result of TIRFM (Toomre and Manstein, 2001).
Figure 5.

Single-molecule dynamics of nonglycosylated proteins. Sequential images of a single molecule of an inert mutant of calnexin, calnexin(Y163F), were recorded as in Fig. 4 (the complete sequence can be seen in Video 4; available at http://www.jcb.org/cgi/content/full/jcb.200704078/DC1). (A) FCS analysis of the calnexin mutant. G(τ) was determined for wild-type calnexin and the calnexin mutant. Wild-type calnexin (black) decayed more slowly than the mutant (blue). (B) Examples of a single image (left), a projection of 1,000 images (right), and a kymograph of the video (bottom). Long-lived spots are indicated by arrows. (C) Translational diffusion of a calnexin mutant. Changes in MSD over time were plotted as in Fig. 4 C. (D) The lifetime of calnexin(Y163F) in the evanescence field was obtained from four streaming images recorded for 15 s. The best-fit dA was obtained as in Fig. 4 F. (E) Single molecular dynamics of the nonglycosylated cargo YE. Images of YE were recorded as in Fig. 4. Because of its short residence time, the MSD was not traceable for a longer period. (F) Lifetime of YE. Fitting with Eq. 1 failed to predict a reliable value. Error bars represent 95% confidence intervals. Bar, 5 μm.
We then applied the estimated value of l, 0.201 μm, onto the lifetime distribution of YE(gly)2 and calculated the best-fit dA. The lifetime of YE(gly)2 (Fig. 4 F) appeared to be much shorter than that of calnexin(Y163F), and spots lasting >50 ms were rare. The best-fit dA of YE(gly)2 was 5.37 ± 2.18 μm2/s, which was significantly faster than the dA of the inactive calnexin (1.64 μm2/s), although their translational MSDs were nearly identical (compare Figs. 4 C with 5 C). Therefore, we reasoned from the FCS (Fig. 3, A and B) and MSD analysis (Fig. 4 C) that the slow component of YE(gly)2 was short lived and converted to the faster component, most likely by dissociating from membranes. Indeed, when we compared their kymographs, that of calnexin(Y163F) showed tracks similar to YE(gly)2 but lasting longer (Fig. 5 B, arrows). To examine how the fast component was recorded, we analyzed YE (Fig. 3, A and B). We obtained a dA value of 7.44 ± 0.23 μm2/s (Fig. 5 E). However, this corresponded to a diffusion time of 0.76 ms, which was slower than the diffusion time estimated by FCS (0.207 ms; Fig. 3 B). We believe that this is caused by the low time resolution of our current TIRFM setup, such that the majority of YE molecules was not detected. Indeed, fitting of the lifetime to Eq. 1 failed to give an accurate estimate because of insufficient time points at the critical shorter residence time (Fig. 5 F).
These results suggest that the simple diffusion of glycoproteins is hampered by transient binding to slow-moving components, most likely membrane components, and, on average, more than half of YE(gly)2 exists as the bound form. To confirm the transient nature of the binding and to understand how the cargo is immobilized by hyperosmolarity, we examined the dynamics by TIRFM. A set of sequential images is shown in Fig. 6 A and Video 5 (available at http://www.jcb.org/cgi/content/full/jcb.200704078/DC1). When MSD was plotted against time, the displacement did not increase linearly (Fig. 6 B, right), suggesting confined motion (Kusumi et al., 1993). Therefore, Eq. 1 was not applicable. In contrast, the MSD increased linearly over time when YE was placed in the same hyperosmotic medium (Fig. 6 B, right; inset). The aberrant dynamics were most apparent in trajectories of YE(gly)2 (Fig. 6 C). All of the trajectories at 930 mOsm were confined within a small area that was slightly larger than the mechanical drift measured for PFA-treated YE(gly)2. However, the lifetime of each spot was short (Fig. 6 B), which is similar to that observed for the freely diffusing calnexin mutant. These results indicate that YE(gly)2 dissociates from the binding sites even under hyperosmolarity, and the disturbed diffusion observed with FRAP was caused by the immobilization of a binding partner.
Figure 6.

Transient immobilization of YE(gly)2 by hyperosmolarity. (A) Sequential images of YE(gly)2 in cells exposed to 930 mOsm were recorded (Video 5, available at http://www.jcb.org/cgi/content/full/jcb.200704078/DC1). In a set of nine consecutive images, newly appearing spots are indicated by arrows. (B) Lifetime distribution and MSD plot. Under hyperosmolarity, the MSD for YE(gly)2 reached saturation over time. In contrast, a linear relationship was observed for YE at the same hyperosmolarity (inset). The analysis of three streaming images, including Video 5, is shown. (C) Trajectories of YE(gly)2 under various conditions. X-Y trajectories of a single YE(gly)2 in nine consecutive images are shown. 10 molecules were randomly picked from the videos. The motion is compared with that of formalin-fixed molecules. Error bars represent 95% confidence intervals.
The projection of multiple YE(gly)2 images (Fig. 4 A) suggested that the observed spots do not represent cargo molecules trapped in ERESs because the cargo was distributed throughout the ER, whereas ERESs are immobile (Hammond and Glick, 2000). To confirm this and to examine the frequency of single cargo visits to ERESs, we expressed YE(gly)2 by bead loading in cells stably expressing Sec13-mStrawberry. Simultaneous observation of the two-color imaging clearly showed that the majority of the observed spots of YE(gly)2 was not in ERES (Fig. 7 A). This was most apparent in the kymograph showing ERES (Fig. 7, B and C) as a straight line in the time axis (Fig. 7 B). Quantifying the frequency of entry by counting the total intensity in the y axis indicated that YE(gly)2 rarely visited ERESs (Fig. 7 B, right). Higher magnifications of the superimposed images also support this view (Fig. 7 C). At the very least, these results exclude the possibility that the fluorescent spots observed by TIRFM represent only YE(gly)2 molecules trapped in ERESs.
Figure 7.

Simultaneous observation of YE(gly)2 and ERESs. (A) YE(gly)2 (green) was coexpressed in cells stably expressing Sec13-mStrawberry (Sc13mS; red). The two fluorescent proteins were simultaneously recorded and are shown as single channels and merged images. Whole-cell images of Sc13mS are shown (left). In contrast to the reticular distribution of YE(gly)2, Sc13mS remained as an almost identical punctuate structure throughout the recording (projection). (B) Kymograph of a single pixel, which is indicated by the dashed lines in A. Here, the Sc13mS signal appeared as a line. (C) Enlarged images of the dashed boxes in A and B.
Cytoplasmic actin regulates the motion of YE(gly)2
To understand how binding sites for glycoproteins are created, we studied the possibility that cytoskeletal elements such as microfilaments may act as transmembrane regulators of cargo diffusion. Actin filaments form an extensive intracellular matrix that homogenously spreads throughout the cytoplasm and interacts with membranes (Stossel, 1984; McGrath et al., 1998). Further, it is known that actin is remodeled upon exposure to hypertonicity through the activation of various modulators (Di Ciano-Oliveira et al., 2006). Indeed, FRAP analysis of YFP-actin in cells after hyperosmolarity treatment showed that nearly one third of YFP-actin was immobilized (Fig. S4 A, available at http://www.jcb.org/cgi/content/full/jcb.200704078/DC1). In addition, when we estimated the change in the pseudoequilibrium constant of the actin monomer–polymer reaction, the equilibrium shifted toward polymer formation by approximately threefold. This estimation indicates that hyperosmolarity induces the rapid and sustained polymerization of actin.
To examine the role of actin polymerization in the immobilization of cargo proteins, we pretreated the cells with latrunculin B (LAT), which inhibits actin polymerization by sequestering the monomer (Spector et al., 1983), and examined the effect on VSVG-GFP immobilization. The treatment partially reversed the hyperosmolarity-induced immobilization (Fig. S4 B, left). In contrast, pretreatment with nocodazole, a drug that disrupts the microtubule cytoskeleton, had no effect (Fig. S4 B, right). We next examined whether the same treatment might reduce the slow components of YE(gly)2 at isotonicity. When we examined the mobility profile of YE(gly)2 using FCS in cells treated with LAT, we found that the decay curve clearly shifted to a shorter delay time (Fig. 8 A, left; green line), whereas nocodazole caused no significant change (Fig. 8 A, dark yellow line). Assuming that the mobility components are identical, fitting to the three-component model showed that the LAT treatment reduced the slow fractions to 37.2%, but neither nocodazole (62.6%) nor vehicle alone (63.8%) had this effect (Fig. 8 A). Furthermore, the LAT treatment had little effect on G(τ) of YE (Fig. 8 A, right; inset). To confirm the dramatic effects of LAT on YE(gly)2 diffusion, we measured the change in G(τ) in a single cell before and after the treatment. G(τ) was nearly identical at 0 and 5 min before the addition of LAT (Fig. 8 B). Immediately after the 5-min measurement, we placed medium containing LAT onto the cells and measured the same spot after a 4-min incubation (Fig. 8 B, 11 min). The curve was clearly shifted to the left, particularly around the delay time of 1 ms. The faster decay was still evident 8 min after LAT (Fig. 8 B, 15 min). Fitting showed that the fastest component increased from ∼40 to >70% (Fig. 8 B). Essentially the same effects were observed with cytochalasin B, which blocks monomer association/dissociation at the barbed end of actin polymers (Fig. 9 A; Cooper, 1987). To confirm that these reagents actually disturbed filamentous actin formation, we generated cells stably expressing YFP-actin and recorded images of the microfilaments in a single cell before and after treatment. The thick actin filaments largely disappeared after 15 min of incubation with LAT (Fig. 8 C). After the treatment with cytochalasin B, most of the actin became aggregated in a coarse networklike pattern, and actin asters formed within 15 min (Fig. 9 B), which is in agreement with a previous study (Verkhovsky et al., 1997). We next examined the effect of jasplakinolide, which inhibits actin depolymerization (Bubb et al., 2000). Although the treatment resulted in a slight increase in the mean value for the slower component fraction, the difference was small (Fig. 9 A).
Figure 8.

LAT dramatically alters the diffusion profile of glycoproteins. (A) Cells expressing YE(gly)2 were pretreated with vehicle (N,N-dimethylformamide), 1 μM LAT for 5 min, or 66 μM nocodazole for 60 min. The G(τ) of YE(gly)2 in each condition is shown. The number of measurements was 52 for vehicle, 33 for LAT, and 46 for nocodazole. G(τ) was assumed to be composed of the same components as in Fig. 3, and the best fits to the model are shown. (inset) LAT treatment has little effect on the diffusion of YE. G(τ) was measured in YE-expressing cells treated with vehicle or with LAT for 8 min. Number of measurements = 23. Means with 95% confidence interval are shown. (B) Time lapse of the diffusion profile in a single cell. Diffusion of YE(gly)2 in a single spot of a cell was recorded for a total of 15 min. 1 ml of medium containing 2 μM LAT was added at 7 min, immediately after the second FCS measurement. Images of the cell are shown before and after the treatment. G(τ) was obtained at 0, 5, 11, and 15 min. The best fits are shown. (C) Images of YFP-actin in a single cell before and after the treatment. The numerous filamentous fibers of YFP-actin were diminished after treatment. Bars: (B) 5 μm; (C) 1 μm.
Figure 9.

Effects of a cytochalasin B and a gelsolin fragment on the diffusion of YE(gly)2. (A) Effects of cytochalasin B (cyto) and jasplakinolide (jas) on the autocorrelation of YE(gly)2. Cells expressing YE(gly)2 were pretreated with vehicle, 1 μM jasplakinolide, or 20 μM cytochalasin B for 15 min. The obtained G(τ) is shown with 95% confidence interval. The number of measurements was 25 for vehicle, 52 for jasplakinolide, and 18 for cytochalasin B. The best fit is shown (right). (B) Alteration of filamentous YFP-actin in a single cell by cytochalasin B treatment for 15 min. (C) Effects of Ch-gelsolN on YFP-actin. Ch-gelsolN was transiently expressed for 16 h in cells stably expressing YFP-actin. Single asterisks indicate cells expressing Ch-gelsolN, double asterisks indicate a rounded cell extensively expressing Ch-gelsolN, and the arrowhead indicates filamentous actin. (D) G(τ) of YE(gly)2 in cells coexpressing YE(gly)2 with Ch-gelsolN or Ch. The number of measurements was 52 for Ch-gelsolN and 21 for Ch. The best fit is shown. Bars, 5 μm.
To confirm whether appearance of the slowly diffusing YE(gly)2 was related to the formation of actin gels, we used the N-terminal fragment of gelsolin, which caps the plus end of actin and converts actin gels to a sol by fragmenting filaments (Cooper et al., 1987). When the gelsolin fragment was fused to mCherry (Ch-gelsolN) and transiently expressed in cells stably expressing YFP-actin, actin fibers (Fig. 9 C, arrowhead) were reduced (Fig. 9 C, single asterisks), and some cells highly expressing Ch-gelsolN became round (Fig. 9 C, double asterisks). To examine the effects on YE(gly)2, the cells were first transfected with Ch-gelsolN or an mCherry (Ch) vector and, 12 h later, were bead loaded with the vector for YE(gly)2. The results of FCS analyses were consistent with those of LAT and cytochalasin B and showed a marked increase (from 36.0 to 72.0%) of the simple diffusion component (Fig. 9 D).
The simplest model to explain these observations was to hypothesize the presence of one or more membrane-spanning lectins that interact with microfilaments (Fig. 10 A). In this model, the putative lectins are immobilized at least to the same degree as VSVG under conditions of hyperosmolarity as a result of accelerated actin-gel formation. Therefore, we examined the effects of hypertonicity on the mobility of lectin-related membrane proteins (Table I). Calnexin is a well-characterized lectinlike chaperone with affinity toward monoglucosylated proteins (Schrag et al., 2001; Moremen and Molinari, 2006; Williams, 2006). Unlike our observations with VSVG, hypertonicity led to only a transient decrease in the mobile fraction for YFP-calnexin, and full mobility resumed at 60 min. Calnexin(Y163F) and UDP-glucose–glycoprotein glucosyltransferase (UGGT) showed similar responses. The intracellular C-type lectins ERGIC53 (Hauri et al., 2000a) and VIP36 (Kamiya et al., 2005) and their inactive mutants (N516A and N166A, respectively) also were not potently immobilized by hyperosmolarity. However, another lectin, VIPL (Nufer et al., 2003), showed potent and sustained immobilization. Although this immobilization was almost abolished when we used the inactive mutant N163A (Nufer et al., 2003), knockdown of VIPL slightly increased the faster component from 40.7 to 48.8% (Fig. S5 C).
Figure 10.

Proposed mechanisms for the regulated diffusion of cargo glycoproteins. For either model, we assume that one or more lectins (shown as rods or bullets) with weak affinity for N-glycans transiently bind to N-glycans only when oligomerized. (A) Oligomerization is caused by direct tethering to polymerized actin. (B) A local concentration of the putative lectins occurs by confinement in a microdomain, which is transiently generated by an actin fiber fence, and the clustered lectins trap the glycoproteins. In either case, turnover of actin is greatly reduced under hyperosmolarity, and, thus, glycoproteins become nearly immobilized.
Discussion
The endoplasmic reticulum is capable of exporting a large amount of properly folded secretory proteins. Because their quality should be affected by diffusional motion during folding, we examined the possibility that there is a general mechanism to limit simple diffusion in the ER. In this study, we have provided evidence that cargo diffusion in the ER lumen is controlled by the actin cytoskeleton through links to N-glycans.
We propose two models that could explain this mechanism (Fig. 10). According to the direct binding model (Fig. 10 A), affinity for N-glycans is induced by oligomerization through binding to actin microfilaments. However, it is also conceivable that the lectins become clustered if they are stalled in a microdomain created by microfilaments distributed on the membrane, as has been proposed for cell surface proteins (Morone et al., 2006). Therefore, we propose an alternative model in which glycoproteins are transiently trapped onto membranes by stochastically formed groups of high-affinity lectins (Fig. 10 B). In this model, we assume that the actin-based filament functions as a diffusion barrier for membrane proteins that can eventually cross the barrier, which should be continuously remodeled by actin turnover (Theriot and Mitchison, 1991; McGrath et al., 1998). In both models, immobilization of glycoproteins under hyperosmolarity can be explained by a solidified barrier that forms as a result of an actin equilibrium shift (Fig. S4 A). The membrane skeleton, a dense meshwork of fibers that includes actin, directly attaches to the plasma membrane (Morone et al., 2006), and this undercoat structure is thought to be the basis of the aberrant diffusion of cell surface molecules (Kusumi et al., 2005). Consistent with this, it has been reported that the diffusion law of transmembrane proteins is actin dependent, and disruption of the actin-based cytoskeleton reverses restrictions in diffusion (Lenne et al., 2006). The role of actin filaments in ER function is less well documented, but a recent extensive proteomic study revealed that β-actin and various actin-binding proteins are abundantly expressed in the ER (Gilchrist et al., 2006). Consistent with this, development in Dictyostelium discoideum lacking interaptin, an α-actinin family protein localized in the ER, is delayed (Rivero et al., 1998). Requirement of the actin cytoskeleton for ER structure formation has also been reported in yeast (Voeltz et al., 2002) and in Caenorhabditis elegans (Poteryaev et al., 2005).
Both models assume the presence of lectinlike proteins and modulation of the affinity by oligomerization, a common feature of various lectins (Brinda et al., 2005). This evokes a well-characterized phenomenon in which some monomeric intracellular lectins have low or negligible affinity for ligands, but their oligomerization markedly increases the affinity (Hauri et al., 2000b; Kawasaki et al., 2006). For leguminous isolectins, forming trimers increases the ligand affinity >10-fold (Knibbs et al., 1998). Mannose-binding lectin, a serum protein that acts in innate immunity, forms covalently linked large oligomers; a reduction in its oligomerization correlates with reduced ligand binding (Larsen et al., 2004). ERGIC53 also forms covalently linked dimers and hexamers (Schweizer et al., 1988), which are required for sugar binding (Carriere et al., 1999). Monomeric subunits may exhibit significant sugar binding affinity only when clustered, as depicted in Fig. 10. To search for the key lectins involved in cargo diffusion in the ER, we examined various lectinlike proteins and found that none of the major lectins satisfied model A. However, the response of VIPL to hypertonicity was distinct in that it was immobilized even after 60 min. Although an inactive form of VIPL, an N163A mutant, did not show the same extent of immobilization, this observation is still compatible with model B because substrate binding and microfilament-induced clustering can be cooperative. Consistent with this scenario, the presence of at least two oligosaccharides was necessary for immobilization. Thus, we think that multivalency may be the direct cause of hypertonicity-induced immobilization. This model does not exclude the involvement of other lectins. The weak effect of VIPL knockdown in reducing the slow population of YE(gly)2 (Fig. S5 C) may support this interpretation.
Lifetime analysis of a single glycoprotein in an evanescent field indicated that the slow components of YE(gly)2 are short lived (Fig. 3 B). This conclusion is based on the following: (1) the translational diffusion of YE(gly)2 measured by TIRFM was nearly identical to that of an inert membrane protein (compare Figs. 4 C with 5 C); (2) the first passage time of YE(gly)2 was shorter than that of calnexin(Y163F)-YFP; and (3) the lifetime of YE(gly)2 was also short in a hypertonic condition despite its confined motion (Fig. 6 B). Lifetime frequency distribution is a useful tool to analyze the molecular dynamics of single intracellular proteins. It should be noted that there is a gap between the simulated curves based on Eq. 1 and the actual measurements. We think that this is caused by the increased frequency of photobleaching upon longer dwell time and that Eq. 1 assumes 100% reflection at the lumenal surface of the ER. Nevertheless, we have demonstrated the transient binding of soluble proteins to membranes using various dynamic measurements, including FLIP. This transient binding should help in assuring the quality of cargo proteins by reducing the chances of aggregation and, at the same time, promoting access to the folding machineries on the membranes. Importantly, the binding reaction appears to be brief, so it should not inhibit lumenal processes or export. This process resembles the calnexin cycle. We have previously shown that folding of nascent transferrin is transiently arrested in the calnexin complex while reglucosylation is allowed to proceed (Wada et al., 1997). Although this model has been questioned as a result of the subsequent observation of a large lag in dissociation of a client protein in cells lacking UGGT (Molinari et al., 2005; Solda et al., 2007), the dissociation of cargo should still be required for efficient folding. The exact reaction mechanism of the calnexin cycles might be elucidated if a single calnexin molecule could be visualized simultaneously with a cargo molecule. This should be possible by further improving the setup we have used to generate the data shown in Fig. 7.
As previously proposed (Dayel et al., 1999; Nehls et al., 2000; Sbalzarini et al., 2005; Snapp et al., 2006), we found that the mean displacement for YE(gly)2 was proportional to the square root of time except under hyperosmolarity. This was of interest because the ER is a lucent closed cisterna where influx and efflux continuously occur. ERESs in COS7 cells are clustered around the Golgi region (Fig. 7 A, left). Assuming that COPII-coated ERESs are where most secretory cargo are exported and that the majority of exportable content is composed of molecules imported through protein translocon channels, directional flow would be expected. Considering that the folding rates of proteins vary widely, the apparent lack of flow may be beneficial for the maturation in that it provides a delay time for export. On the other hand, acquisition of export competence may cause active motion. We believe that the simultaneous observation of cargo with ERESs (Fig. 7) has revealed a way to analyze cargo motion toward ERESs and to elucidate whether export-competent cargo proteins are stochastically trapped in ERESs or whether there is an active mechanism to ensure efficient export. These analyses will eventually allow a better understanding of how the ER compromises folding and export.
Materials and methods
Cells and expression of proteins
All proteins described in this study were genetically fused to enhanced YFP (EYFP; Clontech Laboratories, Inc.). We refer to EYFP as YFP. Unless otherwise stated, the fusion proteins used in this study were expressed in COS7 cells using the siliconized glass microbead-loading method (Nagaya et al., 2002) and were measured 30 min to 3 h after bead loading. VSVG-YFP, tyrosinase-YFP, and the KDEL receptor have been previously described (Nagaya et al., 2002; Kamada et al., 2004). The vector pEYFP-ER expresses the YFP variant protein YE, which contains an N-terminal cleavable calreticulin signal sequence and a C-terminal KDEL ER retention signal and was purchased from Clontech Laboratories, Inc. DiOC6 was purchased from Invitrogen. The vector for monoglycosylated YE (YE(gly)1) was created by inserting a double-stranded oligonucleotide DNA at the BsrGI site made by annealing a forward primer GTACGAGAACCTCACGGATGA and a reverse primer GTACTCATCCGTGAGGTTCTC. The resulting YE(gly)1 protein contained a seven–amino acid insert (YENLTDE) after L253. The vector for doubly glycosylated YE (YE(gly)2) was created by mutating E229K230R231 to L229T230S231 using the QuikChange protocol (Stratagene). The mature portion of the α1-antitrypsinnullHongKong mutant (NHK) was inserted into the BsrGI site of the YE expression plasmid, resulting in the fusion protein NHK-YFP. Construction or mutation of other expression vectors are described in the Construction of expression vectors encoding proteins… section. For the expression of YE(gly)2 in Ch-gelsolN–expressing cells, the YE(gly)2 expression vector was bead loaded using Lipofectamine2000 (Invitrogen) 12 h after transfection of the Ch-gelsolN or Ch expression vector. FCS recording was performed 2 h after YE(gly)2 plasmid loading. COS7 cells stably expressing mStrawberry-Sec13 or YFP-actin (Clontech Laboratories, Inc.) were established by infection with the recombinant retrovirus generated using each of the fluorescent protein–tagged cDNAs cloned into the pCX4bsr vector as previously described (Kamada et al., 2004; Hatsuzawa et al., 2006).
Construction of expression vectors encoding proteins fused to fluorescent proteins
Primers used to isolate and construct expression vectors are summarized in Table S1 (available at http://www.jcb.org/cgi/content/full/jcb.200704078/DC1). In brief, each cDNA was reverse transcribed using the primers listed in the second column in Table S1 followed by amplification and attachment of restriction sites using the pairs of primers designated in the last two columns. The mature region of esterase, calnexin, ERGIC53, VIP36, VIPL, or UGGT1 was inserted into the BsrGI site of YE as described for the construction of NHK-YFP above (see the Cells and expression of proteins section). The mature region of BiP was inserted into the BsiWI site of YE. Ero1L was subcloned into the Kpn–BamHI site of EYFP-N1. To construct a tandem dimer of YE (that is, Y2E), YFP was inserted into the BsrGI–EcoRI site of YE. cDNA of the N-terminal fragment (1–379 amino acids) of cytoplasmic gelsolin was inserted into the NheI–HindIII site of mCherry N1, in which the cDNA of YFP in EYFP-N1 (Clontech Laboratories, Inc.) was replaced with that of mCherry (Shaner et al., 2004).
RNA interference and quantitation of mRNA expression
RNA interference of VIPL was performed with Stealth RNA select (ID HSS129913; Invitrogen) or control siRNA (5′-GUACCGCACGUCAUUCGUAUC-3′) using Lipofectamine 2000 according to the manufacturer's protocol. Knockdown in COS7 cells was performed in one well of an eight-well Labtech chamber (Thermo Fisher Scientific) at an siRNA concentration of 12.5 nM. RNA was extracted using RNAiso (Takara Bio) from cells transfected with Stealth siRNA (Invitrogen) at 24 h after transfection. cDNA was synthesized from the total RNA using SuperscriptIII (Invitrogen) with an oligo(dT) primer. For real-time PCR, the prepared cDNA wasanalyzed in triplicate with the SYBR PremixEX Taq (Takara Bio) in a LightCycler (Roche). The primer sequences used for glyceraldehyde-3-phosphate dehydrogenase were 5′-AAGGTGAAGGTCGGAGTCAA-3′ and 5′-CATGGGTGGAATCATATTGG-3′, and those for VIPL were 5′-TCTCAGCCATGGTGAACAAC-3′ and 5′-TAGCGAATCACCAGGAAGGT-3′. The relative amount of cDNA was calculated using a comparative cycle threshold method (Livak and Schmittgen, 2001) and was normalized to glyceraldehyde-3-phosphate dehydrogenase.
Biochemical experiments
For enzymatic deglycosylation of cell lysates, cells in a 24-well dish were transfected with each vector using Lipofectamine 2000 and were directly lysed with 40 μl of 0.5% SDS/10 mM Tris-Cl, pH 7.5. After the addition of 5 μl of 10% Triton X-100, half of each sample was digested with 1,000 U PNGaseF (peptide–N-glycosidase F) for 1 h at 37°C. Mock and PNGaseF-digested lysates were then directly analyzed by immunoblotting using an anti-GFP antibody. The bands were visualized using ECL Western blotting detection reagents (GE Healthcare).
Mobility measurements in living cells
To reduce fluorescence background, protein expression and measurements were performed in COS7 cells cultured in 1% FBS containing phenol red–free MEM with Hanks' salts from which riboflavin and pyridoxal hydrochloride were omitted. The optical apparatus for FRAP and FCS were set up essentially as described previously (Kamada et al., 2004) except that the dishes were kept in a closed stage chamber (95% air and 5% CO2; Tokaihit) and heated with an object heater (Bioptechs). Except for the experiments described in Figs. 2 C and S4 A, a circle of 4-μm radius was photobleached for five iterations, and pre- and postbleach images were recorded at the lowest laser intensity. For experiments shown in Figs. 2 C and S4 A, a radius of 2.34 μm was used. The osmolarity of the medium was adjusted by adding sorbitol. FRAP data were normalized and fitted according to the method of Jacobson et al. (1976) with the exception of the data in Fig. S4 A, in which the protocol of Axelrod et al. (1976) was applied to determine the diffusion of rapidly diffusing molecules. To minimize the effects of molecular crowding, FRAP was performed in cells whose total fluorescence intensity was comparable with those used for FCS recordings.
FCS measurements were performed on a microscope (ConfoCor2; Carl Zeiss, Inc.) with a 40× NA 1.2 water immersion objective (C-Apochromat; Carl Zeiss, Inc.). The samples were excited at 514 nm with a 30-mW argon laser, and emissions were collected through a 530–600-nm bandpass filter. To avoid damage and photobleaching by continuous laser illumination during FCS, we chose a single spot in a cell and recorded the fluorescence intensity of each spot three times for 10 s, with 2-s intervals without recording at the same laser recording output to reduce the effect of the immobile population. Typically, laser power at the back aperture was ∼5.0–6.5 μW. To avoid the crowding effects caused by overexpression, we measured spots whose initial count rates were <100 kHz (Kamada et al., 2004). From the 50–200 autocorrelation curves obtained, we excluded data whose initial count rates were >100 kHz and those whose mean intensities were not constant during a single recording period (Kamada et al., 2004). The autocorrelation function G(τ) is defined as
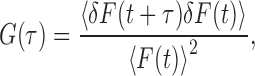 |
where F(t) is the fluorescence at time τ, 〈F(t)〉 is the mean fluorescence, and δF(τ) = F(t) − 〈F(τ)〉 is the fluctuation of the fluorescence at time t from its mean value. To obtain the diffusion time, we used an intensity-normalized three-dimensional diffusion model,
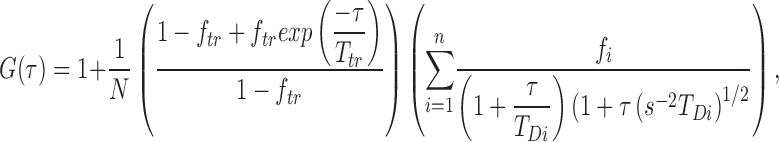 |
in which N is the mean number of fluorescent molecules in the confocal volume, ftr and Ttr are the fraction and decay time of the triplet state (Widengren et al., 1995), respectively, n is the number of the components subjected to the normalization constraint
 |
and s is the fraction of the distance from the laser beam focus in the radial to axial direction. TDi is the diffusion time of the i-th component. To estimate the number of diffusion components, we started from a one-component diffusion model and considered more components if this did not give a satisfactory fit. Diffusion coefficients were converted from the fitted diffusion time using a rhodamine green solution as a standard (280 μm2/s). For estimation of hydrodynamic diameters, COS7 cells stably expressing YE or YE(gly)2 in a 35-mm dish were lysed with 100 μl of lysis buffer (0.5% sodium cholate, 0.15 M NaCl, and 10 mM Tris-Cl, pH 7.5). The lysates were centrifuged at 10,000 g for 5 min at 4°C, and the supernatants were directly measured with FCS.
To perform quantitative FLIP, we photobleached a narrow strip (5 pixels wide) in the ER for 20 iterations. The fluorescence signal of the entire ER of each cell was measured before and immediately after the photobleaching and was normalized to the change in total fluorescence. Pixel time of bleaching and recording was 6.4 μs, and each image was composed of 1,024 × 1,024 pixels. The normalized data were fitted to a two-phase exponential decay form using Prism 4 (GraphPad Software) as described in Fig. S1 B because a single-phase exponential decay form failed to fit.
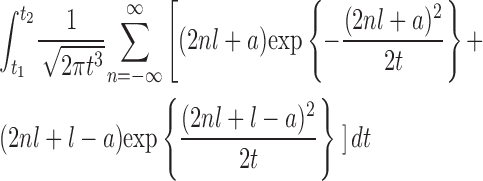
Objective-based TIRFM was obtained by using a 488-nm Sapphire laser (20 mW; Coherent) through a side port of an inverted microscope (TE2000; Nikon). The beam was focused on the periphery of the back focal plane of a 60× 1.45 NA oil-immersion objective (Nikon). Streaming images were captured by a back-illuminated frame-transfer CCD digital imaging system with on-chip multiplication gain (Cascade 512B; Roper Scientific) at exposure times of ∼5–30 ms through appropriate combinations of filters. The obtained image data were recorded and linearly adjusted with MetaMorph v6.2 (MDS Analytical Technologies). All images were processed using CANVAS version 9.05 (ACD Systems). Translational mobilities of fluorescent spots were measured using ImageJ version 1.36b (National Institutes of Health) with a SpotTracker2D plug-in (Sage et al., 2005). Kymographs, in which one-pixel lines were compiled sequentially along the length for each frame to create a composite image, were made with an Align Stacks plug-in. The diffusion coefficient, D, was determined from the relationship 〈MSD〉 = 4DT. Mathematical analysis or simulation was performed using OriginPro version 7.5J (OriginLab Corp.). To extract information on mobility from the lifetime distribution of observed single molecules, we used the fundamental solution of the diffusion equation
 |
with the initial condition u(0, x) = δ(a). The solution u(t, x) = P(t, a, x) is given by
 |
In probabilistic interpretation, P(t, a, x) is the probability density of determining the Brownian particle at x = x0 at time t, which starts from x = a at t = 0. For l and a (0 < a < l), let Ta,l be a first passage time of standard one-dimensional Brownian motion, B(t), from x = a to x = 0 or l. Ta,l is an epoch at which the particle reaches the positions x = 0 or 1 for the first time. In this sense, Ta,l represents the lifetime of the particle. The density of Ta,l is given by the equation
 |
2 |
(Karatzas and Shreve, 1991). Probability density of particle A diffusing at a coefficient of dA is given by Eq. 1 (see Results). For simultaneous recording of the YFP and mStrawberry signals, the emission beam excited at 488 nm was split with DualView (Roper Scientific) using a GFP/mRFP1 fluorescence resonance energy transfer filter set to project the YFP and mStrawberry components side by side. mStrawberry (Shaner et al., 2004) can be excited by 488-nm light, and the fluorescence is emitted in a red channel (602–682 nm).
First passage time of B(t) and its density
Let B(t) be a standard one-dimensional Brownian motion starting from x = a (0 < a < l). Then, the first passage time, Ta,l, of B(t) to the positions x = 0 or l is defined by  (with B(0) = a). In other words, Ta,l represents the lifetime of the Brownian particle. The density of Ta,l is given by Eq. 2; that is, P(t
1
≤
Ta
,
l
≤
t
2) =
(with B(0) = a). In other words, Ta,l represents the lifetime of the Brownian particle. The density of Ta,l is given by Eq. 2; that is, P(t
1
≤
Ta
,
l
≤
t
2) =
 |
for arbitrary t 1 and t 2 (0 < t 1 < t 2).
The density of the first passage time of M(t) = B(2dAt)
Set M(t) = B(2dAt) and let  be the first passage time of M(t) starting from x = a to the positions x = 0 or l. Because
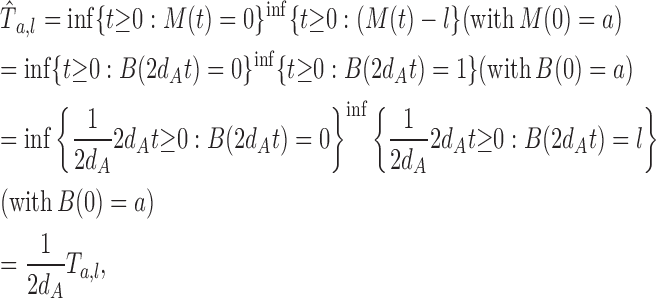 |
we have, for arbitrary t 1 and t 2 (0 < t 1 < t 2), P(t 1 ≤ t 2) = P(2dAt 1 ≤ Ta,l ≤ 2dAt 2)
 |
Therefore, the density  is given by Eq.1.
Online supplemental material
Fig. S1 shows FLIP analysis of YE(gly)2. Fig. S2 shows that when observed by TIRFM, a single spot of ER cargo represents a single molecule in the ER. Fig. S3 shows the simulation of lifetime frequency distribution according to Eq. 1. Fig. S4 shows that hypertonicity induces actin polymerization and that LAT treatment reduces hypertonicity-induced immobilization. Fig. S5 shows the effect of VIPL knockdown on YE(gly)2 diffusion. Table S1 provides a list of primers used to construct expression vectors. Videos show streaming images of YE(gly)2 (Videos 1, 2, and 5), VSVG-YFP (Video 3), and calnexin(Y163F)-YFP (Video 4) in living cells. Online supplemental material is available at http://www.jcb.org/cgi/content/full/jcb.200704078/DC1.
Supplemental Material
Acknowledgments
We thank Drs. Yasushi Sako (Institute of Physical and Chemical Research, Saitama, Japan) and Hiroshi Kimura (Osaka University, Osaka, Japan) for helpful discussions. We also thank Ms. Pamela H. Cameron (McGill University, Montreal, Canada) for help in the preparation of this manuscript.
This work was supported, in part, by grants-in-aid from the Japan Society for the Promotion of Science and by the Ministry of Education, Culture, Sports, Science and Technology of Japan.
Abbreviations used in this paper: ERES, ER exit site; EYFP, enhanced YFP; FCS, fluorescence correlation spectroscopy; FLIP, fluorescence loss induced by photobleaching; LAT, latrunculin B; MSD, mean square displacement; TIRFM, total internal reflection fluorescence microscopy; VSVG, vesicular stomatitis virus glycoprotein; YE, EYFP-ER.
References
- Axelrod, D., D.E. Koppel, J. Schlessinger, E. Elson, and W.W. Webb. 1976. Mobility measurement by analysis of fluorescence photobleaching recovery kinetics. Biophys. J. 16:1055–1069. [DOI] [PMC free article] [PubMed] [Google Scholar]
- Brinda, K.V., A. Surolia, and S. Vishveshwara. 2005. Insights into the quaternary association of proteins through structure graphs: a case study of lectins. Biochem. J. 391:1–15. [DOI] [PMC free article] [PubMed] [Google Scholar]
- Bubb, M.R., I. Spector, B.B. Beyer, and K.M. Fosen. 2000. Effects of jasplakinolide on the kinetics of actin polymerization. An explanation for certain in vivo observations. J. Biol. Chem. 275:5163–5170. [DOI] [PubMed] [Google Scholar]
- Carriere, V., V. Piller, A. Legrand, M. Monsigny, and A.C. Roche. 1999. The sugar binding activity of MR60, a mannose-specific shuttling lectin, requires a dimeric state. Glycobiology. 9:995–1002. [DOI] [PubMed] [Google Scholar]
- Cooper, J.A. 1987. Effects of cytochalasin and phalloidin on actin. J. Cell Biol. 105:1473–1478. [DOI] [PMC free article] [PubMed] [Google Scholar]
- Cooper, J.A., J. Bryan, B. Schwab III, C. Frieden, D.J. Loftus, and E.L. Elson. 1987. Microinjection of gelsolin into living cells. J. Cell Biol. 104:491–501. [DOI] [PMC free article] [PubMed] [Google Scholar]
- Dayel, M.J., E.F. Hom, and A.S. Verkman. 1999. Diffusion of green fluorescent protein in the aqueous-phase lumen of endoplasmic reticulum. Biophys. J. 76:2843–2851. [DOI] [PMC free article] [PubMed] [Google Scholar]
- Di Ciano-Oliveira, C., A.C. Thirone, K. Szaszi, and A. Kapus. 2006. Osmotic stress and the cytoskeleton: the R(h)ole of Rho GTPases. Acta Physiol (Oxf). 187:257–272. [DOI] [PubMed] [Google Scholar]
- Ellgaard, L., and A. Helenius. 2003. Quality control in the endoplasmic reticulum. Nat. Rev. Mol. Cell Biol. 4:181–191. [DOI] [PubMed] [Google Scholar]
- Garcia-Perez, A., and M.B. Burg. 1991. Renal medullary organic osmolytes. Physiol. Rev. 71:1081–1115. [DOI] [PubMed] [Google Scholar]
- Gilchrist, A., C.E. Au, J. Hiding, A.W. Bell, J. Fernandez-Rodriguez, S. Lesimple, H. Nagaya, L. Roy, S.J. Gosline, M. Hallett, et al. 2006. Quantitative proteomics analysis of the secretory pathway. Cell. 127:1265–1281. [DOI] [PubMed] [Google Scholar]
- Hammond, A.T., and B.S. Glick. 2000. Dynamics of transitional endoplasmic reticulum sites in vertebrate cells. Mol. Biol. Cell. 11:3013–3030. [DOI] [PMC free article] [PubMed] [Google Scholar]
- Hauri, H., C. Appenzeller, F. Kuhn, and O. Nufer. 2000. a. Lectins and traffic in the secretory pathway. FEBS Lett. 476:32–37. [DOI] [PubMed] [Google Scholar]
- Hatsuzawa, K., T. Tamura, H. Hashimoto, S. Yokoya, M. Miura, H. Nagaya, and I. Wada. 2006. Involvement of syntaxin 18, an endoplasmic reticulum (ER)-localized SNARE protein, in ER-mediated phagocytosis. Mol. Biol. Cell. 17:3964–3977. [DOI] [PMC free article] [PubMed] [Google Scholar]
- Hauri, H.P., F. Kappeler, H. Andersson, and C. Appenzeller. 2000. b. ERGIC-53 and traffic in the secretory pathway. J. Cell Sci. 113:587–596. [DOI] [PubMed] [Google Scholar]
- Heuser, J.E., and R.G. Anderson. 1989. Hypertonic media inhibit receptor-mediated endocytosis by blocking clathrin-coated pit formation. J. Cell Biol. 108:389–400. [DOI] [PMC free article] [PubMed] [Google Scholar]
- Jacobson, K., E. Wu, and G. Poste. 1976. Measurement of the translational mobility of concanavalin A in glycerol-saline solutions and on the cell surface by fluorescence recovery after photobleaching. Biochim. Biophys. Acta. 433:215–222. [DOI] [PubMed] [Google Scholar]
- Jaiswal, J.K., and S.M. Simon. 2007. Imaging single events at the cell membrane. Nat. Chem. Biol. 3:92–98. [DOI] [PubMed] [Google Scholar]
- Kamada, A., H. Nagaya, T. Tamura, M. Kinjo, H.Y. Jin, T. Yamashita, K. Jimbow, H. Kanoh, and I. Wada. 2004. Regulation of immature protein dynamics in the endoplasmic reticulum. J. Biol. Chem. 279:21533–21542. [DOI] [PubMed] [Google Scholar]
- Kamiya, Y., Y. Yamaguchi, N. Takahashi, Y. Arata, K. Kasai, Y. Ihara, I. Matsuo, Y. Ito, K. Yamamoto, and K. Kato. 2005. Sugar-binding properties of VIP36, an intracellular animal lectin operating as a cargo receptor. J. Biol. Chem. 280:37178–37182. [DOI] [PubMed] [Google Scholar]
- Kapoor, M., L. Ellgaard, J. Gopalakrishnapai, C. Schirra, E. Gemma, S. Oscarson, A. Helenius, and A. Surolia. 2004. Mutational analysis provides molecular insight into the carbohydrate-binding region of calreticulin: pivotal roles of tyrosine-109 and aspartate-135 in carbohydrate recognition. Biochemistry. 43:97–106. [DOI] [PubMed] [Google Scholar]
- Karatzas, I., and E.S. Shreve. 1991. Brownian Motion and Stochastic Calculus. Springer-Verlag, New York. 470 pp.
- Kawasaki, N., I. Matsuo, K. Totani, D. Nawa, N. Suzuki, D. Yamaguchi, N. Matsumoto, Y. Ito, and K. Yamamoto. 2006. Detection of weak sugar binding activity of VIP36 using VIP36-streptavidin complex and membrane-based sugar chains. J. Biochem. (Tokyo). 141:221–229. [DOI] [PubMed] [Google Scholar]
- Knibbs, R.N., M. Takagaki, D.A. Blake, and I.J. Goldstein. 1998. The role of valence on the high-affinity binding of Griffonia simplicifolia isolectins to type A human erythrocytes. Biochemistry. 37:16952–16957. [DOI] [PubMed] [Google Scholar]
- Kusumi, A., Y. Sako, and M. Yamamoto. 1993. Confined lateral diffusion of membrane receptors as studied by single particle tracking (nanovid microscopy). Effects of calcium-induced differentiation in cultured epithelial cells. Biophys. J. 65:2021–2040. [DOI] [PMC free article] [PubMed] [Google Scholar]
- Kusumi, A., C. Nakada, K. Ritchie, K. Murase, K. Suzuki, H. Murakoshi, R.S. Kasai, J. Kondo, and T. Fujiwara. 2005. Paradigm shift of the plasma membrane concept from the two-dimensional continuum fluid to the partitioned fluid: high-speed single-molecule tracking of membrane molecules. Annu. Rev. Biophys. Biomol. Struct. 34:351–378. [DOI] [PubMed] [Google Scholar]
- Larsen, F., H.O. Madsen, R.B. Sim, C. Koch, and P. Garred. 2004. Disease-associated mutations in human mannose-binding lectin compromise oligomerization and activity of the final protein. J. Biol. Chem. 279:21302–21311. [DOI] [PubMed] [Google Scholar]
- Lederkremer, G.Z., and M.H. Glickman. 2005. A window of opportunity: timing protein degradation by trimming of sugars and ubiquitins. Trends Biochem. Sci. 30:297–303. [DOI] [PubMed] [Google Scholar]
- Lee, T.H., and A.D. Linstedt. 1999. Osmotically induced cell volume changes alter anterograde and retrograde transport, Golgi structure, and COPI dissociation. Mol. Biol. Cell. 10:1445–1462. [DOI] [PMC free article] [PubMed] [Google Scholar]
- Lenne, P.F., L. Wawrezinieck, F. Conchonaud, O. Wurtz, A. Boned, X.J. Guo, H. Rigneault, H.T. He, and D. Marguet. 2006. Dynamic molecular confinement in the plasma membrane by microdomains and the cytoskeleton meshwork. EMBO J. 25:3245–3256. [DOI] [PMC free article] [PubMed] [Google Scholar]
- Livak, K.J., and T.D. Schmittgen. 2001. Analysis of relative gene expression data using real-time quantitative PCR and the 2(-Delta Delta C(T)) Method. Methods. 25:402–408. [DOI] [PubMed] [Google Scholar]
- McGrath, J.L., Y. Tardy, C.F. Dewey Jr., J.J. Meister, and J.H. Hartwig. 1998. Simultaneous measurements of actin filament turnover, filament fraction, and monomer diffusion in endothelial cells. Biophys. J. 75:2070–2078. [DOI] [PMC free article] [PubMed] [Google Scholar]
- Mellquist, J.L., L. Kasturi, S.L. Spitalnik, and S.H. Shakin-Eshleman. 1998. The amino acid following an asn-X-Ser/Thr sequon is an important determinant of N-linked core glycosylation efficiency. Biochemistry. 37:6833–6837. [DOI] [PubMed] [Google Scholar]
- Meunier, L., Y.K. Usherwood, K.T. Chung, and L.M. Hendershot. 2002. A subset of chaperones and folding enzymes form multiprotein complexes in endoplasmic reticulum to bind nascent proteins. Mol. Biol. Cell. 13:4456–4469. [DOI] [PMC free article] [PubMed] [Google Scholar]
- Molinari, M., C. Galli, O. Vanoni, S.M. Arnold, and R.J. Kaufman. 2005. Persistent glycoprotein misfolding activates the glucosidase II/UGT1-driven calnexin cycle to delay aggregation and loss of folding competence. Mol. Cell. 20:503–512. [DOI] [PubMed] [Google Scholar]
- Moremen, K.W., and M. Molinari. 2006. N-linked glycan recognition and processing: the molecular basis of endoplasmic reticulum quality control. Curr. Opin. Struct. Biol. 16:592–599. [DOI] [PMC free article] [PubMed] [Google Scholar]
- Morone, N., T. Fujiwara, K. Murase, R.S. Kasai, H. Ike, S. Yuasa, J. Usukura, and A. Kusumi. 2006. Three-dimensional reconstruction of the membrane skeleton at the plasma membrane interface by electron tomography. J. Cell Biol. 174:851–862. [DOI] [PMC free article] [PubMed] [Google Scholar]
- Nagaya, H., I. Wada, Y.-J. Jia, and H. Kanoh. 2002. Diacylglycerol kinase delta suppresses ER-to-Golgi traffic via its SAM and PH domains. Mol. Biol. Cell. 13:302–316. [DOI] [PMC free article] [PubMed] [Google Scholar]
- Nehls, S., E.L. Snapp, N.B. Cole, K.J. Zaal, A.K. Kenworthy, T.H. Roberts, J. Ellenberg, J.F. Presley, E. Siggia, and J. Lippincott-Schwartz. 2000. Dynamics and retention of misfolded proteins in native ER membranes. Nat. Cell Biol. 2:288–295. [DOI] [PubMed] [Google Scholar]
- Nufer, O., S. Mitrovic, and H.P. Hauri. 2003. Profile-based data base scanning for animal L-type lectins and characterization of VIPL, a novel VIP36-like endoplasmic reticulum protein. J. Biol. Chem. 278:15886–15896. [DOI] [PubMed] [Google Scholar]
- Olveczky, B.P., and A.S. Verkman. 1998. Monte Carlo analysis of obstructed diffusion in three dimensions: application to molecular diffusion in organelles. Biophys. J. 74:2722–2730. [DOI] [PMC free article] [PubMed] [Google Scholar]
- Pedersen, S.F., E.K. Hoffmann, and J.W. Mills. 2001. The cytoskeleton and cell volume regulation. Comp. Biochem. Physiol. A Mol. Integr. Physiol. 130:385–399. [DOI] [PubMed] [Google Scholar]
- Petrescu, A.J., T.D. Butters, G. Reinkensmeier, S. Petrescu, F.M. Platt, R.A. Dwek, and M.R. Wormald. 1997. The solution NMR structure of glucosylated N-glycans involved in the early stages of glycoprotein biosynthesis and folding. EMBO J. 16:4302–4310. [DOI] [PMC free article] [PubMed] [Google Scholar]
- Poteryaev, D., J.M. Squirrell, J.M. Campbell, J.G. White, and A. Spang. 2005. Involvement of the actin cytoskeleton and homotypic membrane fusion in ER dynamics in Caenorhabditis elegans. Mol. Biol. Cell. 16:2139–2153. [DOI] [PMC free article] [PubMed] [Google Scholar]
- Rigler, R., and E.S. Elson. 2001. Fluorescence Correlation Spectroscopy: Theory and Applications. Springer-Verlag, New York. 487 pp.
- Rivero, F., A. Kuspa, R. Brokamp, M. Matzner, and A.A. Noegel. 1998. Interaptin, an actin-binding protein of the alpha-actinin superfamily in Dictyostelium discoideum, is developmentally and cAMP-regulated and associates with intracellular membrane compartments. J. Cell Biol. 142:735–750. [DOI] [PMC free article] [PubMed] [Google Scholar]
- Sage, D., F.R. Neumann, F. Hediger, S.M. Gasser, and M. Unser. 2005. Automatic tracking of individual fluorescence particles: application to the study of chromosome dynamics. IEEE Trans. Image Process. 14:1372–1383. [DOI] [PubMed] [Google Scholar]
- Sako, Y. 2006. Imaging single molecules in living cells for systems biology. Mol. Syst Biol. 2:56. [DOI] [PMC free article] [PubMed] [Google Scholar]
- Santos, B.C., J.M. Pullman, A. Chevaile, W.J. Welch, and S.R. Gullans. 2003. Chronic hyperosmolarity mediates constitutive expression of molecular chaperones and resistance to injury. Am. J. Physiol. Renal Physiol. 284:F564–F574. [DOI] [PubMed] [Google Scholar]
- Sbalzarini, I.F., A. Mezzacasa, A. Helenius, and P. Koumoutsakos. 2005. Effects of organelle shape on fluorescence recovery after photobleaching. Biophys. J. 89:1482–1492. [DOI] [PMC free article] [PubMed] [Google Scholar]
- Schrag, J.D., J.J. Bergeron, Y. Li, S. Borisova, M. Hahn, D.Y. Thomas, and M. Cygler. 2001. The structure of calnexin, an ER chaperone involved in quality control of protein folding. Mol. Cell. 8:633–644. [DOI] [PubMed] [Google Scholar]
- Schweizer, A., J.A. Fransen, T. Bachi, L. Ginsel, and H.P. Hauri. 1988. Identification, by a monoclonal antibody, of a 53-kD protein associated with a tubulo-vesicular compartment at the cis-side of the Golgi apparatus. J. Cell Biol. 107:1643–1653. [DOI] [PMC free article] [PubMed] [Google Scholar]
- Shaner, N.C., R.E. Campbell, P.A. Steinbach, B.N. Giepmans, A.E. Palmer, and R.Y. Tsien. 2004. Improved monomeric red, orange and yellow fluorescent proteins derived from Discosoma sp. red fluorescent protein. Nat. Biotechnol. 22:1567–1572. [DOI] [PubMed] [Google Scholar]
- Snapp, E.L., A. Sharma, J. Lippincott-Schwartz, and R.S. Hegde. 2006. Monitoring chaperone engagement of substrates in the endoplasmic reticulum of live cells. Proc. Natl. Acad. Sci. USA. 103:6536–6541. [DOI] [PMC free article] [PubMed] [Google Scholar]
- Solda, T., C. Galli, R.J. Kaufman, and M. Molinari. 2007. Substrate-specific requirements for UGT1-dependent release from calnexin. Mol. Cell. 27:238–249. [DOI] [PubMed] [Google Scholar]
- Spector, I., N.R. Shochet, Y. Kashman, and A. Groweiss. 1983. Latrunculins: novel marine toxins that disrupt microfilament organization in cultured cells. Science. 219:493–495. [DOI] [PubMed] [Google Scholar]
- Steyer, J.A., and W. Almers. 1999. Tracking single secretory granules in live chromaffin cells by evanescent-field fluorescence microscopy. Biophys. J. 76:2262–2271. [DOI] [PMC free article] [PubMed] [Google Scholar]
- Stossel, T.P. 1984. Contribution of actin to the structure of the cytoplasmic matrix. J. Cell Biol. 99:15s–21s. [DOI] [PMC free article] [PubMed] [Google Scholar]
- Tatu, U., and A. Helenius. 1997. Interactions between newly synthesized glycoproteins, calnexin and a network of resident chaperones in the endoplasmic reticulum. J. Cell Biol. 136:555–565. [DOI] [PMC free article] [PubMed] [Google Scholar]
- Theriot, J.A., and T.J. Mitchison. 1991. Actin microfilament dynamics in locomoting cells. Nature. 352:126–131. [DOI] [PubMed] [Google Scholar]
- Toomre, D., and D.J. Manstein. 2001. Lighting up the cell surface with evanescent wave microscopy. Trends Cell Biol. 11:298–303. [DOI] [PubMed] [Google Scholar]
- Verkhovsky, A.B., T.M. Svitkina, and G.G. Borisy. 1997. Polarity sorting of actin filaments in cytochalasin-treated fibroblasts. J. Cell Sci. 110:1693–1704. [DOI] [PubMed] [Google Scholar]
- Voeltz, G.K., M.M. Rolls, and T.A. Rapoport. 2002. Structural organization of the endoplasmic reticulum. EMBO Rep. 3:944–950. [DOI] [PMC free article] [PubMed] [Google Scholar]
- Wada, I., M. Kai, S. Imai, F. Sakane, and H. Kanoh. 1997. Promotion of transferrin folding by cyclic interactions with calnexin and calreticulin. EMBO J. 16:5420–5432. [DOI] [PMC free article] [PubMed] [Google Scholar]
- Widengren, J., L.T. Mets, and R. Rigler. 1995. Fluorescence correlation spectroscopy of triplet states in solution: a theoretical and experimental study. J. Phys. Chem. 99:13368–13379. [Google Scholar]
- Williams, D.B. 2006. Beyond lectins: the calnexin/calreticulin chaperone system of the endoplasmic reticulum. J. Cell Sci. 119:615–623. [DOI] [PubMed] [Google Scholar]
Associated Data
This section collects any data citations, data availability statements, or supplementary materials included in this article.