

Abstract
Objective:
The glycemic response to antihyperglycemic therapies for type 2 diabetes has been thoroughly evaluated in randomized controlled trials, but inadequately studied in real-world settings.
Study Design:
We studied glycemic response among 15 126 type 2 diabetic patients who initiated any single new antihyperglycemic agent (metformin, sulfonylureas, thiazolidinediones, or insulin added to medical nutrition therapy or to existing diabetes therapies) during 1999-2000 within Kaiser Permanente of Northern California, an integrated healthcare delivery system.
Methods:
Pre–post (3-12 months after initiation) change in glycosylated hemoglobin (A1C) was analyzed using ANCOVA (analysis of covariance) models adjusted for baseline A1C, concurrent (ongoing) antihyperglycemic therapy, demographics, health behaviors, medication adherence, clinical factors, and processes of care.
Results:
Mean A1C was 9.01% (95% confidence interval [CI] 8.98%-9.04%) before therapy initiation and 7.87% (95% CI 7.85%-7.90%) 3 to 12 months after initiation (mean A1C reduction 1.14 percentage points; 95% CI 1.11-1.17). Overall, 30.2% (95% CI 29.2%-31.1%) of patients achieved glycemic target (A1C < 7%). Although baseline disease severity and concurrent therapies differed greatly across therapeutic classes, after adjustment for these baseline clinical characteristics, no significant differences were noted in glucose-lowering effect across therapeutic classes. Treatment effects did not differ by age, race, diabetes duration, obesity, or level of renal function.
Conclusions:
Metformin, sulfonylures, thiazolidinediones, and insulin were equally effective in improving glucose control. Nonetheless, most patients failed to achieve the glycemic target. Findings suggest that, to keep up with progressive worsening of glycemic control, patients and providers must commit to earlier, more aggressive therapy intensification, triggered promptly after A1C exceeds the recommended glycemic target.
Maintaining tight blood glucose control is important in preventing microvascular complications of diabetes mellitus such as retinopathy and nephropathy.1,2 Although trends in glycemic control look favorable,3 national data suggest that a substantial proportion of patients remain poorly controlled.4-7 Moreover, as glycemic goals have been progressively lowered,8 achieving targets has become increasingly difficult.
While numerous randomized, placebo-controlled clinical trials have evaluated the efficacy of diabetes medications alone or in combinations,9 their effectiveness in usual clinical care settings has rarely been assessed. Furthermore, there is a concern that the effectiveness of diabetes medications may differ by clinical and demographic factors such as duration of diabetes, patient age, race, obesity, and chronic renal insufficiency.
We previously reported that, among patients with poorly controlled diabetes (glycosylated hemoglobin [A1C] > 8%) who initiated a new antihyperglycemic therapy, only a very low proportion (18.4%; 95% confidence interval [CI] 17.3%-19.4%) achieved glycemic target (A1C < 7%) within 3 to 12 months.10 In the present study, we examined the effectiveness (A1C lowering) of the 4 antihyperglycemic therapies that are currently most commonly prescribed (metformin, sulfonylureas, insulin, thiazolidinediones), overall and by clinical subgroups, within a usual-care setting.
METHODS
Setting and Source Population
Kaiser Permanente of Northern California is a large, integrated healthcare delivery system that provides comprehensive medical services to ∼3.2 million members (∼35% of insured adults) in the San Francisco and greater Bay area through 39 medical facilities. Health plan members are predominantly employed or retired individuals and their families, and representative of the general population ethnically and socioeconomically, except for the extreme tails of the income distribution.11-13 In 1993, Kaiser Permanente established the Kaiser Permanente Northern California Diabetes Registry. This registry included ∼210 000 patients with diabetes on January 1, 2006, with an estimated sensitivity of ∼99%. The registry is updated annually by identifying all members with diabetes from automated databases for pharmacy, laboratory, hospitalization records, and outpatient diagnoses as described previously.12,14-17 This study was approved by the Kaiser Foundation Research Institute's Institutional Review Board.
Cohort Identification
We identified all registry members who initiated a new diabetes medication between March 1, 1999, and July 31, 2002, and had a full year of membership with drug benefits after drug initiation. Given that individuals who initiate new diabetes therapies systematically differ from individuals who maintain ongoing therapies in terms of glycemic control, disease severity, patient characteristics, and behaviors,18 we used a “new user” design19 that assesses outcomes occurring after drug initiation in the subgroup of individuals initiating a single new therapy, while controlling for potential confounders existing before initiation. By design, we excluded patients with type 1 diabetes because they would not switch therapeutic classes once established on insulin; patients with end-stage renal disease (ESRD) because of its effects on clearance of insulin (and thus glycemic control) and sulfonylureas, and because ESRD is a contraindication for metformin20; and persons without continuous health plan membership (n=4752) or lacking drug benefits (n=2574) during the study period, to minimize misclassifying subjects who may have filled prescriptions in non–health-plan pharmacies. Of the 16 746 new users with pre–post A1Cs recorded, we excluded 1285 (6%) who simply switched medications (eg, switched from 1 monotherapy to another monotherapy) because we could not accurately ascertain each drug's washout period. We also excluded 145 (0.7%) patients who added more than 1 medication simultaneously. Finally, we excluded a small number (n=190) of new users of α-glucosidase inhibitors (eg, Acarbose), meglitinides (eg, Repaglinide), and incretins (glycolipoprotein [GLP]-1 analogues and dipeptidylpeptidase-4 inhibitors) because they were used too infrequently during the study period to provide sufficient statistical power.
After applying these exclusion criteria, our final analytic sample included 15 126 health plan members with diabetes who initiated a single, new diabetes therapy between March 1, 1999, and July 31, 2002, and had A1C measured both during the 12-month window before initiation and the 3 to 12 months after initiation and before discontinuing or modifying the index therapy.
Pharmacotherapeutic Exposure and Outcome
The exposure of interest was initiation of any 1 of the 4 most commonly prescribed therapeutic regimens (“index therapies”): (1) biguanides (ie, metformin); (2) sulfonylureas; (3) thiazolidinediones; and (4) insulin, which served as the reference group. New user exposure cohorts were defined by the index therapy that was initiated by each participant regardless of whether the medication was in addition to another therapeutic class or to medical nutrition therapy only. The exposure baseline date (“index date”) was defined as the date on which the first prescription of the index therapy was dispensed. To ensure that patients were truly starting a new regimen, we required that there were (1) no prescriptions filled for the index therapy during the 12 months before the index date; and (2) at least 1 refill of the new therapy during the 12 months after the index date.
We censored patients at the first occurrence of any of the following events: end of individual follow-up (ie, 12 months after initiation of therapy), discontinuation of the index therapy, modification of the existing treatment regimen, or the end of the study. Index therapy discontinuation was defined as the absence of a drug refill within 90 days of the projected end date of the last recorded prescription. Therapy regimen modification included switching from the existing therapy to another therapy, adding therapy to the existing regimen, or discontinuing any of the medications included in the existing combination regimen. These restrictions allowed us to minimize misclassification of patients who were switching from a single therapeutic class to a different class (and thus may have had overlapping prescriptions for more than 1 class during the transition). A single-tiered drug benefit was in place at the time of the study, so out-of-pocket drug copays were uniform across therapeutic classes, regardless of whether medications were brand name or generic.
Therapeutic response was defined as the difference between the last A1C measured during the 12 months before the index date and the latest A1C measured between 3 and 12 months after the index date. Measurements taken during the 3-month postinitiation period were not included to give sufficient time for dose titration, physiologic adjustments to the new medication, and the accurate assessment of postinitiation control (given that A1C provides an integrated measure of glycemic control over a 3-month period). For participants censored because of a therapy modification, we restricted inclusion of A1C measures to those taken before discontinuation of the index therapy or modification of the treatment regimen. Thus, only measures of glycemic control that could be most directly linked to the index therapy were analyzed. A1C levels were obtained from a health plan laboratory database and all assays were conducted at Kaiser's centralized laboratory using high-performance liquid chromatography.
Analytic Methods
We used a “new-user” cohort study design,19 which includes only patients initiating a single new therapy (“index therapy”) and synchronizes cohorts of patients at the time of initiating the index therapy, thereby avoiding chronology bias.21 Demographic and clinical characteristics of patients initiating each index therapy were compared using standard descriptive statistics. We next estimated change in A1C in response to initiation of each diabetes therapy using ANCOVA (analysis of covariance) models. Among new users of diabetes therapies, glycemic control before the index date, disease severity, concurrent hypoglycemic therapies, and patient characteristics vary considerably by drug class,18 which could confound crude estimates of glycemic effect associated with initiation of different diabetes therapies. Therefore, we first examined the effect of initiating therapy in minimally adjusted models, which included the last A1C before initiation of the index therapy, concurrent therapies, age, and sex. Additional models were then specified by including relevant covariates available for the entire analysis sample.
Multivariate adjustment included the following factors assessed during the calendar year before index date: neighborhood-level socioeconomic status, number of annual visits to assigned primary care provider, primary care provider specialty (endocrinologist vs other primary care provider), an indicator variable for the Kaiser facility where most of the care was provided, rate of missed scheduled outpatient appointments, inpatient and outpatient comorbidity risk score,22 presence of chronic heart failure, diagnosed hypertension, smoking status (current, former, never), serum low-density lipoprotein cholesterol level (mg/dL), serum triglycerides level (mg/dL), and estimated glomerular filtration rate (in mL/min/1.73 m2) based on serum creatinine concentration.23 Neighborhood-level socioeconomic status was assessed by geocoding each member's address and linking to associated 2000 US census block group average annual per-capita income, percentage below poverty, and proportion in a working class occupation.11 Prevalent heart failure was based on primary discharge diagnoses or serial outpatient diagnoses found in hospital discharge and ambulatory visit databases. Diagnosed hypertension and smoking status were obtained from ambulatory visit databases. Cholesterol, triglyceride, and serum creatinine levels were captured from an automated laboratory database. Pharmacy records were also used to calculate an index of medication adherence for oral diabetes agents (defined as the percentage of days during follow-up without adequate supply or “continuous, multiple-interval measure of medication gaps”24), and self-monitoring of blood glucose frequency (based on glucose test strip utilization).12,17
Eighty-three percent (n = 77 726) of the 94 024 noninstitutionalized health plan members in the diabetes registry (as of 1995) responded to a self-administered questionnaire or computer-assisted telephone interview conducted in 1994-1997. The survey asked about daily number of insulin injections, use of exercise and diet as diabetes treatments, time since diabetes diagnosis, body mass index, smoking history, educational attainment, and self-identified race/ethnicity. Data on these variables were available for a subanalysis of 7605 members of our final analysis sample.
Using cross-product terms (index therapy × clinical strata), we then assessed whether statistical differences (effect modification) existed in the glycemic response differences between initiated therapies, across the clinical substrata of interest: prevalent chronic heart failure (yes or no); age class (<45, 45-65, or ≥65 years); body mass index (nonobese [<30 kg/m2] vs obesity class 1-3 [≥30 kg/m2]); estimated glomerular filtration rate (>60 vs ≤60 mL/min/1.73 m2); time since diabetes diagnosis (<10 vs ≥10 years); and race/ethnicity (African American, Asian, Latino, non-Latino White). We calculated least-squares means to estimate adjusted A1C difference for each index therapy, and again for each clinical substratum. All analyses were performed using SAS, version 9.1.3 (Cary, NC) and a 2-sided P < .05 was considered significant.
RESULTS
Metformin and insulin initiators were younger, while sulfonylurea initiators were older (Table 1). No relevant differences were noted in the therapy distributions by sex or socioeconomic status categories. Asian participants were least likely, while multiethnic and White participants were the most likely, to initiate insulin among the 4 therapeutic categories. Initiation of either thiazolidinediones or insulin was associated with substantially greater severity of diabetes or associated complications (including longer duration of diabetes, obesity, chronic kidney disease, and peripheral neuropathy), higher comorbidity scores compared with those initiating either metformin or a sulfonylurea, and a much greater likelihood of already being on at least 2 oral hypoglycemic agents. In contrast, persons initiating sulfonylureas were much more likely to be transitioning from medical nutrition therapy alone, and metformin users were most likely to have previously been on a single oral agent, sulfonylureas. Excessive alcohol consumption was low overall, but somewhat more common among participants initiating metformin or sulfonylureas. Prevalent diagnosed heart failure was much less common among patients who initiated metformin and most common among patients who initiated insulin. Patients initiating sulfonylureas were the most likely to have poorer medication adherence for oral agents and the least likely to be self-monitoring their blood glucose. Smokers were more likely to initiate insulin.
Table 1.
Baseline Patient Characteristics Among 15 125 Patients With Type 2 Diabetes Initiating a New Diabetes Therapy
| Index Diabetes Therapy |
||||
|---|---|---|---|---|
| Metformin (n = 8645) |
Sulfonylureas (n = 3445) |
Thiazolidinediones (n = 2115) |
Insulin (n = 921) |
|
| Demographic Characteristics | ||||
| Age, mean (SD), y | 61.1 (11.1) | 63.6 (11.8) | 62.5 (10.8) | 59.9 (12.9) |
| Women | 4092 (47.3) | 1570 (45.6) | 926 (43.8) | 473 (51.4) |
| Race/ethnicity | ||||
| White | 2334 (53.6) | 633 (58.8) | 872 (59.2) | 392 (63.6) |
| Black/African American | 495 (11.4) | 123 (11.4) | 141 (9.6) | 51 (8.3) |
| Latino | 469 (10.8) | 93 (8.6) | 132 (9.0) | 60 (9.7) |
| Asian | 651 (14.9) | 137 (12.7) | 190 (12.9) | 46 (7.5) |
| Other | 89 (2.0) | 12 (1.2) | 27 (1.8) | 7 (1.2) |
| Multiethnic | 320 (7.3) | 78 (7.3) | 111 (7.5) | 60 (9.7) |
| Socioeconomic Status | ||||
| Living in deprived neighborhood (>20% below poverty line) |
628 (8.2) | 186 (7.7) | 139 (6.9) | 66 (7.6) |
| Living in neighborhood ≤25% with high school degree | 2026 (26.4) | 597 (24.6) | 491 (24.4) | 204 (23.6) |
| Health Behaviors | ||||
| Current smoker | 754 (8.7) | 278 (8.1) | 179 (8.5) | 97 (10.5) |
| Excessive alcohol consumption* (>21 drinks per week) | 53 (2.7) | 18 (3.7) | 7 (1.0) | 5 (1.7) |
| Poor refill adherence (<70% time with sufficient medication supply) |
1141 (13.2) | 1066 (30.9) | 220 (10.4) | 233 (25.3) |
| Not self-monitoring blood glucose | 3412 (39.5) | 1945 (56.5) | 658 (31.1) | 307 (33.3) |
| Clinical Profile | ||||
| Poor glycemic control (A1C > 9%) | 3963 (45.8) | 831 (24.1) | 1084 (51.3) | 545 (59.2) |
| Duration of diabetes ≥10 years* | 1823 (45.0) | 352 (37.0) | 827 (58.8) | 321 (55.5) |
| Chronic heart failure | 384 (4.4) | 266 (7.7) | 207 (9.8) | 119 (12.9) |
| Estimated glomerular filtration rate <60 mL/min/1.73 m2 |
1456 (17.0) | 790 (23.3) | 617 (29.2) | 239 (26.1) |
| Uncontrolled systolic hypertension (>140 mm Hg) | 4099 (47.4) | 1631 (47.3) | 997 (47.1) | 407 (44.2) |
| Uncontrolled diastolic hypertension (>90 mm Hg) | 1250 (14.5) | 489 (14.2) | 229 (10.8) | 111 (12.1) |
| Using antihypertensives | 6434 (74.4) | 2384 (69.2) | 1781 (84.2) | 698 (75.8) |
| LDL (mg/dL), mean (SD) | 119.6 (34.2) | 121.7 (36.2) | 111.9 (33.0) | 113.5 (34.9) |
| Using antilipemics | 3172 (36.7) | 1156 (33.6) | 1032 (48.8) | 345 (37.5) |
| Peripheral neuropathy* | 869 (26.1) | 198 (23.8) | 336 (29.1) | 157 (32.7) |
| Inpatient risk score, mean (SD) | 2.40 (2.76) | 2.67 (3.30) | 3.34 (3.98) | 3.36 (4.42) |
| Outpatient risk score, mean (SD) | 2.15 (1.22) | 2.12 (1.39) | 2.65 (1.48) | 2.58 (1.66) |
| Obesity (body mass index ≥30 kg/m2) | 1928 (55.6) | 701 (46.5) | 596 (65.9) | 221 (65.0) |
| Baseline Diabetes Therapies | ||||
| Medical nutrition therapy only | 1550 (17.9) | 3044 (88.4) | 49 (2.3) | 159 (17.3) |
| Single oral hypoglycemic agent | 5956 (68.9) | 227 (6.6) | 497 (23.5) | 241 (26.2) |
| Insulin monotherapy | 906 (10.5) | 147 (4.3) | 355 (16.8) | 0 (0) |
| >2 Oral hypoglycemic agents | 48 (0.6) | 8 (0.2) | 1111 (52.5) | 521 (56.6) |
| Oral hypoglycemic agent plus insulin | 185 (2.1) | 19 (0.6) | 103 (4.9) | 0 (0) |
| Access to Care | ||||
| Primary care visit in prior year | 6642 (76.8) | 2626 (76.2) | 1731 (81.8) | 739 (80.2) |
| Ophthalmology examination in prior year | 4017 (46.5) | 1446 (42.0) | 1215 (57.5) | 472 (51.3) |
| Cholesterol check in prior year | 5600 (64.8) | 2125 (61.7) | 1470 (69.5) | 566 (61.5) |
Values are given as numbers and percentages unless otherwise indicated.
Survey-based covariates: not all of the 15 125 subjects were survey respondents. Thus, the denominator varies for these items used in the survey responder subanalysis.
A1C indicates glycosylated hemoglobin; LDL, low-density lipoprotein; SD, standard deviation.
Among the 15 125 persons initiating a new therapy, 12 215 (81%) maintained their new therapy regimen without further change throughout the 3- to-12-month postinitiation observation window. A total of 1421 (9%) discontinued the index therapy during the follow-up period, and 1490 (10%) modified their treatment regimen by adding or switching therapies within 12 months of initiation of the index therapy. In the latter cases, only A1C measurements obtained before index therapy discontinuation or modification were assessed. These new initiations included 4802 (32%) subjects who transitioned from medical nutrition therapy only to monotherapy, 8329 (55%) from monotherapy to dual therapy, 1953 (13%) from dual to triple therapy, and 42 (0.3%) from triple therapy to 4-drug combinations.
In the entire cohort, mean A1C was 9.01% (95% CI 8.98%-9.04%) before and 7.87% (95% CI 7.85%-7.90%) at 3 to 12 months after initiation of the index therapy (mean AIC reduction 1.14; 95% CI 1.11-1.17) (Table 2). However, only 30.2% (95% CI 29.2%-31.1%) achieved the recommended target (A1C < 7%) overall during the 3 to 12 months after initiation of the index therapy. Sulfonylureas were initiated at the lowest A1C (8.32%; 95% CI 8.27%-8.38%), then metformin (9.15%; 95% CI 9.11%-9.18%), thiazolidinediones (9.32%; 95% CI 9.25%-9.39%), and insulin (9.63%; 95% CI 9.50%-9.76%). The proportion that achieved the glycemic target (A1C < 7%) was highly dependent on the starting point (Figure). Of patients with baseline A1C at 7%-8%, 8%-9%, and >9%, only 45.8%, 28.3%, and 17.6%, respectively, achieved target (P < .0001).
Table 2.
Crude and Adjusted Change in Glycemic Control (A1C) Within 3 to 12 Months After Initiation of a New Diabetes Therapy Among 15 126 Adults With Type 2 Diabetes
| Added Therapy | n | Baseline Mean A1C (Prior to Initiation) (95% CI) |
Mean Posttherapy A1C 3-12 Months After Initiation) (95% CI) |
Crude (Unadjusted) Change (95% CI) |
Adjusted* Change (95% CI) |
P From Adjusted Model (Relative to Reference) |
|---|---|---|---|---|---|---|
| Sulfonylureas | 3445 | 8.32 (8.27-8.38) | 7.34 (7.29-7.38) | −0.98 | −1.32 (0.71-1.93) | 0.3 |
| Metformin | 8645 | 9.15 (9.11-9.18) | 7.99 (7.96-8.02) | −1.16 | −1.28 (0.68-1.89) | 0.3 |
| Thiazolidinedione | 2115 | 9.32 (9.25-9.39) | 8.11 (8.05-8.17) | −1.21 | −1.30 (0.69-1.90) | 0.2 |
| Insulin | 921 | 9.63 (9.50-9.76) | 8.27 (8.17-8.36) | −1.36 | −1.26 (0.65-1.88) | Reference |
Models adjusted for baseline A1C, concurrent diabetes therapy, age, sex, socioeconomic status (census block group average annual per capita income, percentage below poverty and proportion in a working class occupation), smoking status (current, former, never), self-monitoring of blood glucose frequency based on glucose test strip utilization, number of annual visits to assigned primary care provider, primary care provider specialty (endocrinologist vs other primary care provider), Kaiser facility where most care was provided, rate of missed scheduled outpatient appointments, inpatient and outpatient comorbidity risk score, presence of chronic heart failure, diagnosed hypertension, serum low-density lipoprotein cholesterol level, serum triglycerides level, estimated glomerular filtration rate.
A1C indicates glycosylated hemoglobin; CI, confidence interval.
Figure.
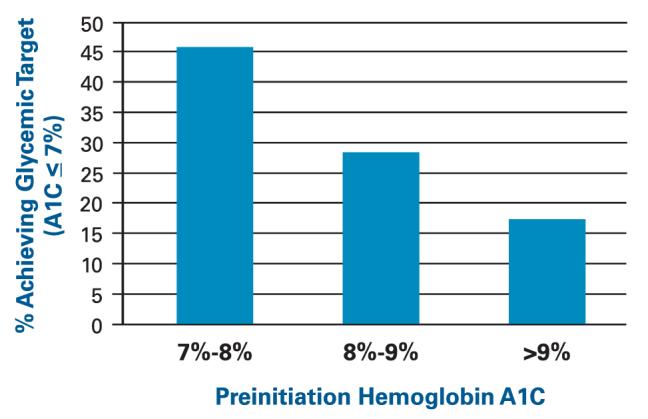
Percentage of Patients With Diabetes Initiating New Diabetes Medications Who Achieved Glycemic Target Glycosylated Hemoglobin (A1C) < 7% 3 to 12 Months After Initiation, Stratified by Preinitiation A1C (P < .0001)
While baseline A1C and disease severity differed across initiators of each therapeutic class, the adjusted glycemic response did not differ significantly across index therapy (test of homogeneity P < .937). The similar magnitude of therapeutic response across index therapies was not modified significantly by age, race, duration of diabetes, obesity, or level of renal function, although younger age and chronic kidney disease were independent predictors of poorer glycemic response to therapy initiation (data not shown). As expected, poorer adherence was associated with a smaller reduction in A1C after index therapy initiation; however, adjustment for medication adherence did not change the lack of differences in glycemic response across index therapies.
DISCUSSION
We examined glycemic response (absolute change in A1C) 3 to 12 months after adding a single diabetes therapy to an existing regimen and evaluated whether initiation brought a patient under the glycemic target (A1C < 7%). Glycemic response (mean change: −1.14 points; 95% CI −1.11 to −1.17) did not differ significantly across the 4 therapeutic classes, and was similar in magnitude to that reported for randomized trials of the individual therapies.25,26 Moreover, glycemic response did not differ by age, race, duration of diabetes, obesity, or level of kidney function. Our finding of uniform glycemic response is consistent with a systematic review (based on 216 controlled trials and cohort studies, and 2 previous systematic reviews),27 which reported similar findings of comparative effectiveness (about a 1-point improvement in A1C) among oral medications for type 2 diabetes. Similar findings were also reported by an Agency for Health Care Research and Quality review of randomized trials, which reported no substantive differences between therapy efficacy across oral diabetes therapies.28 We acknowledge that our findings are based on 1-year follow-up and may not be durable over a longer time frame. A randomized trial with a median follow-up of 4 years, the study known as A Diabetes Outcome Progression Trial (ADOPT), showed differences in the cumulative incidence of monotherapy failure at 5 years (15% for rosiglitazone, 21% for metformin, and 34% for glyburide).29 Although few studies have evaluated differences in effectiveness among special clinical subgroups, our findings are also consistent with a recent study reporting no differences in metformin effectiveness between obese and nonobese patients.30
Despite the observed favorable and uniform glycemic response, only about 30% of new users achieved glycemic target (<7%) 3 to 12 months after initiation. However, since the time of the study, the prevalence of well-controlled patients has increased in the source population for this study. In a previous study of the Kaiser Permanente Northern California Diabetes Registry,10 we reported that only 18% of patients with poor glycemic control (A1C > 8%) achieved target 3 to 12 months after initiating new therapy. In the current study, we included all patients initiating new therapy, regardless of their baseline glycemic control, and found that even patients with a seemly reasonable level of control (baseline A1C between 7% and 8%), less than 50% achieved the glycemic target within 1 year. Therapy was typically initiated only after A1C had advanced too far beyond the threshold at which the expected therapeutic benefit (ie, about 1% lowering) would bring A1C under target. These findings are consistent with an earlier study31 demonstrating that intensification was generally not initiated until after A1C exceeded 9%.
Take-away Points.
About one third of patients with diabetes initiate new-therapy regimens annually. Thus, understanding the effect of newly added therapies in clinical practice has public health relevance.
■ Initiating metformin, sulfonylurea, thiazolidinediones, or insulin had a similar effect in adults with type 2 diabetes (∼1 point lowering of A1C).
■ Therapy intensification occurred too late in the course of worsening glycemic control at which point the glucose-lowering effect of a single added therapy was insufficient to lower A1C under the glycemic target.
■ Findings indicate that greater patient and provider commitment to earlier therapy intensification is needed.
Findings suggest that, to keep up with the expected progressive, age-related worsening of glycemic control,32,33 patients and providers must commit to more aggressive therapy intensification. Clinical “targets” should be considered synonymous with “action levels,” with therapy intensified as soon as target values are exceeded. In the present study, initiation was delayed longer for second-line therapies; thiazolidinediones and insulin were started in patients with mean A1C of 9.3% and 9.6%, respectively, whereas first-line therapies, sulfonylureas and metformin, were initiated at 8.3% and 9.2%, respectively. While therapy intensification algorithms26,34-36 vary somewhat and are evolving, typically the history of previous therapy, concurrent therapy, current level of glycemic control, therapy cost, and patient factors (age, competency, and preferences) are considered when determining the next therapy to be prescribed. Typically metformin or a sulfonylurea is prescribed as a first step, followed by thiazolidinediones, insulin, or other agents (eg, nonsulfonylurea secretagogues, α-glucosidase inhibitors, or incretins), for more difficult-to-control glycemia. We show that with each step of intensification, the added therapy has a similar glycemic-lowering effect, but steps are initiated at progressively higher A1C levels. Thus intensification is not keeping pace with worsening glycemic control.
Our study had several limitations. Nonrandomized exposures preclude us from ruling out the effect of residual confounding (by indication37 or contraindication) or treatment selection bias. However, controlling for preinitiation A1C, ongoing therapy, and duration of diabetes did not alter our findings of similar medication effect sizes. Also, although no differences in response by therapy were detected, differential response to pharmacologic agents at the individual patient level cannot be excluded. It is important to note that selective prescribing renders our findings uninformative for standard cost-effectiveness assessments, given that lower cost, first-line therapies (eg, generic sulfonylureas) would simplistically appear substantially more cost-effective than more expensive, second-line therapies (eg, thiazolidinediones). The similar effectiveness across select demographic and clinical subgroups may be due to a selection process whereby physicians are prescribing optimal agents for a given patient's characteristics. While a randomized trial provides an estimate of efficacy in selected volunteers, these observational study findings should reflect outcomes in typical clinical practice; thus this study provides an important complement to trial findings.38,39 Also, it is important to note that both patient and provider may play a role in delayed intensification. The relative role of each person remains undetermined because we were unable to distinguish whether the provider failed to prescribe a needed therapy or the patient failed to obtain the prescribed prescription from the pharmacy.
We excluded patients who discontinued 1 medication and substituted another (ie, switchers), because analysis of response to therapy was intractable. Although we did not attempt to directly ascertain the glycemic response to newly initiated medications in switchers, we suspect it would not be substantively different.
Finally, we were unable to ascertain pharmacy utilization at non-Kaiser pharmacies. However, we limited our analysis to members with a drug benefit, which is only recognized at Kaiser pharmacies; thus there is a substantial economic incentive for members with a drug benefit to use only Kaiser pharmacies. In a 2005-2006 survey of 20 188 diabetic Kaiser members (DISTANCE Study), those patients with drug benefits reported using non-Kaiser pharmacies on average less than a single time (0.4 times) in the past 12 months.40
Our study had certain unique strengths. Our source population of more than 3 million individuals represents approximately one third of the population of northern California. Our population had broad age, sex, and racial/ethnic diversity and uniform access to care. The Kaiser Permanente Northern California population is representative of the local surrounding and statewide population, except for slight underrepresentation of the extremes of income.11,13,41 Our rich clinical databases also facilitated statistical adjustment for relevant confounding variables usually unavailable in administrative or claims databases. Levels of glycemic control in our population are similar to those in other published studies from a similar time period,42 suggesting that our findings are likely generalizable to the large number of insured individuals with diabetes throughout the United States. Additionally, whereas this study focused on the glycemic target of A1C less than 7%, a target used by Kaiser Permanente at the time the study was carried out (and recommended by the American Diabetes Association), findings are likely applicable to other targets (eg, less aggressive targets may be desirable for frail or geriatric patients43).
Acknowledgments
Funding: This research was funded by an unrestricted grant from Novartis Pharmaceuticals. The lead author was also supported by grants from the National Institute of Diabetes and Digestive and Kidney Diseases (#R01 DK65664) and the National Institute of Child Health and Human Development (#R01 HD046113-02). By contract, the authors retained the right to publish without approval from Novartis or National Institutes of Health.
Footnotes
Author Disclosure: Dr Karter reports receiving a grant from Novartis for this study. The authors (HHM, JL, MMP, ATA, ASG, JVS) report no relationship of financial interest with any entity that would pose a conflict of interest with the subject matter discussed in this manuscript.
REFERENCES
- 1.Diabetes Control and Complications Trial (DCCT) results of feasibility study. The DCCT Research Group. Diabetes Care. 1987;10:1–19. doi: 10.2337/diacare.10.1.1. [DOI] [PubMed] [Google Scholar]
- 2.Ohkubo Y, Kishikawa H, Araki E, et al. Intensive insulin therapy prevents the progression of diabetic microvascular complications in Japanese patients with non-insulin-dependent diabetes mellitus: a randomized prospective 6-year study. Diabetes Res Clin Pract. 1995;28:103–117. doi: 10.1016/0168-8227(95)01064-k. [DOI] [PubMed] [Google Scholar]
- 3.Saaddine JB, Cadwell B, Gregg EW, et al. Improvements in diabetes processes of care and intermediate outcomes: United States, 1988-2002. Ann Intern Med. 2006;144:465–474. doi: 10.7326/0003-4819-144-7-200604040-00005. [DOI] [PubMed] [Google Scholar]
- 4.Hayward RA, Manning WG, Kaplan SH, Wagner EH. Greenfield S. Starting insulin therapy in patients with type 2 diabetes: effectiveness, complications, and resource utilization. JAMA. 1997;278:1663–1669. [PubMed] [Google Scholar]
- 5.Harris MI, Eastman RC, Cowie CC, Flegal KM, Eberhardt MS. Racial and ethnic differences in glycemic control of adults with type 2 diabetes. Diabetes Care. 1999;22:403–408. doi: 10.2337/diacare.22.3.403. [DOI] [PubMed] [Google Scholar]
- 6.Fan T, Koro CE, Fedder DO, Bowlin SJ. Ethnic disparities and trends in glycemic control among adults with type 2 diabetes in the U.S. from 1988 to 2002. Diabetes Care. 2006;29:1924–1925. doi: 10.2337/dc05-2238. [DOI] [PubMed] [Google Scholar]
- 7.Kirk JK, D'Agostino RB, Jr, Bell RA, et al. Disparities in HbA1c levels between African-American and non-Hispanic white adults with diabetes: a meta-analysis. Diabetes Care. 2006;29:2130–2136. doi: 10.2337/dc05-1973. [DOI] [PMC free article] [PubMed] [Google Scholar]
- 8.American Diabetes Association Clinical Practice Recommendations 2001 Diabetes Care. 2001;24(suppl 1):S1–S133. [PubMed] [Google Scholar]
- 9.Johnson JL, Wolf SL, Kabadi UM. Efficacy of insulin and sulfonylurea combination therapy in type II diabetes. A meta-analysis of the randomized placebo-controlled trials. Arch Intern Med. 1996;156:259–264. [PubMed] [Google Scholar]
- 10.Karter AJ, Moffet HH, Liu J, et al. Achieving good glycemic control: initiation of new antihyperglycemic therapies in patients with type 2 diabetes from the Kaiser Permanente Northern California Diabetes Registry. Am J Manag Care. 2005;11:262–270. [PMC free article] [PubMed] [Google Scholar]
- 11.Krieger N. Overcoming the absence of socioeconomic data in medical records: validation and application of a census-based methodology. Am J Public Health. 1992;82:703–710. doi: 10.2105/ajph.82.5.703. [DOI] [PMC free article] [PubMed] [Google Scholar]
- 12.Karter AJ, Ackerson LM, Darbinian JA, et al. Self-monitoring of blood glucose levels and glycemic control: the Northern California Kaiser Permanente Diabetes Registry. Am J Med. 2001;111:1–9. doi: 10.1016/s0002-9343(01)00742-2. [DOI] [PubMed] [Google Scholar]
- 13.Hiatt RA, Friedman GD. Characteristics of patients referred for treatment of end-stage renal disease in a defined population. Am J Public Health. 1982;72:829–833. doi: 10.2105/ajph.72.8.829. [DOI] [PMC free article] [PubMed] [Google Scholar]
- 14.Karter AJ, Ferrara A, Liu JY, Moffet HH, Ackerson LM, Selby JV. Ethnic disparities in diabetic complications in an insured population. JAMA. 2002;287:2519–2527. doi: 10.1001/jama.287.19.2519. [DOI] [PubMed] [Google Scholar]
- 15.Karter AJ, Parker MM, Moffet HH, et al. Missed appointments and poor glycemic control: an opportunity to identify high-risk diabetic patients. Med Care. 2004;42:110–115. doi: 10.1097/01.mlr.0000109023.64650.73. [DOI] [PubMed] [Google Scholar]
- 16.Selby JV, Karter AJ, Ackerson LM, Ferrara A, Liu J. Developing a prediction rule from automated clinical databases to identify high-risk patients in a large population with diabetes. Diabetes Care. 2001;24:1547–1555. doi: 10.2337/diacare.24.9.1547. [DOI] [PubMed] [Google Scholar]
- 17.Karter AJ, Ferrara A, Darbinian J, Ackerson LM, Selby JV. Self-monitoring of blood glucose: language and financial barriers in a managed care population with diabetes. Diabetes Care. 2000;23:477–483. doi: 10.2337/diacare.23.4.477. [DOI] [PubMed] [Google Scholar]
- 18.Karter AJ, Ahmed AT, Liu J, et al. Use of thiazolidinediones and risk of heart failure in people with type 2 diabetes: a retrospective cohort study. Diabetes Care. 2004;27:850–851. doi: 10.2337/diacare.27.3.850-a. Response to Delea et al. [DOI] [PubMed] [Google Scholar]
- 19.Ray WA. Evaluating medication effects outside of clinical trials: new-user designs. Am J Epidemiol. 2003;158:915–920. doi: 10.1093/aje/kwg231. [DOI] [PubMed] [Google Scholar]
- 20.Glucophage (metformin hydrochloride tablets) [prescribing information] Bristol-Myers Squibb Co.; Princeton, NJ: 2004. Also available at: http://www.bms.com/cgi-bin/anybin.pl?sql=select%20PPI%20from %20TB_PRODUCT_PPI%20where%20PPI_SEQ=52] Accessed October 18, 2007. [Google Scholar]
- 21.Feinstein AR. Clinical biostatistics. XI. Sources of ‘chronology bias’ in cohort statistics. Clin Pharmacol Ther. 1971;12:864–879. doi: 10.1002/cpt1971125864. [DOI] [PubMed] [Google Scholar]
- 22.Schneeweiss R, Rosenblatt RA, Cherkin DC, Kirkwood CR, Hart G. Diagnosis clusters: a new tool for analyzing the content of ambulatory medical care. Med Care. 1983;21:105–122. doi: 10.1097/00005650-198301000-00008. [DOI] [PubMed] [Google Scholar]
- 23.Levey AS, Bosch JP, Lewis JB, Greene T, Rogers N, Roth D. A more accurate method to estimate glomerular filtration rate from serum creatinine: a new prediction equation. Modification of Diet in Renal Disease Study Group. Ann Intern Med. 1999;130:461–470. doi: 10.7326/0003-4819-130-6-199903160-00002. [DOI] [PubMed] [Google Scholar]
- 24.Steiner JF, Prochazka AV. The assessment of refill compliance using pharmacy records: methods, validity, and applications. J Clin Epidemiol. 1997;50:105–116. doi: 10.1016/s0895-4356(96)00268-5. [DOI] [PubMed] [Google Scholar]
- 25.Inzucchi SE. Oral antihyperglycemic therapy for type 2 diabetes: scientific review. JAMA. 2002;287:360–372. doi: 10.1001/jama.287.3.360. [DOI] [PubMed] [Google Scholar]
- 26.Kimmel B, Inzucchi SE. Oral agents for type 2 diabetes: an update. Clin Diabetes. 2005;23:64–76. Available at: http://clinical.diabetesjournals.org/cgi/content/full/23/2/64. Accessed October 1, 2007. [Google Scholar]
- 27.Bolen S, Feldman L, Vassy J, et al. Systematic review: comparative effectiveness and safety of oral medications for type 2 diabetes mellitus. Ann Intern Med. 2007;147:386–399. doi: 10.7326/0003-4819-147-6-200709180-00178. [DOI] [PubMed] [Google Scholar]
- 28.Bolen S, Wilson L, Vassy J, et al. Comparative effectiveness and safety of oral diabetes medications for adults with type 2 diabetes [research review] Available at: http://effectivehealthcare.ahrq.gov/reports/topic.cfm?topic=5&sid=37&rType=3 Accessed October 18, 2007. [PubMed]
- 29.Kahn SE, Haffner SM, Heise MA, et al. for the ADOPT Study Group Glycemic durability of rosiglitazone, metformin, or glyburide monotherapy. N Engl J Med. 2006;355:2427–2443. doi: 10.1056/NEJMoa066224. [DOI] [PubMed] [Google Scholar]
- 30.Ong CR, Molyneaux LM, Constantino MI, Twigg SM, Yue DK. Long-term efficacy of metformin therapy in nonobese individuals with type 2 diabetes. Diabetes Care. 2006;29:2361–2364. doi: 10.2337/dc06-0827. [DOI] [PubMed] [Google Scholar]
- 31.Brown JB, Nichols GA. Slow response to loss of glycemic control in type 2 diabetes mellitus. Am J Manag Care. 2003;9:213–217. [PubMed] [Google Scholar]
- 32.United Kingdom Prospective Diabetes Study (UKPDS) 13: Relative efficacy of randomly allocated diet, sulphonylurea, insulin, or metformin in patients with newly diagnosed non-insulin dependent diabetes followed for three years. BMJ. 1995;310:83–88. [PMC free article] [PubMed] [Google Scholar]
- 33.Intensive blood-glucose control with sulphonylureas or insulin compared with conventional treatment and risk of complications in patients with type 2 diabetes (UKPDS 33). UK Prospective Diabetes Study (UKPDS) Group. Lancet. 1998;352:837–853. [PubMed] [Google Scholar]
- 34.Nathan DM, Buse JB, Davidson MB, et al. Management of hyper-glycemia in type 2 diabetes: a consensus algorithm for the initiation and adjustment of therapy: a consensus statement from the American Diabetes Association and the European Association for the Study of Diabetes. Diabetes Care. 2006;29:1963–1972. doi: 10.2337/dc06-9912. [DOI] [PubMed] [Google Scholar]
- 35.Riddle MC. Glycemic management of type 2 diabetes: an emerging strategy with oral agents, insulins, and combinations. Endocrinol Metab Clin North Am. 2005;34:77–98. doi: 10.1016/j.ecl.2004.12.002. [DOI] [PubMed] [Google Scholar]
- 36.Chipkin SR. How to select and combine oral agents for patients with type 2 diabetes mellitus. Am J Med. 2005;118(suppl 5A):4S–13S. doi: 10.1016/j.amjmed.2005.04.010. [DOI] [PubMed] [Google Scholar]
- 37.Poses RM, Smith WR, McClish DK, Anthony M. Controlling for confounding by indication for treatment. Are administrative data equivalent to clinical data? Med Care. 1995;33(suppl):AS36–AS46. [PubMed] [Google Scholar]
- 38.Boccuzzi SJ, Wogen J, Fox J, Sung JC, Shah AB, Kim J. Utilization of oral hypoglycemic agents in a drug-insured U.S. population. Diabetes Care. 2001;24:1411–1415. doi: 10.2337/diacare.24.8.1411. [DOI] [PubMed] [Google Scholar]
- 39.Colwell JA. Controlling type 2 diabetes: are the benefits worth the costs? JAMA. 1997;278:1700. [PubMed] [Google Scholar]
- 40.Kaiser Permanente Division of Research DISTANCE Survey Diabetes Study of Northern California. Available at: http://www.dor.Kaiser.org/studies/diabetes/Diabetes-09.shtml. Accessed October 19, 2007.
- 41.Krieger N. Analyzing socioeconomic and racial/ethnic patterns in health and health care. Am J Public Health. 1993;83:1086–1087. doi: 10.2105/ajph.83.8.1086. [DOI] [PMC free article] [PubMed] [Google Scholar]
- 42.Kirk JK, D'Agostino RB, Jr, Bell RA, et al. Disparities in HbA1c levels between African-American and non-Hispanic white adults with diabetes: a meta-analysis. Diabetes Care. 2006;29:2130–2136. doi: 10.2337/dc05-1973. [DOI] [PMC free article] [PubMed] [Google Scholar]
- 43.Aspray TJ, Unwin N. Clinical guidelines for older adults with diabetes mellitus. JAMA. 2006;296:1839–1840. doi: 10.1001/jama.296.15.1839. [DOI] [PubMed] [Google Scholar]