

Abstract
A low beam-intensity, low electron-dose imaging method has been developed for single-particle electron cryo-microscopy (cryo-EM). Experiments indicate that the new technique can reduce beam-induced specimen movement and secondary radiolytic effects, such as “bubbling”. The improvement in image quality, especially for multiple-exposure data collection, will help single-particle cryo-EM to reach higher resolution.
Keywords: single-particle electron cryo-microscopy, beam-induced movement, radiation damage, dose-rate effect, high-resolution EM
Introduction
Single-particle electron cryo-microscopy (cryo-EM) has been established as a versatile imaging technique for high-resolution structural analysis of biomolecular systems [Frank, 2002]. In cryo-EM, protein molecules embedded in vitreous ice are imaged by transmission electron microscopy. The vitreous-ice environment (~90K cooled by liquid nitrogen, or ~4K when using liquid helium) holds the protein molecules in place and preserves them in a hydrated state. Images of the particles at various orientations are then analyzed to reconstruct a 3D density model. During imaging, the high-energy electron beam causes radiation damage to the ice and the embedded protein molecules. To alleviate this damage, the imaging electron dose must be carefully controlled. According to common practice, the total dose deposited on the protein specimen should be limited to 10–30 e−/Å2, depending on the acceleration voltage (100–300 keV) used in the experiment. This protocol is referred to as low-dose imaging. In addition, to reduce the effect of mechanical instability of the microscope cryo-stage on image recording, the beam exposure is normally kept within one second. The beam intensity is then adjusted to match the aforementioned electron dose.
The physical and chemical principles of the radiation damage to protein molecules remain a subject under investigation in cryo-EM research [Glaeser and Taylor, 1978; Cosslett, 1978; Misra and Egerton, 1984; Downing and Glaeser, 1986; Dubochet et al., 1988]. It is now generally accepted that the damage is mainly caused by free radicals from beam ionization, and it has been demonstrated, by measuring the “critical exposure” of catalase 2D crystals, that the decrease in achievable resolution correlates to the total electron dose deposit [Taylor and Glaeser, 1976]. The electron beam irradiation can also generate positive charge on the specimen by ejecting electrons. The accumulated charge may induce stress/movement in the specimen and interact with the beam to distort the recorded image.
Ideally, the structure of the specimen, namely the protein molecules, the vitreous-ice layer and the carbon-film support, should remain rigid during image acquisition so that the information recorded in electron micrographs can be maximized. In reality, however, the charge accumulation and radiation damage can disrupt the structure of the specimen, resulting in the movement of individual particles in the image during a beam exposure. In the most severe cases, hydrated specimens appear to boil, an effect often referred to as “bubbling”. The bubbling effect is mainly caused by the radiolysis of water molecules to the extent that pockets of hydrogen gas form in the specimen [Leapman and Sun, 1995]. Electron-beam heating is thought to be negligible for the low beam current used with thin vitrified specimens at liquid-nitrogen temperature [Dubochet et al., 1988]. It is frequently observed that gas pockets develop preferentially at the interfaces between carbon film and ice or protein molecule and ice. An interface represents a point of structural discontinuity, and appears to promote gas pocket formation. Specimen bubbling represents a more macroscopic effect of radiation damage, compared with the more microscopic damage of chemical bonds breaking within molecules. Bond breaking also degrades the image resolution because it randomly perturbs protein structure. It is, however, less likely to cause the movement of entire sections of the specimen, as has been observed in bubbling. Bubbling is a consequence of chemical bond breaking coupled with the migration of radicals, the products of radiolysis, to high concentration in certain areas of the specimen. We will, therefore, distinguish between these two effects in the following discussion.
Aiming to develop an imaging method that can reduce specimen damage and movement, we have investigated a dose-rate effect in cryo-EM data collection. This method was tested on samples prepared using holey carbon film. The protein molecules were suspended in ice across the holes without carbon support. Our experiments indicate that effects of radiation damage (e.g., bubbling) are dictated by both the total electron dose deposit and the rate of dose delivery. Based on this research, we introduce a novel imaging mode named “low intensity and low dose acquisition”, or LINDA, which can aid single-particle cryo-EM to reach higher resolution.
LINDA imaging uses a low-intensity electron beam for data collection, and the beam flux is normally kept below 3 e−/Å2·s. In order to obtain enough electron counts to achieve the image contrast and signal-to-noise ratio (SNR) for the subsequent data analysis, an exposure usually continues for 5–10 seconds. As demonstrated by the following experiments, existing electron microscopes can provide the required mechanical stability for successful LINDA data collection.
Experiments & Analyses
To evaluate the LINDA imaging protocol, the quality of images acquired needs to be compared with that from the conventional imaging method, which uses a higher beam intensity and ~1s exposure (referred to as “HiFlux” in the following). Experiments have been conducted to assess various aspects of radiation damage, particle movement, bubbling, signal strength, and the resolution of reconstructed models. The data were collected on an FEI Tecnai F30 and an FEI G2 Polara electron microscope. The high-stability specimen stage of the Polara microscope provides the stability required for the LINDA protocol. The results indicate that images collected using the LINDA protocol contain enhanced high-resolution contrast. In addition, LINDA imaging can prolong the overall structural integrity of the specimen at higher dose and can produce consistent, high-quality images in multiple-exposure data collection. This imaging mode is, therefore, particularly suitable for random conical tilt [Radermacher et al., 1987], orthogonal tilt reconstruction [Leschzinera and Nogales, 2006] and tilt-series data acquisition in single-particle electron cryo-microscopy.
1. Beam-Induced Movement
Colloidal gold clusters (~10nm in diameter) embedded in vitreous ice are used as fiducial markers to monitor the effect of beam-induced movement of particles embedded in ice. The field emission gun of the Tecnai F30 microscope is operated at 200kV, C2 and objective apertures of 70 μm are used, and the magnification is 59,000. The spot size used for LINDA and HiFlux imaging is 10 and 7, respectively. In LINDA imaging, the beam flux is set to 1.5 e−/Å2·s, and the exposure continues for 10s. In HiFlux imaging, the beam flux is 15 e−/Å2·s, and the exposure takes only 1s. For each imaging protocol, a group of image pairs are collected at defoci between 2 and 4 μm. In each pair, two consecutive exposures are taken over the same specimen region at the same defocus (see one example in Figure 1). The exposures are separated by beam blanks to provide time for charge dissipation. The duration of beam blank is varied to test for the influence of charging on the specimen. The experimental result presented here used a beam blank of 5 minutes. The distances of the fiducial markers between the first and second image, referred to as d1 and d2 in Figure 1, are compared. To detect subtle changes, the difference in intra-marker distances between the image pairs (d1–d2) is used to gauge the beam-induced particle movement. This measurement eliminates the need for a fixed frame-of-reference for fiducial registration, which can be error-prone if the frame-of-reference is not absolutely stationary. In our analysis, the fiducial pairs are selected randomly across the ice layer, evenly distributed from the center to the carbon-film boundary. The orientation of the distance vectors is also random, with no radial or tangential preference. Furthermore, tomograms of some of the specimens show that there is no preference for the fiducial markers to be near the specimen surface or the center (data not shown). Assuming independent displacement of the sparsely located fiducial markers, large deformation of the ice layer, introduced by the electron beam irradiation, will be reflected by significant intra-marker distance changes between images in a pair.
Figure 1.

Two consecutive exposures of colloidal gold fiducial markers (10 nm, dark dots) in vitreous ice. The intra-particle distance change between two exposures is defined as (d1–d2).
The SIGNATURE program [Chen and Grigorieff, 2007] is used to register the gold markers in each image pair. Markers in the first image are identified by template-matching, using a rotation-average of a few manually annotated markers as the initial reference. The images of selected particles are then used as the templates to locate the corresponding fiducial markers in the second image, at a resolution of 1.2 Å/pixel. Six micrograph pairs are used for each imaging method for the statistical analysis of the distance changes, and the distribution histogram is plotted in Figure 2a. For the LINDA protocol, the mean distance change is 2.5 Å (1.7 Å s.t.d.), while for the HiFlux protocol, the mean is 7.5 Å (5.5 Å s.t.d.). Even though the total electron dose is the same (15 e−/Å2) in both cases, the smaller relative displacements of the fiducial markers in the images collected using LINDA indicate that lower beam intensity introduces a smaller disturbance in the cryo-specimen than the HiFlux protocol. The statistical error in the distance measurement is found to be similar to the pixel size, about 1.5 Å. The error is determined by scanning the same electron micrograph twice using the same scanner setup, but with a ~45° rotation of the micrograph between the first scan (A) and the second scan (B). The 45° rotation is chosen because it generates the largest difference between the scanning grids in the image pair. Image A and B are aligned to each other (using the entire image frame) to establish the ground-truth linear transformation between the two images. Then the regions of interest containing the fiducial marker pairs are cropped out for an independent alignment via the aforementioned particle-specific template matching, and the result is compared to the ground-truth transformation. As another test, synthetic (normally distributed) noise is added to image B using a noise variance of either 50% or 100% of the variance of image B, to simulate image quality degradation between electron beam exposures. Comparison of the alignment results of image A with the rotated image and images with added noise all indicate that the statistical error in the fiducial distance measurement is approximately 1.5 Å, comparable to the micrograph scanning resolution. This accuracy is achievable mainly because of the very high SNR of the fiducial markers in the cryo-EM images.
Figure 2.
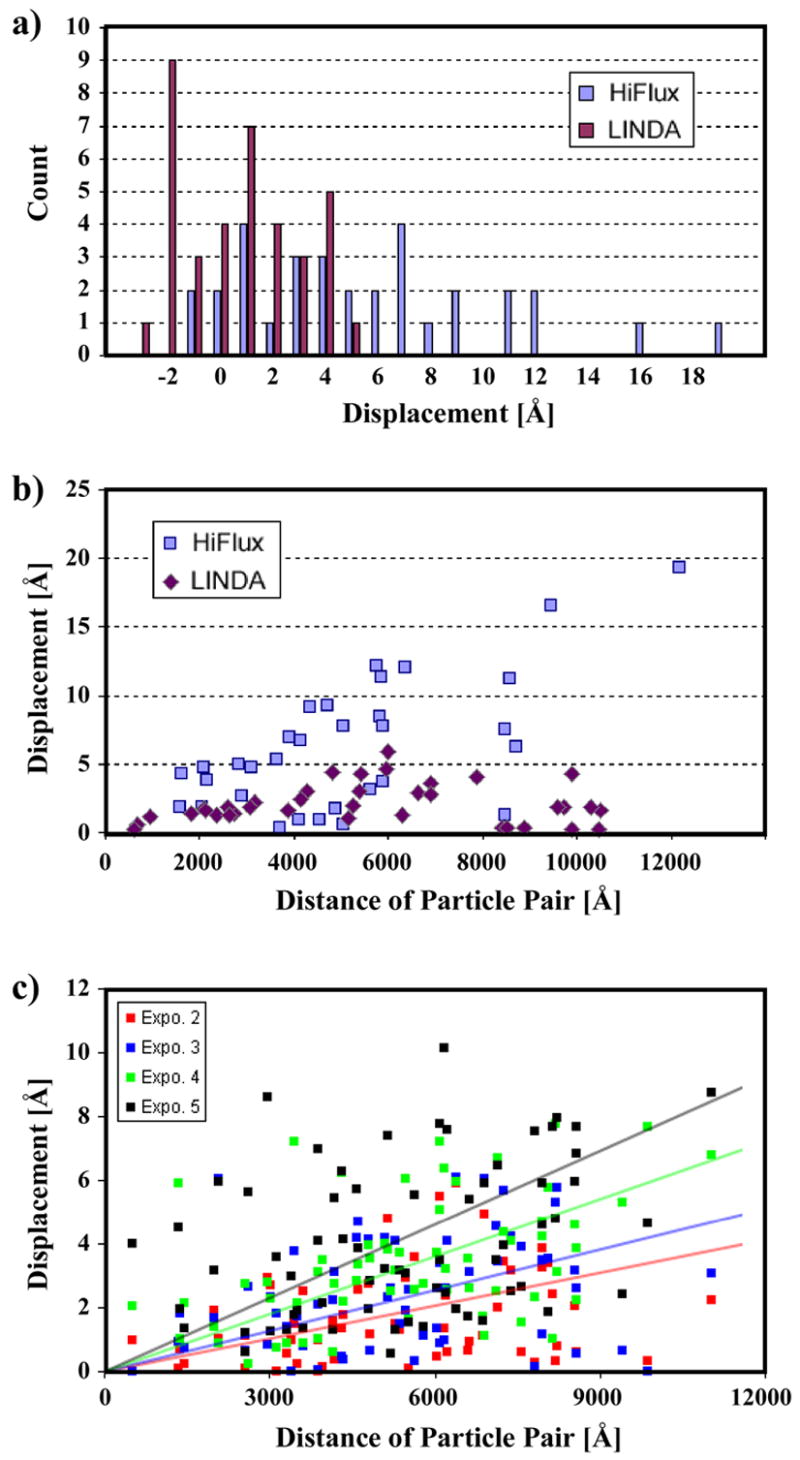
a) Intra-marker distance change between the double exposures. The beam-induced particle movement is larger in HiFlux. Both distributions are skewed towards the positive side, which indicates an overall contraction of the specimen. b) Absolute intra-marker distance change correlates with the marker-pair separation. The beam-induced particle movement is much smaller in LINDA. c) Continuous particle movement during multiple exposures. The lines represent least-square fitting (y = kx) to the respective datasets. Using the triplet (k, Δk, ε)n to designate the slope k, the error in k and the fitting variance from the n-th exposure, the results are (0.81,0.19,3.65)2, (0.99,0.23,3.97)3, (1.41,0.35,5.06)4 and (1.82,0.47,7.34)5.
Possible causes for the observed marker displacement may include: 1) the gold particles can travel in the vitreous ice, even at 90K temperature [Iancu et al., 2006], 2) the entire ice layer embedding the gold particles deforms under the electron beam irradiation [Dubochet et al., 1988], and/or 3) specimen charging that results in a change of magnification in the recorded images [Brink et al., 1998]. According to the skewed displacement histogram in Figure 2a, most of the distance changes are positive, especially for the HiFlux mode. The skew cannot be explained by randomly traveling particles, which should have equal probability for positive and negative distance changes. Since the distance change is defined as the difference between the separation of one particle pair in the first image and that of the corresponding pair in the second image, the distribution of the histogram indicates that the distances between markers tend to become smaller. In repeated experiments, two exposures are separated by up to half an hour. This gives enough time for any accumulated charge to dissipate, thus ruling out a magnification change due to specimen charging as a possible explanation for the observed displacement of the markers. Therefore, the observed displacement implies an overall contraction of the ice layer when irradiated by the high-energy electron beam. More evidence supporting this hypothesis comes from the plot of the absolute distance change against the distance between a marker pair (Figure 2b): the distance change increases when the particle pairs are farther apart. This correlation can also be explained by an overall contraction of the ice layer. Our result agrees with previous observations: with a well-centered illumination, a typical pattern of specimen movement is a radial drifting that increases with the distance to the center of illumination [Dubochet et al., 1988].
How does the beam-induced specimen movement change as beam irradiation continues? To investigate, we collected serial LINDA images in which five exposures are recorded over the same region with 30-minute beam-blank in between. Following the above distance measurement, the particle displacements, as compared to the first exposure, are summarized in Figure 2c. It is observed that the beam-induced movement increases with continued beam exposure. Assuming that the particle displacement is proportional to the pair separation, we applied linear-regression to fit lines to the respective datasets. The result from this simple model suggests that the beam-induced specimen movement is approximately proportional to the accumulated dose. Mass loss of the bulk ice layer due to the electron beam irradiation may be a possible cause (more in the Discussion section). The data from HiFlux imaging is not included for analysis, since most ice layers broke after two or three exposures. It is interesting to note that the scatter of the individual distance change measurements in Figure 2c also increases with repeated exposures. This suggests that the observed distance changes must also include a random component, presumably due to the mobility of the gold particles in the ice [Iancu et al., 2006].
Another important question about the beam-induced specimen shift is when exactly the movement occurs - during the electron exposure or during the pause between exposures. By employing the LINDA protocol which induces much less movement compared with HiFlux imaging, we can monitor the specimen movement in HiFlux imaging. In a series of images on the same specimen region, the first image is collected by HiFlux imaging, and the subsequent images using LINDA to monitor the fiducial movement. The exposure interval between the HiFlux image and the LINDA series varies from 1 minute to 30 minutes, and the exposure interval between the probing LINDA images varies from 1 to 5 minutes. We then analyzed the fiducial distance change in the LINDA series following the same procedure as described for Figure 2c. If the specimen movement from the HiFlux imaging continued well after the HiFlux beam is turned off, one should observe increased distance change in the LINDA data (higher slope). Our analysis does not reveal any apparent deviation from the pattern in Figure 2c. As a result, we conclude that the fiducial movement in the cryo-specimen stops within a short period (less than one minute) after the beam blank.
2. Protein Damage & Specimen Bubbling
Tobacco mosaic virus (TMV) [Namba et al., 1989] is used to assess the effects of radiation damage on the overall structural integrity of the protein specimen and on the signal contrast in the image. This section reports a qualitative experimental observation. A quantitative evaluation of the image contrast and signal content will be presented in the next two sections.
The TMV filament is about 180 Å in diameter, with a central channel at 40Å across. The visibility (image contrast) of this central channel serves as a qualitative criterion for assessing the integrity of the structure. Using the LINDA protocol, the beam flux is set to 1 e−/Å2·s, and the exposure lasts 10s. With the HiFlux protocol, the beam flux is 10 e−/Å2·s, and the exposure is 1s long. Both the LINDA and HiFlux images are collected on the TF30 electron microscope at 3.5 μm defocus. As before, the microscope is operated at 200 kV, the C2 and objective aperture diameters are 70 μm, and the spot size for LINDA and HiFlux imaging is 10 and 7, respectively. Images are recorded by a 4k × 4k Gatan CCD camera with a pixel size on the specimen of 2.0 Å and the beam touching the carbon support film. Using 45° tilts in both directions, the ice thickness was determined to be between 500 and 800 Å. The “Acquire Series” function of the CCD camera is used to take three consecutive images at the same region for each imaging method, with a 60s interval between the exposures (Figure 3).
Figure 3.
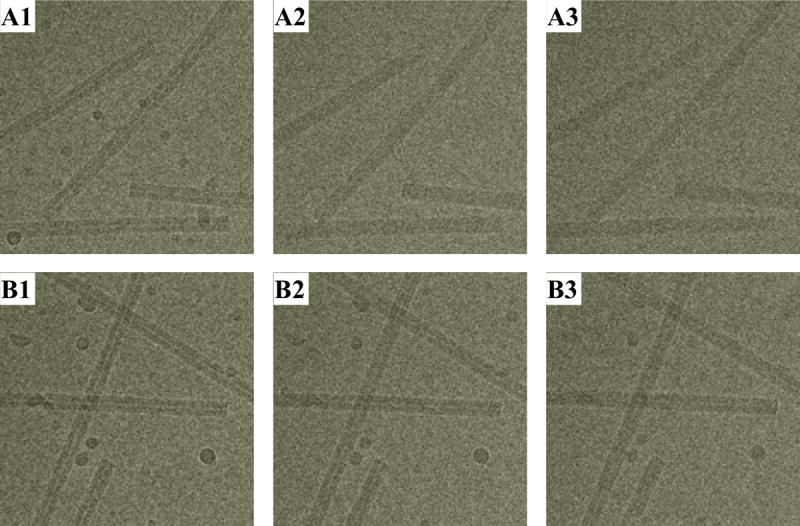
HiFlux (top) and LINDA (bottom) imaging. Three consecutive exposures by each protocol. All images are collected at 200keV, 3.5 μm defocus on an FEI TF30 electron microscope. The ice droplets in A1 is noticeably smaller than those in B1. Since these images are collected in the same area on the specimen grid, the ice droplets are expected to have similar size before beam exposure. The smaller size in A1 is due to a stronger sublimation from the HiFlux beam exposure.
In HiFlux images, the central channel of TMV is clearly visible in the first exposure (A1). The channel becomes blurry in the second image (A2), and the ice droplet contamination starts disappearing. In A3, after accumulating a dose of 30 e−/Å2, the channel almost disappears, and the ice droplets seen in the first image have completely disappeared. When using LINDA imaging, the contrast of the TMV central channel appears to be higher in the first exposure, compared to the corresponding HiFlux image. (A more quantitative evaluation of the contrast in the first exposure will be done in the next section.) In the subsequent exposures, the ice droplets disappear at a much slower rate. The channel is still clearly visible even in the third exposure, when the cumulative dose also reaches 30 e−/Å2.
In a separate experiment, different bubbling behavior of a cryo-EM specimen under different imaging modes is observed (Figure 4). For each imaging mode, three consecutive exposures are taken from the same region of the specimen with a 60s beam blank between exposures. The beam intensity is set to 10 e−/Å2·s in the HiFlux mode, with 1.0s exposure duration. For the LINDA protocol, the beam intensity is 1 e−/Å2·s, and each exposure takes 10s. Although the total dose deposited by the end of the third exposure is the same in both cases (30 e−/Å2), the bubbling is evident in HiFlux, yet nearly absent in LINDA. Again, the ice droplets are less affected by the multiple exposures, using LINDA. These experiments using both imaging protocols have been repeated on different specimen grids and on different electron microscopes, showing that the results are reproducible. It is worth noting that bubbling occurs most frequently around ice/carbon-film and ice/protein interfaces.
Figure 4.

Comparing specimen bubbling under HiFlux and LINDA imaging modes. Bubbling occurs at significantly lower total dose under HiFlux conditions.
We have also tested LINDA imaging at even lower intensity and longer exposure on TMV. In one such experiment, the beam is set to 1 e−/Å2·s, with 60s exposure. The specimen withstands the high dose well, and there is no visible bubbling in the image. Lower dose-rate, therefore, can increase the total macroscopic dose tolerance of a specimen in cryo-EM. We assume that the damage due to bond breaking still occurs in LINDA imaging as much as it occurs in the other imaging modes.
3. Image Contrast
The contrast of an image can be quantitatively analyzed, using the image power spectrum. Well-ordered specimens, such as 2D crystals, are often used for this purpose since they generate clearly identifiable signal in a power spectrum [Taylor and Glaeser, 1976]. TMV is ideal for the preparation of a specimen embedded in ice and unsupported by a carbon film [Henderson, 1992]. The image contrast generated by TMV can be analyzed in a power spectrum that contains strong layer-lines, typical of helical filaments. We use TMV in the experiment to analyze the image contrast from various imaging modes of single-particle electron cryo-microscopy.
Mechanical stability of the microscope specimen stage is critical in the image power spectrum analysis. The data is collected on an FEI Polara electron microscope, which is equipped with a high-stability cryo-stage that can provide the required stability. The Polara is operated at 300 kV, C2 and objective apertures of 70 μm are used and the magnification is 59,000. The spot size used for LINDA and HiFlux imaging is 7 and 3, respectively. For each imaging mode of LINDA and HiFlux, a few dozen images are collected, with the defocus ranging between 2.5 and 4.5 μm. The beam is carefully adjusted to cover an entire whole and some of the adjacent carbon. TMV rods are first manually boxed and then computationally aligned to a horizontal orientation, by the SIGNATURE program. To accommodate the varying lengths of the filament (some rods were partially broken, but the remaining parts were still long enough to be analyzed), each filament is cut into 575 Å long segments, which correspond to exact multiples of one helical turn (23 Å) at the image pixel-size. This segmentation also limits the influence of slight filament bending on the power spectrum. The 2D power-spectrum of each segment is calculated, and all the spectra are summed up to enhance the layer-line signal. The contrast transfer function (CTF) of the microscope is corrected by a Wiener-filter-like scheme [Grigorieff, 1998] when the spectra are summed (Eq. 1):
| (1) |
where Fn is the Fourier-transform of the n-th filament segment, and F is the image sum in the Fourier space. ε is added to avoid singularity in the denominator and is set to 0.05. To simplify the analysis, the resulting 2D spectrum is further projected onto the filament axial direction to produce a symmetric, 1D spectrum. For clarity, only one-half of the spectrum from each mode is plotted, and the two are juxtaposed in Figure 5a for comparison.
Figure 5.
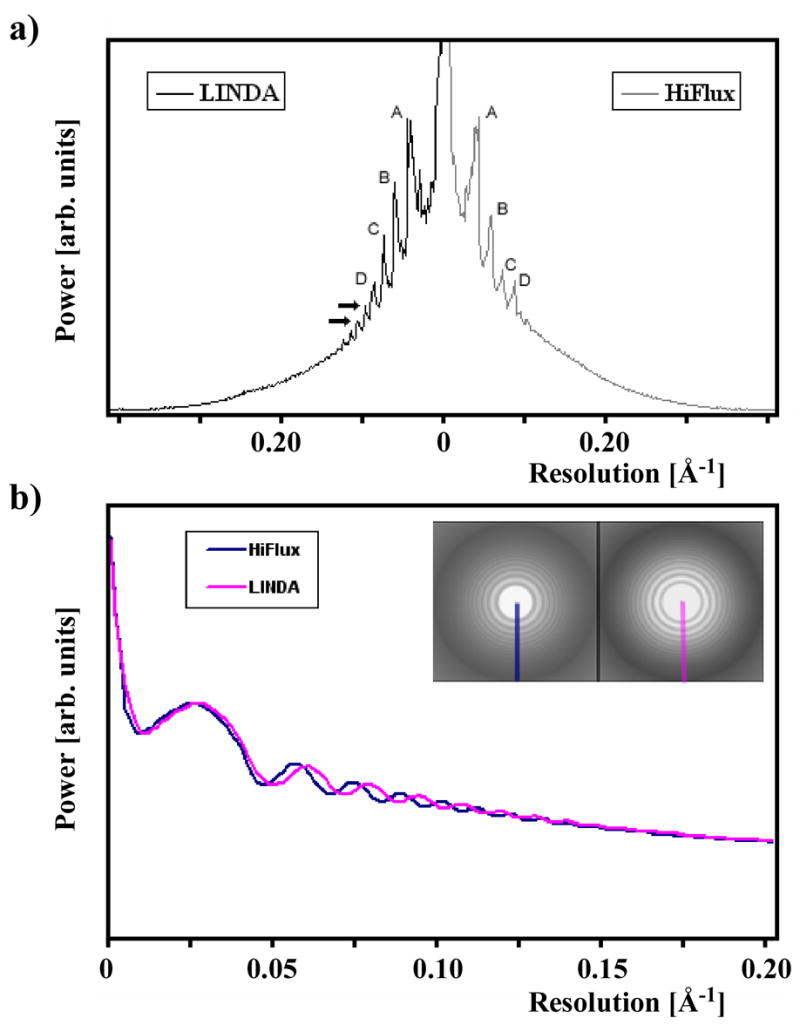
a) Image power-spectrum comparison between LINDA and HiFlux. The peaks (labeled by A, B, C, D) from LINDA are stronger and extend further to higher resolution (the arrows). b) Image power spectrum comparison between LINDA and HiFlux imaging methods. The defocus of both images is around 2.5 μm in this example. The beam envelope function, as judged from the Thon ring amplitudes, is comparable in the resolution range of interest.
Both spectra have been normalized by the first major peak (A) from the center, so that the corresponding peaks between LINDA and HiFlux can be directly compared. The peaks in the LINDA spectrum extend further towards the high-resolution domain (arrows in the figure), and the relative strengths of the peaks are more significant. Images acquired by the LINDA protocol therefore contain stronger signal under the same dose condition. This enhancement is consistent with the reduced specimen movement and higher tolerance to radiation damage, discussed in the previous sections.
One way to quantify the comparison would be to evaluate the ratio of Fobs/Fcalc, where Fobs is measured from the image spectrum, and Fcalc is calculated from model projections using an atomic model for TMV. However, solvent effects would have to be taken into account for this comparison, making a quantitative comparison difficult. We therefore rely on the plot in Figure 5a to compare the image quality from the LINDA and HiFlux methods. To rule out the effect of the beam envelope function on both imaging modes, we analyzed the power spectra of images of bare carbon-film (coated with ice) from LINDA and HiFlux imaging. The defocus range covers 2.5 to 4.5 μm, exactly the same as the setup used for the TMV data collection. As shown in Figure 5b for a pair of images at about 2.5 μm defocus, their envelope functions are comparable in the resolution range where peaks are visible in Figure 5a. Therefore, the observed stronger signal in Figure 5a is due to the improvement introduced by the LINDA imaging method.
4. Quality of Reconstructed Models
To monitor the quality degradation in cryo-EM images, we also compared the 3D density models reconstructed from multiple-exposure images. In the experiment, doubly exposed TMV images are collected, under both LINDA and HiFlux modes, on the TF30 electron microscope. As before, the microscope is operated at 200 kV, the C2 and objective aperture diameters are 70 μm, the magnification is 59,000, and the spot size for LINDA and HiFlux imaging is 10 and 7, respectively. A single-particle based method [Sachse et al., 2007] is applied to process the images and calculate the reconstruction. In the data collection, the defocus ranges from 2.5 to 4.5 μm, and the total dose is about 15 e−/Å2 in each case, with 10s exposure for LINDA imaging and 1s exposure for HiFlux imaging. The image pairs are consecutively recorded at the same defocus. Four models are then independently reconstructed, using images from 1) LINDA 1st exposure (Figure 6); 2) LINDA 2nd exposure; 3) HiFlux 1st exposure; and 4) HiFlux 2nd exposure. To monitor the image quality change between two exposures under the same imaging mode, the reconstructed models are aligned, and the cross-correlation coefficient is measured. For LINDA, the correlation between the two models is 0.973, while for HiFlux, the correlation is 0.932. The higher correlation between the models, derived from LINDA, suggests that a lower dose-rate can reduce the beam-induced structural change in the specimen. This imaging protocol should help the cryo-EM structural analysis to reach higher resolution.
Figure 6.
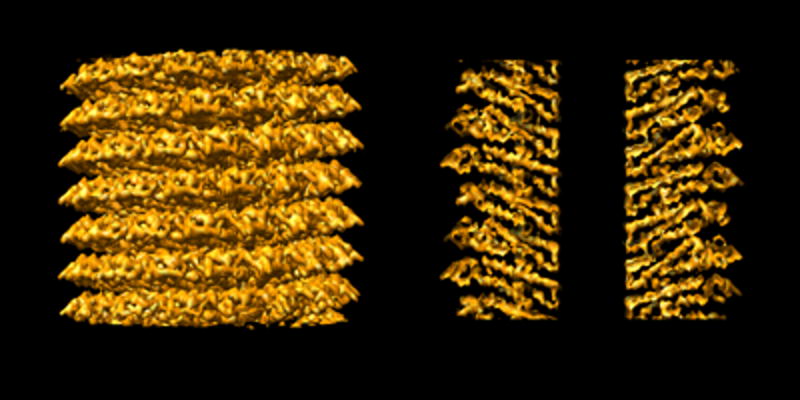
A TMV 3D density map reconstructed from LINDA imaging. Left: a side view. Right: a central section.
Discussion
We have developed a new image collection protocol, LINDA, for single-particle electron cryo-microscopy. At a low dose-rate, the new protocol can reduce specimen bubbling and movement, and prolong the overall structural integrity of protein macromolecules embedded in vitreous ice under high-energy electron beam irradiation. The low beam intensity of LINDA enables the use of a smaller C2 aperture setup on the microscope, which can enhance the spatial coherence of the imaging beam. As a result, the envelope function of the CTF extends to higher resolution, and the signal in the image at high resolution is better preserved. Taking advantage of these properties, LINDA is most suitable for multi-exposure data collection, for example, for random conical tilt reconstruction, orthogonal tilt reconstruction and tilting series. In these cases, a higher total dose can be applied to each frame to improve the image contrast, and the reduced specimen movement will make the nominal reading of the tilt-geometry more reliable for the subsequent data processing. Another application of LINDA is for defocus-pair data collection, in which two images of the same specimen area are collected, the first one at low defocus, and the second one at high defocus. The higher image contrast in the second frame can be employed in the initial processing and refinement. The particle alignment parameters can then be mapped directly to the first image at lower defocus, which contains stronger high-resolution signal, for the final model reconstruction and refinement. The newly developed LINDA protocol can easily be incorporated into automated data collection systems, for example, LEGINON [Carragher et al., 2000]. Therefore, applying LINDA imaging in routine cryo-EM data collection should be straightforward, as long as a high-stability sample stage is available.
Given the experimental observations reported above, further research is required to gain a complete understanding of the physics and chemistry of electron radiation damage in cryo-EM. Here we venture to offer some tentative explanation for the observed phenomena in LINDA imaging.
Electron beam irradiation removes water molecules from an ice layer through sublimation [Dubochet et al., 1982] and radiolysis that leads to bubbling. This mass loss introduces structural instability, specimen deformation and movement. Although the electron beam irradiation heats the specimen, the temperature rise is negligible in low-dose TEM, and is not the cause of specimen bubbling [Dubochet et al., 1988]. The fast disappearance of ice droplets, frequently observed in HiFlux imaging, is presumably due to the Coulombic interactions. Compared to the generally flat ice layer, the surface curvature of ice droplets is much higher, making them more susceptible to charging. When the charge accumulates to a certain amount, the internal Coulombic repulsion will break the droplets and eject them – the ice droplets disappear. In LINDA, the rate of induced charge accumulation is lower, and the buildup is further slowed down by the charge dissipation to the surroundings. Hence, the ice droplets appear to be more stable in LINDA imaging. A second cause of disappearing ice contamination under HiFlux conditions might be heating of the droplets, which are only loosely connected to the bulk of the specimen and will not dissipate deposited energy efficiently [Dubochet et al., 1988].
The specimen bubbling observed in cryo-EM is the result of radiolysis. Presumably, the rate of formation of radicals depends on the beam intensity, whereas the rate of reaction of radicals with surrounding chemical groups depends on the concentration of the radicals. The volume filled by a free radical is larger than that of a radical covalently bound to a molecule, because the distance between radicals and surrounding atoms is dictated by the van der Waals radii (>3 Å), which is larger than the length of a covalent bond (~1.5 Å). The formation of radicals is therefore associated with the buildup of pressure inside the specimen [Typke et al., 2007]. For a high-intensity beam, the pressure can become so high that it generates mechanical fractures within the specimen, most likely at mechanically weakened interfaces between ice and carbon film, and between ice and protein. These fractures expand and lead to the formation of gas pockets, which are visible in the image as bubbles. The lower dose-rate used in LINDA reduces the gas pressure buildup, as radicals have more time either to migrate or to find reaction partners to decrease the occupied volume, thus alleviating or even eliminating specimen bubbling. The effect of the dose rate on bubbling has been investigated previously [Dubochet et al., 1988] and it was thought that bubbling depended only marginally on the dose rate. Our results clearly contradict this notion and further indicate that other effects, such as specimen deformation and loss of image contrast, also depend on the dose rate.
The phenomenon of radiation damage also occurs in X-ray crystallography, and the most significant symptoms include decrease of diffraction intensity and resolution, increase in the unit cell volume, and site-specific damage [Ravelli and Garman, 2006]. It has been observed that adding “radical scavengers”, for instance, DTT, can reduce the amount of free radicals and consequently alleviate the radiolytic effects [Murray and Garman, 2002]. We are currently testing the use of radical scavengers under various imaging modes in cryo-EM.
Although the lower dose-rate used in LINDA imaging can increase the total dose tolerance of a protein specimen, there still is a physical dose limit. In one experiment, using TMV, we collected double-exposure LINDA images and compared the density models reconstructed from each exposure set. The total dose in each image is 30 e−/Å2. The cross-correlation between the two models is only 0.870. The overly high electron dose must therefore have introduced damage to the protein specimen. The next step of our research is to identify the dose limit and to optimize the dose rate so that the recorded signal in cryo-EM images can be maximized.
Because of the lower dose-rate used in LINDA imaging, longer beam exposure is required so that sufficient image contrast can be obtained for data processing. To further reduce the recorded specimen movement that originates from the mechanical drifting of the microscope cryo-stage, a “dose-fractioning” scheme can be used in LINDA by taking serial recording of the same region under continuous (no beam-blank in between), low-intensity beam illumination. The multiple frames are then coherently summed to form a single, SNR-enhanced image for analysis. A similar scheme has also been proposed by Typke et al., 2007. The image alignment can be achieved, either through a correlation-based approach or via a fiducial-marker registration. In the correlation-based method, the dose per image frame should be sufficient to generate adequate signal for an accurate alignment. The availability of computer-controlled, highly-sensitive CCD cameras makes this procedure readily achievable.
Acknowledgments
The authors are grateful to Noreen Francis for providing the TMV specimen that we used in our experiments. We thank Robert Glaeser for the insightful discussion on specimen charging and effects due to the formation of radicals, and David DeRosier for a critical reading of the manuscript. NG gratefully acknowledges financial support by a research fellowship from the Humboldt Foundation. The work was further supported by the European Union and the Senatsverwaltung für Wissenschaft, Forschung, und Kultur Berlin (to CMTS and TM, Anwenderzentrum).
Footnotes
Publisher's Disclaimer: This is a PDF file of an unedited manuscript that has been accepted for publication. As a service to our customers we are providing this early version of the manuscript. The manuscript will undergo copyediting, typesetting, and review of the resulting proof before it is published in its final citable form. Please note that during the production process errors may be discovered which could affect the content, and all legal disclaimers that apply to the journal pertain.
References
- 1.Frank J. Single-particle imaging of macromolecules by cryo-electron microscopy. Annu Rev Biophys Biolol Struct. 2002;31:303–19. doi: 10.1146/annurev.biophys.31.082901.134202. [DOI] [PubMed] [Google Scholar]
- 2.Glaeser RM, Taylor KA. Radiation damage relative to transmission electron microscopy of biological specimens at low temperature: a review. J Microsc. 1978;112:127–38. doi: 10.1111/j.1365-2818.1978.tb01160.x. [DOI] [PubMed] [Google Scholar]
- 3.Cosslett VE. Radiation damage in the high resolution electron microscopy of biological materials: a review. J Microsc. 1978;113:113–29. doi: 10.1111/j.1365-2818.1978.tb02454.x. [DOI] [PubMed] [Google Scholar]
- 4.Downing KH, Glaeser RM. Improvement in high resolution image quality of radiation-sensitive specimens achieved with reduced spot size of the electron beam. Ultramicroscopy. 1986;20:269–78. doi: 10.1016/0304-3991(86)90191-9. [DOI] [PubMed] [Google Scholar]
- 5.Misra M, Egerton RF. Assessment of electron irradiation damage to biomolecules by electron diffraction and electron energy-loss spectroscopy. Ultramicroscopy. 1984;15:337–43. doi: 10.1016/0304-3991(84)90128-1. [DOI] [PubMed] [Google Scholar]
- 6.Brink J, Sherman MB, Berriman J, Chiu W. Evaluation of charging on macromolecules in electron cryomicroscopy. Ultramicroscopy. 1998;72:41–52. doi: 10.1016/s0304-3991(97)00126-5. [DOI] [PubMed] [Google Scholar]
- 7.Typke D, Gilpin CJ, Downing KH, Glaeser RM. Stroboscopic image capture: reducing the dose per frame by a factor of 30 does not prevent beam-induced specimen movement in paraffin. Ultramicroscopy. 2007;107:106–115. doi: 10.1016/j.ultramic.2006.06.005. [DOI] [PubMed] [Google Scholar]
- 8.Dubochet J, Adrian M, Chang JJ, Homo JC, Lepault J, McDowall AW, Schultz P. Cryo-electron microscopy of vitrified specimens. Quart Rev Biophys. 1988;21:129–228. doi: 10.1017/s0033583500004297. [DOI] [PubMed] [Google Scholar]
- 9.Dubochet J, Lepault J, Freeman R, Berriman JA, Homo JC. Electron microscopy of frozen water and aqueous solutions. J Microsc. 1982;128:219–237. [Google Scholar]
- 10.Taylor KA, Glaeser RM. Electron diffraction of frozen, hydrated protein crystals. Science. 1974;186:1036–1037. doi: 10.1126/science.186.4168.1036. [DOI] [PubMed] [Google Scholar]
- 11.Taylor KA, Glaeser RM. Electron microscopy of frozen hydrated biological specimens. J Ultrastructure Res. 1976;55:448–456. doi: 10.1016/s0022-5320(76)80099-8. [DOI] [PubMed] [Google Scholar]
- 12.Knapek E, Dubochet J. Beam damage to organic material is considerably reduced in cryo-electron microscopy. J Mol Biol. 1980;141:147–161. doi: 10.1016/0022-2836(80)90382-4. [DOI] [PubMed] [Google Scholar]
- 13.Henderson R. Image contrast in high-resolution electron microscopy of biological macromolecules: TMV in ice. Ultramicroscopy. 1992;46:1–18. doi: 10.1016/0304-3991(92)90003-3. [DOI] [PubMed] [Google Scholar]
- 14.Leapman RD, Sun S. Cryo-electron energy loss spectroscopy: observations on vitrified hydrated specimens and radiation damage. Ultramicroscopy. 1995;59:71–79. doi: 10.1016/0304-3991(95)00019-w. [DOI] [PubMed] [Google Scholar]
- 15.Chen JZ, Grigorieff N. SIGNATURE: A single-particle selection system for molecular electron microscopy. J Struct Biol. 2007;157:168–173. doi: 10.1016/j.jsb.2006.06.001. [DOI] [PubMed] [Google Scholar]
- 16.Namba K, Pattanayek R, Stubbs G. Visualization of protein-nucleic acid interactions in a virus. Refined structure of intact tobacco mosaic virus at 2.9 Å resolution by X-ray fiber diffraction. J Mol Biol. 1989;208:307–25. doi: 10.1016/0022-2836(89)90391-4. [DOI] [PubMed] [Google Scholar]
- 17.Sachse C, Chen JZ, Coureux P, Stroupe ME, Fandrich M, Grigorieff N. High-resolution electron microscopy of helical specimens: a fresh look at tobacco mosaic virus. J Mol Biol. 2007 doi: 10.1016/j.jmb.2007.05.088. in press. [DOI] [PMC free article] [PubMed] [Google Scholar]
- 18.Ravelli R, Garman EF. Radiation damage in macromolecular cryocrystallography. Curr Opinion Struct Biol. 2006;16:624–629. doi: 10.1016/j.sbi.2006.08.001. [DOI] [PubMed] [Google Scholar]
- 19.Grigorieff N. Three-dimensional structure of bovine NADH:Ubiquinone Oxidoreductase (Complex I) at 22 Å in ice. J Mol Biol. 1998;277:1033–1046. doi: 10.1006/jmbi.1998.1668. [DOI] [PubMed] [Google Scholar]
- 20.Iancu CV, Wright ER, Heymann JB, Jensen GJ. A comparison of liquid nitrogen and liquid helium as cryogens for electron cryotomography. J Struct Biol. 2006;153:231–240. doi: 10.1016/j.jsb.2005.12.004. [DOI] [PubMed] [Google Scholar]
- 21.Murray J, Garman E. Investigation of possible free-radical scavengers and metrics for radiation damage in protein cryocrystallography. J Synchrotron Rad. 2002;9:347–354. doi: 10.1107/s0909049502014632. [DOI] [PubMed] [Google Scholar]
- 22.Radermacher M, Wagenknecht T, Verschoor A, Frank J. Three-dimensional reconstruction from a single-exposure, random conical tilt series applied to the 50S ribosomal subunit of Escherichia coli. J Microsc. 1987;146:113–136. doi: 10.1111/j.1365-2818.1987.tb01333.x. [DOI] [PubMed] [Google Scholar]
- 23.Leschziner AE, Nogales E. The orthogonal tilt reconstruction method: An approach to generating single-class volumes with no missing cone for ab initio reconstruction of asymmetric particles. Journal of Structural Biology. 2006;153:284–299. doi: 10.1016/j.jsb.2005.10.012. [DOI] [PubMed] [Google Scholar]
- 24.Carragher B, Kisseberth N, Kriegman D, Milligan RA, Potter CS, Pulokas J, Reilein A. Leginon: An automated system for acquisition of images from vitreous ice specimens. J Struct Biol. 2000;132:33–45. doi: 10.1006/jsbi.2000.4314. [DOI] [PubMed] [Google Scholar]