Abstract
The aim of this study was to analyze the distribution of FGFR3 mutations in bladder tumors of different grade and stage and determine the relation of mutations to chromosomal alterations detected by comparative genomic hybridization (CGH). One hundred bladder cancer samples served as templates for manual microdissection. DNA was isolated from dissected samples containing at least 80% tumor cells. Mutations in FGFR3 were analyzed by SNaPshot analysis. CGH was carried out according to standard protocols. FGFR3 mutations were detected in 45 of 92 samples (48.9%). Concerning T-category, the following mutation frequencies occurred: pTa, 69%; pT1, 38%; and pT2-3, 0%. The mutation frequency was significantly associated with tumor grade: G1, 72%; G2, 56%; and G3, 4%. In pTaG1 tumors, mutations were found in 74%. A significantly lower number of genetic alterations per tumor detected by CGH was associated with FGFR3 mutations (2 vs 8). This association was also seen in pTaG1 tumors: 2.5 (with mutation) vs 7.5 (without mutation). FGFR3 mutations characterize noninvasive low-risk tumors of low malignancy. The low malignant potential of these tumors is underlined by a low number of genetic alterations per tumor. Therefore, FGFR3 represents a valuable prognostic marker of tumors with low malignant potential and can be used as surrogate marker for the detection of genetically stable bladder tumors.
Introduction
Urothelial carcinomas of the urinary bladder represent the fifth common cancer and 357,000 new cases are diagnosed every year worldwide [1]. Most of these tumors are noninvasive well-differentiated papillary tumors (pTa, low grade) and can be treated by endoscopical transurethral resection. However, up to 70% of these tumors recur and, of these, 15% to 30% are characterized by tumor progression. An early detection of invasive tumors is necessary for an effective therapy. Now, no prognostic parameters are available to predict the risk of recurrence or progression for the patient. Therefore, new prognostic markers are required for an individual prognosis of patients with bladder cancer. The knowledge of tumor biology and the identification of genes and proteins involved in tumor development and progression are essential for new diagnostic and prognostic tools.
Fibroblast growth factor receptor 3 (FGFR3) could represent a promising biomarker for bladder cancer. FGFR3 is a glycoprotein and belongs to the tyrosine kinase receptor family. Constitutive activation of FGFR3 by germline point mutations leads to congenital anomalies such as achondroplasia and thanatophoric dysplasia [2,3]. Recently, it has been shown that somatic mutations of the FGFR3 gene occur frequently in urothelial tumors of the bladder and less frequently in carcinomas of the cervix uteri, suggesting that FGFR3 plays an oncogenic role [4]. Further studies demonstrated that mutations in FGFR3 occur frequently in noninvasive urothelial tumors of the bladder, but not in invasive tumors, and might correlate with favorable clinical outcome [5–7].
In the last 10 years, it was clearly demonstrated that two different pathways exist in the development of urothelial carcinomas [8]. Noninvasive papillary tumors are genetically stable with few chromosomal alterations and a low malignant potential with frequent recurrences but very infrequent progression to invasive disease. In contrast, flat urothelial lesions like dysplasia and carcinoma in situ are genetically unstable with multiple chromosomal alterations and a rapid progression to invasive highly malignant tumors with unfavorable outcome [9,10].
The aim of this study was to analyze both FGFR3 mutations and chromosomal alterations of urothelial tumors of the bladder to investigate whether tumors with FGFR3 mutations are genetically more stable than tumors without mutations. To our knowledge, this is the first study investigating chromosome alterations over the whole genome and FGFR3 mutation status in correlation with histopathological data in a large consecutive series.
Materials and Methods
One hundred primary consecutive urothelial carcinomas with different T-categories and grade were included in this study (Table 1). Tumor samples were obtained immediately after transurethral resection or radical cystectomy and were snap frozen in liquid nitrogen. Frozen sections were done for all specimens and stained by hematoxylin-eosin to define areas with high amount of tumor cells. Areas with at least 80% tumor cells were manually microdissected and DNA was isolated with a commercial kit (Qiagen, Hilden, Germany).
Table 1.
Contribution of Histopathological Categories.
| Classification | No. |
| pTa | 49 |
| pT1 | 27 |
| pT2-3 | 14 |
| G1 | 36 |
| G2 | 30 |
| G3 | 22 |
Informed consent was obtained from all patients. Histopathology was assessed on the paraffin-embedded material of the patients by one surgical pathologist. Grading was done according to the 1973 World Health Organization classification.
Mutation Analysis
Analysis of the FGFR3 gene for mutations was based on the ABI PRISM SNaPshot Multiplex Kit (Applied Biosystems, Foster City, CA), and performed as described previously [11]. In short, three regions of interest comprising nine FGFR3 mutations were amplified in one multiplex polymerase chain reaction (PCR), followed by extension of primers for each mutation with a labeled dideoxynucleotide. Extended primers were separated by capillary electrophoresis, and the presence or absence of a mutation was indicated by the incorporated nucleotide.
Comparative Genomic Hybridization
Comparative genomic hybridization (CGH) was performed in cases where mutation analysis revealed a result. To obtain sufficient amounts of DNA for CGH analysis, tumor DNA was amplified according to a modified protocol for degenerate oligonucleotide-primed PCR [12,13]. This protocol uses Sequenase (GE Healthcare,Munich, Germany) during the first eight cycles of nonspecific PCR, followed by 30 additional cycles under specific conditions using Taq polymerase (Stoffel fragment; Perkin Elmer, Rodgau-Jügesheim, Germany). Labeling of tumor DNA and normal DNA was achieved by 20 PCR cycles using biotin-16dUTP and digoxigenin-11dUTP, respectively.
One microgram of both tumor DNA and normal DNA were hybridized with 50 µg Cot-1 DNA on normal metaphases at 37°C for 48 hours. Detection of fluorescent signals was carried out with avidin-FITC (tumor DNA) and anti-digoxigenin-rhodoamine (normal DNA). DAPI-Antifade (GE Healthcare) was used for chromosome counterstaining. Fifteen metaphases were analyzed in each case using a microscope (Axioplan 2; Carl Zeiss AG, Oberkochen, Germany) and a computer system (MetaSystems, Altlussheim, Germany). Chromosomal alterations can be detected as shifts of the profile to the red borderline (loss of chromosomal region in the tumor DNA) or to the green borderline (gain of chromosomal region in the tumor DNA).
Statistical Analysis
Statistical analysis was performed using the Statistical Package for the Social Sciences (SPSS Inc., Chicago, IL) software. The chi-square and the Mann-Whitney U tests were used.
Results
Mutation Analysis
Mutation analysis was possible in 92 of 100 cases. FGFR3 mutations were detected in 45 of 92 cases (48.9%). Mutations in codon 249 (S249C) occurred most frequently (25 cases). Codons 375 (Y375C), 372 (G372C), 248 (R248C), and 652 (K652E and K652T) mutations were found in 10, 4, 3, and 3 cases, respectively (see Table 2).
Table 2.
Results After Mutation Analysis and CGH Analysis.
| Case No. | pT | G | FGFR3 Mutation | CGH Results |
| 102 | pT | cis | G C | 0 |
| 95 | pTa | G1 | 0 | dim(8p), enh(3p21qter,6p,7q31qter,8q,10p12pter,12q23qter) |
| 149 | pTa | G1 | 0 | 0 |
| 155 | pTa | G1 | 0 | 0 |
| 156 | pTa | G1 | 0 | 0 |
| 168 | pTa | G1 | 0 | 0 |
| 194 | pTa | G1 | 0 | dim(2q,3p14p23,6,8p,9,14,17p), enh(8q) |
| 196 | pTa | G1 | 0 | dim(9q), enh(8q) |
| 430 | pTa | G1 | 0 | 0 |
| 582 | pTa | G1 | 0 | dim(5q,6q,9p,14), enh(5,16q,20) |
| 367 | pTa | G1 | G372C | dim(Y) |
| 583 | pTa | G1 | G372C | dim(9q13q31) |
| 172 | pTa | G1 | K652E | dim(8p,9p,17p,18q12q21) |
| 373 | pTa | G1 | K652T | dim(6q13qter,9q,17p), enh(1q,3q26qter,6p12q13,7p15pter,8q23) |
| 190 | pTa | G1 | R248C | dim(9) |
| 366 | pTa | G1 | R248C | dim(3p13p24,5q12q21,6q16qter,8p12pter,9,10q21qter,17p), enh(1q24,2q14q34,17q) |
| 590 | pTa | G1 | R248C | 0 |
| 15 | pTa | G1 | S249C | enh(1p,15q), dim(9,11p) |
| 23 | pTa | G1 | S249C | 0 |
| 27 | pTa | G1 | S249C | dim(9q,Y), enh(8q) |
| 70 | pTa | G1 | S249C | 0 |
| 144 | pTa | G1 | S249C | dim(9,16q21qter,17p13pter), enh(1q24q41) |
| 153 | pTa | G1 | S249C | dim(9q22q33) |
| 157 | pTa | G1 | S249C | 0 |
| 179 | pTa | G1 | S249C | 0 |
| 204 | pTa | G1 | S249C | 0 |
| 207 | pTa | G1 | S249C | dim(9q21qter) |
| 214 | pTa | G1 | S249C | 0 |
| 365 | pTa | G1 | S249C | dim(9q), enh(10q24q25) |
| 379 | pTa | G1 | S249C | 0 |
| 140 | pTa | G1 | Y375C | dim(9) |
| 333 | pTa | G1 | Y375C | dim(Y) |
| 371 | pTa | G1 | Y375C | 0 |
| 378 | pTa | G1 | Y375C | dim(3p12p24,2q,4p15pter,6p?,8p,9q,14q22qter,17p), enh(5q14q31,8q,13q21qter) |
| 440 | pTa | G1 | Y375C | dim(9q) |
| 588 | pTa | G1 | Y375C | dim(9), enh(11q14q22) |
| 71 | pTa | G2 | 0 | 0 |
| 110 | pTa | G2 | 0 | |
| 137 | pTa | G2 | 0 | 0 |
| 441 | pTa | G2 | 0 | enh(3p21pter,3q,5q,8q,10q,16q,17q), dim(4,5q,6q,8p,9,11,12,18q), amp(11q13) |
| 571 | pTa | G2 | 0 | enh(6p,7p,8,20), amp(11q13) |
| 573 | pTa | G2 | 0 | enh(1q32qter,2q15q22,5q,7q,8q,11q,13q21qter,18p,20), dim(2q32qter,5q,6p21.2q22,7p11.2p21,9,11p, 14,18q,Y), amp(8p11.1p22) |
| 580 | pTa | G2 | G372C | dim(Y) |
| 13 | pTa | G2 | S249C | dim(9q,Xp), enh(14q23qter,17,20q) |
| 372 | pTa | G2 | S249C | 0 |
| 577 | pTa | G2 | S249C | enh(1p,8q,15), dim(8p,9,11p) |
| 584 | pTa | G2 | S249C | enh(1q,8,13) |
| 574 | pTa | G2 | Y375C | 0 |
| 579 | pTa | G2 | Y375C | dim(9q,11), enh(7), amp(12q21q22) |
| 587 | pTa | G3 | S249C | dim(9,10q24q25,11p) |
| 195 | pT1 | G1 | 0 | 0 |
| 62 | pT1 | G2 | 0 | dim(5q?,5q33qter,6q22,8p12pter,9,11p,17p12pter), enh(6p?,17q?,18q?,20p), amp(8q23) |
| 109 | pT1 | G2 | 0 | dim(4q,5q23qter,8p,9q,11p,Y), enh(3q,6,7p,8q,10p,12p,18p,21) |
| 138 | pT1 | G2 | 0 | 0 |
| 161 | pT1 | G2 | 0 | dim(8p), enh(8q) |
| 183 | pT1 | G2 | 0 | dim(2q31qter,4q,5p,5q23qter,6p11.1p21.3,8q23qter,9,10q,13q12q14,Y), enh(3q25qter,6q12q21,10p, 11p11.2q13,15q,16), amp(5p13q11), amp(7p14pter), amp(8)(q11.1q12), amp(12)(q14q21) |
| 429 | pT1 | G2 | 0 | 0 |
| 591 | pT1 | G2 | 0 | enh(5p,8p11.1p22,10p,18p) |
| 96 | pT1 | G2 | K652E | enh(3,8) |
| 4 | pT1 | G2 | S249C | dim(9q), enh(8q) |
| 61 | pT1 | G2 | S249C | dim(9), enh(1q) |
| 89 | pT1 | G2 | S249C | dim(5q32q34,7p,9), enh(7q,15q) |
| 201 | pT1 | G2 | S249C | 0 |
| 215 | pT1 | G2 | S249C | dim(8p,9p,10q23qter?,11p,18q21q22), enh(2p,3q?,12q14q21) |
| 382 | pT1 | G2 | S249C | dim(8p12q11.2) |
| 581 | pT1 | G2 | S249C | dim(3p14pter,9q21qter) |
| 300 | pT1 | G2 | Y375C | enh(7), dim(9q,Y) |
| 576 | pT1 | G2 | Y375C | dim(2q33qter,11) |
| 22 | pT1 | G3 | 0 | dim(4q32.1qter,12q21qter), enh(1q21q31,2q,3p25pter,5p,18p) |
| 106 | pT1 | G3 | 0 | dim(8p,18q), enh(5p,8q21q23,17p,18p) |
| 185 | pT1 | G3 | 0 | enh(8q22qter,16,17q,20) |
| 210 | pT1 | G3 | 0 | enh(5p,6p,10p,11q13q23,13q,16p,17q), dim(5q,Y), amp(8q22) |
| 225 | pT1 | G3 | 0 | dim(5q?,9q?), enh(1p13q31) |
| 575 | pT1 | G3 | 0 | dim(5q,7q32qter,8p,Y), enh(2p,3q,4p,4q31q33,5p,6p,8q21q23,10p,11q14q23,13q21qter,18p) |
| 585 | pT1 | G3 | 0 | enh(2p,3,5p,7,8,9,10p,20), dim(1p,5q11.2q15,6q,9,10q,14,17p) |
| 586 | pT1 | G3 | 0 | dim(2q32qter,4q13q31.1,5q,8p,10q,11p,13,14q11.2q24,16q), enh(1q21q32,2p,5p,-5q,6p,7q,8q, 10p,11q,16p,17,20) |
| 589 | pT1 | G3 | 0 | dim(4q26qter,6q,8p,10q23qter,11p,14,17p,18q), enh(1q24qter,2p11.2p22,2q24q25,3p22pter,3q, 5p,6p,7p,7q35qter,8p11.2q11.2,8q23q24,9p,11q23qter,20) |
| 60 | pT2 | G3 | 0 | dim(2q32qter,5q,11p12pter,12p,Y), enh(3,5p,8q21.3q22.3,13q21.3qter,14q,20q) |
| 135 | pT2 | G3 | 0 | dim(2q14,2,4p,6q,8p12pter,11p,13q13q31.3,14q21qter,16p,18q), enh(1p31p1q32.2,3q,4q?,5p,7, 16q22.1qter,18p,20q), amp(8q23) |
| 178 | pT2 | G3 | 0 | dim(1p,2q36qter,5q,6q,8p,10q,18q), enh(1q,5p,6p22p24,9p,10p12pter,13q31qter,17q23.2qter,18p,20q) |
| 223 | pT2 | G3 | 0 | dim(8p,11q23qter,18q21qter?), enh(3q24qter,6p22pter,8q,9,11p?,18q,14q) |
| 224 | pT2 | G3 | 0 | dim(2q36qter,10q,11q22qter), enh(6p23pter) |
| 228 | pT2 | G3 | 0 | 0 |
| 578 | pT2 | G3 | 0 | 0 |
| 311 | pT2b | G3 | 0 | 0 |
| 66 | pT3a | G3 | 0 | dim(6q), enh(8q21.1qter,11q14.3qter) |
| 101 | pT3a | G3 | 0 | 0 |
| 108 | pT3a | G3 | 0 | 143 pT3a G3 0 dim(6p22pter,17p), enh(3q25q26,8q,9p23pter) |
| 139 | pT3b | G2 | 0 | dim(4q31qter,9,15q22qter,17p,Y), enh(7), amp(10q22q23) |
| 381 | pT3b | G3 | 0 | dim(4p,5q11.2q23,8p,18q), enh(5p,8q,10q25qter,20) |
| 181 | pTx | G2 | G372C | 0 |
Mutations are specified for each codon.
0, no alterations were detected; Dim, loss of chromosome region; Enh, gain of chromosome region.
Correlation with stage
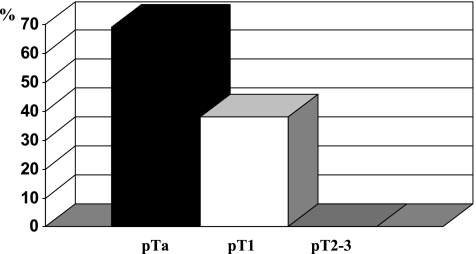
A strong correlation between mutations and stage was found. Mutations occurred only in pTa (69%) and pT1 tumors (38%), but never in higher stage tumors (pT2-C3 0%, see Figure 1). These results were statistically significant (P < .001). Comparison of mutation frequency between pTa and pT1 tumors was also significant (P = .013).
Figure 1.
Frequency of FGFR3 mutations concerning T-category.
Correlation with grade
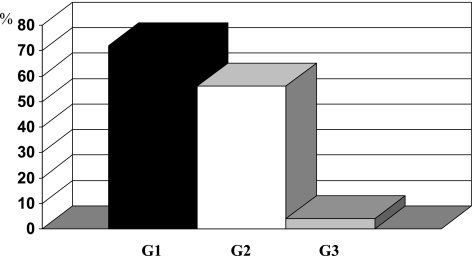
Mutations were detected mostly in G1 and G2 tumors, but only in one G3 tumor (see Figure 2). These results were statistically significant (P < .001). Mutations occurred in 72% of G1 and in 56% of G2 tumors (P = .227).
Figure 2.
Frequency of FGFR3 mutations concerning tumor grade.
The mutation frequency was 74% in pTaG1 tumors and 54% in pTaG2 tumors, respectively.
Comparative Genomic Hybridization
CGH was performed on the 92 cases where mutation analysis was possible. Results were obtained in 90 cases. Alterations were detected in 62 cases (69%) (see Table 2). The mean number of genetic alterations per tumor was 6.4. The following genetic alterations were found frequently: losses of chromosomes 9 (55%), 8p (29%), 6 (23%), 11p (23%), and 5q (20%), and gains of chromosomes 8q (44%) and 1 (21%).
Correlation with stage
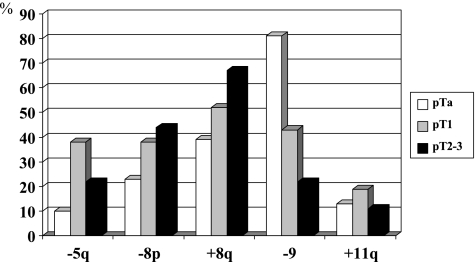
The mean number of aberrations per tumor was 4.73, 7.86, and 9.11 in pTa, pT1, and pT2-4 tumors, respectively (P = .026). The frequency of specific alterations was higher with higher T-category for many chromosomes (see Figure 3). However, statistical significance was reached only for loss of chromosome 5q and loss of chromosome 9 (more frequent in lower T).
Figure 3.
Contribution of chromosomal alterations detected by CGH concerning T-category. Statistical significance was reached for loss of chromosome 5q between Ta and T1 and for loss of chromosome 9 between Ta, T1, and T2-3.
Correlation with FGFR3 mutations
For all tumors, the number of aberrations per tumor is significantly higher in tumors without mutations (median 8.0) compared to that with FGFR3 mutations (median 2.0, P < .001). In pTa tumors, the number of alterations per tumor differs significantly between tumors with (median 2.5) and without (median 7.5) mutations, too (P = .006).
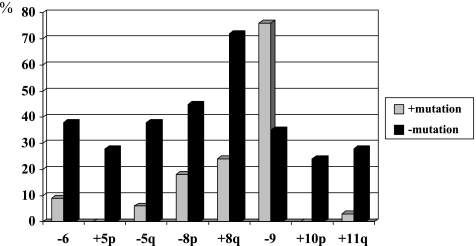
Analysis of specific chromosomes revealed significantly more gains of chromosomes 8q (P < .001), 5p (P = .003), 10p (P = .006), and 11q (P = .021), as well as losses of chromosomes 8p (P = .043) and 5q (P = .002) in tumors lacking mutations (see Figure 4). Interestingly, losses of chromosome 9 were, however, significantly more frequent in tumors with mutations (P = .005).
Figure 4.
Frequency of chromosomal alterations detected by CGH in tumors with and without FGFR3 mutations. Statistical significance was reached for all presented chromosomes.
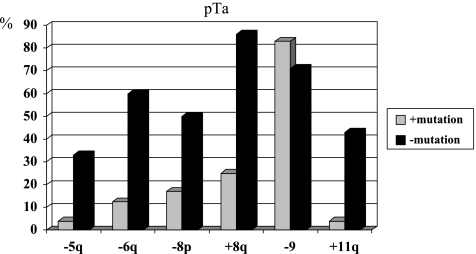
In pTa tumors, the above-described alterations were also different in tumors with or without mutations (see Figure 5). However, statistical significance was reached for chromosomes 5q (P = .038), 6 (P = .017), 8q (P = .004), and 11q (P = .009). Losses of chromosome 9 were similarly distributed in both groups.
Figure 5.
Frequency of chromosomal alterations detected by CGH in pTa tumors with and without FGFR3 mutations. Statistical significance was reached for chromosomes 5q, 6, 8q, and 11q.
Discussion
Despite of good therapy options and favorable outcome, a high recurrence rate is a serious problem in noninvasive bladder tumors of low malignancy. In addition, urothelial carcinomas with stromal invasion (pT1) show a considerable risk of progression to muscle invasive disease. Until now, no prognostic parameters are available to predict the individual outcome of these patients. During the last years, molecular investigations were performed to understand the tumor biology of bladder cancer and thereby to identify genes and proteins that are involved in tumor development and progression. Several genes that could be of prognostic significance in bladder cancer were identified. It was shown that an accumulation of p53 is an independent prognostic predictor of recurrence-free and overall survival [14,15]. However, some studies failed to show the relationship with outcome possibly because of different protocols for immunohistochemistry or patient selections [16]. Because of the rare occurrence of p53 mutations in pTaG1 tumors, other prognostic factors are necessary to predict the outcome of these patients.
FGFR3 mutations were recently detected in bladder cancer by several groups and described to be associated with low recurrence and progression rate [4,6]. Fibroblast growth factor receptors belong to the tyrosine kinase receptor family. They regulate cellular processes, such as cell growth, differentiation, and angiogenesis.
In our study, we found FGFR3 mutations in about 50% of all tumors. There was a strong correlation with stage and grade. Mutations were restricted to pTa and pT1 tumors with high or moderate differentiation and never occurred in muscle-invasive tumors. Therefore, FGFR3 mutations are associated with noninvasive low malignant tumors or tumors with limited invasive potential. These results confirmed findings of other studies. Whereas the frequency in pTa tumors was similar compared to these studies, the percentage of pT1 tumors with mutations differs between the studies [5,6,17]. One reason might be the different number of cases that were investigated and a different distribution of tumor grade in these cases. If there were many pT1G3 tumors included, the percentage of cases with mutations was very low. This strong correlation with grade was striking in all studies. The majority of mutations were found in low malignant tumors, whereas mutations in G3 tumors were very rare. These results from different studies underline that FGFR3 mutations characterize tumors with favorable histological features. Furthermore, in the study of van Rhijn et al. [5], it was shown that the presence of an FGFR3 mutation is a strong indicator of superficial bladder tumors with a favorable clinical outcome. Recently, Hernandez et al. [7] found FGFR3 mutations to be associated with a higher rate of recurrence but again with good clinical outcome. Previous studies clearly showed that bladder cancer cases can be separated in two distinct tumor entities: 1) genetically stable low malignant tumors with few genetic alterations, i.e., mainly deletions of chromosome 9, and 2) genetically unstable highly malignant tumors with multiple genomic aberrations.
Based on these findings, we hypothesized that tumors with and without FGFR3 mutations were also characterized by different chromosomal patterns. For that reason, we performed CGH, which allows the detection of chromosomal losses and gains over the whole genome. Mutation analysis and CGH were carried out on the same material and were correlated. To our knowledge, this is the first study that combines FGFR3 mutation analysis with a whole genome chromosome analysis. The number of genetic alterations was significantly higher in tumors without FGFR3 mutations. This clearly indicates that tumors with mutations are genetically more stable than tumors without mutations. To exclude that this correlation was due to the higher percentage of high-grade tumors in the group of invasive tumors, we analyzed the pTa tumors separately. Even in this group, a strong correlation of FGFR3 mutations with low number of chromosomal alterations was found. Therefore, mutations in FGFR3 characterize noninvasive low malignant tumors that are genetically stable.
Looking at specific chromosomes, we found that losses of 5q and 6 as well as gains of chromosomes 8q, 10p, and 11q were significantly more frequent in tumors without mutations. A similar picture was seen in pTa tumors; however, statistical significance was reached only for chromosomes 6, 8q, and 11q. Losses on chromosome 5 in bladder cancer are known from other studies [18,19], in which losses of the chromosome regions 5q22-q23 and 5q33-q34 were found to be associated with tumor progression [19]. Gain of 8q and loss of 8p are known genetic alterations that are associated with progression in many solid tumors as well as in bladder cancer [20–22]. Interestingly, deletions of chromosome region 8p12-22 were found to be associated with invasive papillary bladder cancers [23]. To exclude that the statistical correlation between specific genetic alterations and FGFR3 mutation is based on a correlation between stage and genetic alterations, we performed statistical analysis between T-category and each chromosomal alteration. As a result, we could not find statistical significance even if there was an accumulation of the above alterations in invasive tumors. Because the correlation between FGFR3 wild-type status and gains of 8q was shown, we can conclude that gain of 8q is a specific feature of more aggressive tumors without FGFR3 mutations.
Another significant alteration was a gain on 11q. Most often, loss on 11q was described as associated with bladder cancer, but we found it only in three tumors. However, several groups detected an amplification in the region 11q13q23 [22,24]. In our cases, gains on 11q occurred mostly as amplifications or gains of a restricted region between 11q13 and q23. This region contains oncogenes, such as CCND1, FGF3, and FGF4 , which could be activated by amplification [25]. Amplification of these genes is associated with stage and survival in pT1 tumors [26].
Loss on chromosome 9 correlated with FGFR3 mutations in the whole tumor group. However, this correlation is based on distribution of chromosome 9 losses in different stages. There is a strong correlation between loss of chromosome 9 and stage (see Figure 3). A higher number of chromosome 9 alterations in pTa tumors compared to pT1 to pT4 tumors was also described by Richter et al. [27]. Losses on chromosome 9 are apparently typical features of noninvasive low malignant papillary tumors (see Figure 3). In pTa tumors, loss of chromosome 9 is similarly distributed in tumors with and without mutations. Therefore, a correlation of FGFR3 mutations and chromosome 9 alterations does not exist in pTa tumors. Obviously, alterations of chromosome 9 precede FGFR3 mutations in pTa tumors. This is underlined by the fact that losses on chromosome 9 occur earlier than FGFR3 mutations in hyperplasias [28].
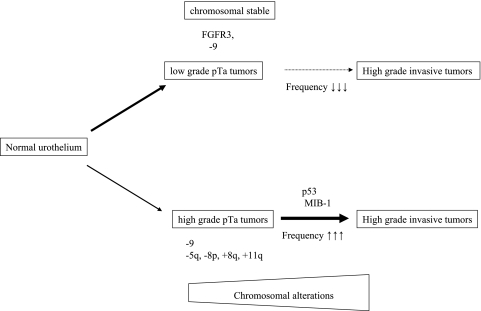
The results of our study underline that different pathways of bladder cancer pathobiology exist with different genetic alterations. This hypothesis was described by van Rhijn et al. and Bakkar et al. [17,29,30]. The authors investigated FGFR3 mutations and expression of several markers correlated with invasive tumors, such as p53, MIB-1, or p27. They found that overexpression of p53 and MIB-1 is very rare in tumors with FGFR3 mutations. The presence of p53 and FGFR3 mutations is mutually exclusive in bladder tumors. Furthermore, the combination of FGFR3 mutation and proliferation index (MIB-1) gives the base of a molecular grading which correlates with clinical course and outcome. From these studies and from the results of the present investigation, two distinct pathways of bladder cancer development can be hypothesized (Figure 6). The first more frequent group of tumors has FGFR3 mutations, has no alterations in p53, and has low proliferation. These papillary tumors have low malignancy and possess a low recurrence rate and, if at all, only a minimal progression risk. The second group consists of highly malignant solid and papillary tumors without FGFR3 mutations, but frequent p53 alterations and high proliferation index. These tumors frequently recur and have a considerable progression risk. Our results clearly support this hypothesis. In addition to the described features, the second pathway is characterized by genetic instability on the chromosome level and by specific chromosomal alterations, such as gain of 8q, amplification on 11q, and loss of 5q. Furthermore, specific molecular expression signatures for progressive and nonprogressive pTa/pT1 tumors were identified by Dyrskjot et al. [31]. They suggested that it would be possible to identify patients with high risk of disease progression at an early stage of disease. Combination of expression analysis and genome analysis, such as CGH or Array-CGH, will improve the detection of altered genes in bladder cancer [32,33].
Figure 6.
Scheme of different pathways in bladder cancer development.
The identification of molecular markers and the combined use for a molecular grading will be helpful in the future to predict the prognosis of bladder cancer patients at time of first diagnosis and to select a specific therapy at an early time point. Furthermore, the reproducibility of molecular markers is superior to that of classical parameters such as stage and grade. Because most studies on molecular markers, such as FGFR3, p53, or specific chromosomal markers, were performed on retrospective material, prospective studies are required to evaluate the clinical relevance.
In conclusion, we have shown that FGFR3 represents a valuable prognostic marker of tumors with low malignant potential and that it can be used as a surrogate marker for the detection of genetically stable bladder tumors.
Abbreviations
- CGH
comparative genomic hybridization
- FGFR3
fibroblast growth factor receptor 3
- PCR
polymerase chain reaction
References
- 1.Parkin DM, Bray F, Ferlay J, Pisani P. Global cancer statistics, 2002. CA Cancer J Clin. 2005;55:74–108. doi: 10.3322/canjclin.55.2.74. [DOI] [PubMed] [Google Scholar]
- 2.Naski MC, Wang Q, Xu J, Ornitz DM. Graded activation of fibroblast growth factor receptor 3 by mutations causing achondroplasia and thanatophoric dysplasia. Nat Genet. 1996;13:233–237. doi: 10.1038/ng0696-233. [DOI] [PubMed] [Google Scholar]
- 3.Wilcox WR, Tavormina PL, Krakow D, Kitoh H, Lachman RS, Wasmuth JJ, Thompson LM, Rimoin DL. Molecular, radiologic, and histopathologic correlations in thanatophoric dysplasia. Am J Med Genet. 1998;78:274–281. doi: 10.1002/(sici)1096-8628(19980707)78:3<274::aid-ajmg14>3.0.co;2-c. [DOI] [PubMed] [Google Scholar]
- 4.Cappellen D, De Oliveira C, Ricol D, de Medina S, Bourdin J, Sastre-Garau X, Chopin D, Thiery JP, Radvanyi F. Frequent activating mutations of FGFR3 in human bladder and cervix carcinomas. Nat Genet. 1999;23:18–20. doi: 10.1038/12615. [DOI] [PubMed] [Google Scholar]
- 5.van Rhijn BW, Lurkin I, Radvanyi F, Kirkels WJ, van der Kwast TH, Zwarthoff EC. The fibroblast growth factor receptor 3 (FGFR3) mutation is a strong indicator of superficial bladder cancer with low recurrence rate. Cancer Res. 2001;61:1265–1268. [PubMed] [Google Scholar]
- 6.Billerey C, Chopin D, Aubriot-Lorton MH, Ricol D, Gil Diez de Medina S, Van Rhijn B, Bralet MP, Lefrere-Belda MA, Lahaye JB, Abbou CC, et al. Frequent FGFR3 mutations in papillary non-invasive bladder (pTa) tumors. Am J Pathol. 2001;158:1955–1959. doi: 10.1016/S0002-9440(10)64665-2. [DOI] [PMC free article] [PubMed] [Google Scholar]
- 7.Hernandez S, Lopez-Knowles E, Lloreta J, Kogevinas M, Amoros A, Tardon A, Carrato A, Serra C, Malats N, Real FX. Prospective study of FGFR3 mutations as a prognostic factor in nonmuscle invasive urothelial bladder carcinomas. J Clin Oncol. 2006;24:3664–3671. doi: 10.1200/JCO.2005.05.1771. [DOI] [PubMed] [Google Scholar]
- 8.Wu XR. Urothelial tumorigenesis: a tale of divergent pathways. Nat Rev Cancer. 2005;5:713–725. doi: 10.1038/nrc1697. [DOI] [PubMed] [Google Scholar]
- 9.Spruck CHIII, Ohneseit PF, Gonzalez-Zulueta M, Esrig D, Miyao N, Tsai YC, Lerner SP, Schmutte C, Yang AS, Cote R, et al. Two molecular pathways to transitional cell carcinoma of the bladder. Cancer Res. 1994;54:784–788. [PubMed] [Google Scholar]
- 10.Hartmann A, Schlake G, Zaak D, Hungerhuber E, Hofstetter A, Hofstaedter F, Knuechel R. Occurrence of chromosome 9 and p53 alterations in multifocal dysplasia and carcinoma in situ of human urinary bladder. Cancer Res. 2002;62:809–818. [PubMed] [Google Scholar]
- 11.van Oers JM, Lurkin I, van Exsel AJ, Nijsen Y, van Rhijn BW, van der Aa MN, Zwarthoff EC. A simple and fast method for the simultaneous detection of nine fibroblast growth factor receptor 3 mutations in bladder cancer and voided urine. Clin Cancer Res. 2005;11:7743–7748. doi: 10.1158/1078-0432.CCR-05-1045. [DOI] [PubMed] [Google Scholar]
- 12.Telenius H, Carter NP, Bebb CE, Nordenskjold M, Ponder BA, Tunnacliffe A. Degenerate oligonucleotide-primed PCR: general amplification of target DNA by a single degenerate primer. Genomics. 1992;13:718–725. doi: 10.1016/0888-7543(92)90147-k. [DOI] [PubMed] [Google Scholar]
- 13.Chudoba IHT, Senger G, Claussen U, Haas OA. Comparative genomic hybridization using DOP-PCR amplified DNA from a small number of nuclei. Cs Pediatr. 1997;52:519–521. [Google Scholar]
- 14.Mitra AP, Datar RH, Cote RJ. Molecular staging of bladder cancer. BJU Int. 2005;96:7–12. doi: 10.1111/j.1464-410X.2005.05557.x. [DOI] [PubMed] [Google Scholar]
- 15.Shariat SF, Tokunaga H, Zhou J, Kim J, Ayala GE, Benedict WF, Lerner SP. p53, p21, pRB, and p16 expression predict clinical outcome in cystectomy with bladder cancer. J Clin Oncol. 2004;22:1014–1024. doi: 10.1200/JCO.2004.03.118. [DOI] [PubMed] [Google Scholar]
- 16.Schoenberg M. Biomarkers for transitional cell carcinoma-con. Urology. 2001;57:849–851. doi: 10.1016/s0090-4295(01)00975-x. [DOI] [PubMed] [Google Scholar]
- 17.van Rhijn BW, Vis AN, van der Kwast TH, Kirkels WJ, Radvanyi F, Ooms EC, Chopin DK, Boeve ER, Jobsis AC, Zwarthoff EC. Molecular grading of urothelial cell carcinoma with fibroblast growth factor receptor 3 and MIB-1 is superior to pathologic grade for the prediction of clinical outcome. J Clin Oncol. 2003;21:1912–1921. doi: 10.1200/JCO.2003.05.073. [DOI] [PubMed] [Google Scholar]
- 18.Kram A, Li L, Zhang RD, Yoon DS, Ro JY, Johnston D, Grossman HB, Scherer S, Czerniak B. Mapping and genome sequence analysis of chromosome 5 regions involved in bladder cancer progression. Lab Invest. 2001;81:1039–1048. doi: 10.1038/labinvest.3780315. [DOI] [PubMed] [Google Scholar]
- 19.von Knobloch R, Bugert P, Jauch A, Kalble T, Kovacs G. Allelic changes at multiple regions of chromosome 5 are associated with progression of urinary bladder cancer. J Pathol. 2000;190:163–168. doi: 10.1002/(SICI)1096-9896(200002)190:2<163::AID-PATH509>3.0.CO;2-0. [DOI] [PubMed] [Google Scholar]
- 20.Tomovska S, Richter J, Suess K, Wagner U, Rozenblum E, Gasser TC, Moch H, Mihatsch MJ, Sauter G, Schraml P. Molecular cytogenetic alterations associated with rapid tumor cell proliferation in advanced urinary bladder cancer. Int J Oncol. 2001;18:1239–1244. doi: 10.3892/ijo.18.6.1239. [DOI] [PubMed] [Google Scholar]
- 21.Simon R, Burger H, Semjonow A, Hertle L, Terpe HJ, Bocker W. Patterns of chromosomal imbalances in muscle invasive bladder cancer [in process citation] Int J Oncol. 2000;17:1025–1029. doi: 10.3892/ijo.17.5.1025. [DOI] [PubMed] [Google Scholar]
- 22.Richter J, Beffa L, Wagner U, Schraml P, Gasser TC, Moch H, Mihatsch MJ, Sauter G. Patterns of chromosomal imbalances in advanced urinary bladder cancer detected by comparative genomic hybridization. Am J Pathol. 1998;153:1615–1621. doi: 10.1016/S0002-9440(10)65750-1. [DOI] [PMC free article] [PubMed] [Google Scholar]
- 23.Stoehr R, Wissmann C, Suzuki H, Knuechel R, Krieg RC, Klopocki E, Dahl E, Wild P, Blaszyk H, Sauter G, et al. Deletions of chromosome 8p and loss of sFRP1 expression are progression markers of papillary bladder cancer. Lab Invest. 2004;84:465–478. doi: 10.1038/labinvest.3700068. [DOI] [PubMed] [Google Scholar]
- 24.Prat E, Bernues M, Caballin MR, Egozcue J, Gelabert A, Miro R. Detection of chromosomal imbalances in papillary bladder tumors by comparative genomic hybridization. Urology. 2001;57:986–992. doi: 10.1016/s0090-4295(01)00909-8. [DOI] [PubMed] [Google Scholar]
- 25.Toncheva D, Zaharieva B. Coexistence of copy number changes of different genes (INK4A, erbB-1, erbB-2, CMYC, CCND1 and ZNF217) in urothelial tumors. Tumour Biol. 2005;26:88–93. doi: 10.1159/000085815. [DOI] [PubMed] [Google Scholar]
- 26.Zaharieva BM, Simon R, Diener PA, Ackermann D, Maurer R, Alund G, Knonagel H, Rist M, Wilber K, Hering F, et al. High-throughput tissue microarray analysis of 11q13 gene amplification (CCND1, FGF3, FGF4, EMS1) in urinary bladder cancer. J Pathol. 2003;201:603–608. doi: 10.1002/path.1481. [DOI] [PubMed] [Google Scholar]
- 27.Richter J, Jiang F, Gorog JP, Sartorius G, Egenter C, Gasser TC, Moch H, Mihatsch MJ, Sauter G. Marked genetic differences between stage pTa and stage pT1 papillary bladder cancer detected by comparative genomic hybridization. Cancer Res. 1997;57:2860–2864. [PubMed] [Google Scholar]
- 28.van Oers JM, Adam C, Denzinger S, Stoehr R, Bertz S, Zaak D, Stief C, Hofstaedter F, Zwarthoff EC, van der Kwast TH, et al. Chromosome 9 deletions are more frequent than FGFR3 mutations in flat urothelial hyperplasias of the bladder. Int J Cancer. 2006;119:1212–1215. doi: 10.1002/ijc.21958. [DOI] [PubMed] [Google Scholar]
- 29.Bakkar AA, Wallerand H, Radvanyi F, Lahaye JB, Pissard S, Lecerf L, Kouyoumdjian JC, Abbou CC, Pairon JC, Jaurand MC, et al. FGFR3 and TP53 gene mutations define two distinct pathways in urothelial cell carcinoma of the bladder. Cancer Res. 2003;63:8108–8112. [PubMed] [Google Scholar]
- 30.van Rhijn BW, van der Kwast TH, Vis AN, Kirkels WJ, Boeve ER, Jobsis AC, Zwarthoff EC. FGFR3 and P53 characterize alternative genetic pathways in the pathogenesis of urothelial cell carcinoma. Cancer Res. 2004;64:1911–1914. doi: 10.1158/0008-5472.can-03-2421. [DOI] [PubMed] [Google Scholar]
- 31.Dyrskjot L, Zieger K, Kruhoffer M, Thykjaer T, Jensen JL, Primdahl H, Aziz N, Marcussen N, Moller K, Orntoft TF. A molecular signature in superficial bladder carcinoma predicts clinical outcome. Clin Cancer Res. 2005;11:4029–4036. doi: 10.1158/1078-0432.CCR-04-2095. [DOI] [PubMed] [Google Scholar]
- 32.Wu Z, Siadaty MS, Riddick G, Frierson HF, Jr, Lee JK, Golden W, Knuutila S, Hampton GM, El-Rifai W, Theodorescu D. A novel method for gene expression mapping of metastatic competence in human bladder cancer. Neoplasia. 2006;8:181–189. doi: 10.1593/neo.05727. [DOI] [PMC free article] [PubMed] [Google Scholar]
- 33.Bashyam MD, Bair R, Kim YH, Wang P, Hernandez-Boussard T, Karikari CA, Tibshirani R, Maitra A, Pollack JR. Array-based comparative genomic hybridization identifies localized DNA amplifications and homozygous deletions in pancreatic cancer. Neoplasia. 2005;7:556–562. doi: 10.1593/neo.04586. [DOI] [PMC free article] [PubMed] [Google Scholar]


