

Abstract
Functional magnetic resonance imaging (fMRI) studies of the medial temporal lobe have primarily made use of the blood oxygenation level dependent (BOLD) response to neural activity. The interpretation of the BOLD signal as a measure of medial temporal lobe function can be complicated, however, by changes in the cerebrovascular system that can occur with both normal aging and age-related diseases, such as Alzheimer's disease. Quantitative measures of the functional cerebral blood flow (CBF) response offer a useful complement to BOLD measures, and have been shown to aid in the interpretation of fMRI studies. Despite these potential advantages, the application of ASL to fMRI studies of cognitive tasks and at-risk populations has been limited. In this study, we demonstrate the application of ASL fMRI to obtain measures of the CBF and BOLD responses to the encoding of natural scenes in healthy young (mean 25 years) and elderly (mean 74 years) adults. The percent CBF increase in the medial temporal lobe was significantly higher in the older adults, whereas the CBF levels during baseline and task conditions and during a separate resting-state scan were significantly lower in the older group. The older adults also showed slightly higher values for the BOLD response amplitude and the absolute change in CBF, but the age group differences were not significant. The percent CBF and BOLD responses are consistent with an age-related increase in the cerebral metabolic rate of oxygen metabolism (CMRO2) response to memory encoding.
Introduction
The non-invasive nature and relatively high temporal and spatial resolution of blood oxygenation level dependent (BOLD) functional magnetic resonance imaging (fMRI) have made it an essential tool for studies of the working human brain. Most fMRI studies treat the BOLD response as an indirect qualitative measure of neural activity and interpret differences in the BOLD signal as a reflection of differences in neural activity. However, differences in the BOLD response may also reflect variations in the cerebrovascular system, such as age-related reductions in vascular compliance or shifts in baseline cerebral blood flow (CBF) due to medication or disease (D'Esposito et al. 2003; Iadecola 2004). With the increasing application of fMRI to examine the cognitive effects of medical treatment, disease, and age, there is an increasing need for quantitative measures that can be used to more robustly assess brain function across populations and treatment conditions.
Arterial spin labeling (ASL) is a non-invasive MRI method for the quantitative measurement of CBF. Quantitative measures of functional CBF responses are potentially a more accurate reflection of neural activity than BOLD measures because they describe the response of a well-defined physiological quantity to neural stimulus. For example, the findings of one ASL study suggest that the relation between CBF changes and neural activity may be more linear than the relation between BOLD and neural activity (Miller et al. 2001). Other studies have shown that CBF measures exhibit lower inter-subject variability as compared to BOLD (Aguirre et al. 2002; Wang et al. 2003; Tjandra et al. 2005) and may provide better localization of the sites of neural activity (Luh et al. 2000; Kim and Duong 2002). It has also been found that increases in baseline CBF caused by the administration of vasodilatory agents, such as carbon dioxide and acetazolamide, significantly decrease the amplitude of the BOLD response but have a much smaller effect on the functional CBF response (Brown et al. 2003; Stefanovic et al. 2005b). Finally, when combined with BOLD measures and a hypercapnic challenge, ASL measures of CBF can be used to derive estimates of functional changes in the cerebral metabolic rate of oxygen (CMRO2), which has been shown in animal studies to be correlated with functional changes in neuronal activity (Davis et al. 1998; Hyder 2004).
Despite its potential benefits, the application of ASL in fMRI studies has been mainly limited to studies investigating the fundamental mechanisms of the fMRI response in the primary motor and visual cortices. Only a handful of studies have used ASL to examine cognitive processes, with most of the studies coming from research groups involved in the technical development of ASL methods (Ye et al. 1998; Ye et al. 2000; Yee et al. 2000; Garraux et al. 2005; Kemeny et al. 2005; Mildner et al. 2005; Wang et al. 2005; Yang et al. 2005; Kim et al. 2006; Olson et al. 2006). These studies have primarily focused on demonstrating the feasibility of ASL for cognitive studies in young healthy volunteers, as opposed to the application of ASL to studies of cognitive processes in at-risk populations.
One of the factors impeding the routine use of ASL in fMRI studies of cognitive processes has been the relatively low sensitivity of the method as compared to BOLD. Sensitivity is critical because cognitive activations tend to be less robust and more variable than sensory activations, especially in diseased or older subjects who may exhibit decreased levels of activation or higher levels of noise (D'Esposito et al. 2003). The low inherent sensitivity of ASL methods reflects the fact that the CBF signal is only a small fraction (on the order of 0.3% for typical ASL parameters) of the overall magnetic resonance signal from tissue (Buxton 2002). Furthermore, because CBF images obtained with ASL are based on the difference between tag and control images, small fluctuations between these images due to subject tremor, physiological pulsations, and MRI system instabilities can introduce significant noise into the ASL signal. Methods for reducing physiological noise contributions in ASL measures have been shown to be critical for obtaining robust measures of functional CBF responses to cognitive tasks (Ye et al. 2000; Restom et al. 2006b).
In this study, we used a quantitative ASL approach in conjunction with physiological noise reduction methods to obtain measures of functional CBF and BOLD responses in the medial temporal lobe to a memory-encoding task. Two preliminary studies have previously demonstrated the feasibility of using ASL to measure the functional perfusion response to memory encoding in healthy young subjects (Liu et al. 2001; Fernandez-Seara et al. 2006). Here we extend the prior work by characterizing and comparing the CBF and BOLD responses to memory encoding in both healthy young and elderly subjects. A preliminary version of this work was reported in (Restom et al. 2006a).
Methods
Participants
Fifteen healthy young (8 women, mean age 25 ± 3.47) and twelve healthy elderly (7 women, mean age 74.9 ± 5.9) subjects participated in the study. The study was approved by the institutional review board at the University of California San Diego, and written informed consent was obtained from all participants. Participants were selected without regard to ethnicity or race. Based on neurological and neuropsychological exams (Mini-Mental State Exam, Clinical Dementia Rating Scale, Mattis Dementia Rating Scale (Mattis 1988)), none of the elderly subjects demonstrated cognitive impairment. Individuals with a reported history of substance abuse, neurological illness, or psychiatric disorders were excluded from the study. The two age groups did not significantly differ on education (p = .69) or on gender distribution (χ2=.09, p=.77).
Experimental Protocol
Each imaging session involved a picture-encoding task consisting of the presentation of novel and familiar landscape images (Stern et al. 1996). During the acquisition of a localizer and a high-resolution anatomical scan (prior to the functional scanning), participants viewed four landscape scenes (two with horizontal and two with vertical aspect ratio) for approximately 10 minutes. These images served as the familiar images. During the functional scanning session, images were displayed in a blocked design with alternate blocks consisting of either 10 familiar images (consisting of a pseudo-random sequence of the 4 familiar landscape scenes, with no familiar scene occurring twice in a row) or 10 novel images. Each image was displayed for a 2 sec duration with a 0.5 sec interval between images. Five blocks of novel and five blocks of familiar scenes were presented per run (250 sec) with three runs per subject. Participants were asked to decide whether each image had a horizontal or vertical aspect ratio and to indicate their choice with a two-button response box. Responses were monitored and recorded to ensure compliance.
Imaging
Imaging was performed on a 3T GE Excite system with a body transmit coil and an 8-channel receive-only array. High-resolution structural scans were acquired with a magnetization prepared 3D fast spoiled gradient acquisition in the steady state (FSPGR) sequence (172 sagittal slices, 1mm slice thickness, TI 450ms, TR 7.9ms, TE 3.1ms, 12 degree flip angle, FOV 25cm, matrix 256×256).
Simultaneous perfusion and BOLD data were acquired with a PICORE QUIPSS 2 arterial spin labeling (ASL) sequence with a dual-echo spiral readout (Wong et al. 1998). Imaging parameters were: TR=3s, TI1/TI2=700/1400ms, tag thickness 200mm, tag to proximal slice gap 10 mm, TE1=2.8ms, TE2=24 ms, flip angle 90, FOV 240mm, 64×64 matrix, repetitions=84. Five 6mm oblique axial slices aligned with the hippocampus were acquired. One resting state ( 4 minute duration) and three functional scans were acquired. In addition, a cerebral spinal fluid (CSF) reference scan was acquired for use in quantifying CBF. The CSF scan consisted of a single-echo, single repetition scan acquired at full relaxation and echo time equal to 2.8 ms. The CSF scan was acquired using the same in-plane parameters as the ASL scan, but the number of slices was increased to cover the lateral ventricles.
Physiological Data
Cardiac pulse and respiratory effort data were monitored using a pulse oximeter (InVivo) and a respiratory effort transducer (BIOPAC), respectively. The pulse oximeter was placed on the subject's right index finger. The respiratory effort belt was placed around the subject's abdomen. Physiological data were sampled at 40 samples per second using a multi-channel data acquisition board (National Instruments). In addition to the physiological data, scanner TTL pulse data (10 ms duration, 5 volt pulse per slice acquisition) were recorded at 1 kHz. The TTL pulse data were used to synchronize the physiological data to the acquired images. Cardiac, respiratory and TTL data were used to calculate the physiological noise regressors as described in (Glover et al. 2000; Restom et al. 2006b).
Definition of Anatomical ROI
The anatomical volume was registered to the functional volume using an in-house Matlab program that utilizes the scanner coordinates of each volume. The accuracy of this registration program was verified on a phantom using high resolution interleaved spiral images obtained with the same spiral pulse sequence used for the functional studies. A medial temporal lobe (MTL) region of interest (ROI) was delineated for each subject, consisting of the bilateral hippocampus and parahippocampus. The hippocampus was delineated using an automatic subcortical segmentation program (Freesurfer ASEG) applied to the anatomical image (Fischl et al. 2002). The parahippocampus was delineated using a MATLAB-based region-growing algorithm. Starting from seed voxels within the right and left hippocampi (identified using ASEG), this algorithm identifies cortical gray matter voxels within the gyrus located inferior to each hippocampus. All subsequent analysis was restricted to the MTL ROI, defined as the combination of the hippocampal and parahippocampal structures. All ROIs were visually inspected to ensure accurate delineation. To examine spatial differences in resting-state CBF, the MTL ROI was further divided into 4 sub-regions (left and right hippocampus; left and right parahippocampus) and the resting-state CBF was computed for each sub-region. All ROIs were down-sampled to the resolution of the functional data using AFNI software (Cox 1996).
Preprocessing and General Linear Model Analysis
The first four images of each ASL scan were excluded from data analysis to allow the MRI signal to reach steady state. All functional runs were motion corrected and registered to the first functional run using AFNI software (Cox 1996). Data from two of the older subjects was excluded from further analysis due to excessive motion induced by coughing during the scans. The mean age of the remaining 10 older subjects was 74.3 ± 6.1 (6 women).
Statistical analysis of the functional data was performed using a general linear model (GLM) approach for the analysis of ASL data (Mumford et al. 2006; Restom et al. 2006b). The data from the two echoes were analyzed separately, with the first and second echo data used to analyze CBF and BOLD activity, respectively. The stimulus-related regressor in the GLM was obtained by convolving the block design stimulus pattern with a gamma density function of the form h(t) = (τn!)−1((t − Δt)/τ)n exp(−(t − Δt)/τ) for t ≥ Δt and 0 otherwise, with τ = 1.2, n = 3, and Δt = 1 (Boynton et al. 1996). The measured cardiac and respiratory fluctuation data were included in the GLM as regressors to model the physiological modulation of the ASL signal. In addition, a constant and a linear term were included as nuisance regressors. Pre-whitening was performed using an autoregressive AR(1) model (Burock and Dale 2000; Woolrich et al. 2001). As described in (Restom et al. 2006b), the data from the three functional runs were concatenated for the GLM analysis, with different physiological and nuisance regressors for each run.
Clusters of voxels exhibiting CBF and BOLD activation within the MTL ROI were detected using an overall significance threshold of P= 0.05 applied to the first and second echo data, respectively. Correction for multiple comparisons was performed using the AFNI AlphaSim program (Forman et al. 1995; Cox 1996; Xiong et al. 2005). In addition, for inclusion in further analysis, we required that at least one voxel in each activated CBF cluster be contiguous with one voxel in a neighboring activated BOLD cluster. Note that with this criteria, included clusters could be contiguous, partially overlapping, or fully overlapping. The use of this constraint is consistent with the observations of a prior study showing that activated CBF and BOLD voxels are typically found in neighboring spatial regions, with active CBF voxels located primarily on the arterial side of the vasculature and active BOLD voxels arising primarily from the venous side (Luh et al. 2000). The application of the inclusion criteria resulted in an average of one to two CBF/BOLD clusters in each of the four subregions of the MTL (i.e. left and right hippocampus; left and right parahippocampus).
CBF and BOLD Time Series
For each voxel, the physiological noise components estimated with the GLM were removed from the measured data to form corrected first and second echo time series. From these noise-corrected time-series, CBF time-series were computed by taking the running subtraction of the control and tag image series from the first echo data (TE = 2.8 ms), while BOLD-weighted time series were computed from the running average (average of each image with the mean of its two nearest neighbors) of the second echo (TE = 24ms) (Liu and Wong 2005). In addition, the running average of the first echo data was computed for use in the estimation of changes (described below).
The CBF time-series were converted to physiological units (ml/(100g-min)) using the CSF image as a reference signal (Chalela et al. 2000). We used the approach described in (Johnson et al. 2005) to correct the CBF measures for partial volume effects. This approach assumes that CSF has zero CBF and that gray matter CBF is 2.5 times higher than white matter CBF. The CBF value corrected for partial voluming (CBFcorr) is then calculated voxelwise according to the following formula: CBFcorr = CBFuncorr /(GM + 0.4 ·WM), where GM and WM are gray and white matter partial volume fractions, respectively. We used the high-resolution anatomical image and the FSL Automated Segmentation Tool (FAST) to estimate partial volume fractions (Smith et al. 2004). To examine how uncertainties in the partial volume correction might affect the conclusions of our study, we also computed two alternate sets of CBF estimates. For the first alternate set of estimates, we assumed that the measured CBF reflected only gray matter perfusion, so that the corrected value was CBFcorr = CBFuncorr /GM. For the second set of estimates, no partial volume correction was used, so that CBFcorr = CBFuncorr.
For each subject, average CBF and BOLD time courses were obtained by averaging the individual time courses over activated CBF and BOLD voxels, respectively, and over task cycles. The average CBF time series in physiological units of ml/(100g-min) is referred to as the absolute CBF response. Percent change CBF and BOLD responses were calculated by normalizing each time course to its baseline, and are referred to as %ΔCBF and %ΔBOLD responses, respectively. The baseline values were calculated by fitting the responses to a model consisting of a constant baseline term and one cycle of the stimulus-related regressor. The absolute change in CBF from its baseline (in units of ml/(100g-min)) is referred to as the ΔCBF response. In addition to these functional responses, a mean resting-state MTL CBF value was calculated for each subject by averaging the CBF time series from the resting state run across all time points and voxels within the MTL ROI (i.e. not limited to functionally activated voxels).
As an additional measure of the BOLD response, we calculated the stimulus-related change in the apparent transverse relaxation rate . For each subject, we used the first and second echo data to calculate , where ΔTE is the difference in echo times, and Se1(t) and Se2(t) are the running averages of the first and second echo data (after noise reduction), respectively, averaged across activated BOLD voxels and task cycles. The -based percent BOLD change was then computed as , where is the change in and TE2 is the echo-time of the second echo.
We defined the mean amplitude of each functional response (e.g. %ΔBOLD, , %Δ CBF, ΔCBF, and absolute CBF) as the mean of the response from the four time points spanning the range 15 to 24 seconds (see brown bar in Figure 1a). We also calculated the mean amplitude of the post-stimulus %ΔCBF response as the average of the response from the three time points spanning 41−47 seconds. Differences in mean amplitudes between groups were assessed with an independent samples two-tailed t-test, and results were taken to be significant for p<0.05. In addition, we assessed group differences in the baseline values of the absolute CBF response and in the resting-state CBF values (averaged over the MTL). Effect sizes are reported as Cohen's d (Olejnik and Algina 2000).
Figure 1.

Young and elderly group mean functional responses for (a) %ΔBOLD, (b) , (c) %ΔCBF, (d) ΔCBF, and (e) absolute CBF. Green bar in (a) denotes novel picture encoding period, while the brown bar indicates the time points included in the calculation of the average values reported in Table 1. Panel (f) shows a bar graph of the mean MTL resting-state CBF for each group. Error bars indicate ± one standard error.
Exploratory Analysis: Estimation of CMRO2 Changes
To assess the effect of age on the functional cerebral metabolic rate of oxygen (CMRO2) response to memory encoding, we made use of a mathematical model that describes the BOLD signal change as a function of changes in CBF and CMRO2 (Davis et al. 1998). As described in the Appendix, we used the mean CBF and BOLD response amplitudes and the framework of the Davis model to estimate the relation between the normalized CMRO2 response of the old subjects, mold, to the normalized response of the young subjects, myoung, where m = CMRO2/CMRO2,0 denotes the CMRO2 level during the task condition (novel pictures) normalized by the baseline value CMRO2,0. From these normalized responses, we also derived estimates of the percent change %ΔCMRO2 = 100·(m − 1) responses in the two groups and of the ratio between the absolute levels of CMRO2 in the old and young groups during the task condition.
Results
Figure 1 shows average young and elderly functional responses for (a) %ΔBOLD, (b) , (c) %ΔCBF, (d) ΔCBF, and (e) absolute CBF. In addition, a bar graph showing the mean resting-state CBF values is shown in Figure 1(f). Mean signal values and statistical measures are summarized in Table 1. Although there was not a significant difference (p =0.12) in the mean amplitudes of the %ΔBOLD responses between groups, the %ΔCBF amplitude was significantly (p < 0.05) greater in the older subjects as compared to the young subjects. The mean ΔCBF amplitude was slightly higher in the older subjects, but the difference was not significant (p = 0.09). The post-stimulus %ΔCBF response was significantly greater (i.e. more negative) in the older subjects compared to the younger subjects. Both the baseline value of the absolute CBF response and the resting-state CBF were significantly lower in the older subjects. In addition, the absolute CBF level during the task condition (novel pictures) was significantly lower in the older subjects. When analyzed by sub-regions, resting-state CBF was found to be significantly lower in the older subjects for all sub-regions except for the left hippocampus where the difference was nearly significant (p=0.06). The alternate estimates of CBF obtained by either assuming that only gray matter contributed to the perfusion measure or omitting partial volume correction resulted in slight increases and decreases, respectively, in the CBF values of both groups. However, differences that were found to be significant with the standard estimates were also found to be significant with both sets of alternate estimates.
Table 1.
Young (N = 15) and old (N = 10) group averages (± one standard error) and group statistics for: resting-state CBF in the MTL, %ΔCBF, ΔCBF, absolute CBF during novel and familiar images, %ΔBOLD, and responses to activation, and post-stimulus %ΔCBF response.
|
Signal |
Young |
Old |
p |
t |
d |
|---|---|---|---|---|---|
| Resting-State CBF (ml/100g/min) | 57.1±1.8 | 44.3±3.8 | 0.0027 | 3.36 | 1.37 |
| %Δ CBF | 42.9±4.8 | 94.6±20.2 | 0.0067 | −2.98 | 1.22 |
| ΔCBF (ml/100g/min) | 20.4±1.1 | 24.9±2.7 | 0.095 | −1.74 | 0.71 |
| CBF (novel pictures) (ml/100g/min) | 71.2±2.8 | 59.6±2.9 | 0.011 | 2.75 | 1.12 |
| CBF (familiar pictures) (ml/100g/min) | 50.1±3.1 | 28.3±4.2 | 0.00027 | 4.29 | 1.75 |
| %ΔBOLD | 0.45±0.03 | 0.56±0.06 | 0.120 | −1.61 | 0.66 |
| 0.50±0.04 | 0.57±0.07 | 0.30 | −1.06 | 0.43 | |
| Post-stimulus %ΔCBF response | −1.97±0.85 | −17.7±6.87 | 0.010 | 2.78 | 1.14 |
There was not a significant difference (p = 0.3) between groups in the amplitudes of the response. The response amplitudes were slightly higher than the %ΔBOLD response amplitudes, but the difference was not significant for either the young (p =0.38, t = 0.89; d= 0.33) or the older subjects ( p = 0.9, t = 0.16; d = 0.07). Recent work suggests that the lower %ΔBOLD amplitudes may reflect signal decreases due to displacement of static tissue by functional increases in cerebral blood volume (Woolrich et al. 2006). The measures are relatively insensitive to these signal decreases because they are based on the ratio of the dual echo data.
As discussed in the Methods section and Appendix, we used the mean signal values reported in Table 1 to form estimates of task-related changes in CMRO2. Figure 2a shows %ΔCMRO2 response amplitudes for young subjects (blue dashed line), older subjects (red dash-dot) with the assumption of a constant oxygen extraction fraction across age, and older subjects (green solid) with the assumption of a 0.35% increase per year in the oxygen extraction fraction. The response amplitudes are plotted versus a range of assumed CBF/CMRO2 coupling factors for the young subjects. The young response is calculated using Eqn A6 with the assumed coupling factors and the mean young %ΔCBF amplitude from Table 1, while the older responses are calculated using Eqn A4 with the mean %ΔCBF and %ΔBOLD amplitudes from the older subjects. The young %ΔCMRO2 response varies from 21% to 14% while the older normalized responses vary from 49% to 36% and from 52% to 42% for constant or age-varying oxygen extraction fraction, respectively. From Equation A7, the estimated baseline CMRO2 levels in the older subjects are 65% and 76% of the level in the young subjects. Figure 2b shows the estimated ratio of the older to young CMRO2 levels during the task condition as a function of the coupling factor in the young subjects (see Equation A8). These ratios range from 0.80 to 0.78 and from 0.96 to 0.95 for the constant (red dash-dot) or age-varying (green solid) oxygen extraction fraction, respectively.
Figure 2.
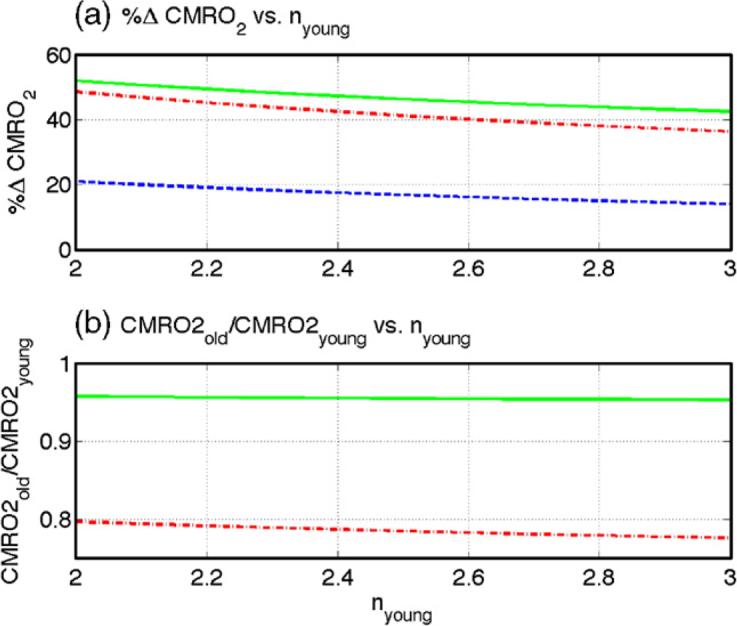
Estimates of age-related CMRO2 changes for assumed nyoung values between 2 and 3. (a) %ΔCMRO2 response amplitudes for young subjects (blue dashed), old subjects with the assumption of a constant oxygen extraction fraction across age (red dash-dot), and old subjects with the assumption of a 0.35% increase per year in the oxygen extraction fraction (green solid). (b) Estimates of the ratio of the old to young CMRO2 levels during the task condition as a function of the coupling factor in the young subjects with the assumption of constant (red dash-dot) or age varying (green solid) oxygen extraction fraction (see Equation A8).
Discussion
Older subjects demonstrated both a significantly higher %ΔCBF response amplitude and slightly higher (but not significantly different) ΔCBF response as compared to the younger subjects. Absolute CBF levels during both the baseline (familiar images) and task (novel images) conditions were significantly lower in the older group. The greater %ΔCBF amplitude in the older subjects therefore reflects the lower baseline level of the CBF response, rather than an age-related increase in ΔCBF. The lower CBF levels during the baseline condition were consistent with a significant age-related decrease in resting-state CBF. Older subjects showed slightly higher %ΔBOLD and response amplitudes, but the results were not significant.
The relative increases in the BOLD responses with age (15 to 23% higher for and %ΔBOLD, respectively) were much lower than the relative increase (120%) observed in the %ΔCBF responses. As mentioned above, the responses are likely to be less biased by cerebral blood volume effects (Woolrich et al. 2006). We estimate that samples sizes of 30 young and 41 older subjects would be required to detect a significant (p<0.05) difference in the %ΔBOLD responses with a power of 0.8, with corresponding samples sizes of 70 young and 107 older subjects to detect significant differences in the responses. While a future study with a larger sample size may be able to demonstrate a difference in the BOLD responses, it is also likely to confirm the finding that the relative change in the %ΔCBF is much larger than the relative change in the BOLD response.
The observed age-related decrease in resting-state CBF is consistent with the findings of a recent ASL study (Parkes et al. 2004) and of positron emission tomography (PET) and single photon emission computed tomography (SPECT) studies reporting regionally dependent decreases in CBF with advancing age (Leenders et al. 1990; Martin et al. 1991; Marchal et al. 1992; Bentourkia et al. 2000; Matsuda et al. 2003). Although the mechanisms are not completely understood, the decreases in CBF appear to parallel decreases in resting-state oxygen and glucose metabolism (Marchal et al. 1992; Bentourkia et al. 2000; Farkas and Luiten 2001; Noda et al. 2002).
PET studies examining the effect of age on the medial temporal lobe ΔCBF response to memory encoding have reported somewhat conflicting results. In a study of intentional encoding of images of faces, (Grady et al. 1995) found an age-related decrease in the ΔCBF response in the right hippocampal gyrus. In a subsequent study examining encoding of line drawings, (Grady et al. 1999) reported similar age-related decreases in ΔCBF. However, in a study of verbal encoding (Madden et al. 1999) found evidence for a slightly higher (but not significant) medial temporal lobe ΔCBF response in older subjects. While our findings are more consistent with those of (Madden et al. 1999), a comparison of the present findings with the prior work is complicated by differences in the memory encoding paradigm and measurement techniques (i.e. PET vs. arterial spin labeling MRI).
In this study, we observed a significantly greater post-stimulus undershoot in the %ΔCBF response of the older subjects as compared to the young. The presence of this undershoot may reflect an overcompensation of the vascular system in its recovery from the significantly greater positive %ΔCBF response observed in the adults. Alternatively, the undershoot might also reflect a post-stimulus decrease in the CMRO2 response. Further studies to confirm the presence of the post-stimulus %ΔCBF undershoot and elucidate its mechanisms would be useful.
In contrast to our finding that the BOLD response was not significantly affected by age, (Park et al. 2003) reported a significant age-related decrease in the BOLD response to natural picture encoding in the left hippocampus. A key difference between the two studies is the use of a block design in the present study and an event-related design in (Park et al. 2003). Decreases in BOLD amplitude due to age-related decreases in vascular compliance are likely to be more pronounced for the short stimuli used in event-related designs as compared to the longer stimuli used for block designs (D'Esposito et al. 2003; Behzadi and Liu 2005). In addition, the use of a familiar image baseline task in the present study versus a fixation point baseline task in (Park et al. 2003) further complicates comparisons between the two studies (Stark and Squire 2001).
Most neuroimaging studies treat CBF and BOLD responses as indirect qualitative measures of neural activity, interpreting differences in CBF and BOLD signal amplitudes as differences in neural activity. The interpretation of the present study is not as straightforward, since the finding of a significantly greater %ΔCBF response in the older adults could be interpreted as evidence for an age-related increase in neural activity, whereas the lack of significant group differences in both the ΔCBF and BOLD responses suggests that there may not be a significant change in neural activity with age.
Although it is generally accepted that all of the above measures reflect neural activity, it is not known which measure is the most accurate and robust in the presence of changes in the cerebrovascular system, such as those that occur with aging. For example, a number of prior studies examining the relation between resting-state CBF and the functional CBF response have found that the ΔCBF response is relatively independent of resting-state CBF, suggesting that ΔCBF is a robust measure of neural activity (Maximilian et al. 1980; Ramsay et al. 1993; Kastrup et al. 1999; Li et al. 2000; Sicard et al. 2004), whereas other studies have found evidence suggesting that %ΔCBF is a more robust measure (Shimosegawa et al. 1995; Matsuura et al. 2000; Kemna et al. 2001). In studies using hypocapnia to lower resting-state CBF, some studies (Ramsay et al. 1993; Sicard et al. 2004) report that ΔCBF is not changed, a finding consistent with the results of the present study. However, other studies with hypocapnia find a decrease in ΔCBF with decreased resting-state CBF (Shimosegawa et al. 1995). In studies of the %ΔCBF and BOLD responses, a number of groups have shown that, in comparison to BOLD measures, %ΔCBF measures exhibit both lower inter-subject variability and greater robustness in the presence of administered vasodilatory agents (Aguirre et al. 2002; Brown et al. 2003; Wang et al. 2003; Stefanovic et al. 2005b; Tjandra et al. 2005). These studies suggest that the %ΔCBF response is more robust than the BOLD response, which exhibits a complex dependence on a number of physiological variables such as CBF, cerebral blood volume, and the cerebral metabolic rate of oxygen consumption (CMRO2) (Buxton et al. 2004). However, a variety of biochemical and biomechanical factors, such as increases in vascular stiffness and reductions in cerebrovascular reactivity, may alter the CBF response in the absence of changes in neural activity (D'Esposito et al. 2003; Riecker et al. 2003; Bakker et al. 2004; Iadecola 2004; Behzadi and Liu 2005).
In light of the ambiguities faced when interpreting the CBF and BOLD responses separately, we undertook a combined analysis of the %ΔCBF and BOLD responses. The BOLD response reflects a delicate balance between %ΔCBF and %ΔCMRO2 responses, with relative increases in %ΔCBF and %ΔCMRO2 leading to increases and decreases, respectively, in the BOLD signal amplitude (Buxton et al. 2004). If the age-related increase in %ΔCBF were not accompanied by a similar increase in %ΔCMRO2, we would expect to find an age-related increase in the amplitude of the BOLD response. Because there was not a significant age-related increase in BOLD, the results of the present study are more consistent with an age-related increase in %ΔCMRO2. As compared to measures of either CBF or BOLD responses, measures of %ΔCMRO2 are thought to be more tightly linked to neural activity, reflecting the fact that neurons necessarily expend energy to accomplish their work (Hyder 2004).
To quantitatively assess whether %ΔCMRO2 increases with age, we used a mathematical model of the BOLD signal (Davis et al. 1998). This model is the basis of the calibrated BOLD approach that uses measures of %ΔCBF and BOLD responses to both a functional stimulus and a hypercapnic challenge to obtain estimates of functional CMRO2 changes (Davis et al. 1998; Hoge et al. 1999b; Kastrup et al. 2002; St Lawrence et al. 2003; Stefanovic et al. 2005a). In this study, we did not obtain measures of the CBF and BOLD responses to hypercapnia, and thus could not directly estimate CMRO2 changes in the two groups. As an alternative, we used the model in conjunction with a number of assumptions derived from prior studies to form reasonable estimates of the CMRO2 responses. These estimates indicate that the %ΔCMRO2 response in the older subjects is roughly 2 to 3 times the %ΔCMRO2 response in the young subjects, where the variation in the estimates reflects the use of a range of assumed values for the coupling factor between CBF and CMRO2 in the younger subjects and the application of two different assumptions about the dependence of the oxygen extraction fraction on age (see Figure 2). The other main assumption that we used in estimating the relation between the %ΔCMRO2 responses is the Grubb's relation between CBV and CBF, which leads to a decrease in baseline CBV with age-related decreases in baseline CBF. The exponent used in the Grubb's relation ( α = 0.38) is fairly close to the exponent ( α = 0.5) obtained from the ideal relation between CBF and CBV when laminar flow is assumed; and the use of the ideal exponent does not affect our conclusions (Mandeville et al. 1999). The application of the Grubb's relation tends to decrease the normalized CMRO2 response in the older subjects (see Equation A4). If we were to assume a constant baseline CBV with age, we would estimate an even greater difference between the young and older CMRO2 responses.
We used the dependence of baseline CMRO2 on oxygen extraction fraction and baseline CBF (see Eqn A2) to estimate that baseline CMRO2 levels in the older subjects were 24 to 35% lower than the young levels. As shown in Figure 2b, combining these baseline estimates with our estimates of the normalized CMRO2 responses, we found that the level of CMRO2 in the older subjects during the task condition was only 4 to 22% lower than the young levels. If we had assumed that baseline CMRO2 did not decrease with age, we would have been led to the unlikely conclusion that the level of CMRO2 during the task condition was two to three times greater in the older subjects. Overall, our analysis suggests that, despite lower baseline metabolic levels, the older subjects are trying to achieve the same overall level of oxygen metabolism as the young subjects during execution of the task (i.e. curves shown in Figure 2b).
In summary, the findings of this study are consistent with a picture in which the significant age-related increases in %ΔCBF are accompanied by increases in %ΔCMRO2, leading to lack of a significant change in the BOLD response to memory encoding. These results point out the inherent difficulties of interpreting differences in the BOLD response alone. Interpreting these results within the context of (Hyder 2004), we might conclude that the higher %ΔCMRO2 in the older subjects reflects a greater percent increase in neural activity, possibly due to compensatory mechanisms in the aging brain. However, such a conclusion assumes that the coupling between %ΔCMRO2 and neural activity does not change with age. Our data also suggest that the absolute level of CMRO2 required to perform a specified function may be relatively invariant with age. Further studies using the calibrated BOLD approach and other measures of oxidative metabolism are clearly required to validate our conclusions and interpretations.
Acknowledgements
This work was supported by a grant from the Dana Foundation and by grants from the National Institutes of Health (R01 NS051661, R01 AG012674, and P50 AG05131).
Appendix
The Davis model for the BOLD signal (Davis et al. 1998) can be written as:
| (A1) |
where α and β are empirically determined exponents, TE is echo time, A is a scaling factor that depends on magnetic field strength, CBV0 is the baseline cerebral blood volume, and is the baseline venous concentration of deoxyhemoglobin. Assuming that the arterial concentration of deoxyhemoglobin is negligible, consideration of mass conservation yields (Hoge et al. 1999a). Furthermore, from the relation
| (A2) |
where CA denotes the arterial concentration of oxygen, and E is the oxygen extraction fraction, we find that (Buxton et al. 2004). Dropping constant terms (A, TE) and assuming that CA does not significantly change with age (Pantano et al. 1984), we can rewrite Eqn A1 as
| (A3) |
where f = CBF/CBF0 is CBF normalized by its baseline value, m = CMRO2/CMRO2,0 is the normalized CMRO2 response, and E0 is the baseline extraction fraction. Note that normalized CBF may be expressed in terms of %ΔCBF as f = 1+%ΔCBF/100. Taking the ratio of the old and young BOLD responses and solving for the normalized CMRO2 in the older subjects yields,
| (A4) |
Based on PET measures of the change in oxygen extraction fraction with age (Pantano et al. 1984; Leenders et al. 1990), we consider two cases: 1) baseline oxygen extraction fraction is constant with age (E0,old = E0,young), and 2) oxygen extraction fraction increases at a rate of 0.35% per year. In addition, we assume that age-related changes in baseline CBV and CBF are related according to Grubb's relation (Grubb et al. 1974), so that
| (A5) |
With these assumptions, measured percent BOLD and CBF mean amplitudes from Table 1, and values of α = 0.38 (Grubb et al. 1974) and β = 1.5 (Hoge et al. 1999a; Buxton et al. 2004), we may use Equation A4 to express mold as a function of myoung. To determine a range of values for myoung we assumed a tight coupling between changes in CBF and CMRO2 of the form
| (A6) |
with values of the coupling factor n selected from a range (2 to 3) consistent with the findings of prior studies (Hoge et al. 1999a; Kastrup et al. 2002; Stefanovic et al. 2004). We used Eqn A6 and the mean %ΔCBF amplitude for the young subjects (Table 1) to estimate a range of values for myoung and then used Eqn A4 to estimate mold. From Equation A2 we also obtain the following relation between resting-state CMRO2 values
| (A7) |
with the assumption that CA does not change with age. Finally, from Eqn A7 and the definitions of the normalized CMRO2 responses, we may write the ratio of CMRO2 levels during the task condition as
| (A8) |
Footnotes
Publisher's Disclaimer: This is a PDF file of an unedited manuscript that has been accepted for publication. As a service to our customers we are providing this early version of the manuscript. The manuscript will undergo copyediting, typesetting, and review of the resulting proof before it is published in its final citable form. Please note that during the production process errors may be discovered which could affect the content, and all legal disclaimers that apply to the journal pertain.
References
- Aguirre GK, Detre JA, Zarahn E, Alsop DC. Experimental Design and the Relative Sensitivity of BOLD and Perfusion fMRI. NeuroImage. 2002;15:488–500. doi: 10.1006/nimg.2001.0990. [DOI] [PubMed] [Google Scholar]
- Bakker SL, de Leeuw FE, den Heijer T, Koudstaal PJ, Hofman A, Breteler MM. Cerebral haemodynamics in the elderly: the rotterdam study. Neuroepidemiology. 2004;23(4):178–84. doi: 10.1159/000078503. [DOI] [PubMed] [Google Scholar]
- Behzadi Y, Liu TT. An arteriolar compliance model of the cerebral blood flow response to neural stimulus. Neuroimage. 2005;25(4):1100–11. doi: 10.1016/j.neuroimage.2004.12.057. [DOI] [PubMed] [Google Scholar]
- Bentourkia M, Bol A, Ivanoiu A, Labar D, Sibomana M, Coppens A, Michel C, Cosnard G, De Volder AG. Comparison of regional cerebral blood flow and glucose metabolism in the normal brain: effect of aging. J Neurol Sci. 2000;181(1−2):19–28. doi: 10.1016/s0022-510x(00)00396-8. [DOI] [PubMed] [Google Scholar]
- Boynton GM, Engel SA, Glover GH, Heeger DJ. Linear systems analysis of functional magnetic resonance imaging in human V1. J. Neuroscience. 1996;16:4207–4221. doi: 10.1523/JNEUROSCI.16-13-04207.1996. [DOI] [PMC free article] [PubMed] [Google Scholar]
- Brown GG, Zorrilla LTE, Gerogy B, Kindermann SS, Wong EC, Buxton RB. BOLD and perfusion response to finger-thumb apposition after acetazolamide administration: differential relationship to global perfusion. J. Cereb. Blood Flow Metab. 2003;23:829–37. doi: 10.1097/01.WCB.0000071887.63724.B2. [DOI] [PubMed] [Google Scholar]
- Burock MA, Dale AM. Estimation and detection of event-related fMRI signals with temporally correlated noise: a statistically efficient and unbiased approach. Human Brain Mapping. 2000;11:249–260. doi: 10.1002/1097-0193(200012)11:4<249::AID-HBM20>3.0.CO;2-5. [DOI] [PMC free article] [PubMed] [Google Scholar]
- Buxton RB. Introduction to Functional Magnetic Resonance Imaging. Cambridge University Press; Cambridge: 2002. [Google Scholar]
- Buxton RB, Uludag K, Dubowitz DJ, Liu TT. Modeling the hemodynamic response to brain activation. Neuroimage. 2004;1(23 Suppl):S220–33. doi: 10.1016/j.neuroimage.2004.07.013. [DOI] [PubMed] [Google Scholar]
- Chalela JA, Alsop DC, Gonzalez-Atavales JB, Maldjian JA, Kasner SE, Detre JA. Magnetic resonance perfusion imaging in acute ischemic stroke using continuous arterial spin labeling. Stroke. 2000;31(3):680–7. doi: 10.1161/01.str.31.3.680. [DOI] [PubMed] [Google Scholar]
- Cox RW. AFNI-software for analysis and visualization of functional magnetic resonance neuroimages. Comput. Biomed. Res. 1996;29:162–173. doi: 10.1006/cbmr.1996.0014. [DOI] [PubMed] [Google Scholar]
- D'Esposito M, Deouell LY, Gazzaley A. Alterations in the BOLD fMRI signal with ageing and disease: a challenge for neuroimaging. Nat Rev Neurosci. 2003;4(11):863–72. doi: 10.1038/nrn1246. [DOI] [PubMed] [Google Scholar]
- Davis TL, Kwong KK, Weisskoff RM, Rosen BR. Calibrated functional MRI: mapping the dynamics of oxidative metabolism. Proc. Natl. Acad. Sci. USA. 1998;95:1834–1839. doi: 10.1073/pnas.95.4.1834. [DOI] [PMC free article] [PubMed] [Google Scholar]
- Farkas E, Luiten PG. Cerebral microvascular pathology in aging and Alzheimer's disease. Prog Neurobiol. 2001;64(6):575–611. doi: 10.1016/s0301-0082(00)00068-x. [DOI] [PubMed] [Google Scholar]
- Fernandez-Seara MA, Wang Z, Wang J, Korczykowski M, Guenther M, Feinberg D, Detre JA. 3T Pseudo-continuous ASL Perfusion fMRI with Background-Suppressed Single Shot 3D GRASE During Memory Encoding; Proceedings of the 14th ISMRM Scientific Meeting; Seattle. 2006. p. 378. [Google Scholar]
- Fischl B, et al. Whole brain segmentation: automated labeling of neuroanatomical structures in the human brain. Neuron. 2002;33(3):341–55. doi: 10.1016/s0896-6273(02)00569-x. [DOI] [PubMed] [Google Scholar]
- Forman SD, Cohen JD, Fitzgerald M, Eddy WP, Mintun MA, Noll DC. Improved assessment of significant activation in functional magnetic resonance imaging (fMRI): use of a cluster–size threshold. Magn. Reson. Med. 1995;33:636–647. doi: 10.1002/mrm.1910330508. [DOI] [PubMed] [Google Scholar]
- Garraux G, Hallett M, Talagala SL. CASL fMRI of subcortico-cortical perfusion changes during memory-guided finger sequences. Neuroimage. 2005;25(1):122–32. doi: 10.1016/j.neuroimage.2004.11.004. [DOI] [PubMed] [Google Scholar]
- Glover GH, Li TQ, Ress D. Image-based method for retrospective correction of physiological motion effects in fMRI: RETROICOR. Magn Reson Med. 2000;44(1):162–7. doi: 10.1002/1522-2594(200007)44:1<162::aid-mrm23>3.0.co;2-e. [DOI] [PubMed] [Google Scholar]
- Grady CL, McIntosh AR, Horwitz B, Maisog JM, Ungerleider LG, Mentis MJ, Pietrini P, Schapiro MB, Haxby JV. Age-related reductions in human recognition memory due to impaired encoding. Science. 1995;269(5221):218–21. doi: 10.1126/science.7618082. [DOI] [PubMed] [Google Scholar]
- Grady CL, McIntosh AR, Rajah MN, Beig S, Craik FI. The effects of age on the neural correlates of episodic encoding. Cereb Cortex. 1999;9(8):805–14. doi: 10.1093/cercor/9.8.805. [DOI] [PubMed] [Google Scholar]
- Grubb RL, Raichle ME, Eichling JO, Ter-Pogossian MM. The effects of changes in PaCO2 on cerebral blood volume, blood flow, and vascular mean transit time. Stroke. 1974;5:630 – 639. doi: 10.1161/01.str.5.5.630. [DOI] [PubMed] [Google Scholar]
- Hoge RD, Atkinson J, Gill B, Crelier GR, Marrett S, Pike GB. Investigation of BOLD signal dependence on cerebral blood flow and oxygen consumption: the deoxyhemoglobin dilution model. Magn Reson Med. 1999a;42(5):849–63. doi: 10.1002/(sici)1522-2594(199911)42:5<849::aid-mrm4>3.0.co;2-z. [DOI] [PubMed] [Google Scholar]
- Hoge RD, Atkinson J, Gill B, Crelier GR, Marrett S, Pike GB. Linear coupling between cerebral blood flow and oxygen consumption in activated human cortex. Proc Natl Acad Sci U S A. 1999b;96(16):9403–8. doi: 10.1073/pnas.96.16.9403. [DOI] [PMC free article] [PubMed] [Google Scholar]
- Hyder F. Neuroimaging with calibrated FMRI. Stroke. 2004;35(11 Suppl 1):2635–41. doi: 10.1161/01.STR.0000143324.31408.db. [DOI] [PubMed] [Google Scholar]
- Iadecola C. Neurovascular regulation in the normal brain and in Alzheimer's disease. Nat Rev Neurosci. 2004;5(5):347–60. doi: 10.1038/nrn1387. [DOI] [PubMed] [Google Scholar]
- Johnson NA, Jahng GH, Weiner MW, Miller BL, Chui HC, Jagust WJ, Gorno-Tempini ML, Schuff N. Pattern of cerebral hypoperfusion in Alzheimer disease and mild cognitive impairment measured with arterial spin-labeling MR imaging: initial experience. Radiology. 2005;234(3):851–9. doi: 10.1148/radiol.2343040197. [DOI] [PMC free article] [PubMed] [Google Scholar]
- Kastrup A, Kruger G, Neumann-Haefelin T, Glover GH, Moseley ME. Changes of cerebral blood flow, oxygenation, and oxidative metabolism during graded motor activation. Neuroimage. 2002;15(1):74–82. doi: 10.1006/nimg.2001.0916. [DOI] [PubMed] [Google Scholar]
- Kastrup A, Li TQ, Kruger G, Glover GH, Moseley ME. Relationship between cerebral blood flow changes during visual stimulation and baseline flow levels investigated with functional MRI. Neuroreport. 1999;10(8):1751–6. doi: 10.1097/00001756-199906030-00023. [DOI] [PubMed] [Google Scholar]
- Kemeny S, Ye FQ, Birn R, Braun AR. Comparison of continuous overt speech fMRI using BOLD and arterial spin labeling. Hum Brain Mapp. 2005;24(3):173–83. doi: 10.1002/hbm.20078. [DOI] [PMC free article] [PubMed] [Google Scholar]
- Kemna LJ, Posse S, Tellmann L, Schmitz T, Herzog H. Interdependence of regional and global cerebral blood flow during visual stimulation: an O-15-butanol positron emission tomography study. J Cereb Blood Flow Metab. 2001;21(6):664–70. doi: 10.1097/00004647-200106000-00004. [DOI] [PubMed] [Google Scholar]
- Kim J, Whyte J, Wang J, Rao H, Tang KZ, Detre JA. Continuous ASL perfusion fMRI investigation of higher cognition: quantification of tonic CBF changes during sustained attention and working memory tasks. Neuroimage. 2006;31(1):376–85. doi: 10.1016/j.neuroimage.2005.11.035. [DOI] [PMC free article] [PubMed] [Google Scholar]
- Kim SG, Duong TQ. Mapping cortical columnar structures using fMRI. Physiol Behav. 2002;77(4−5):641–4. doi: 10.1016/s0031-9384(02)00901-0. [DOI] [PubMed] [Google Scholar]
- Leenders KL, et al. Cerebral blood flow, blood volume and oxygen utilization: Normal values and effect of age. Brain. 1990;113:27–47. doi: 10.1093/brain/113.1.27. [DOI] [PubMed] [Google Scholar]
- Li TQ, Kastrup A, Moseley ME, Glover GH. Changes in baseline cerebral blood flow in humans do not influence regional cerebral blood flow response to photic stimulation. J Magn Reson Imaging. 2000;12(5):757–62. doi: 10.1002/1522-2586(200011)12:5<757::aid-jmri14>3.0.co;2-4. [DOI] [PubMed] [Google Scholar]
- Liu TT, Stark CEL, Wong EC, Buxton RB. Quantitative imaging of hippocampal perfusion during a memory encoding task; Proceedings of the 9th Meeting Intl. Soc. Mag. Reson. Med..2001. p. 1285. [Google Scholar]
- Liu TT, Wong EC. A signal processing model for arterial spin labeling functional MRI. Neuroimage. 2005;24(1):207–15. doi: 10.1016/j.neuroimage.2004.09.047. [DOI] [PubMed] [Google Scholar]
- Luh WM, Wong EC, Bandettini PA, Ward BD, Hyde JS. Comparison of simultaneously measured perfusion and BOLD signal increases during brain activation with T(1)-based tissue identification. Magn Reson Med. 2000;44(1):137–43. doi: 10.1002/1522-2594(200007)44:1<137::aid-mrm20>3.0.co;2-r. [DOI] [PubMed] [Google Scholar]
- Madden DJ, Turkington TG, Provenzale JM, Denny LL, Hawk TC, Gottlob LR, Coleman RE. Adult age differences in the functional neuroanatomy of verbal recognition memory. Hum Brain Mapp. 1999;7(2):115–35. doi: 10.1002/(SICI)1097-0193(1999)7:2<115::AID-HBM5>3.0.CO;2-N. [DOI] [PMC free article] [PubMed] [Google Scholar]
- Mandeville JB, Marota JJA, Ayata C, Zaharchuk G, Moskowitz MA, Rosen BR, Weisskoff RM. Evidence of a cerebrovascular postarteriole windkessel with delayed compliance. J Cereb Blood Flow Metab. 1999;19(6):679–689. doi: 10.1097/00004647-199906000-00012. [DOI] [PubMed] [Google Scholar]
- Marchal G, Rioux P, Petit-Taboue M-C, Sette G, Travere J-M, LePoec C, Courtheoux P, Derlon J-M, Baron J-C. Regional cerebral oxygen consumption, blood flow, and blood volume in healthy human aging. Arch Neurol. 1992;49:1013–1020. doi: 10.1001/archneur.1992.00530340029014. [DOI] [PubMed] [Google Scholar]
- Martin AJ, Friston KJ, Colebatch JG, Frackowiak RS. Decreases in regional cerebral blood flow with normal aging. J Cereb Blood Flow Metab. 1991;11(4):684–9. doi: 10.1038/jcbfm.1991.121. [DOI] [PubMed] [Google Scholar]
- Matsuda H, Ohnishi T, Asada T, Li ZJ, Kanetaka H, Imabayashi E, Tanaka F, Nakano S. Correction for partial-volume effects on brain perfusion SPECT in healthy men. J Nucl Med. 2003;44(8):1243–52. [PubMed] [Google Scholar]
- Matsuura T, Fujita H, Kashikura K, Kanno I. Evoked local cerebral blood flow induced by somatosensory stimulation is proportional to the baseline flow. Neurosci Res. 2000;38(4):341–8. doi: 10.1016/s0168-0102(00)00175-9. [DOI] [PubMed] [Google Scholar]
- Mattis S. Psychological Assessment Resources. Odessa, FL: 1988. Dementia rating scale. [Google Scholar]
- Maximilian VA, Prohovnik I, Risberg J. Cerebral hemodynamic response to mental activation in normo- and hypercapnia. Stroke. 1980;11(4):342–7. doi: 10.1161/01.str.11.4.342. [DOI] [PubMed] [Google Scholar]
- Mildner T, Zysset S, Trampel R, Driesel W, Moller HE. Towards quantification of blood-flow changes during cognitive task activation using perfusion-based fMRI. Neuroimage. 2005;27(4):919–26. doi: 10.1016/j.neuroimage.2005.04.040. [DOI] [PubMed] [Google Scholar]
- Miller KL, Luh WM, Liu TT, Martinez A, Obata T, Wong EC, Frank LR, Buxton RB. Nonlinear temporal dynamics of the cerebral blood flow response. Hum Brain Mapp. 2001;13(1):1–12. doi: 10.1002/hbm.1020. [DOI] [PMC free article] [PubMed] [Google Scholar]
- Mumford JA, Hernandez-Garcia L, Lee GR, Nichols TE. Estimation efficiency and statistical power in arterial spin labeling fMRI. Neuroimage. 2006;33(1):103–14. doi: 10.1016/j.neuroimage.2006.05.040. [DOI] [PMC free article] [PubMed] [Google Scholar]
- Noda A, Ohba H, Kakiuchi T, Futatsubashi M, Tsukada H, Nishimura S. Age-related changes in cerebral blood flow and glucose metabolism in conscious rhesus monkeys. Brain Res. 2002;936(1−2):76–81. doi: 10.1016/s0006-8993(02)02558-1. [DOI] [PubMed] [Google Scholar]
- Olejnik S, Algina J. Measures of Effect Size for Comparative Studies: Applications, Interpretations, and Limitations. Contemp Educ Psychol. 2000;25(3):241–286. doi: 10.1006/ceps.2000.1040. [DOI] [PubMed] [Google Scholar]
- Olson IR, Rao H, Moore KS, Wang J, Detre JA, Aguirre GK. Using perfusion fMRI to measure continuous changes in neural activity with learning. Brain Cogn. 2006;60(3):262–71. doi: 10.1016/j.bandc.2005.11.010. [DOI] [PubMed] [Google Scholar]
- Pantano P, Baron JC, Lebrun-Grandie P, Duquesnoy N, Bousser MG, Comar D. Regional cerebral blood flow and oxygen consumption in human aging. Stroke. 1984;15(4):635–41. doi: 10.1161/01.str.15.4.635. [DOI] [PubMed] [Google Scholar]
- Park DC, Welsh RC, Marshuetz C, Gutchess AH, Mikels J, Polk TA, Noll DC, Taylor SF. Working memory for complex scenes: age differences in frontal and hippocampal activations. J Cogn Neurosci. 2003;15(8):1122–34. doi: 10.1162/089892903322598094. [DOI] [PubMed] [Google Scholar]
- Parkes LM, Rashid W, Chard DT, Tofts PS. Normal cerebral perfusion measurements using arterial spin labeling: reproducibility, stability, and age and gender effects. Magn Reson Med. 2004;51(4):736–43. doi: 10.1002/mrm.20023. [DOI] [PubMed] [Google Scholar]
- Ramsay SC, Murphy K, Shea SA, Friston KJ, Lammertsma AA, Clark JC, Adams L, Guz A, Frackowiak RS. Changes in global cerebral blood flow in humans: effect on regional cerebral blood flow during a neural activation task. J Physiol. 1993;471:521–34. doi: 10.1113/jphysiol.1993.sp019913. [DOI] [PMC free article] [PubMed] [Google Scholar]
- Restom K, Bangen KJ, Perthen JE, Bondi MW, Liu TT. Quantitative Hippocampal Perfusion Response to a Memory Encoding Task: A Comparison Between Healthy Young and Elderly Adults; Proceedings of the 14th ISMRM Scientific Meeting; Seattle. 2006a. p. 377. [Google Scholar]
- Restom K, Behzadi Y, Liu TT. Physiological noise reduction for arterial spin labeling functional MRI. Neuroimage. 2006b;31(3):1104–15. doi: 10.1016/j.neuroimage.2006.01.026. [DOI] [PubMed] [Google Scholar]
- Riecker A, Grodd W, Klose U, Schulz JB, Groschel K, Erb M, Ackermann H, Kastrup A. Relation between regional functional MRI activation and vascular reactivity to carbon dioxide during normal aging. J Cereb Blood Flow Metab. 2003;23(5):565–73. doi: 10.1097/01.WCB.0000056063.25434.04. [DOI] [PubMed] [Google Scholar]
- Shimosegawa E, et al. Photic stimulation study of changing the arterial partial pressure level of carbon dioxide. J Cereb Blood Flow Metab. 1995;15(1):111–4. doi: 10.1038/jcbfm.1995.12. [DOI] [PubMed] [Google Scholar]
- Sicard KM, Shen Q, Liu ZM, Duong TQ. Forepaw-stimulation CBF and BOLD Response Under Hypoxia, Hyperoxia, and Hypercapnia; Proceedings of the 12th ISMRM Scientific Meeting; Kyoto. 2004. p. 274. [Google Scholar]
- Smith SM, et al. Advances in functional and structural MR image analysis and implementation as FSL. Neuroimage. 2004;1(23 Suppl):S208–19. doi: 10.1016/j.neuroimage.2004.07.051. [DOI] [PubMed] [Google Scholar]
- St Lawrence KS, Ye FQ, Lewis BK, Frank JA, McLaughlin AC. Measuring the effects of indomethacin on changes in cerebral oxidative metabolism and cerebral blood flow during sensorimotor activation. Magn Reson Med. 2003;50(1):99–106. doi: 10.1002/mrm.10502. [DOI] [PubMed] [Google Scholar]
- Stark CE, Squire LR. When zero is not zero: the problem of ambiguous baseline conditions in fMRI. Proc Natl Acad Sci U S A. 2001;98(22):12760–6. doi: 10.1073/pnas.221462998. [DOI] [PMC free article] [PubMed] [Google Scholar]
- Stefanovic B, Warnking JM, Kobayashi E, Bagshaw AP, Hawco C, Dubeau F, Gotman J, Pike GB. Hemodynamic and metabolic responses to activation, deactivation and epileptic discharges. Neuroimage. 2005a;28(1):205–15. doi: 10.1016/j.neuroimage.2005.05.038. [DOI] [PubMed] [Google Scholar]
- Stefanovic B, Warnking JM, Pike GB. Hemodynamic and metabolic responses to neuronal inhibition. Neuroimage. 2004;22(2):771–8. doi: 10.1016/j.neuroimage.2004.01.036. [DOI] [PubMed] [Google Scholar]
- Stefanovic B, Warnking JM, Rylander KM, Pike GB. The effect of global cerebral vasodilation on focal activation hemodynamics. Neuroimage. 2005b doi: 10.1016/j.neuroimage.2005.10.038. [DOI] [PubMed] [Google Scholar]
- Stern CE, Corkin S, Gonzalez RG, Guimares AR, Baker JR, Carr CA, Sugiura RM, Vadantham V, Rosen BR. The hippocampal formation participates in novel picture encoding: Evidence from functional magnetic resonance imaging. Proc. Natl. Acad. Sci. USA. 1996;93:8600–8665. doi: 10.1073/pnas.93.16.8660. [DOI] [PMC free article] [PubMed] [Google Scholar]
- Tjandra T, Brooks JC, Figueiredo P, Wise R, Matthews PM, Tracey I. Quantitative assessment of the reproducibility of functional activation measured with BOLD and MR perfusion imaging: implications for clinical trial design. Neuroimage. 2005;27(2):393–401. doi: 10.1016/j.neuroimage.2005.04.021. [DOI] [PubMed] [Google Scholar]
- Wang J, Aguirre GK, Kimberg DY, Roc AC, Li L, Detre JA. Arterial Spin Labeling Perfusion fMRI with Very Low Task Frequency. Magn. Reson. Med. 2003;49:796–802. doi: 10.1002/mrm.10437. [DOI] [PubMed] [Google Scholar]
- Wang J, Rao H, Wetmore GS, Furlan PM, Korczykowski M, Dinges DF, Detre JA. Perfusion functional MRI reveals cerebral blood flow pattern under psychological stress. Proc Natl Acad Sci U S A. 2005;102(49):17804–9. doi: 10.1073/pnas.0503082102. [DOI] [PMC free article] [PubMed] [Google Scholar]
- Wong EC, Buxton RB, Frank LR. Quantitative imaging of perfusion using a single subtraction (QUIPSS and QUIPSS II). Magn. Reson. Med. 1998;39(5):702–708. doi: 10.1002/mrm.1910390506. [DOI] [PubMed] [Google Scholar]
- Woolrich MW, Chiarelli P, Gallichan D, Perthen J, Liu TT. Bayesian inference of hemodynamic changes in functional arterial spin labeling data. Magn Reson Med. 2006;56(4):891–906. doi: 10.1002/mrm.21039. [DOI] [PubMed] [Google Scholar]
- Woolrich MW, Ripley BD, Brady M, Smith SM. Temporal autocorrelation in univariate linear modeling of FMRI data. Neuroimage. 2001;14(6):1370–86. doi: 10.1006/nimg.2001.0931. [DOI] [PubMed] [Google Scholar]
- Xiong J, Gao J-H, Lancaster JL, Fox PT. Clustered PIxels Analysis for Functional MRI Activation Studies of the Human Brain. Human Brain Mapping. 2005;3:287–301. [Google Scholar]
- Yang Y, Gu H, Silbersweig DA, Stern E. Simultaneous perfusion and blood-oxygenation-level-dependent measurements using single-shot interleaved z-shim echo-planar imaging. Magn. Reson. Med. 2005;53:1207–1211. doi: 10.1002/mrm.20431. [DOI] [PubMed] [Google Scholar]
- Ye FQ, Frank JA, Weinberger DR, McLaughlin AC. Noise reduction in 3D perfusion imaging by attenuating the static signal in arterial spin tagging (ASSIST). Magn Reson Med. 2000;44(1):92–100. doi: 10.1002/1522-2594(200007)44:1<92::aid-mrm14>3.0.co;2-m. [DOI] [PubMed] [Google Scholar]
- Ye FQ, Smith AM, Mattay VS, Ruttimann UE, Frank JA, Weinberger DR, McLaughlin AC. Quantitation of regional cerebral blood flow increases in prefrontal cortex during a working memory task: a steady-state arterial spin-tagging study. Neuroimage. 1998;8(1):44–9. doi: 10.1006/nimg.1998.0342. [DOI] [PubMed] [Google Scholar]
- Yee SH, Liu HL, Hou J, Pu Y, Fox PT, Gao JH. Detection of the brain response during a cognitive task using perfusion-based event-related functional MRI. Neuroreport. 2000;11(11):2533–6. doi: 10.1097/00001756-200008030-00037. [DOI] [PubMed] [Google Scholar]