Abstract
Background. Obesity leads to fat infiltration of multiple organs including the heart, kidneys, and liver. Under conditions of oxidative stress, fat-derived cytokines are released locally and result in an inflammatory process and organ dysfunction. In the liver, fat infiltration has been termed nonalcoholic fatty liver disease, which may lead to nonalcoholic steatohepatitis. No data are available, however, on the influence of obesity on pancreatic fat and cytokines, and nonalcoholic fatty pancreas disease (NAFPD) has not been described. Therefore, we designed a study to determine whether obesity is associated with increased pancreatic fat and cytokines. Materials and methods. Thirty C57BL/6J lean control and 30 leptin-deficient obese female mice were fed a 15% fat diet for 4 weeks. At 12 weeks of age all animals underwent total pancreatectomy. Pancreata from each strain were pooled for measurement of a) wet and dry weight, b) histologic presence of fat, c) triglycerides, free fatty acids (FFAs), cholesterol, phospholipids, and total fat, and d) interleukin (IL)-1β and tumor necrosis factor-alpha (TNF-α). Data were analyzed by Student's t test and Fisher's exact test. Results. Pancreata from obese mice were heavier (p<0.05) and had more fat histologically (p<0.05). Pancreata from obese mice had more triglycerides, FFAs, cholesterol, and total fat (p<0.05). Triglycerides represented 11% of pancreatic fat in lean mice compared with 67% of pancreatic fat in obese mice (p<0.01). Cytokines IL-1β and TNF-α also were elevated in the pancreata of obese mice (p<0.05). Conclusions. These data suggest that obese mice have 1) heavier pancreata, 2) more pancreatic fat, especially triglycerides and FFAs, and 3) increased cytokines. We conclude that obesity leads to nonalcoholic fatty pancreatic disease.
Keywords: Cytokines, fat, obesity, pancreas
Introduction
Obesity has become epidemic in the United States, with more than 50 000 000 Americans having a body mass index (BMI) > 30 1. Obesity leads to multiple comorbidities including diabetes, hypertension, and hyperlipidemia (the metabolic syndrome). In addition, obesity causes fat infiltration of several organs including the heart, kidneys, and liver. Under conditions of oxidative stress, fat-derived cytokines are released locally and result in an inflammatory process and organ dysfunction. In the liver, fat infiltration has been termed nonalcoholic fatty liver disease (NAFLD), which may lead to nonalcoholic steatohepatitis (NASH) 2,3. In addition, adipose tissue has been characterized as an endocrine organ with increased production of adipokines, including leptin and adiponectin, and cytokines such as tumor necrosis factor alpha (TNF-α), interleukin-6 (IL-6), and monocyte chemotactic protein-1 (MCP-1) 4. Macrophages, in turn, produce IL-1β and myeloperoxidase (MPO), which further exacerbate the inflammatory process 4,5.
In 1920, Schaefer reported a correlation between the weight of the adult pancreas and body weight 6. In 1933, Ogilvie found 9% pancreatic fat in lean cadavers compared with 17% pancreatic fat in obese cadavers 7. In the 1960s and 1970s fat in the pancreas (pancreatic lipomatosis) was correlated with age, obesity, and type 2 diabetes 8,9. Recent computed tomography (CT) and magnetic resonance imaging (MRI) studies also have correlated pancreatic fat with obesity 10,11,12. Human observations further suggest that the severity of pancreatitis is increased in obese patients 13,14. Despite these observations, nonalcoholic fatty pancreatic disease (NAFPD) and nonalcoholic steatopancreatitis (NASP) have not been described.
Materials and methods
Animals and diets
Thirty lean control (C57BL/6J) and 30 obese leptin-deficient (Lepob) female mice were obtained from Jackson Laboratory (Bar Harbor, ME, USA). Lepob mice are known to have islet cell hyperplasia, type II diabetes, and elevated serum glucose and insulin, suggesting pancreatic endocrine insufficiency 15,16. The mice were housed five per cage in a light (6 am to 6 pm) and temperature (22°C) controlled room. During 1 week of environmental adjustment, the mice were fed a standard low fat chow diet (Ralston Purina, St Louis, MO, USA). At 8 weeks of age all the lean C57BL/6J and the obese leptin-deficient (Lepob) female mice were fed a low fat diet (15% fat, 45% carbohydrate, and 40% protein) (Dyets Inc., Bethlehem, PA, USA) for 4 weeks. The fat was anhydrous milk fat; the carbohydrates were 35% sucrose and 10% cornstarch; and the protein was casein. Both the animals and the food were weighed weekly to determine growth and dietary intake. All protocols for these animal studies were approved by the Indiana University Institutional Animal Care and Use Committee.
Serum and tissue collection
At 12 weeks of age, after an overnight fast with water allowed ad libitum, the mice were sedated with an isoflurane-soaked gauze placed in a 2000 cm3 glass jar. They were then anesthetized with an intraperitoneal injection of xylazine (15 mg/kg) and ketamine (50 mg/kg). The animals were weighed and then underwent laparotomy and total pancreatectomy. A slice of tissue from eight dorsal pancreata from each strain was placed in formalin for measurement of histologic presence of fat, inflammation, and fibrosis. Seven pancreata from each strain were employed for measurement of wet and dry weights. Sixteen dorsal pancreata from each strain were pooled two per group and snap frozen to −80°C for measurement of triglycerides, free fatty acids (FFAs), cholesterol, phospholipids, and total fat. Seven dorsal pancreata from each strain were snap frozen to −80°C for measuring cytokines IL-1β and TNF-α. Whole blood was aspirated from the heart and centrifuged to isolate serum.
Histologic analysis
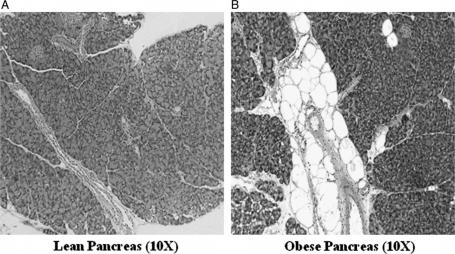
Pancreatic specimens fixed in formalin were stained with hematoxylin and eosin and were reviewed by an observer who was blinded as to the groups. Each specimen was graded, in five high powered fields, 0 to 4+ for inter- and intralobular fat, inflammation, and fibrosis. The total pancreatic fat score was calculated as a sum of the inter- and intralobular fat. Figure 1A, B shows a typical pancreas from a lean and an obese mouse, respectively.
Figure 1. .
(A) Typical pancreatic histology (A) of a lean mouse and (B) of an obese mouse (original magnification ×10).
Serum analysis
Whole blood was spun at 15,000 rpm for 5 min to separate serum. Serum was pooled to give six pools for lean mice, and five pools were obtained for obese mice. Serum cholesterol and triglycerides were determined by using an enzymatic colorimetric method for their quantitative determination. The kits for these measurements were obtained from Wako Chemicals USA, Inc., Richmond, VA, USA and Stanbio Labs, Boerne, TX, USA.
Gallbladder lipid analysis
Gallbladder lipids from eight pools from lean and obese mice underwent lipid analysis at the Mouse Metabolic Phenotyping Center at Vanderbilt University Medical Center, as previously described by Goldblatt et al. 17. Briefly, lipids were extracted by the method of Folch-Lees 18. Individual lipid classes were separated by thin layer chromatography using Silica Gel 60 A plates, and visualized by rhodamine 6G. In addition, total cholesterol was analyzed by the method of Rudel et al. 19. An aliquot of the Folch extract was saponified with 1 N KOH in 90% methanol. The nonsaponifiable sterol was extracted using hexane, and total cholesterol was determined by gas chromatography.
Cytokine analysis
The cytokines IL-1β and TNF-α were measured in seven pancreata from each strain by employing the quantitative sandwich enzyme immunoassay technique. The ELISA kit for this purpose was obtained from R&D Systems, Inc. (Minneapolis, MN, USA).
Statistical analysis
Statistical analyses were performed using Sigma Stat Statistical Software (Jandel Corp., San Rafael, CA, USA). All data are expressed as mean±SEM. Differences in lean and obese mice body weight, food intake, pancreas weights, serum lipids, pancreas lipids, and cytokine data were tested for statistical significance by Student's unpaired t test. Differences in pancreatic histology were tested for statistical significance by Student's unpaired t test and Fisher's exact test. A p value of < 0.05 was considered statistically significant.
Results
Animal weights and dietary intake
As expected, the obese mice weighed significantly more than the lean mice (47±1 vs 18±0 g; p<0.001) at all time points. Dietary intake of the obese mice also was significantly greater than that of the lean mice (22±2 vs 16±1 g per week; p<0.01). The obese mice did not develop exocrine insufficiency as suggested by the absence of steatorrhea and weight loss.
Pancreas weights and total fat
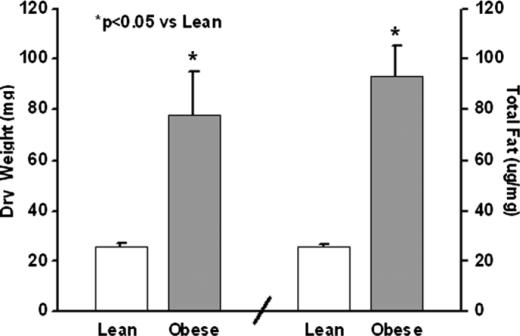
Pancreas dry weight and total fat in lean and obese mice are presented in Figure 2. The pancreatic dry weights were higher in the obese mice (p<0.05). The pancreas wet weights also were higher in the obese mice (161±22 vs 87±9 mg; p<0.01). The pancreas total fat was increased four times in the obese mice (p<0.001).
Figure 2. .
Pancreas dry weights in milligrams and total pancreatic fat by lipid analysis.
Pancreas histology
Pancreas histology is presented in Table I. No significant differences in interlobular fat were seen between the two groups. The obese mice had more intralobular and total pancreatic fat than lean mice (p<0.05). A higher percentage of obese mice had increased pancreatic fat scores (≥1) (88% vs 25%; p<0.05). No inflammation or fibrosis was seen in either group.
Table I. Histology of pancreata.
| Study group | Interlobular fat | Intralobular fat | Total fat | Pancreatic fat |
|---|---|---|---|---|
| Lean mice | 0.3±0.2 | 0.1±0.1 | 0.4±0.3 | 25% |
| Obese mice | 0.9±0.4 | 1.1±0.4* | 2.3±0.7* | 88% |
*p<0.05 vs lean mice.
Serum data
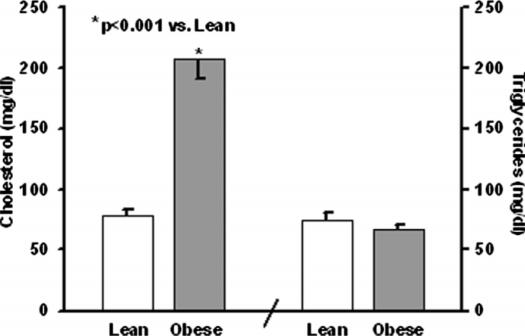
Serum cholesterol and triglycerides are presented in Figure 3. Serum cholesterol was increased in the obese mice (208±17 vs 78±6 mg/dl; p<0.001). However, serum triglycerides were not increased in the obese mice (66±4 vs 74±6 mg/dl).
Figure 3. .
Serum cholesterol and triglycerides.
Pancreas individual fat analysis
Cholesterol, triglycerides, and phospholipids
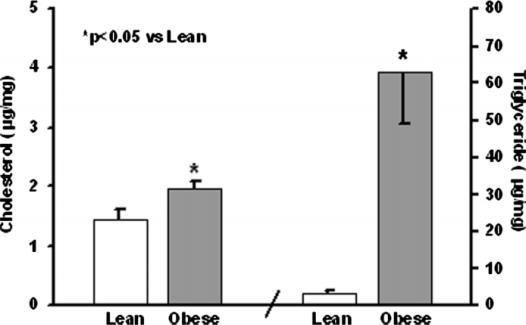
Pancreas cholesterol and triglycerides are shown in Figure 4. The obese mice had more cholesterol and triglyceride in their pancreata compared with their lean counterparts (p<0.05). Cholesterol esters followed the same pattern and also were significantly (p<0.001) increased in the obese mice (0.4±0.02 vs 0.1±0.03 µg/mg). Phospholipids were no different in obese and lean mice (20±0.8 vs 23±1.3 µg/mg).
Figure 4. .
Pancreatic tissue cholesterol and triglycerides.
Free fatty acids
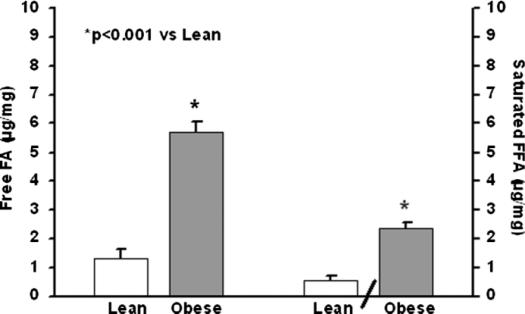
Pancreas FFAs and saturated fatty acids are shown in Figure 5. Both were increased fourfold in obese compared with lean mice (p<0.001). Individual FFA chains are shown in Table II. Ten of the 14 FFA chains including saturated, monounsaturated, and polyunsaturated FFAs were increased in the obese mice (p<0.05).
Figure 5. .
Pancreatic tissue free fatty acids (FFAs) and saturated.
Table II. Pancreas– individual free fatty acid chains.
| Free fatty acid chains | Lean mice (µg/mg) | Obese mice (µg/mg) |
|---|---|---|
| 14:00 | 0.03±0.01 | 0.16±0.02* |
| 16:00 | 0.40±0.12 | 1.90±0.14* |
| 18:00 | 0.12±0.02 | 0.31±0.02* |
| 16:01 | 0.08±0.03 | 0.73±0.07* |
| 18:01 | 0.45±0.13 | 1.74±0.13* |
| 18:02 | 0.07±0.02 | 0.57±0.05* |
| 18:3w3 | 0.01±0.01 | 0.07±0.01* |
| 20:3w9 | 0.01±0.00 | 0.00±0.00† |
| 20:3w6 | 0.00±0.00 | 0.01±0.01 |
| 20:04 | 0.11±0.01 | 0.13±0.01 |
| 20:05 | 0.00±0.00 | 0.01±0.00 |
| 22:04 | 0.00±0.00 | 0.01±0.00† |
| 22:05 | 0.00±0.00 | 0.01±0.01† |
| 22:06 | 0.02±0.00 | 0.03±0.01 |
Values are the mean±SEM.
*p<0.001 vs lean mice; †p<0.05 vs lean mice.
Cytokine analysis
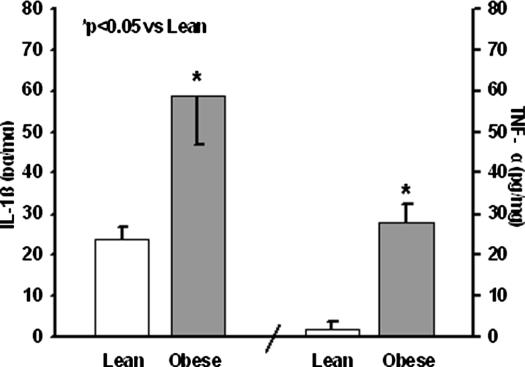
Levels of IL-1β and TNF-α are shown in Figure 6. Both cytokines were significantly elevated in obese compared with lean mice (p<0.05).
Figure 6. .
Pancreatic tissue interleukin (IL)-1β and tumor necrosis factor alpha (TNF-α).
Discussion
In this study 30 lean C57BL/6J and 30 leptin-deficient obese (Lepob) female mice were fed a low (15%) fat diet for 4 weeks. The pancreata of the obese mice were heavier than those of their lean counterparts. On histologic examination the intralobular and total pancreatic fat was significantly increased in the obese mice. Serum cholesterol, but not triglycerides, was elevated in the obese mice. Pancreatic lipid analysis revealed markedly increased total fat, triglycerides, and FFAs as well as significantly increased cholesterol in the obese mice. No strain differences were seen in levels of pancreatic phospholipids. The saturated fatty acid chains 14:00 and 16:00 were increased fivefold in the obese mice; 18:00 was increased 2.5-fold in the obese mice. The unsaturated fatty acids that were increased more than four times in the obese mice included 16:01, 18:01, 18:02, and 18:3w3. The cytokines IL-1β and TNF-α also were significantly elevated in the pancreata of obese mice.
Since Ogilvie 7 first postulated the entity of pancreatic fat infiltration, more sophisticated radiologic techniques have backed up this claim 10,11,12. Interestingly, fat in the pancreas is not distributed homogeneously throughout the gland 10. Matsumoto et al. proposed a classification of pancreatic fat infiltration based on the sparing of fat in the posterior aspect of the head of the pancreas, the uncinate, and the area around the common bile duct. Differences in the embryologic development of the ventral and dorsal pancreatic buds has been proposed as the cause 10. Further refinements of the process of quantification of fat have come with MRI. Using the 3-point Dixon technique, Kovanlikaya et al. have reconfirmed the correlation of BMI and pancreatic fat 12.
Increased infiltration of fat in the pancreas has been associated with obesity, increased age, Cushing's syndrome, cystic fibrosis, and lipomatous pseudohypertrophy 7,8,20. Dreiling et al. postulated that fat infiltration of the pancreas was a reversible process 21. In addition, Nghiem et al. have shown that the fatty pancreas observed in obesity can be ‘defatted’ and used successfully for pancreas transplantation 22. However, extreme fatty replacement of the exocrine pancreas is likely to be associated with a decrease in pancreatic function. Massive fatty replacement has been described in the entity of lipomatous pseudohypertrophy of the pancreas 9,20. Interestingly, pancreatic islet cells are resistant to fatty infiltration 9,20.
Adipose tissue is not an innocent bystander of the metabolic syndrome. Fat, and particularly visceral fat, is now known to play a key role in the metabolic dysfunctions that occur as a consequence of obesity. Adipose tissue produces adipokines, chemokines, and cytokines, which are collectively referred to as adipocytokines 4,5. In the lean adult these adipokines, like leptin and adiponectin, play a role in normal body metabolism. However, in humans obesity leads to an increase in leptin and a decrease in adiponectin production by fat cells. This altered adipokine milieu leads to monocyte and macrophage infiltration into the fat 4. We have shown that leptin-deficient obese mice have increased fat and cytokines in their pancreas. However, white blood cell infiltration was not different in the two groups. Thus, the alteration in the individual fats may have resulted in increased IL-1β and TNF-α. In adipocytes triglycerides, which were markedly increased in the obese pancreata, have been linked to increased production of TNF-α 23. In addition, the literature on atherosclerosis suggests that increased cholesterol in endothelial cells stimulates IL-1β production 24. Moreover, we have recently demonstrated a similar phenomenon in the gallbladder of leptin-deficient obese mice 25. The consequences of the elevation of tissue cytokines are an increase in insulin resistance, lipolysis, fat oxidation, and angiogenesis 4,5,26. One of the results of this chain of events is an increase in FFA levels in both serum and tissue.
In this study we have shown a fourfold increase in the pancreatic tissue levels of FFAs. As adipocytes enlarge, free fatty acids are released from omental and peripheral fat 4. FFAs then potentiate their own release by inducing insulin resistance which, in turn, increases lipolysis 2,3,27,28. Furthermore, elevated serum FFAs have been shown to increase triglyceride accumulation, activate the pro-inflammatory NF-κB pathway, and increase tissue cytokines and reactive oxygen species (ROS) in animal studies 27,28,29. Human studies also have correlated serum FFAs with elevated serum cytokines 30,31. Delving deeper into the individual FFA chains, Suganami et al. observed that saturated fats, and not polyunsaturated fats, were capable of inducing cytokine production from macrophages in adipose tissue 32. In humans, the only fatty acids that correlate with serum cytokine levels are palmitate and myristic acid, both saturated fats 30. A further indictment of palmitate comes from animal studies showing that it activates the NF-κB pathway and induces IL-6 and TNF-α in adipocytes and ROS in endothelial calls 33,34. Palmitate is also essential for the synthesis of ceramide, which is known to mediate inflammation 35. In the present study we found a more than fourfold increase in both palmitic (16:00) and myristic acid (14:00) levels in the obese versus lean murine pancreata. Among the unsaturated fatty acids, palmitoleic (16:01), oleic (18:01), and linoleic (18:02) acid were also found to be substantially elevated in obese mice. Both oleic and linoleic acid have also been shown to have proinflammatory effects 36,37.
We have previously shown that Lepob mice have increased fat in their liver without inflammation or fibrosis (NAFLD) 38. Our observations with respect to NAFPD are similar to those for NAFLD in that obesity leads to significant tissue triglyceride accumulation. We postulate, therefore, that the fatty pancreas may be more prone to pancreatitis similar to the development of nonalcoholic steatohepatitis (NASH) from NAFLD 39. If this phenomenon was to occur in the pancreas, the term nonalcoholic steatopancreatitis (NASP) might apply. With NASH a two-hit theory has been postulated. The first hit is triglyceride accumulation as a result of both an increase in dietary FFAs and lipolysis in peripheral fat tissue 2,39. Our model of NAFPD showed that triglycerides were dramatically elevated, going from 3 µg/mg in lean to 63 µg/mg in obese mice, a 20-fold increase. The second hit is believed to occur as the result of an oxidative stress. Elevated insulin levels are known to generate oxidative stress and fibrogenesis 2. Previous studies from our laboratory have demonstrated that Lepob mice have hyperglycemia, hyperinsulinemia, and hyperlipidemia 16. Lipid peroxidation is the other important mediator of the second hit, with FFAs being the major source 2. The primary site of lipid peroxidation is the mitochondria. In the pancreas of patients with type II diabetes mellitus mitochondrial dysfunction, which leads to increased oxidation and generation of ROS, has been documented 40. Lending more credence to our theory are the recent data from Yan et al., who have shown that a high fat diet in rats increases lipid peroxidation and ROS and decreases pancreatic microcirculation 41. These changes would result in an inflammatory state which we have termed NASP. Further studie s measuring tissue malon-dialdehyde (MDA) will be required to determine whether obese mice have increased oxidative stress and are more prone to NASP.
Obesity leads to NAFLD, which may progress to NASH, cirrhosis and, ultimately, hepatocellular cancer 2,3. Obesity, and importantly central obesity, also has been associated with a significantly increased risk of pancreatic cancer 42. Increased pancreatic fat and, in particular FFAs, may play a role in the progression of NASP to cancer. Supporting this hypothesis, a high fat diet has been shown to enhance the risk of pancreatic cancer in both humans and animal models 43,44. Ghadrian et al. and Stolzenberg et al. also have reported that increased dietary saturated fat intake increases the risk of pancreatic cancer 45,46. In addition, Fisher et al. showed that serum elevations of FFAs correlate with both in vivo and in vitro tumor growth 47. Additionally, they showed that linoleic and oleic acid cause a dose-dependent increase in pancreatic cell growth. Both of these fatty acids were elevated in the pancreata of the obese mice in our study. Further studies will be required, however, to determine whether congenitally obese mice with increased pancreatic fat are more prone to pancreatic cancer.
This study documents that obese mice have heavier pancreata and more pancreatic fat, especially triglycerides and FFAs, as well as increased cytokines. We conclude that obesity leads to fat infiltration of the pancreas, which can be termed nonalcoholic fatty pancreatic disease. This observation may have implications regarding the severity of pancreatitis in obese patients as well as the association of obesity with pancreatic cancer. Thus, the accumulation of toxic fats and proinflammatory cytokines in the pancreas, steatopancreatitis, may be key to the pathogenesis of both pancreatitis and pancreatic cancer.
Acknowledgements and disclosures
This study was supported by NIH grant R-01 DK44279.
Footnotes
Presented at the International Hepato-Pancreato-Biliary Association, September 3–7, 2006, Edinburgh, UK.
References
- 1.Mokdad AH, Ford ES, Bowman BA, Dietz WH, Vinicor F, Bales VS, et al. Prevalence of obesity, diabetes, and obesity-related health risk factors, 2001. JAMA. 2001;289:76–9. doi: 10.1001/jama.289.1.76. [DOI] [PubMed] [Google Scholar]
- 2.McCullough AJ. Pathophysiology of nonalcoholic steatohepatitis. J Clin Gastroenterol. 2006;40:S17–S29. doi: 10.1097/01.mcg.0000168645.86658.22. [DOI] [PubMed] [Google Scholar]
- 3.Wanless IR, Shiota K. The pathogenesis of nonalcoholic steatohepatitis and other fatty liver diseases: a four-step model including the role of lipid release and hepatic venular obstruction in the progression to cirrhosis. Semin Liver Dis. 2004;24:99–106. doi: 10.1055/s-2004-823104. [DOI] [PubMed] [Google Scholar]
- 4.Greenberg AS, Obin MS. Obesity and the role of adipose tissue in inflammation and metabolism. Am J Clin Nutr. 2006;83:461S–465S. doi: 10.1093/ajcn/83.2.461S. [DOI] [PubMed] [Google Scholar]
- 5.Juge-Aubry CE, Henrichot E, Meier CA. Adipose tissue: a regulator of inflammation. Best Pract Res Clin Endocrinol Metab. 2005;19:547–66. doi: 10.1016/j.beem.2005.07.009. [DOI] [PubMed] [Google Scholar]
- 6.Schaefer JH. The normal weight of the pancreas in the adult human being: a biometric study. Anat Rec. 1926;32:119–32. [Google Scholar]
- 7.Ogilvie RF. The islands of Langerhans in 19 cases of obesity. J Pathol Bact. 1933;37:473–81. [Google Scholar]
- 8.Olsen TS. Lipomatosis of the pancreas in autopsy material and its relation to age and overweight. Acta Microbiol Scand Sect A. 1978;86:367–73. doi: 10.1111/j.1699-0463.1978.tb02058.x. [DOI] [PubMed] [Google Scholar]
- 9.Walters MN. Adipose atrophy of the exocrine pancreas. J Pathol Bact. 1966;92:547–57. doi: 10.1002/path.1700920232. [DOI] [PubMed] [Google Scholar]
- 10.Matsumoto S, Mori H, Miyake H, Takaki H, Maeda T, Yamada Y, et al. Uneven fatty replacement of the pancreas: evaluation with CT. Radiology. 1995;194:453–8. doi: 10.1148/radiology.194.2.7824726. [DOI] [PubMed] [Google Scholar]
- 11.Katz DS, Hines J, Math KR, Nardi PM, Mindelzun RE, Lane MJ. Using CT to reveal fat-containing abnormalities of the pancreas. AJR Am J Roentgenol. 1999;172:393–6. doi: 10.2214/ajr.172.2.9930790. [DOI] [PubMed] [Google Scholar]
- 12.Kovanlikaya A, Mittelman SD, Ward A, Geffner ME, Dorey F, Gilsanz V. Obesity and fat quantification in lean tissues using three-point Dixon MR imaging. Pediatr Radiol. 2005;35:601–7. doi: 10.1007/s00247-005-1413-y. [DOI] [PubMed] [Google Scholar]
- 13.Papachristou GI, Papachristou DJ, Avula H, Slivka A, Whitcomb DC. Obesity increases the severity of acute pancreatitis: performance of APACHE-O score and correlation with the inflammatory response. Pancreatology. 2006;6:279–85. doi: 10.1159/000092689. [DOI] [PubMed] [Google Scholar]
- 14.Martinez J, Johnson CD, Sanchez-Paya J, de Madaria E, Robles-Diaz G, Perez-Mateo M. Obesity is a definitive risk factor of severity and mortality in acute pancreatitis: an updated meta-analysis. Pancreatology. 2006;6:206–9. doi: 10.1159/000092104. [DOI] [PubMed] [Google Scholar]
- 15.Chua S, Jr, Liu SM, Li Q, Yang L, Thassanapaff VT, Fisher P. Differential beta cell responses to hyperglycaemia and insulin resistance in two novel congenic strains of diabetes (FVB- Lepr (db)) and obese (DBA- Lep (ob)) mice. Diabetologia. 2002;7:976–90. doi: 10.1007/s00125-002-0880-z. [DOI] [PubMed] [Google Scholar]
- 16.Tran KQ, Goldblatt MI, Swartz-Basile DA, Svatek C, Nakeeb A, Pitt HA. Diabetes and hyperlipidemia correlate with gallbladder contractility in leptin-related murine obesity. J Gastrointest Surg. 2003;7:857–62. doi: 10.1007/s11605-003-0030-z. [DOI] [PubMed] [Google Scholar]
- 17.Goldblatt MI, Swartz-Basile DA, Al-Azzawi HH, Tran KQ, Nakeeb A, Pitt HA. Nonalcoholic fatty gallbladder disease: the influence of diet in lean and obese mice. J Gastrointest Surg. 2006;10:193–201. doi: 10.1016/j.gassur.2005.07.009. [DOI] [PubMed] [Google Scholar]
- 18.Folch J, Lees M, Sloane-Stanley GH. A simple method for the isolation and purification of total lipids from animal tissues. J Biol Chem. 1957;226:497–509. [PubMed] [Google Scholar]
- 19.Rudel LL, Kelley K, Sawyer JK, Shah R, Wilson MD. Dietary monounsaturated fatty acids promote aortic atherosclerosis in LDL receptor-null, human apoB100-overexpressing transgenic mice. Arterioscler Thromb Vasc Biol. 1998;18:1818–27. doi: 10.1161/01.atv.18.11.1818. [DOI] [PubMed] [Google Scholar]
- 20.Wallace SA, Ashworth CT. Early degenerative lesions of pancreas. Tex St J Med. 1942;37:584–7. [Google Scholar]
- 21.Dreiling DA, Elsbach P, Schaffner F, Schwartz IL. The effect of restriction of protein and total calories on pancreatic function in obese patients. Gastroenterology. 1962;42:686. [PubMed] [Google Scholar]
- 22.Nghiem DD, Olson PR, Ormond D. The “fatty pancreas allograft”: anatomopathologic findings and clinical experience. Transplant Proc. 2004;36:1045–7. doi: 10.1016/j.transproceed.2004.04.032. [DOI] [PubMed] [Google Scholar]
- 23.Hirata T, Unoki H, Bujo H, Ueno K, Saito Y. Activation of diacylglycerol O-acyltransferase 1 gene results in increased tumor necrosis factor-alpha gene expression in 3T3-L1 adipocytes. FEBS Lett. 2006;18;580:5117–21. doi: 10.1016/j.febslet.2006.08.047. [DOI] [PubMed] [Google Scholar]
- 24.Lin SJ, Yen HT, Chen YH, Ku HH, Lin FY, Chen YL. Expression of interleukin-1 beta and interleukin-1 receptor antagonist in oxLDL-treated human aortic smooth muscle cells and in the neointima of cholesterol-fed endothelia-denuded rabbits. J Cell Biochem. 2003;88:836–47. doi: 10.1002/jcb.10431. [DOI] [PubMed] [Google Scholar]
- 25.Mathur A, Al-Azzawi HH, Lu D, Yancey KW, Swartz-Basile D, Nakeeb A, et al. Steatocholecystitis: the influence of obesity and dietary carbohydrates. J Surg Res 2007 (in press). [DOI] [PMC free article] [PubMed] [Google Scholar]
- 26.Bastard JP, Maachi M, Lagathu C, Kim MJ, Caron M, Vidal H, et al. Recent advances in the relationship between obesity, inflammation, and insulin resistance. Eur Cytokine Netw. 2006;17:4–12. [PubMed] [Google Scholar]
- 27.Boden G, She P, Mozzoli M, Cheung P, Gumireddy K, Reddy P, et al. Free fatty acids produce insulin resistance and activate the proinflammatory nuclear factor-kappaB pathway in rat liver. Diabetes. 2005;54:3458–65. doi: 10.2337/diabetes.54.12.3458. [DOI] [PubMed] [Google Scholar]
- 28.Nguyen MT, Satoh H, Favelyukis S, Babendure JL, Imamura T, Sbodio JI, et al. JNK and tumor necrosis factor-alpha mediate free fatty acid-induced insulin resistance in 3T3-L1 adipocytes. J Biol Chem. 2005;280:35361–71. doi: 10.1074/jbc.M504611200. [DOI] [PubMed] [Google Scholar]
- 29.Inoguchi T, Li P, Umeda F, Yu HY, Kakimoto M, Imamura M, et al. High glucose level and free fatty acids stimulate reactive oxygen species production through protein kinase C-dependent activation of NAD(P)H oxidase in cultured vascular cells. Diabetes. 2000;49:1939–45. doi: 10.2337/diabetes.49.11.1939. [DOI] [PubMed] [Google Scholar]
- 30.Fernandez-Real JM, Broch M, Vendrell J, Ricart W. Insulin resistance, inflammation, and serum fatty acid composition. Diabetes Care. 2003;26:1362–8. doi: 10.2337/diacare.26.5.1362. [DOI] [PubMed] [Google Scholar]
- 31.Ghanim H, Aljada A, Hofmeyer D, Syed T, Mohanty P, Dandona P. Circulating mononuclear cells in the obese are in a proinflammatory state. Circulation. 2004;110:1564–71. doi: 10.1161/01.CIR.0000142055.53122.FA. [DOI] [PubMed] [Google Scholar]
- 32.Suganami T, Nishida J, Ogawa Y. A paracrine loop between adipocytes and macrophages aggravates inflammatory changes: role of free fatty acids and tumor necrosis factor alpha. Arterioscler Thromb Vasc Biol. 2005;25:2062–8. doi: 10.1161/01.ATV.0000183883.72263.13. [DOI] [PubMed] [Google Scholar]
- 33.Ajuwon KM, Spurlock ME. Palmitate activates the NF-kappaB transcription factor and induces IL-6 and TNF-alpha expression in 3T3-L1 adipocytes. J Nutr. 2005;135:1841–6. doi: 10.1093/jn/135.8.1841. [DOI] [PubMed] [Google Scholar]
- 34.Staiger H, Staiger K, Stefan N, Wahl HG, Machicao F, Kellerer M, et al. Palmitate-induced interleukin-6 expression in human coronary artery endothelial cells. Diabetes. 2004;53:3209–16. doi: 10.2337/diabetes.53.12.3209. [DOI] [PubMed] [Google Scholar]
- 35.Summers SA. Ceramides in insulin resistance and lipotoxicity. Prog Lipid Res. 2006;45:42–72. doi: 10.1016/j.plipres.2005.11.002. [DOI] [PubMed] [Google Scholar]
- 36.Li X, Botts S, Morton D, Knickerbocker MJ, Adler R. Oleic acid-associated bronchiolitis obliterans-organizing pneumonia in beagle dogs. Vet Pathol. 2006;43:183–5. doi: 10.1354/vp.43-2-183. [DOI] [PubMed] [Google Scholar]
- 37.Poirier H, Shapiro JS, Kim RJ, Lazar MA. Nutritional supplementation with trans-10, cis-12-conjugated linoleic acid induces inflammation of white adipose tissue. Diabetes. 2006;55:1634–41. doi: 10.2337/db06-0036. [DOI] [PubMed] [Google Scholar]
- 38.Swartz-Basile DA, Goldblatt M, Coi SH, Svatek CL, Tran KQ, Nakeeb A, et al. Biliary lipids and cholesterol crystal formation in leptin-deficient mice. HPB. 2006;8:386–92. doi: 10.1080/13651820600641233. [DOI] [PMC free article] [PubMed] [Google Scholar]
- 39.Bradbury MW. Lipid metabolism and liver inflammation. I. Hepatic fatty acid uptake: possible role in steatosis. Am J Physiol Gastrointest Liver Physiol. 2006;290:G194–8. doi: 10.1152/ajpgi.00413.2005. [DOI] [PubMed] [Google Scholar]
- 40.Langin D.Diabetes, insulin secretion, and the pancreatic beta-cell mitochondrion. N Engl J Med 200113;345:1772–4. [DOI] [PubMed] [Google Scholar]
- 41.Yan MX, Li YQ, Meng M, Ren HB, Kou Y. Long-term high-fat diet induces pancreatic injuries via pancreatic microcirculatory disturbances and oxidative stress in rats with hyperlipidemia. Biochem Biophys Res Commun. 2006;347:192–9. doi: 10.1016/j.bbrc.2006.06.063. [DOI] [PubMed] [Google Scholar]
- 42.Patel AV, Rodriguez C, Bernstein L, Chao A, Thun MJ, Calle EE. Obesity, recreational physical activity, and risk of pancreatic cancer in a large U. S. cohort. Cancer Epidemiol Biomarkers Prev. 2005;14:459–66. doi: 10.1158/1055-9965.EPI-04-0583. [DOI] [PubMed] [Google Scholar]
- 43.Birt DF, Pelling JC, Nair S, Lepley D. Diet intervention for modifying cancer risk. Prog Clin Biol Res. 1996;395:223–34. [PubMed] [Google Scholar]
- 44.Birt DF, Julius AD, White LT, Pour PM. Enhancement of pancreatic carcinogenesis in hamsters fed a high-fat diet ad libitum and at a controlled calorie intake. Cancer Res. 1989;49:5848–51. [PubMed] [Google Scholar]
- 45.Ghadirian P, Simard A, Baillargeon J, Maisonneuve P, Boyle P. Nutritional factors and pancreatic cancer in the francophone community in Montreal, Canada. Int J Cancer. 1991;47:1–6. doi: 10.1002/ijc.2910470102. [DOI] [PubMed] [Google Scholar]
- 46.Stolzenberg-Solomon RZ, Pietinen P, Taylor PR, Virtamo J, Albanes D. Prospective study of diet and pancreatic cancer in male smokers. Am J Epidemiol. 2002;155:783–92. doi: 10.1093/aje/155.9.783. [DOI] [PubMed] [Google Scholar]
- 47.Fisher WE, Boros LG, Schirmer WJ. Reversal of enhanced pancreatic cancer growth in diabetes by insulin. Surgery. 1995;118:453–7. doi: 10.1016/s0039-6060(05)80358-7. [DOI] [PubMed] [Google Scholar]


