

Abstract
We have developed a computer-assisted stereological method based on unbiased principles for estimating metastasis volumes in mouse lungs. We evaluated this method using the transplantable Lewis lung carcinoma. Twenty-one days after subcutaneous inoculation of 106 Lewis lung cells into C57BL/6J mice, the mice had primary tumors with an average volume of 2300 mm3. After perfusion fixation, the lungs were removed, embedded in OCT compound, snap-frozen, and processed for stereology. The metastasis volumes were estimated by application of the Cavalieri principle after evaluation of single sections from several evenly distributed tissue levels. The metastasis volume in a group of nine mice varied between 0.01 and 14.4 mm3, with an average of 6.1 mm3. The coefficient of variation was 0.9. The coefficient of error of the volume estimation was determined in five cases and varied from 0.08 to 0.23. Thus, the variation on the metastasis volumes that is achieved by this method contributes very little, 2.5%, to the total variance within the group of mice. In conclusion, we have developed an efficient and unbiased method to determine the metastasis burden in mouse lungs.
Metastasis is a frequent, lethal result of malignant cancer growth. Thus, there are obvious reasons for studying metastasis and developing drugs that interfere with the underlying molecular mechanisms. Successful metastatic settlement is followed by exponential growth of the initial micrometastasis and thus an exponential enlargement of the metastatic volume. In any individual, circulating tumor cells may give rise to metastases at different time points depending on the success of settlement. The total metastatic burden is a result of both early and late settlements. Earlier settlements will comprise a relatively large proportion of the total metastatic burden if proliferation rate is identical in each initial focus. A marked variation in the total metastatic burden between individuals is expected in an animal metastasis model in which individuals are transplanted with tumor cells, of which only a very small fraction gives rise to metastatic foci. Until now, the metastatic burden in mouse lungs has primarily been determined by counting the number of metastatic foci on the lung surface. 1-3 Surface counting does usually not take the size of individual metastatic foci into account, and does not include metastases in the interior of the lung. It is therefore a rather imprecise quantification of the metastatic burden. Volumetric measurements of microscopic structures using stereology is a widely used tool and has in recent years been facilitated by computerized handling. There are few reports on a volumetric estimate of the metastasis burden, based on a stereological approach to measure liver metastasis in mouse models. 4,5
Volumes estimated by computer-assisted stereology can be determined with high precision and accuracy, provided that tissue sampling is performed appropriately. 6,7 The purpose of this study was to develop a practical method for the stereological analysis of lung metastasis volume using computer-assisted stereology. 7 The stereological method has been applied in a series of lungs with different metastasis burden, and the precision of the method has been evaluated.
Materials and Methods
Materials
Female C57BL/6J mice (8-to 10-weeks old) from Gammel Bomholdtgaard, Ry, Denmark, were used. Parental Lewis lung carcinoma cells were obtained from Deutches Krebsforshung Institut, Heidelberg Germany. The computer-assisted stereology setup consisted of a Leica Dialux 22 microscope equipped with a charge-coupled device camera (JAI 2040; JAI Corporation, Yokohama, Japan) and a motorized X-Y stage directed by a multicontroller unit (Olympus, Albertslund, Denmark). The computer (PC 300 GL; IBM, Portsmouth, UK) had a 24-bit framegrabber board (SM II, Fast Multimedia AG, München, Germany) and Cast-grid software (Olympus) installed. Microscopic images were projected to a 17-inch monitor (FlexScan F56, Eizo Corporation, Matto, Japan).
Methods
Lewis Lung Transplantation and Metastasis Assay
Lewis lung carcinoma cells were propagated by retransplantation in C57BL/6 mice. Transplantation was done by dissecting 10- to 12-day-old tumors: fresh tumor pieces from five to eight mice were picked and the necrotic tissue removed. A tumor mince was prepared by cutting up the tumor pieces with razor blades, and suspending them in phosphate-buffered saline (PBS) and passing them through a 21-gauge syringe. Cells (10 6 cells in 100 μl) were injected subcutaneously into the upper flank of C57BL/6 mice. After 7 to 21 days, the mice were sacrificed and perfused with 10 ml of ice-cold PBS followed by perfusion fixation with 10 ml of ice-cold 4% paraformaldehyde in PBS (PFA) and the lungs were removed for further fixation. During growth, the primary tumor width and length were measured using a Vernier gauge and the volume was determined as 0.5 (width 2 × length).
Fixation and Tissue Sampling for Stereology
To obtain optimal morphology, lungs were evacuated under vacuum for 1 hour within 4 hours of removal. They were then left 2 days in 4% PFA followed by 2 days in 20% sucrose at 4°C. Because tissue shrinks considerably during paraffin embedding (eg, lungs shrink to approximately half of the original volume), we chose the cryostat processing approach in which overall tissue shrinkage is negligible. The lungs (from a single mouse) were mounted at room temperature in ∼2 ml of Tissue-Tek (OCT compound, code 4583; Sakura, Zoeterwoude, The Netherlands) that was placed on a bent spatula with a 4-cm 2 head. An additional 2 to 3 ml of Tissue-Tek was added to cover the lungs, and just after this the spatula with Tissue-Tek-embedded lungs was snap-frozen in isopentane/dry ice. After ∼30 to 60 seconds the spatula was withdrawn and the embedded lungs were removed and stored at −20°C until further processing. To ensure systematic uniform and random sampling, 6 the fixed and frozen lungs were cut transversally to the trachea, into 2.0-mm-thick parallel slabs with a random position of the first cut in the first 2.0 mm of the lung resulting in a total of five to eight slabs per lung. The slabs were placed with identical orientation in a metal capsule. These steps were performed on a −20°C freezing desk. The Tissue-Tek was allowed to melt and then the specimens were embedded in additional ice-cold Tissue-Tek and frozen on dry ice. Cryostat sections (6 to 8 μm) were cut from the upper-cut surface of the slab at −16°C, air dried on a 60°C heating plate, postfixed for 10 minutes in PFA, and finally counterstained with hematoxylin and eosin. Generally, the technically best-preserved section out of three adjacent sections processed from each block was selected. In cases where we initially found very small metastasis volumes (smaller than ∼0.1 mm3), 8 to 10 additional sections separated by 200 μm were analyzed. We estimate a single metastatic focus of ∼0.01 mm 3 to be the smallest detectable in this assay.
Stereology
The stereological measurements of the metastasis volumes were performed using the Cavalieri principle. 6,7 The estimated volume V of the metastases Vmet is:
 |
where t is the slab thickness, or intersectional distance (usually 2.0 mm as indicated above), Pi is the number of points that hit metastatic tissue on the slab i, and (a/p) is the area associated with each point.
Point Counting
Point counting was done according to the recommendations described in Gundersen and colleagues, 7 and was performed using the CAST-grid stereology software (Olympus). Briefly, the entire section, processed from tissue blocks as described above, was delineated (Meander sampling). The step length was fixed to 2000 × 1400 μm enabling the evaluation of the total tissue area with a ×4 objective (a total of 125 times magnification on the computer monitor), ie, the sum of all fields of vision from a section equals the whole section. The Meander sampling gave rise to 70 to 130 fields to be evaluated on the sample of sections. The fields were superposed with a test system with regularly arranged points. Point counting was performed with areas per point (a/p), ranging from 4000 to 46,000 μm 2 depending on the metastasis burden, providing a total number of hitting points ΣPi between 100 and 200. For small metastasis volumes (smaller than ∼1 mm3) ΣPi ranged from 1 to 100. Because the slab thickness was 2000 μm, each time a point hits metastatic tissue it represents 0.008 to 0.092 mm 3 of metastasis.
Estimation of Variation and Error Coefficients on the Metastasis Volume
The coefficient of error (CE = SEM/mean) on the volume as estimated by Equation 1 is the sum of the CE related to the small number of slabs (sectional variation, CES) and the CE related to the point counting itself (CEP) and was calculated using the method described by Gundersen and colleagues. 6
 |
The variance of the point counting per se, CEP, is determined by the shape of the set of metastases: numerous isolated profiles ranging from 50 to ∼2000 μm in diameter. There are, for example, 50 profiles per section and only a count of ∼20 point hitting. In this situation CEP is approximately that of a Poisson distribution (independent counts):
 |
 |
The variance of ΣP because of the low number, 6 to 7, of systematically spaced sections is also governed by the three-dimensional shape of the set of metastases: anywhere between 1000 to 10 to 100,000 isolated lumps of cells, very rarely of a diameter of 2 mm. Technically, the variance is mostly because of small-scale effects: of the ∼50 metastases hit by a section, almost none are hit by the next section 2 mm away. The CES is computed as
 |
where A = ΣPi2, B = Σ(Pi·Pi+1), C = Σ(Pi·Pi+2) (see also Table 1 ▶ ).
Table 1.
Example Showing the Computation of Sums A, B, and C Used to Determine CES
| i | Pi | Pi2 | Pi · Pi+1 | Pi · Pi+2 |
|---|---|---|---|---|
| 1 | 4 | 16 | 72 | 380 |
| 2 | 18 | 324 | 1710 | 1926 |
| 3 | 95 | 9025 | 10,165 | 10,165 |
| 4 | 107 | 11,449 | 11,449 | 4708 |
| 5 | 107 | 11,449 | 4708 | 535 |
| 6 | 44 | 1936 | 220 | |
| 7 | 5 | 25 | ||
| Σ | 380 | 34,224 | 28,324 | 17,714 |
| ΣPi | A | B | C |
Note that volume estimation of a single, large three-dimensional object, the lung, for example, where small-scale effects are not present, the denominator in Equation 5 is not 12 but 240. 8
The total variation of the metastasis volume in a group of mice is the contribution from variation in stereological estimation (CEstereology) and the contribution from the biological variation between the individual mice in the experiment (CVbiology):
 |
Inter- and Intra-Observer Variation
For interobserver variation, point counting was performed on eight cases and was performed blinded by two observers, using the same grid densities. For intra-observer variation point counting was performed blinded with ∼1 month between counting sessions. Pearson’s moment correlations were calculated and the paired t-test was used to test for systematic differences.
Counting of Surface Metastases and Comparison with the Lung Metastasis Volume
Twenty-one days after inoculation of Lewis lung carcinoma cells, mice were sacrificed, perfusion-fixed, and the lungs isolated. After additional fixation, the lungs were weighed and the number of metastases on the lung surface counted under an inverted stereomicroscope. The lungs were then processed for stereological analysis after embedding in Tissue-Tek as specified above. Pearson’s product moment correlations and their 95% confidence intervals (CI) were calculated.
Results
Tissue Processing and Morphology
To obtain an optimal morphology without tissue shrinkage, lung samples were perfusion-fixed, air-evacuated, left in 20% sucrose for 2 days, and processed for cryostat sectioning, as described in the Materials and Methods section. The morphology of a Lewis lung metastasis is shown in Figure 1, d and e ▶ . To obtain lung sections with an unbiased presentation of the total lung, 2-mm parallel slabs were cut, with the first cut randomly positioned, and placed with identical orientation in a single embedding capsule for Tissue-Tek embedding. This approach ensures that the distance between slabs remains 2 mm independently of sectioning. Second, point counting can be performed on a small set of systematic sections from each mouse. Three typical sections are shown in Figure 1 ▶ ; a, b, and c.
Figure 1.
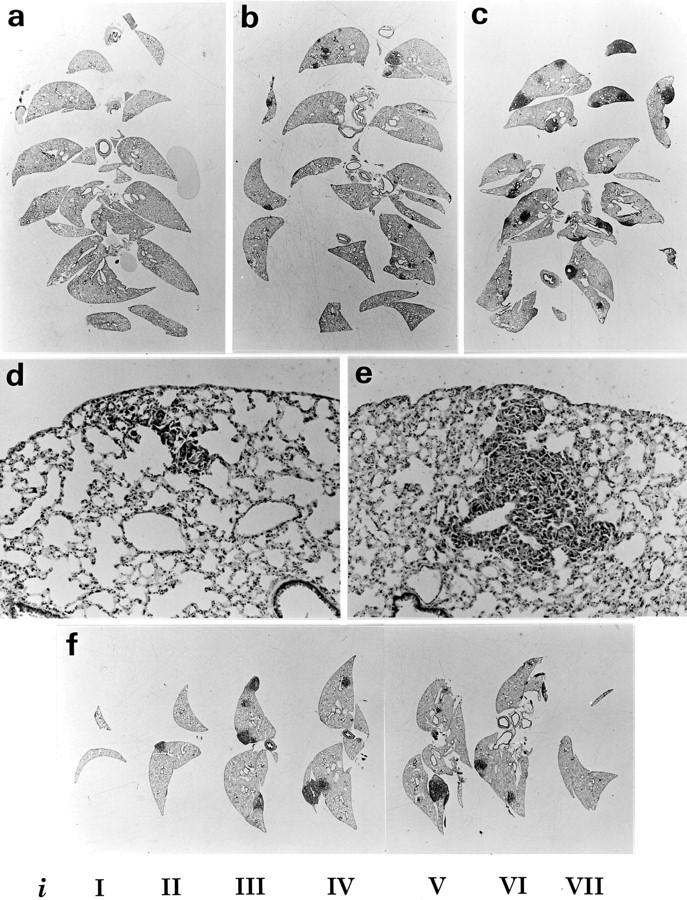
Mouse lungs with Lewis lung metastasis prepared for metastasis volume measurements. The lungs were removed 21 days after subcutaneous inoculation, processed in formalin and sucrose, and frozen in isopentane. Lungs were cut into 2-mm parallel slabs, and arranged and embedded in Tissue-Tek as described in Materials and Methods. From these blocks, 6- to 8-μm cryostat sections were obtained and H&E counterstained. The estimated metastasis volumes were 0.3 mm 3 (a), 11 mm 3 (b), and 29 mm 3 (c). The morphology of the metastases from case a is shown in d and case b shown in e. The CE (Vmet) was determined by performing point counting on individual slabs (i) nominated iI-iVII (f). This case (lung number 4 in Table 3 ▶ ) had 33-mm 3 metastasis with a precision CE = 7.8%. Original magnifications: ×3 (a, b, c, and f), ×85 (d and e).
Kinetics of Metastasis Appearance
The appearance of metastatic foci, as well as their total volume, must depend on time since transplantation of the primary tumor. We removed lungs at days 7, 10, 12, 14, 17, and 19 after transplantation. No metastases were detected in seven cases studied on day 7. Three out of eight cases had visible metastases on day 10, and two of six cases had metastases on day 12. On days 14, 17, and 19, all cases (seven on each day) had detectable metastases.
Metastasis Volume Estimations
Twenty-one days after inoculation of Lewis lung carcinoma cells into a group of nine mice, the mean primary tumor volume VPT was 2300 mm 3 with a 63% coefficient of variation (CV) (Table 2) ▶ . Lungs were removed and processed for stereological estimation of the metastasis volume (Vmet) as described in Materials and Methods. The values varied between 0.01 and 14.5 mm 3 (Table 2) ▶ . The CV of the metastasis volumes within this group was 90%. Although the two smallest metastasis volumes were measured in the mice with the two smallest primary tumors, there was no significant correlation between the VPT and the Vmet in this small material. This is not surprising, because a large variation in the metastasis volumes in the experimental animals is expected as a consequence of metastatic cells arising with a low frequency in the primary tumor.
Table 2.
Metastasis and Primary Tumor Volumes Estimated in Lungs from Lewis Lung-Bearing Mice
| Lung number | Vmet (mm3) | VPT (mm3) |
|---|---|---|
| 1 | 0.01 | 948 |
| 2 | 0.05 | 295 |
| 3 | 1.22 | 3199 |
| 4 | 1.52 | 1862 |
| 5 | 8.43 | 3974 |
| 6 | 8.74 | 2102 |
| 7 | 9.87 | 2496 |
| 8 | 10.28 | 4608 |
| 9 | 14.45 | 1141 |
| Mean | 6.1 | 2300 |
| CV, % | 90 | 63 |
Twenty-one days after subcutaneous inoculation of Lewis lung cells, the primary tumor volume (VPT) was measured using a caliper as described in Materials and Methods. Mice were sacrificed and the lungs removed and processed for metastasis volume estimation. The lungs are numbered in an increasing sequence with respect to the metastasis volume (Vmet).
Reproducibility of Vmet was analyzed by repeating point counting on the same sections by the same observer and by two different observers. The intra-observer and interobserver measurements were highly correlated with moment correlations >0.99 (calculated on log-transformed values). The hypothesis of no difference in the intra-observer means was not rejected (P = 0.71, n = 8, paired t-test). The mean intra-observer CV was 8%. However, for the interobserver measurements, the same hypothesis was rejected (P = 0.001, n = 8), because observer 1 estimated significantly larger volumes (mean, 20%; range, 4 to 32%) than observer 2, suggesting a systematic difference in the definition of the boundary of metastasis profiles.
CE Calculations
In another set of five mice, we estimated the CE on the metastasis volume (Table 1 ▶ and Figure 1f ▶ ) using the approach described by Gundersen and colleagues. 6,8 The CE (Vmet) = CEstereology was calculated using Equation 2 . The results from the five cases are shown in Table 3 ▶ . The average CEstereology of the five cases was 14.5%, range 8 to 23%. The CEstereology is a combination of the intersectional variation (CES) and the variation related to the point counting itself (CEP). CES was estimated using Equation 5 and had a mean 12.4%, range 6 to 21%, and CEP estimated by Equation 4 was 7.3%, range 5 to 10%. Therefore, the major contribution to CEstereology is related to the intersectional variation (CES), contributing with 63%, whereas CEP will only add 37%, range 16 to 51%. To the total CVbiology, Equation 6 the CEstereology will add 2.5%, indicating that the variation on the volume estimates will add essentially nothing to the total biological variation within the group. For groups like these with intra-animal variability CV ∼100%, one may well reduce the number of sections to half (using 4-mm slabs) and the total number of points counted to 50 to 100.
Table 3.
Estimated Coefficients of Error (CE) on the Metastasis Volume
| Lung number | 1 | 2 | 3 | 4 | 5 | Mean |
|---|---|---|---|---|---|---|
| Vmet (mm3) | 0.4 | 10 | 25 | 33 | 145 | |
| ΣPi | 98 | 217 | 285 | 380 | 166 | |
| Number of slabs, n | 6 | 7 | 5 | 7 | 7 | |
| CES | 0.21 | 0.08 | 0.14 | 0.06 | 0.08 | 0.12 |
| CEP | 0.10 | 0.07 | 0.06 | 0.05 | 0.08 | 0.07 |
| CE (Vmet) | 0.23 | 0.10 | 0.15 | 0.08 | 0.11 | 0.15 |
| Contribution CEP, % | 19.1 | 42.6 | 15.8 | 42.8 | 50.6 | 36.9 |
Lungs were removed 21 days after subcutaneous inoculation of Lewis lung cells and processed for point counting as described in Materials and Methods. Point counting was performed on individual slabs and CES, CEP, and CE (Vmet) were estimated using Equations 4 , 3, and 1, respectively. The contribution of CEP to the total CE is shown. The mean of the CE = √(ΣCE2/n).
Comparison of Metastasis Volumes with Number of Surface Metastases and Lung Weight
To compare the metastasis volumes with the lung weight and the number of surface metastases, we tested lungs from 14 mice. First, the lung weight was measured, then the surface metastasis count was obtained by thorough analysis under an inverted microscope. For stereological analysis, the lungs were then embedded in Tissue-Tek and processed according to the detailed description above. The results are shown in Table 4 ▶ . Calculation of Pearson’s moment correlation indicated that there was no strong correlation between the metastasis volume and the surface metastases number (r = 0.38; 95% CI, −0.19, 0.76). As an example, lung 14 had a high metastasis volume (32.4 mm3) because of many small metastases, of which only two were detectable on the lung surface. Another illustration of the discordance appears when lung 9 with a metastasis volume of 10.1 mm 3 and only three large surface metastases is compared with lung 12 that has a 1.5-fold higher metastasis volume (15.3 mm3), but 13-fold as many surface metastasis (38). In lung 1 we measured a small but distinct metastasis volume (0.1 mm3), but were unable to detect any surface metastases. Pearson’s moment correlation also indicated that there was no strong correlation between the metastasis volume and the lung weight (r = 0.42; 95% CI, −0.14, 0.78), probably because of a pronounced variation in the lung weight between healthy individuals (lowest weight = 170 mg, highest weight = 260 mg; n = 8). For example, lungs 7 and 8 had similar metastasis volumes (6.8 and 7.6 mm3), but were very different in weights (325 and 205 mg, respectively). Also between metastasis surface count number and the lung weight there was no strong correlation (r = −0.24; 95% CI, −0.68, 0.33).
Table 4.
Comparison of Metastasis Volumes with Number of Surface Metastases and Lung Weights
| Lung number | Vmet (mm3) | Number of surface metastases | Wlung (mg)* |
|---|---|---|---|
| 1 | 0.1 | 0 | 228 |
| 2 | 2.9 | 6 | 197 |
| 3 | 3.3 | 6 | 219 |
| 4 | 5.4 | 6 | 247 |
| 5 | 5.7 | 7 | 186 |
| 6 | 6.5 | 5 | 247 |
| 7 | 6.8 | 2 | 325 |
| 8 | 7.6 | 2 | 205 |
| 9 | 10.1 | 3 | 322 |
| 10 | 13.6 | 20 | 302 |
| 11 | 15.3 | 19 | 228 |
| 12 | 15.3 | 38 | 205 |
| 13 | 28.7 | 21 | 239 |
| 14 | 32.4 | 2 | 341 |
| Mean | 11.0 | 10 | 249 |
| r (Vmet) | 1 | 0.38 | 0.42 |
The lung weight (Wlung) was measured after fixation in 4% PFA, and the number of surface metastases was obtained by evaluation of the lung surface under an inverted stereomicroscope. Then, the lungs were embedded in Tissue-Tek and processed for stereological analysis to obtain metastasis volumes (Vmet) as described in Materials and Methods. The lungs are numbered in an increasing sequence with respect to the metastasis volume (Vmet).
*The range of lung weights among healthy individuals (n = 8) was 170 to 260 mg.
Discussion
We have developed an unbiased and efficient method to quantify the total volume of metastasis in mouse lungs, and have used this method to analyze metastases in mice transplanted with Lewis lung carcinomas. As predicted from the metastatic process, the metastasis volumes showed wide variation, CV = 90%, whereas the precision (CEstereology) of the single-volume estimates, Vmet, was 14.5%. This means that the variation on the volume estimates will add only 2.5% to the total variance in the groups of mice that we studied, in which total metastasis volumes varied by a factor of 200 to 1000.
CEstereology is a combination of the variation related to the sampling of slabs (intersection variation) and the variation related to the point counting. The intersection variation, CES, was 63%, and the variation related to the point counting, CEP, the remaining 37% of the total CEstereology. However, increasing the number of slabs and/or the grid density would only increase the precision of single mouse Vmet without affecting the total CV in the experimental group, and thus, would not improve the precision on the final estimate for the group of mice.
The volume estimates were highly reproducible by a given observer. The same observer estimated the same sample with a mean CV of 8%. There was a product-moment correlation >99% between two independent observers, indicating a high degree of relative agreement. However, in terms of absolute values a significant difference of metastasis volumes was estimated by two independent observers—one estimated ∼20% larger volumes than the other. This difference may be explained alone by the evaluation of points hitting the peripheral zone of metastatic tissue, and indicates that in a given experiment, all volumetric measurements should be performed by the same observer (as required by best laboratory practice). Note that the interobserver variation because of this phenomenon is maximal in a tissue that consists of very large numbers of isolated, very small lumps of cells.
Our method is based on cryostat sections and was developed with the aim to avoid imprecisions because of tissue shrinkage during paraffin embedding. Tissue shrinkage seems to be an important factor in stereology, 9,10 and has been reported to lead to misinterpretation of data. 11 The degree of tissue shrinkage may depend on the rigidity of tissue, and this may again be dependent on the content of extracellular matrix components such as collagens. We are particularly interested in enzymes that actively degrade extracellular matrix proteins, and want to compare metastases in different mouse strains with various deficiencies in matrix-degrading enzymes. Thus, we found it prudent to develop a method that minimizes the influence of tissue shrinkage.
Few studies on a direct estimation of total metastasis volume have been reported. In a study by Barbera-Guillem and colleagues, 4 liver metastasis volume fraction after intrasplenal injection of B16 melanoma cells or Lewis lung carcinoma cells were estimated by stereology. In studies by Kuruppu and colleagues, 5,12 liver metastasis volume in a murine model was estimated by stereology using another approach. First, the total liver volume was estimated using the Cavalieri principle on a dissecting microscope. Then the metastasis fraction was determined on a conventional microscope as a percentage of the total number of points hitting metastatic versus normal tissue. This percentage count was used to calculate the metastasis volume. CE values on the metastasis volumes and the interobserver variability were not reported in any of these studies.
Identification of micrometastases in lungs is an attractive goal. The smallest metastases that we observed reliably contained ∼10 cells in a section. Smaller foci were not possible to identify with certainty, at the very low primary magnification of ×4.
We compared our volumetric method with surface metastasis count and the total lung weight in a group of 14 mice, No strong correlations between any of these three measures were however obtained. The lung weight was found to be a very imprecise measure of the metastasis burden, because the overall variation in the normal lung weight blurred small weight increments caused by the metastases. The surface metastasis count was found not to account for a variation in metastasis size and not to account for small metastases within the lungs. Accordingly, we detected small metastases with the volumetric assay, which were undetectable as foci on the lung surface. Taken together, we consider it a major advantage of the volumetric assay presented here that it is unbiased by the spatial distribution and the individual size of lung metastases, and conclude that the metastasis volume is the most precise of the three methods to measure the metastasis burden.
The total number of metastatic foci in a set of lungs would also be an interesting property to determine. Counting efficiency of metastases has been improved by the use of lacZ-transfected tumor cell lines, which can be visualized after incubation with β-galactosidase substrate. 13-16 Also, B16 melanoma, which is a pigmented cell line, represents a potential alternative for a precise quantification of the metastasis number. 17 However, to the best of our knowledge, no unbiased method to determine metastasis number has been reported.
In conclusion, we have developed a method that measures the lung metastasis volume in mice with high precision. It can possibly be used for all metastatic tumor types. The method is unbiased and may significantly improve the detailed quantitative analysis of tumor cell dissemination.
Acknowledgments
We thank Eva Rahtkens Nielsen, Pia Knudsen, Pia Pedersen, and Maj-Britt Lundorf for their excellent technical assistance; and John Post for the photographic reproductions.
Footnotes
Address reprint requests to Boye Schnack Nielsen, Ph.D., Finsen Laboratory, Rigshospitalet Copenhagen University Hospital, Strandboulevarden 49, 7.2, 2100 Copenhagen, Denmark. E-mail: schnack@finsenlab.dk.
Supported by the Danish Cancer Society and the Astrid Thaysen Fund.
References
- 1.Takenaga K, Nakamura Y, Sakiyama S: Expression of antisense RNA to S100A4 gene encoding an S100-related calcium-binding protein suppresses metastatic potential of high-metastatic Lewis lung carcinoma cells. Oncogene 1997, 14:331-337 [DOI] [PubMed] [Google Scholar]
- 2.Teicher BA, Sotomayor EA, Huang ZD: Antiangiogenic agents potentiate cytotoxic cancer therapies against primary and metastatic disease. Cancer Res 1992, 52:6702-6704 [PubMed] [Google Scholar]
- 3.Kobayashi H, Shinohara H, Takeuchi K, Itoh M, Fujie M, Saitoh M, Terao T: Inhibition of the soluble and the tumor cell receptor-bound plasmin by urinary trypsin inhibitor and subsequent effects on tumor cell invasion and metastasis. Cancer Res 1994, 54:844-849 [PubMed] [Google Scholar]
- 4.Barbera-Guillem E, Barcelo JR, Urcelay B, Alonso-Varona AI, Vidal-Vanaclocha F: Noncorrelation between implantation and growth of tumor cells for their final metastatic efficiency. Invasion Metastasis 1988, 8:266-284 [PubMed] [Google Scholar]
- 5.Kuruppu D, Christophi C, Bertram JF, O’Brien PE: Characterization of an animal model of hepatic metastasis. J Gastroenterol Hepatol 1996, 11:26-32 [DOI] [PubMed] [Google Scholar]
- 6.Gundersen HJ, Jensen EB: The efficiency of systematic sampling in stereology and its prediction. J Microsc 1987, 147:229-263 [DOI] [PubMed] [Google Scholar]
- 7.Gundersen HJ, Bendtsen TF, Korbo L, Marcussen N, Møller A, Nielsen K, Nyengaard JR, Pakkenberg B, Sørensen FB, Vesterby A, West MJ: Some new, simple and efficient stereological methods and their use in pathological research and diagnosis. APMIS 1988, 96:379-394 [DOI] [PubMed] [Google Scholar]
- 8.Gundersen HJ, Jensen EBV, Kieu K, Nielsen J: The efficiency of systematic sampling in stereology-reconsidered. J Microsc 1999, 193:199-211 [DOI] [PubMed] [Google Scholar]
- 9.Gundersen HJ, Bagger P, Bendtsen TF, Evans SM, Korbo L, Marcussen N, Moller A, Nielsen K, Nyengaard JR, Pakkenberg B, Sørensen FB, Vesterby A, West MJ: The new stereological tools: disector, fractionator, nucleator and point sampled intercepts and their use in pathological research and diagnosis. APMIS 1988, 96:857-881 [DOI] [PubMed] [Google Scholar]
- 10.Hanstede JG, Gerrits PO: The effects of embedding in water-soluble plastics on the final dimension of liver sections. J Microsc 1983, 131:79-86 [DOI] [PubMed] [Google Scholar]
- 11.Schmitz A, Nyengaard JR, Bendtsen TF: Glomerular volume in type 2 (noninsulin-dependent) diabetes estimated by a direct and unbiased stereologic method. Lab Invest 1990, 62:108-113 [PubMed] [Google Scholar]
- 12.Kuruppu D, Christophi C, Bertram JF, O’Brien PE: Tamoxifen inhibits colorectal cancer metastases in the liver: a study in a murine model. J Gastroenterol Hepatol 1998, 13:521-527 [DOI] [PubMed] [Google Scholar]
- 13.Brünner N, Thompson EW, Spang-Thomsen M, Rygaard J, Danø K, Zwiebel JA: LacZ transduced human breast cancer xenografts as an in vivo model for the study of invasion and metastasis. Eur J Cancer 1992, 28A:1989-1995 [DOI] [PubMed] [Google Scholar]
- 14.Lin WC, Pretlow TP, Pretlow TG, Culp LA: Bacterial lacZ gene as a highly sensitive marker to detect micrometastasis formation during tumor progression. Cancer Res 1990, 50:2808-2817 [PubMed] [Google Scholar]
- 15.Kurebayashi J, McLeskey SW, Johnson MD, Lippman ME, Dickson RB, Kern FG: Quantitative demonstration of spontaneous metastasis by MCF-7 human breast cancer cells cotransfected with fibroblast growth factor 4 and LacZ. Cancer Res 1993, 53:2178-2187 [PubMed] [Google Scholar]
- 16.Rinker-Schaeffer CW, Wharam JF, Simons J, Isaacs JT: Development of a high-efficiency method for gene marking of Dunning prostate cancer cell lines with the enzyme beta-galactosidase. Prostate 1996, 29:60-64 [DOI] [PubMed] [Google Scholar]
- 17.Fidler IJ: Biological behavior of malignant melanoma cells correlated to their survival in vivo. Cancer Res 1975, 35:218-224 [PubMed] [Google Scholar]