

Abstract
The cytoplasmic half of S5 (5′S5) has been identified as part of the inner mouth of the pore based on evidence that mutations in this region greatly alter single channel conductance, 4-aminopyridine (4-AP) block and the rate of channel closing upon repolarization (deactivation). The latter effect, suggestive of a role for 5′S5 in channel gating was investigated in the present study. The biophysical properties of chimeric channels, in which the 5′S5 regions were exchanged between two host channels (Kv2.1 and Kv3.1) that differ in 4-AP sensitivity and deactivation rate, were examined in a Xenopus oocyte expression system. Exchange of 5′S5 between Kv2.1 and Kv3.1 confers steady-state voltage dependence of activation and rates of channel deactivation similar to those of the donor channel. The involvement of voltage-dependent gating was confirmed by the observation that exchanging the 5′S5 segment of Kv2.1 with that of Kv3.1 confers a change from slow to fast deactivation kinetics by accelerating the decay of off-gating charge movement. We suggest that a conformational change that extends from the voltage-sensor in S4 to the region of the pore lined by S5 regulates the stability of the open state. Therefore, the cytoplasmic end of S5, in addition to forming part of the conduction pathway near the inner mouth of the pore, also participates in the conformational rearrangements associated with late steps in channel activation and early steps in deactivation.
Keywords: potassium channels, gating, activation, deactivation, Xenopus oocyte
introduction
Voltage-gated K+ channels are integral membrane proteins that are assembled from four α-subunits (MacKinnon, 1991; Liman et al., 1992), each of which contains six transmembrane (S1-S6) segments (Tempel et al., 1988). Mutational analysis indicates that the ion permeation pathway contains elements of the S5-S6 linker (Hartmann et al., 1991; Yellen et al., 1991; Yool and Schwarz, 1991; Holmgren et al., 1996) and the cytoplasmic halves of S5 and S6 (Kirsch et al., 1993a ; Lopez et al., 1994; Shieh and Kirsch, 1994). Side-chain substitutions at positions that are critical for determining permeation, however, have little effect on voltage-dependent gating currents (Taglialatela et al., 1992). Instead, attention has been focused on the S4 transmembrane domain and its unique repeating motif of 5–7 positively charged residues (Arg or Lys) each separated by two intervening hydrophobic residues. This motif is conserved in voltage-gated cationic channels including calcium and sodium channels (Catterall, 1988) and is thought to be part of the voltage sensor for channel gating (Papazian et al., 1991; Liman et al., 1991; Logothetis et al., 1992). Studies using cysteine mutagenesis, in combination with either chemical modification or fluorescent labeling, indicate that the residues in the S4 segment undergo a voltage-driven translocation across the membrane electric field during activation (Yang and Horn, 1995; Mannuzzu et al., 1996). The displacement of charged residues in the S4 contribute to the gating currents (Aggarwal et al., 1996) that are responsible for regulating the voltage dependence of the probability of opening. Charge movement kinetics are directly related to the conformational rearrangements of the channel protein associated with voltage-dependent gating transitions (Bezanilla and Stefani, 1994) and are very sensitive to hydrophobic substitutions in the S4 and in other, downstream, regions of the channel (Zagotta and Aldrich, 1990; Lopez et al., 1991; McCormack et al., 1991). Recently, it has been proposed that in Shaker channels activation occurs via two voltage-dependent conformational rearrangements/subunit that produce multiple transitional steps between closed and open states (Bezanilla et al., 1994; Sigg et al., 1994; Zagotta et al., 1994). This behavior has been described by models in which the early steps of activation are independent, whereas the later steps associated with the final openćlosed transitions involve concerted interaction of the subunits. In particular, both off-gating charge movement and channel deactivation are limited by a slow first closing transition that is not predicted by independent movements of four identical subunits (Bezanilla et al., 1994; Zagotta et al., 1994). Although critical parts of the structural domains of the voltage sensor and the ion conduction pathway have been identified, the components responsible for rate-limiting transitions that couple movement of the voltage sensor to the channel opening are still unknown.
A clue to the coupling domain is that inhibition of potassium currents by intracellular blockers such as 4-aminopyridine shows marked gating dependence (Kirsch and Drewe, 1993; McCormack et al., 1994; Yao and Tseng, 1994; Stephens et al., 1994). In Shaker, Kv2.1 and Kv3.1, 4-AP preferentially enters and blocks the activated channel. Once bound, the drug can be trapped when the channel deactivates, such that its dissociation from the binding site requires channel reopening (Kirsch and Drewe, 1993; McCormack et al., 1994). Furthermore, in Shaker channels it has been shown that 4-AP interferes with a late step in activation that leads directly to opening (McCormack et al., 1994). In view of the gating-dependent nature of 4-AP block, the binding site and nearby residues may be located within structural domains that undergo late conformational change during transitions between closed and open states.
Previously, we have demonstrated that the cytoplasmic halves of both S5 and S6 specify differences in 4-AP sensitivity between Kv2.1 and Kv3.1 (Kirsch et al., 1993a ; Shieh and Kirsch, 1994). Furthermore, since mutations in the S4-S5 linker and S5 have been shown to affect gating kinetics (Zagotta and Aldrich, 1990; McCormack et al., 1991; Kirsch et al., 1993a ; Holmgren et al., 1996), we have explored the possibility of a functional role for S5 in specifying differences in the kinetics of voltage-dependent gating between Kv2.1 and Kv3.1. In the present report we show that chimeric channels formed by reciprocal exchange of the cytoplasmic ends of S5 (5′S5) resulted in changes in the rates of channel gating kinetics that were predictable from the phenotypes of the host Kv2.1 and Kv3.1 channels. Our results suggest that the cytoplasmic end of the S5 transmembrane segment regulates the rate of the first closing transition.
materials and methods
Recombinant DNA and Mutagenesis
The host clones Kv2.1 (DRK1, Frech et al., 1989) and Kv3.1 (NGK2, Yokoyama et al., 1989), and chimeric constructs were propagated in the transcription-competent plasmid vector pBluescript SK(−) in the DH5αMCR competent cells (Gibco BRL, Gaithersburg, MD). Details of the preparation of chimeras has been described previously (Kirsch et al., 1993a ). Briefly, the 5′S5/Kv2.1 chimera had a peptide sequence identical to the host Kv2.1 clone except that in the 5′ half of the S5 segment, Leu327, Gly328, and Leu332 (Kv2.1 numbering system) in the putative cytoplasmic end were replaced, respectively, with Phe, Leu, and Ile, which correspond to the equivalent residues of the Kv3.1 donor. 5′S5/Kv3.1 is a chimera between Kv3.1 and Kv2.1 in which only the Phe345, Leu346, and Ile350 (Kv3.1 numbering system) in the 5′ end of S5 of the host Kv3.1 clone were replaced by Leu, Gly, and Ile, which correspond to the equivalent residues of the Kv2.1 donor.
RNA Transcription and Oocyte Injection
DNA constructs were linearized at the 3′ ends by digestion with NotI for runoff transcription. In vitro transcription with T7 RNA polymerase was performed using the mMessage mMachine Kit (Ambion Inc., Austin, TX). The amount of cRNA synthesized (20–100 μg) was quantified by the incorporation of trace amounts of [32P]UTP in the synthesis mixture. The final cRNA product was resuspended in 0.1 M KCl at a final concentration of 250 ng/μl and stored at −80°C. The integrity of the final product and the absence of degraded RNA was determined by a denaturing formaldehyde 1% agarose gel stained with ethidium bromide. The cRNA was diluted to the desired concentrations (1–10 pg/nl for single channel or whole-cell recording; 250 pg/nl to obtain saturated channel expression for gating current recording) immediately before oocyte injection. Stage V and VI Xenopus oocytes were defolliculated by collagenase treatment (2 mg/ml for 1.5 h) in a Ca-free buffer solution (in mM): 82.5, NaCl; 2.5, KCl; 1, MgCl2; 5, HEPES (+100 μg/ml gentamicin), pH 7.6. The defolliculated oocytes were injected with 46 nl of cRNA solution (in 0.1 M KCl) and incubated at 19°C in culture medium (in mM): 100, NaCl; 2, KCl; 1.8, CaCl2; 1, MgCl2, and 5, HEPES; 2.5, pyruvic acid (+100 μg/ml gentamicin), pH 7.6. Electrophysiological measurements were performed 2–6 d after cRNA injection.
Whole-cell Current Recording
Whole-cell currents were recorded in oocytes using a two-intracellular microelectrode voltage clamp as described previously (Drewe et al., 1994). Briefly, sharp-tipped agarose-cushion micropipettes (0.2–0.5 MΩ; Schreibmayer et al., 1994) were used as voltage-sensing and current-passing electrodes connected to a commercial voltage-clamp amplifier (OC725C; Warner Instruments, Hamden, CT). Linear leakage and capacitative transient currents were subtracted online using a P/4 subtraction routine. K+ tail current relaxation from whole-cell recordings was fit to a monoexponential function to obtain a deactivation time constant.
Single Channel Recording
Cell-attached patch recording was performed after manual removal of the vitelline envelope. Isotonic KCl bathing solution was used to zero the resting potential, and the absence of resting membrane potential was verified by rupturing the membrane patch at the end of each experiment to allow direct intracellular potential measurement. Holding and test potentials applied to the membrane patch during the experiment are reported as conventional intracellular potentials. Channels were activated by rectangular test pulses from negative holding potentials. Current records were low pass filtered at 1–2 kHz (−3dB, four-pole Bessel filter), then digitized at 5–10 kHz. Linear leakage and capacitative currents were subtracted digitally using the smoothed average of 10–20 null traces in which no channel openings could be detected. Open and closed dwell time analysis was performed using idealized records (half-amplitude criterion; Transit analysis program, Vandongen, 1996). Dwell time histograms were fit to monoexponential probability density functions using a maximum likelihood estimate. Events of <0.3-ms duration were excluded from fitting to avoid error introduced by the limited recording bandwidth (1 kHz). Bursts were identified by setting a threshold for the maximum closed interval between events within a burst according to the criterion of Colquhoun and Sakmann (1985). The number of channels present in a patch was determined by observing the maximum number of channels open simultaneously at voltages where the probability of channel being open was high. Where appropriate, data are expressed as mean ± SEM.
Gating Current Recording
Gating currents were recorded from the membranes of oocytes expressing a high density of ion channels using patch-clamp methods (Heinemann et al., 1992). Sylgard-coated macropatch pipettes with diameter >10 μm were used to record from excised, inside-out membrane patches containing many channels. To eliminate the ionic currents, intracellular permeant cations (bath solution) were replaced by N-methyl-glucamine, and extracellular permeant cations (pipette solution) by tetraethylammonium. Membrane currents were evoked by rectangular test pulses from a holding potential of −90 mV. The records were low-passed filtered at 2 kHz (−3dB, four-pole Bessel filter) and digitized at 50 kHz. The linear components of residual leakage and capacitative currents were subtracted online using a −P/4 procedure using a subtraction holding potential, −100 mV. Gating charge (Q) was obtained from the time integral of the gating current for the duration of the test pulse. The charge vs. voltage (Q-V) curve was generated by plotting normalized charge as a function of voltage. Each data set was fitted by a Boltzmann equation:
 |
where V is the pulse potential, V 0.5 is the half-activation potential, z is the effective valence, F is Faraday's constant, R is the universal gas constant, and T is the absolute temperature. The decay phase of gating current was fit to a biexponential decay function to determine the fast and slow components.
Numeric simulations of ionic and gating currents were obtained using Axovacs software (Axon Instruments, Foster City, CA) modified to accept Markov gating schemes (provided by Dr. Stephen Jones, Case Western Reserve University).
Solutions and Drugs
For gating current measurement, the oocyte was bathed in solution containing (mM): 120, N-methylglucamine; 120, glutamate; 10, EGTA; and 10, HEPES, pH 7.2 with N-methylglucamine. The pipette solution contained (mM): 122.5, tetraethylammonium hydroxide; 122.5, methane sulfonic acid; 2, CaCl2; 10, HEPES, pH 7.3 with NaOH. A modified Ringer's solution for whole-cell recording consisted of (in mM): 120, NaCl; 1, CaCl2; 2, MgCl2; 10, HEPES, pH 7.2 (with Tris-OH). The desired high external K+ solution was made by substituting the NaCl with KCl. Depolarizing isotonic KCl bath solution for single channel recording consisted of (in mM): 100, KCl; 10, EGTA; 10, HEPES, pH 7.3. Pipette solution was normal frog Ringer's solution containing (in mM): 120, NaCl; 2, KCl; 2, CaCl2; 10, HEPES, pH 7.2. When high K+ concentration was needed in the patch pipette, the Na+ was replaced with desired concentration of K+. Bathing solution flowed continuously at a rate of 3 ml/min. All electrophysiological measurements were made at room temperature (21–23°C).
results
Effects of S5 Chimeric Mutations on Macroscopic Ionic Currents
We examined the effects of reciprocal exchanges, between Kv2.1 and Kv3.1, of the cytoplasmic half of transmembrane segment, S5 (5′S5), in chimeric channels. The influence of 5′S5 on channel gating was readily observed at the macroscopic level in records obtained from cell-attached membrane patches containing many channels (“macropatches,” Fig. 1). Inward tail currents were evoked in patches exposed to elevated extracellular [K+] by a double pulse protocol in which a variable test step (−120 to +40 mV) was applied immediately after a fixed conditioning pulse to +60 mV that evoked maximum activation. At test potentials more negative than the activation range (−120 to −40 mV), the time course of decay of the tail currents reflects the voltage-dependent closing rate (deactivation) of the channels. The time constant of deactivation (Fig. 2) was estimated by fitting the tail currents during the test pulse to a monoexponential decay. The fit excluded the first 0.1 ms of the test pulse to allow for clamp settling. As shown in Fig. 2, the time constant was voltage dependent such that deactivation became progressively slower at depolarized test potentials that approached the activation range (>−40 mV). Chimeric substitutions of S5, however, markedly changed the rate of deactivation. The 5′S5/Kv2.1 chimera (Fig. 1 B) that contained the cytoplasmic half of S5 from the fast-gating Kv3.1 channel (Fig. 1 C), showed markedly faster deactivation rates compared to its host Kv2.1 channel (Fig. 1 A). At strongly hyperpolarized test potentials (−150 to −60 mV; Fig. 2) where the forward rates of activation were negligible, the faster decay of the tail currents reflected primarily an acceleration of the channel closing rate. In the reciprocal experiment, the 5′S5/Kv3.1 chimera (Fig. 1 D) that contained the cytoplasmic half of S5 from the slow-gating Kv2.1 channel, showed a 10–50-fold slowing of deactivation throughout the test potential range compared to its host Kv3.1 channel (Fig. 1 C), consistent with participation of the 5′S5 region in controlling the rate of channel closing.
Figure 1.

Effect of chimeric S5 mutation in Kv2.1 on macroscopic activation and deactivation. Macroscopic currents were recorded from cell-attached membrane patches containing many channels in oocytes injected with cRNA: Kv2.1 (A), 5′S5/Kv2.1 (B), Kv3.1 (C), or 5′S5/Kv3.1 (D). The pipette (extracellular) solution contained 60 mM KCl to facilitate measurement of inward tail currents. A conditioning potential to +60 mV from a holding potential of −80 mV maximally activated the channels. Each panel illustrates outward currents during the conditioning step and inward tail currents during return steps to test potentials from −120 to −40 mV in 20-mV increments.
Figure 2.

Voltage dependence of deactivation rate. Deactivation time constants were obtained by fitting the tail currents to monoexponential decay functions and were plotted semilogarithmically versus test potential: Kv2.1 ( filled circles), 5′S5/Kv2.1 (open circles), Kv3.1 ( filled squares), or 5′S5/Kv3.1 (open squares). The first 0.3 ms of the tail current was ignored during curve fitting to avoid limitations imposed by the clamp settling time. Each symbol represents average data from 5–10 membrane patches.
In contrast, to the effects of S5 exchange on the deactivation rate, the effects on activation were much less marked. Visual inspection of the rise time of outward currents during conditioning steps to +60 mV (Fig. 1) suggests that the activation kinetics of the chimeric channels resembled that of the host channel. A quantitative comparison of the kinetics of the late phase of activation associated with the final transition to the open state (Hoshi et al., 1994) was obtained by determining activation time constants from monoexponential fits of 50–90% of the rising phase of the test pulse currents. Thus at a test potential of +60 mV for Kv2.1 and the 5′S5/Kv2.1chimera, respectively, activation time constants of 11.5 ± 0.3 ms (n = 10) and 21.2 ± 0.2 ms (n = 9) were obtained; and for Kv3.1 the 5′S5/Kv3.1 chimera, respectively, 3.5 ± 0.2 ms (n = 5) and 2.7 ± 0.7 ms (n = 8) were obtained. It should be noted that the chimeric mutations caused shifts in the steady-state voltage dependence of activation (see below) that markedly affect activation time constants at test potentials that evoke less than maximum activation. However, the large differences between deactivation time constants in the host and chimera for both sets of channels over an 80 mV range (Fig. 2) and the similarities between the activation time constants argue that changes in the channel deactivation rate by exchanging the 5′S5 region are not secondary to shifts in the steady-state voltage dependence of activation. These results suggest that the 5′S5 region exerts rate-limiting control of gating transitions primarily during the deactivation process.
Effects of S5 Mutations on Microscopic Gating
Since deactivation is a macroscopic property that can be influenced by secondary transitions between closed states, we examined the rate of channel closing directly by single channel recording. Single channels (Fig. 3) were activated by conditioning steps to +40 mV from a holding potential of −60 mV, and the duration of the open state was determined during the return to a test potential of −80 mV. The patch pipette contained 60 mM K+ to facilitate the measurement of inward K+ current. In Kv3.1 (Fig. 3 A) rapid deactivation was correlated with extremely brief openings (mean open time = 1.6 ± 0.2 ms, n = 3 patches) during the −80-mV test potential and no reopenings were observed. The ensemble average from 500 traces of single channel recordings gave a tail current with deactivation time constant of 3 ms obtained by fitting a single exponential decay. This value is similar to the mean open time at −80 mV and to the deactivation time constant observed in whole-cell recordings of tail currents. By contrast, in Kv2.1 (Fig. 3 C) bursts of openings (mean burst duration = 10.0 ± 2.2 ms, n = 6 patches) were recorded upon return to −80 mV. The burst duration corresponded to the time constant of deactivation obtained from the ensemble average currents (τ = 9.1 ± 1.7 ms, n = 6 patches). The fast and slow kinetics of open to closed transitions in Kv3.1 and Kv2.1, respectively, were reciprocally transferred by swapping the cytoplasmic half of S5, as shown in 5′S5/Kv3.1 (Fig. 3 B) and 5′S5/Kv2.1 (Fig. 3 D). Thus the 5′S5/Kv3.1 (Fig. 3B) mutation of Kv3.1 caused the mean open time at −80 mV to increase from 1.6 to 19.3 ms (n = 3 patches), and multiple reopenings were observed. Conversely, the 5′S5/Kv2.1 (Fig. 3 D) mutation of Kv2.1 resulted in channels with reduced conductance (Kirsch et al., 1993b ) and marked changes in kinetics; during depolarizing test pulses the channels opened briefly (mean open time 0.9 ms ± 0.2, n = 4 patches) but repetitively. Unlike the host Kv2.1 channels, upon repolarization to −80 mV the /Kv2.1 channels stayed open very briefly and rarely reopened.
Figure 3.

Effects of S5 mutations on single channel tail currents. Single-channel currents in Kv3.1 (A), 5′S5/Kv3.1 (B), Kv2.1 (C), and 5′S5/Kv2.1 (D) were recorded from cell-attached patches and the ensemble averages of 300–500 traces (except 5′S5, 128 traces). The patch membrane was pulsed to +40 mV for 200 ms and then returned to the holding potential of −80 mV. Pipette solution containing 60 mM NaCl and 60 mM KCl, and oocytes were bathed in a depolarizing isotonic KCl solution.
Mutation Effects on First Latency Distributions
The distribution of the latency to first opening provides insight into the kinetics of activation during transitions from rest to open states. Upon reaching the open state, if channels do not readily close into either an inactivated or closed state, the cumulative distribution of first latencies will follow closely the time course of macroscopic activation (Hoshi et al., 1994). Alternatively, if the open state is unstable such that transitions into closed states are rapid relative to transitions from closed to open states, the time course of first latencies will be slower than that of macroscopic activation. Single channel recordings were made in the cell-attached mode using patch pipettes containing normal frog Ringer solution (Fig. 4 A) to maximize outward currents. Currents were evoked by test pulse potentials of +40 mV from a holding potential of −60 mV. The mean open time (pooled data, n = 3–4 patches) for Kv2.1 and 5′S5/Kv2.1 was 12.0 ± 0.7 and 1.7 ± 0.2 ms, respectively, and 16.5 ± 1.5 and 25.0 ± 2.8 ms for Kv3.1 and 5′S5/Kv3.1. In addition, comparison of the traces obtained from Kv2.1 and 5′S5/Kv2.1 patches revealed a mutation-induced decrease in the steady-state probability of opening (Po) in the 5′S5/Kv2.1 chimera due to a simultaneous reduction in open time and an increase in duration of the closed time intervals. At a test potential of 60 mV (data not shown) the average Po obtained from traces in which only one channel appeared to be active was 0.91 and 0.05, respectively, for Kv2.1 and 5′S5/Kv2.1 channels (n = 3–4 patches). Moreover, the time-to-first opening from the beginning of the test pulse (first latency, Fig. 4 B) was relatively slow in the chimera (open circles) compared with its host channel (filled circles). From the cumulative distributions of first latencies we obtained an average t1/2 (half-rise time of the cumulative distribution of latencies, n = 3–4 patches) of 1.5 ± 0.1 and 1.6 ± 0.1 ms for Kv3.1 and the 5′S5/Kv3.1 chimera, respectively; and 19.3 ± 5.2 ms for Kv2.1 and 58.7 ± 7.9 ms for the 5′S5/Kv2.1 chimera. Since first latency measures the delay associated with transit through multiple closed states before channel opening, our results indicate that chimeric mutations of S5 had no effect on the rate-limiting steps of activation when Kv3.1 was the host but caused at least a twofold slowing when Kv2.1 was the host channel. It should be noted that the first latency time course is markedly affected by the correction of the data for the number of channels in the patch (i.e., increasing the number of channels results in apparently shorter first latencies). This was not a problem for Kv2.1, Kv3.1, or 5′S5/Kv3.1 where the steady-state Po was near unity, and single channel patches were easily obtained. However, for 5′S5/Kv2.1 channels, because of their extremely low Po, single channel patches could not be obtained, and the number of channels in each patch was likely to be underestimated. Therefore, the effect of this mutation on the corrected first latency distributions should be considered a minimum approximation of the actual slowing.
Figure 4.

Cumulative first latency distributions. First latency distributions were obtained at +40 mV by patch-clamp single channel recording in the cell-attached mode. (A) Shows representative records in Kv3.1, 5′S5/Kv3.1, Kv2.1, and 5′S5/Kv2.1 channels. Pipette solution was normal Ringer containing 120 mM NaCl, and 2.5 mM KCl. Oocytes were bathed in a depolarizing isotonic KCl solution. (B) Shows the cumulative distribution of first latencies (from the representative experiments in A) at test potential +40 mV: Kv3.1 (open squares), 5′S5/Kv3.1 ( filled squares), Kv2.1 (f illed circles), and 5′S5/Kv2.1 (open circles), respectively. All data were obtained from single channel patches except 5′S5/Kv2.1 (3–8 channels/patch estimated from the maximum number of overlapping open channel events). These data were corrected (Aldrich et al., 1983) by taking the Nth root of the cumulative distribution (expressed as a survivor function, where N = 4, the estimated number of channels/patch in this experiment). As discussed in the text, because of the low Po of this mutant channel, the correction underestimates the slowing effect. (C) Compares the first latency distributions for Kv2.1 and 5′S5 obtained from the kinetic model described in Fig. 6.
Kinetic Model Simulation of S5 Mutations
The primary effect of the 5′S5 exchange at the macroscopic level appears to be an alteration of the deactivation rate, and at the microscopic level, these effects may be correlated with changes in transition rates associated with states near the open state of the fully activated channels. As a starting point we suggest that the effects of 5′S5 mutations on Kv2.1 channels can be explained by a simple sequential scheme:
 |
We assume that transitions C1↔ C2 and C2↔ C3 are voltage dependent with forward and backward rate constants at 0 mV of 60 and 100 s−1, respectively; and effective valences (z) of 0.63 and −1.0, respectively. The transition C3→ O4 was assumed to be very rapid and voltage insensitive, corresponding to the properties of the mean closed interval within bursts at test potentials in the range 0 to +60 mV (Taglialatela et al., 1993). By contrast, the reverse rate O4→ C3 was assumed to be slightly voltage dependent, corresponding to the properties of the mean open time in the range −90 to +80 mV (Fig. 5). A reasonable approximation to the measured single channel data was obtained by setting the C3→ O4 rate to 1,000 and 20 s−1 in Kv2.1 and 5′S5, respectively; and by setting the reverse rate, O4→ C3 at 0 mV (z = 0.2 e −), to 150 and 1,000 s−1 in Kv2.1 and 5′S5/Kv2.1, respectively. The other voltage-dependent rate constants were assumed to be unaltered by the mutations, and no changes in effective valences were made. In 5′S5/Kv2.1 channels these changes in rate constants have the observed effect of markedly shortening the mean single channel open time from 7 to 1 ms, lengthening the major closed interval from 1 to 50 ms and markedly reducing open probability during maximal activation (from 0.86 to 0.04). As shown in the simulated whole cell current records (Fig. 6, A and B), such a model predicts that in 5′S5/Kv2.1, tail current time course will become very rapid compared to that of the host channel and will approach the mean single channel open time at test steps in the range −120 to −80 mV; i.e., the channel opens only once during the tail, as observed in Fig. 3. Moreover in 5′S5/Kv2.1, because of its slow entry into O4 relative to its rapid exit rate (O4→ C3) the first latency time course (Fig. 4) will be slow even though macroscopic activation (Fig. 6 A) is relatively unaffected compared with Kv2.1.
Figure 5.

Voltage dependence of single channel open time in Kv2.1. Mean open times were estimated from the time constant obtained by fitting a single exponential to the open time histogram. Each histogram was constructed from >100 events in a patch at a given test potential, and each plotted point gives the time constant obtained from a single patch. Data were obtained in cell-attached patches exposed extracellularly to high [K+]o solution (either 120 or 60 mM). The solid line was fit according to the equation: where z = equivalent valence, 0.22 e− and τ0 = 6.4 ms.
Figure 6.

Numeric simulation of macroscopic currents in Kv2.1 and 5′S5/Kv2.1 using a sequential model. The effect of the mutation was assumed to be a destabilization of the open state caused by a sevenfold acceleration of the first closing step, O4→ C3, and a 50-fold slowing of the last opening step, C3→ O4. A and B show simulated tail currents, comparable to the actual records illustrated in Fig. 1. C and D show the predicted gating currents and Po-V relationships for the two channels. In D the smooth curves represent fits to single Boltzmann distributions with midpoint potentials (and slope factors) of −6 (11) and 68 (31.5) mV, respectively in Kv2.1 and 5′S5/Kv2.1. As indicated by the broken lines a better fit of the 5′S5/Kv2.1 data was obtained by using the sum of two Boltzmann distributions.
The model makes several testable predictions (Fig. 6, C and D): (a) the time course of the gating charge movement upon repolarization from a test step that maximally activates the channel should be much faster in 5′S5/Kv2.1 than in Kv2.1, whereas the time course during the activation step should be unchanged (Fig. 6 C); (b) the voltage dependence of the steady-state activation (Po-V relationship) should be shifted to more positive potentials in 5′S5/Kv2.1 compared with Kv2.1 and will fail to saturate in the measurable range (i.e., below +80 mV, Fig. 6 D); (c) the steady-state voltage dependence of gating charge movement (Q-V relationship, not shown) will not change.
Effects of Mutation on Gating Currents
Gating currents were measured to verify the model and to determine whether ion occupancy could be involved in the observed kinetic changes. Deactivation, but not activation, rates in delayed rectifier K+ channels are thought to be sensitive to ion occupancy of the pore (Swenson and Armstrong, 1981; Matteson and Swenson, 1986). Therefore, we were concerned that the selective effects of S5 chimeric mutations on the closing rate of the channels might be the indirect result of mutation-induced changes in ion occupancy. We addressed these issues by measuring gating currents in the presence of impermeant ion substitutes. Gating currents were recorded using macropatch methods (Heinemann et al., 1992) in Xenopus oocytes that expressed a high density of channels. Fig. 7 presents a comparison of the time course of gating currents in oocytes expressing Kv3.1, Kv2.1, and 5′S5/Kv2.1 chimera (the level of expression of the 5′S5/Kv3.1 chimera was too low to allow resolution of the gating currents). Each panel shows a gating current-voltage family evoked by test pulses (20-ms duration, −80 to +40 mV amplitude, Kv2.1 and 5′S5/Kv2.1 chimera; or −60 to +60 mV, Kv3.1) in 20-mV increments from a holding potential of either −100 mV (Kv2.1 and 5′S5/Kv2.1 chimera) or −90 mV (Kv3.1). Test pulses evoked outward, ON-gating current (Ion) that rose to a peak whose amplitude was dependent on test pulse potential (Fig. 7 A). Ion then decayed to the baseline in a biphasic manner. The relative contributions of the fast and slow components of the decay were voltage sensitive: at low depolarizations (<+40 mV), the slow component of decay phase was prominent, whereas at high depolarizations (>+40 mV) the fast component dominated. At the end of the test pulse the return to the holding potential evoked inward OFF-gating current (Ioff) transients that decayed rapidly to the baseline.
Figure 7.

Gating currents measurements. Nonlinear capacitative currents in Kv3.1 (A), Kv2.1 (B), and 5′S5/Kv2.1 (C) were recorded in inside-out patches in the absence of permeant cations (NMG and TEA, respectively, were substituted in the internal and external solutions). The traces illustrate typical recordings obtained at test pulse potentials of −60 to +60 mV (20-mV increments) for Kv3.1, or −80 to +40 mV (20-mV increments) for Kv2.1 and 5′S5/Kv2.1 were applied from a holding potential of −90 mV. Linear components of the leak and capacitative currents were subtracted on-line using a P/−4 protocol (subtraction holding potential = −100 mV). No signal averaging was used. In A and B the first 0.3 ms of the ON and OFF transients are blanked because of imperfect subtraction.
In comparing the two host channels (Fig. 7) the most striking feature of the gating currents was the marked acceleration of the kinetics of both Ion and Ioff in Kv3.1 (A) compared with Kv2.1 (B). The chimeric 5′S5/Kv2.1 channel (C) shows a mixture of the two host gating phenotypes: the time course of Ion was similar to that of the host Kv2.1 channel whereas the time course of Ioff resembles that of the donor Kv3.1 channel. Consistent with the pattern observed in Kv3.1 (A), the decay of Ion and Ioff in Kv2.1 and 5′S5/Kv2.1 exhibited both fast and slow phases. A quantitative comparison between gating current kinetics among Kv3.1, Kv2.1, and 5′S5/Kv2.1 was made by fitting exponential decay functions to the gating currents. In each of the three channels, the decay of Ion could be accurately fit by to a biexponential function in which the time constant of the slow phase was about 10-fold slower and its amplitude 10-fold smaller than those of the fast time phase. As plotted in Fig. 8 A, at any given test potential Ion was dominated by a fast time constant that was substantially faster in Kv3.1 than in Kv2.1. Likewise for Ioff (Fig. 8 B) the decay time course observed in Kv3.1 was markedly faster in Kv3.1 than in Kv2.1. Substitution of the cytoplasmic end of S5 in Kv2.1 with that of Kv3.1 gave a hybrid kinetic pattern. Fig. 8 A shows that for Ion, the predominant time constant observed in 5′S5/Kv2.1 was unchanged from that of Kv2.1 and was much slower than that of Kv3.1. Fig. 8 B shows that for Ioff, both the time course of decay for 5′S5/Kv2.1 channels was similar to that observed in Kv3.1 and faster than that seen in Kv2.1 channels. Thus, transplanting the cytoplasmic half of S5 from Kv3.1 into Kv2.1 converted the kinetics of Ioff to resemble those of the donor channel, Kv3.1, but allowed retention of the on-gating kinetics of the host Kv2.1 channel. These results, although obtained under markedly different ionic conditions, closely resemble the effects on ionic currents.
Figure 8.
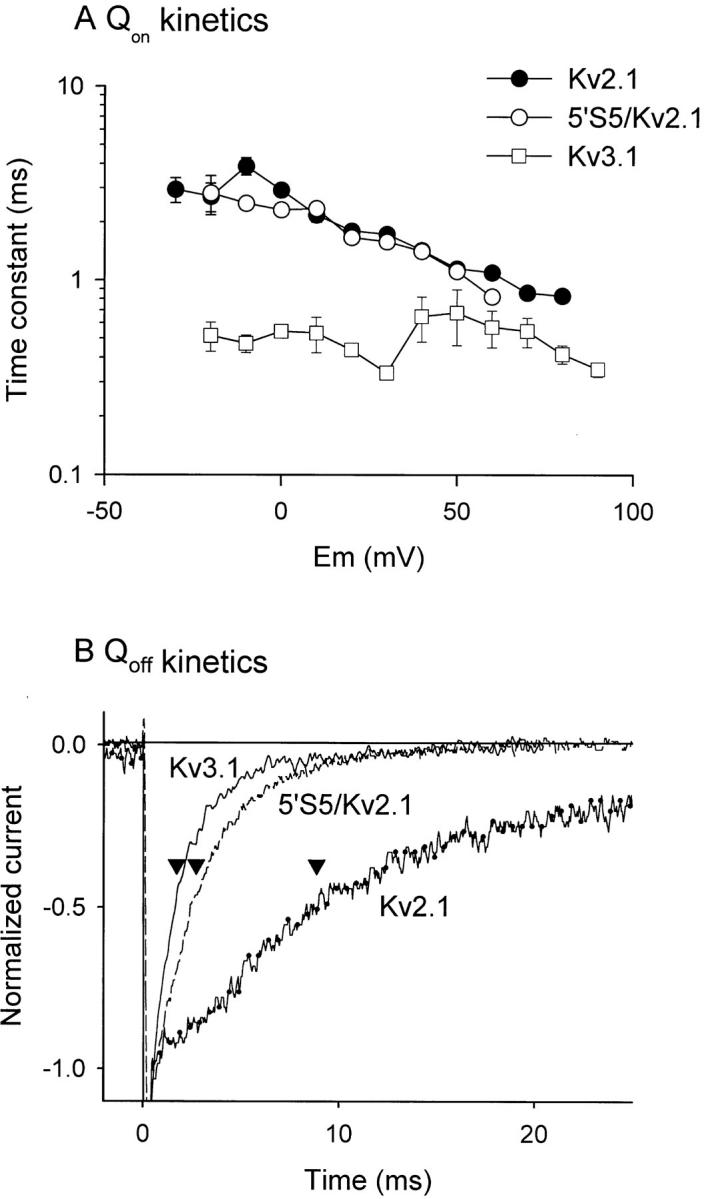
Mutations in 5′S5 selectively affect OFF gating current kinetics. A shows a semilogarithmic plot of the time constant of the major component of Ion decay in Kv2.1 ( filled circles), 5′S5/Kv2.1 (open squares), and Kv3.1 (open triangles) versus test potential. Time constants were obtained by fitting the decay phase of the on-gating current to a biexponential function and at each potential the time constant of the component that accounted for >90% of the decay was selected. Each symbol represents the average of 5–10 patches for each channel. B compares the time course of Ioff decay in peak-normalized Ioff records obtained from Kv3.1 (solid line), 5′S5/Kv2.1 (broken line), and Kv2.1 (dotted line) at a return potential of −90 mV after conditioning steps to produce near maximum activation (+60 mV for Kv3.1, 5′S5/Kv2.1 and +40 mV for Kv2.1). The arrowheads mark the time constants obtained by fitting the traces to monoexponential functions. The average time constants obtained from 5 to 10 membrane patches for each channel was 0.75 ± 0.15, 0.80 ± 0.51, and 8.10 ± 1.39 ms, respectively, in Kv3.1, 5′S5/Kv2.1, and Kv2.1.
Effects of S5 Mutations on Steady-state Voltage Dependence of Activation
The amount of charge displaced during activation was obtained from the time integral of Ion at each test potential for the host channels Kv2.1 and Kv3.1 and for the chimeric 5′S5/Kv2.1 channel in which Kv2.1 was the host and Kv3.1 the donor channel. The gating charge activation curve (Q-V curve) was generated by plotting the normalized charge displaced versus test potential, and the curve was fitted with single Boltzmann equation (Fig. 9 A). The steady-state activation curve (G-V curve, Fig. 9 B) was obtained by plotting normalized ionic conductance versus test potential in separate experiments. The fitted half-activation potential (V0.5) of the Q-V relationship was 13 ± 2 mV and −25 ± 4 mV for Kv3.1 and Kv2.1, respectively. Similarly, the half-activation potentials of the G-V relationship were 20 ± 2 and 10 ± 1 mV for Kv3.1 and Kv2.1, respectively. The effective valence for Kv3.1 was 2.8 ± 0.2 and 2.0 ± 0.3 e− for Kv2.1. In the 5′S5/Kv2.1 chimeric channel, the Q-V curve remained the same as that of Kv2.1, with V0.5 of −22 ± 3 mV and effective valence of 1.7 ± 0.1 e. However, the 5′S5/Kv2.1 substitution caused a positive shift in the G-V curve with apparent V0.5 of 27 ± 4 mV compared with 10 ± 1 mV in Kv2.1. The actual shift may have been larger than indicated by curve-fitting of normalized data since the 5′S5/Kv2.1 G-V curve did not saturate at the most positive test potentials available experimentally. These results are comparable to those predicted by model simulation (Fig. 6 D). In the model for the O4→ C3 step is slightly voltage dependent such that its rate constant becomes slower with depolarization and should contribute to the voltage dependence of Po. In Kv2.1, the effect is negligible since this rate is quite slow compared to the voltage independent C3→ O4 step, and Po saturates at a level of about 0.9 at test potentials >0 mV. In contrast, for the 5′S5/Kv2.1 chimera, the O4→ C3 step dominates the final step in activation and is responsible for the very low Po observed experimentally. The voltage dependence of this step causes Po to continue creep upwards at test potentials >+40 mV.
Figure 9.
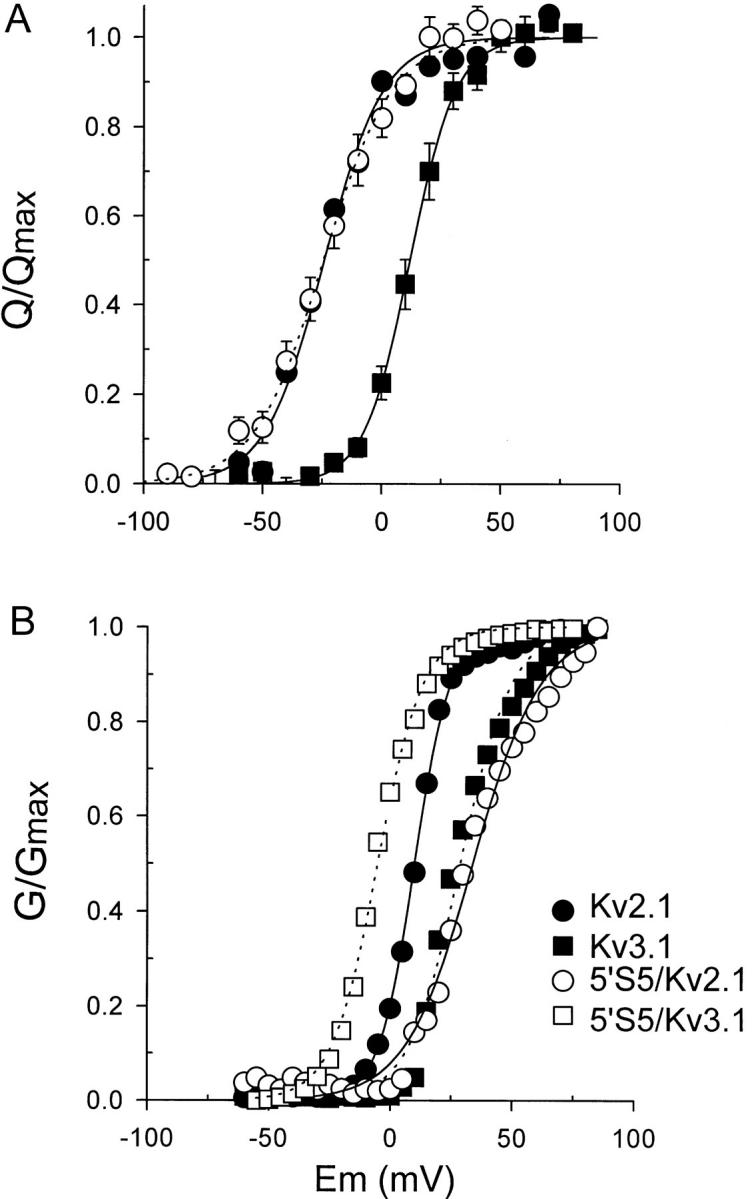
Voltage dependence of steady-state activation. Gating charge (A) was obtained from the time integral of Ion and was normalized to the maximal gating charge (Q max). Normalized charge was plotted versus test potential (Q-V) for Kv2.1 ( filled circles), 5′S5/Kv2.1 (open circles), and Kv3.1 ( filled squares). The conductance-voltage (G-V) relationship (B) was obtained by normalizing ionic conductances at each test potential by the maximal conductance. Normalized conductance was plotted for 5′S5/Kv3.1 (open squares), Kv2.1 ( filled circles), Kv3.1 ( filled squares), and 5′S5/Kv2.1 (open circles). Both Q-V and G-V data were fit to single Boltzmann functions (smooth curves). Data were pooled from >5 experiments (patches or oocytes, respectively, in A and B). For Kv2.1 the midpoint (V0.5) potentials were 10 and −25 mV, respectively for the G-V and Q-V curves, whereas V0.5 values for Kv3.1 were 20 and 0.9 mV. The midpoint of the Q-V curve for the 5′S5/Kv2.1 chimera was nearly identical to that of Kv2.1 (V0.5 = −22 mV), but the G-V curve (B; V0.5 = 22 mV) was shifted toward that of Kv3.1. The valence z for the gating charge (obtained from the slope of the Q-V curve) was the same in both Kv2.1 and the 5′S5/Kv2.1 chimera.
For 5′S5/Kv3.1 the midpoint of the G -V curve was −25 ± 2 mV consistent with a transfer of at least part of the gating phenotype of the donor Kv2.1 channel. Thus, a reciprocal change in the steady-state voltage dependence activation was produced in Kv2.1 or Kv3.1 by swapping the cytoplasmic half of S5 transmembrane segment.
discussion
Structural Basis of Gating Differences between Kv2.1 and Kv3.1
Kv2.1 and Kv3.1 are related voltage-gated K+ channels that have distinct gating phenotypes: Kv2.1 has markedly slower activation and deactivation rates compared with Kv3.1, and operates over a more negative voltage range. The effect of exchanging the cytoplasmic halves of S5 between the fast-gating Kv3.1 and slow-gating Kv2.1 channels had predictable effects on the rates of macroscopic deactivation in the chimeras. The macroscopic activation rates were relatively unaffected. At the microscopic level this suggests that S5 contributes to the regulation of the final step in activation that leads directly to channel opening and, upon repolarization, is the first closing step in deactivation.
A simple kinetic explanation for most of our results is that in the rapidly deactivating 5′S5/Kv2.1 chimera the open state is destabilized by marked acceleration of the closing rate and slowing of the opening rate. This results in decreased probability of opening and a rightward shift in the G -V curve along the voltage axis with little change in Q-V, and a marked decrease in the time constants of both deactivation and Ioff. Conversely, the electrophysiological phenotype of the 5′S5/Kv3.1 chimera was consistent with stabilization of the open state.
Our kinetic model is inaccurate, however, in its prediction that the time course of activation should be unchanged in 5′S5/Kv2.1 channels compared with Kv2.1 (Fig. 6), whereas an almost twofold slowing of the late phase of activation was observed in the mutant channels (Fig. 1). A more accurate model could be constructed based on kinetic analyses of gating in Shaker K channels which indicate that during activation the channel undergoes a series of voltage-dependent transitional steps from a resting state to a pre-open, permissive state, followed by a concerted movement that opens the ion conduction pathway (Bezanilla et al., 1994; Sigg et al., 1994; Zagotta et al., 1994). The concerted nature of the final step may involve functional interactions between subunits such as those observed previously to originate from the structural components of the pore itself (Kirsch et al., 1993b ; Ogielska et al., 1995). Therefore, changes in an additional free parameter corresponding to the allosteric interaction could be invoked to account for the slowing of macroscopic activation in 5′S5. However, this does not alter our main conclusion that the 5′S5 region regulates the final step.
Our gating current results suggest that fundamental differences in the kinetics of the voltage-dependent charge movements underlie the observed differences in the kinetics of the ionic currents between the two host channels. Thus, we found that the decay of both Ion and Ioff in Kv3.1 was significantly faster in Kv3.1 compared with Kv2.1. Also, we found that both the Q-V and the G -V relationships were shifted in the positive direction, and the steepness of the curves was greater in Kv2.1 compared with Kv3.1. However, the 5′S5/Kv2.1 chimera retained the Q-V curve and Ion kinetics of the host channel. Therefore, the differences between Kv3.1 and Kv2.1 cannot be attributed entirely to different 5′S5 residues but may reflect the contribution of other regions of the protein. Differences in the number of charged residues in S4 are an obvious candidate; the first Arg residue in the S4 segment of Kv3.1 (corresponding to Arg362 in Shaker) is replaced by an uncharged Gln in Kv2.1. However, in Shaker (Pappazian, 1991) and its mammalian homolog (Kv1.1; Liman et al., 1991; Logothetis et al., 1992), Gln substitution shifts the G-V curve in the wrong direction (i.e., to more positive potentials). Alternatively, multiple substitutions among nonconserved, uncharged residues in the S4 can have marked effects on the position of the G-V curve along the voltage axis (Logothetis et al., 1993). Whether mutations of these nonconserved residues can affect the position of the Q-V curve or the kinetics of the gating currents has not been determined. However, Val substitution for highly conserved Leu residues in Shaker S4 segments is known to have dramatic effects on the position of both the G-V and Q-V curves (Schoppa et al., 1992).
In the present study, each chimeric construct included multiple mutations in the cytoplasmic half of S5 in Kv2.1 (Leu327→ Phe, Gly328→ Ile, Leu332→ Ile) or Kv3.1 (Phe345→ Leu, Ile346→ Gly, Leu350→ Ile). We found previously (Shieh and Kirsch, 1994) that in Kv2.1 the point mutations, G328I or L332I were more effective than L327F in shifting the G-V curve to the right and in reducing single channel open time. L332I, in particular, reduced the single channel open probability from about 0.85 to 0.05, a value similar to that obtained in the 5′S5/Kv2.1 mutant. Moreover, in Shaker, Phe401, the corresponding residue, when mutated to Ile also shifts the G-V curve to more positive potentials (Zagotta and Aldrich, 1990). The highly conservative nature of the Kv2.1 Leu/Ile substitution and the similarity to Shaker results suggests that this position may be a critical determinant of differences in gating between channel isoforms. Previous work in Shaker also has shown that point mutations involving Leu residues in S5 can affect the rate and apparent voltage dependence of channel activation (McCormack et al., 1991). For instance, the first Leu in S5 of Kv2.1 (corresponding to Leu496 in Shaker) is part of a highly conserved leucine-heptad repeat structure that has been suggested as a participant in allosteric interactions between S4 and the pore (McCormack et al., 1991; McCormack et al. 1994). Leu/Val substitution in S5 (Leu396 in Shaker) caused a moderate negative shift in the G-V curve, but in Kv2.1, Phe substitution of the corresponding Leu (Kv2.1 L327F) had little effect on gating (Shieh and Kirsch, 1994). Whether other strictly conserved residues such as Leu329, Leu330 or Phe333 are functionally critical remains to be determined.
In summary, our results indicate that residues in 5′S5 regulate channel deactivation. The effects of mutation on tail current kinetics seem to be specific since the mutual exchange of three residues between Kv2.1 and Kv3.1 produced reciprocal effects on channel closing rate. The change in deactivation kinetics was accompanied by a change in the kinetics of off-gating charge movement. The results suggest that the 5′S5, in addition to forming part of the inner mouth of the pore (Kirsch et al., 1993a; Shieh and Kirsch, 1994), helps to regulate the final transition to and from the open state.
Acknowledgments
We thank W.-Q. Dong and C.-D. Zuo for expert oocyte injection and culture. We also thank Dr. Stephen W. Jones for programs and advice on kinetic modeling.
This work was supported by National Institutes of Health grant NS29473 to G.E. Kirsch and American Heart Association Grant-in-Aid, Northeast Ohio Affiliate to C.C. Shieh.
Footnotes
A brief account of these results has been reported previously (Shieh, C.C., K.J. Greene, and G.E. Kirsch. 1996. Biophys. J. 70:A144).
references
- Aldrich RW, Corey DP, Stevens CF. A reinterpretation of mammalian sodium channel gating based on single channel recording. Nature (Lond) 1983;306:436–441. doi: 10.1038/306436a0. [DOI] [PubMed] [Google Scholar]
- Aggarwal SK, MacKinnon R. Contribution of the S4 segment to gating charge in the Shaker K+channel. Neuron. 1996;16:1169–1177. doi: 10.1016/s0896-6273(00)80143-9. [DOI] [PubMed] [Google Scholar]
- Bezanilla F, Perozo E, Stefani E. Gating of Shaker K+channels. II. The components of gating currents and a model of channel activation. Biophys J. 1994;66:1011–1021. doi: 10.1016/S0006-3495(94)80882-3. [DOI] [PMC free article] [PubMed] [Google Scholar]
- Bezanilla F, Stefani E. Voltage-dependent gating of ionic channels. Annu Rev Biophys Biomol Struct. 1994;23:819–846. doi: 10.1146/annurev.bb.23.060194.004131. [DOI] [PubMed] [Google Scholar]
- Catterall WA. Structure and function of voltage-sensitive ion channels. Science (Wash DC) 1988;242:50–61. doi: 10.1126/science.2459775. [DOI] [PubMed] [Google Scholar]
- Colquhoun D, Sakmann B. Fast events in single-channel currents activated by acetylcholine and its analogues at the frog neuromuscular end-plate. J Physiol (Lond) 1985;369:501–557. doi: 10.1113/jphysiol.1985.sp015912. [DOI] [PMC free article] [PubMed] [Google Scholar]
- Drewe JA, Hartmann HA, Kirsch GE. K+channels in mammalian brain: a molecular approach. Methods Neurosci. 1994;19:243–260. [Google Scholar]
- Frech GC, VanDongen AMJ, Schuster G, Brown AM, Joho RH. A novel potassium channel with delayed rectifier properties isolated from rat brain by expression cloning. Nature (Lond) 1989;340:642–645. doi: 10.1038/340642a0. [DOI] [PubMed] [Google Scholar]
- Hartmann HA, Kirsch GE, Drewe JA, Taglialatela M, Joho RH, Brown AM. Exchange of conduction pathways between two related K+channels. Science (Wash DC) 1991;251:942–944. doi: 10.1126/science.2000495. [DOI] [PubMed] [Google Scholar]
- Heinemann SH, Conti F, Stühmer W. Recording of gating currents from Xenopusoocytes and gating noise analysis. Methods Enzymol. 1992;207:353–368. doi: 10.1016/0076-6879(92)07024-i. [DOI] [PubMed] [Google Scholar]
- Holmgren M, Jurman ME, Yellen G. N-type inactivation and the S4-S5 region of the Shaker K+channel. J Gen Physiol. 1996;108:195–206. doi: 10.1085/jgp.108.3.195. [DOI] [PMC free article] [PubMed] [Google Scholar]
- Hoshi T, Zagotta WN, Aldrich RW. Shakerpotassium channel gating. I. Transitions near the open state. J Gen Physiol. 1994;103:249–278. doi: 10.1085/jgp.103.2.249. [DOI] [PMC free article] [PubMed] [Google Scholar]
- Kirsch GE, Drewe JA. Gating-dependent mechanism of 4-aminopyridine block in two related potassium channels. J Gen Physiol. 1993;102:797–816. doi: 10.1085/jgp.102.5.797. [DOI] [PMC free article] [PubMed] [Google Scholar]
- Kirsch GE, Shieh CC, Drewe JA, Vener DF, Brown AM. Segmental exchanges define 4-aminopyridine binding and the inner mouth of K+pores. Neuron. 1993a;11:503–512. doi: 10.1016/0896-6273(93)90154-j. [DOI] [PubMed] [Google Scholar]
- Kirsch GE, Drewe JA, De Biasi M, Hartmann HA, Brown AM. Functional interactions between K+pore residues located in different subunits. J Biol Chem. 1993b;268:13799–13804. [PubMed] [Google Scholar]
- Liman ER, Hess P, Weaver F, Koren G. Voltage-sensing residues in the S4 region of a mammalian K+channel. Nature (Lond) 1991;353:752–756. doi: 10.1038/353752a0. [DOI] [PubMed] [Google Scholar]
- Liman ER, Tytgat J, Hess P. Subunit stoichiometry of a mammalian K+channel determined by construction of multimeric cDNAs. Neuron. 1992;9:861–871. doi: 10.1016/0896-6273(92)90239-a. [DOI] [PubMed] [Google Scholar]
- Logothetis DE, Movahedi S, Satler C, Lindpaintner K, Nadal-Ginard B. Incremental reductions of positive charge within the S4 region of a voltage-gated K+channel result in corresponding decreases in gating charge. Neuron. 1992;8:531–540. doi: 10.1016/0896-6273(92)90281-h. [DOI] [PubMed] [Google Scholar]
- Logothetis DE, Kammen BF, Lindpaintner K, Bisbas D, Nadal-Ginard B. Gating charge differences between two voltage-gated K+channels are due to the specific charge content of their respective S4 regions. Neuron. 1993;10:1121–1129. doi: 10.1016/0896-6273(93)90060-5. [DOI] [PubMed] [Google Scholar]
- Lopez GA, Jan YN, Jan LY. Hydrophobic substitution mutations in the S4 sequence alter voltage-dependent gating in Shaker K+channels. Neuron. 1991;7:327–336. doi: 10.1016/0896-6273(91)90271-z. [DOI] [PubMed] [Google Scholar]
- Lopez GA, Jan YN, Jan LY. Evidence that the S6 segment of the Shaker voltage-gated K+channel comprises part of the pore. Nature (Lond) 1994;367:179–182. doi: 10.1038/367179a0. [DOI] [PubMed] [Google Scholar]
- Mannuzzu LM, Moronne MM, Isacoff EY. Direct physical measure of conformational rearrangement underlying potassium channel gating. Science (Wash DC) 1996;271:213–216. doi: 10.1126/science.271.5246.213. [DOI] [PubMed] [Google Scholar]
- McCormack K, Joiner WJ, Heinemann SH. A characterization of the activating structural rearrangements in voltage-dependent Shaker K+channels. Neuron. 1994;12:301–315. doi: 10.1016/0896-6273(94)90273-9. [DOI] [PubMed] [Google Scholar]
- McCormack K, Tanouye MA, Iverson LE, Lin J-W, Ramaswami M, McCormack T, Campanelli JT, Mathew MK, Rudy B. A role for hydrophobic residues in the voltage-dependent gating of Shaker K+channels. Proc Natl Acad Sci USA. 1991;88:2931–2935. doi: 10.1073/pnas.88.7.2931. [DOI] [PMC free article] [PubMed] [Google Scholar]
- MacKinnon R. Determination of the subunit stoichiometry of a voltage-activated potassium channel. Nature (Lond) 1991;350:232–235. doi: 10.1038/350232a0. [DOI] [PubMed] [Google Scholar]
- Matteson DR, Swenson RP. External monovalent cations that impede the closing of K channels. J Gen Physiol. 1986;87:795–816. doi: 10.1085/jgp.87.5.795. [DOI] [PMC free article] [PubMed] [Google Scholar]
- Ogielska EM, Zagotta WN, Hoshi T, Heinemann SH, Haab J, Aldrich RW. Cooperative subunit interactions in C-type inactivation of K channels. Biophys J. 1995;69:2449–2457. doi: 10.1016/S0006-3495(95)80114-1. [DOI] [PMC free article] [PubMed] [Google Scholar]
- Papazian DM, Timpe LC, Jan YN, Jan LY. Alteration of voltage-dependence of Shakerpotassium channel by mutations in the S4 sequence. Nature (Lond) 1991;349:305–310. doi: 10.1038/349305a0. [DOI] [PubMed] [Google Scholar]
- Schoppa N, McCormack K, Tanuoye MA, Sigworth FJ. Size of the gating charge in wild type and mutant Shakerpotassium channels. Science (Wash DC) 1992;255:1712–1715. doi: 10.1126/science.1553560. [DOI] [PubMed] [Google Scholar]
- Schreibmayer W, Lester HA, Dascal N. Voltage clamping of Xenopus laevisoocytes utilizing agarose-cushion electrodes. Pflüg Arch. 1994;426:453–458. doi: 10.1007/BF00388310. [DOI] [PubMed] [Google Scholar]
- Shieh CC, Kirsch GE. Mutational analysis of ion conduction and drug binding sites in the inner mouth of voltage-gated K+channels. Biophys J. 1994;67:2316–2325. doi: 10.1016/S0006-3495(94)80718-0. [DOI] [PMC free article] [PubMed] [Google Scholar]
- Sigg D, Stefani E, Bezanilla F. Gating current noise produced by elementary transitions in Shakerpotassium channels. Science (Wash DC) 1994;264:578–582. doi: 10.1126/science.8160016. [DOI] [PubMed] [Google Scholar]
- Stephens GJ, Garratt JC, Robertson B, Owen DG. On the mechanism of 4-aminopyridine action on the cloned mouse brain potassium channel mKv1.1. J Physiol (Lond) 1994;477:187–196. doi: 10.1113/jphysiol.1994.sp020183. [DOI] [PMC free article] [PubMed] [Google Scholar]
- Swenson RP, Armstrong CM. K+ channels close more slowly in the presence of external K+ and Rb+ . Nature (Lond) 1981;291:427–429. doi: 10.1038/291427a0. [DOI] [PubMed] [Google Scholar]
- Taglialatela M, Kirsch GE, VanDongen AMJ, Drewe JA, Hartmann HA, Joho RH, Stefani E, Brown AM. Gating currents from a delayed rectifier K+channel with altered pore stucture and function. Biophys J. 1992;62:34–36. doi: 10.1016/S0006-3495(92)81770-8. [DOI] [PMC free article] [PubMed] [Google Scholar]
- Taglialatela M, Drewe JA, Brown AM. Barium regulation of a clonal potassium channel and its regulation by a critical pore residue. Mol Pharmacol. 1993;44:180–190. [PubMed] [Google Scholar]
- Tempel BL, Jan YN, Jan LY. Cloning of a probable potassium channel gene from mouse brain. Nature (Lond) 1988;332:837–839. doi: 10.1038/332837a0. [DOI] [PubMed] [Google Scholar]
- Vandongen AM J. A new algorithm for idealizing single ion channel data containing multiple unknown conductance levels. Biophys J. 1996;70:1303–1315. doi: 10.1016/S0006-3495(96)79687-X. [DOI] [PMC free article] [PubMed] [Google Scholar]
- Yang N, Horn R. Evidence for voltage-dependent S4 movement in sodium channels. Neuron. 1995;15:213–218. doi: 10.1016/0896-6273(95)90078-0. [DOI] [PubMed] [Google Scholar]
- Yao J-A, Tseng G-N. Modulation of 4-AP block of a mammalian A-type K channel clone by channel gating and membrane voltage. Biophys J. 1994;67:130–142. doi: 10.1016/S0006-3495(94)80462-X. [DOI] [PMC free article] [PubMed] [Google Scholar]
- Yellen G, Jurman ME, Abramson T, MacKinnon R. Mutations affecting internal TEA blockade identify the probable pore-forming region of a K+channel. Science (Wash DC) 1991;251:939–942. doi: 10.1126/science.2000494. [DOI] [PubMed] [Google Scholar]
- Yokoyama S, Imoto K, Kawamura T, Higashida H, Iwabe N, Miyata T, Numa S. Potassium channels from NG 108-15 neuroblastoma-glioma hybrid cells: primary structure and functional expression from cDNAs. FEBS Lett. 1989;259:37–42. doi: 10.1016/0014-5793(89)81488-7. [DOI] [PubMed] [Google Scholar]
- Yool AJ, Schwarz TL. Alteration of ionic selectivity of a K+channel by mutation of the H5 region. Nature (Lond) 1991;349:700–704. doi: 10.1038/349700a0. [DOI] [PubMed] [Google Scholar]
- Zagotta WN, Aldrich RW. Alterations in activation gating of single Shaker A-type potassium channels by the Sh 5mutation. J Neurosci. 1990;10:1799–1810. doi: 10.1523/JNEUROSCI.10-06-01799.1990. [DOI] [PMC free article] [PubMed] [Google Scholar]
- Zagotta WN, Hoshi T, Dittman J, Aldrich RW. Shakerpotassium channel gating. II. Transitions in the activation pathway. J Gen Physiol. 1994;105:279–319. doi: 10.1085/jgp.103.2.279. [DOI] [PMC free article] [PubMed] [Google Scholar]