

Abstract
The repetitive spiking of free cytosolic [Ca2+] ([Ca2+]i) during hormonal activation of hepatocytes depends on the activation and subsequent inactivation of InsP3-evoked Ca2+ release. The kinetics of both processes were studied with flash photolytic release of InsP3 and time resolved measurements of [Ca2+]i in single cells. InsP3 evoked Ca2+ flux into the cytosol was measured as d[Ca2+]i/dt, and the kinetics of Ca2+ release compared between hepatocytes and cerebellar Purkinje neurons. In hepatocytes release occurs at InsP3 concentrations greater than 0.1–0.2 μM. A comparison with photolytic release of metabolically stable 5-thio-InsP3 suggests that metabolism of InsP3 is important in determining the minimal concentration needed to produce Ca2+ release. A distinct latency or delay of several hundred milliseconds after release of low InsP3 concentrations decreased to a minimum of 20–30 ms at high concentrations and is reduced to zero by prior increase of [Ca2+]i, suggesting a cooperative action of Ca2+ in InsP3 receptor activation. InsP3-evoked flux and peak [Ca2+]i increased with InsP3 concentration up to 5–10 μM, with large variation from cell to cell at each InsP3 concentration. The duration of InsP3-evoked flux, measured as 10–90% risetime, showed a good reciprocal correlation with d[Ca2+]i/dt and much less cell to cell variation than the dependence of flux on InsP3 concentration, suggesting that the rate of termination of the Ca2+ flux depends on the free Ca2+ flux itself. Comparing this data between hepatocytes and Purkinje neurons shows a similar reciprocal correlation for both, in hepatocytes in the range of low Ca2+ flux, up to 50 μM · s−1 and in Purkinje neurons at high flux up to 1,400 μM · s−1. Experiments in which [Ca2+]i was controlled at resting or elevated levels support a mechanism in which InsP3-evoked Ca2+ flux is inhibited by Ca2+ inactivation of closed receptor/channels due to Ca2+ accumulation local to the release sites. Hepatocytes have a much smaller, more prolonged InsP3-evoked Ca2+ flux than Purkinje neurons. Evidence suggests that these differences in kinetics can be explained by the much lower InsP3 receptor density in hepatocytes than Purkinje neurons, rather than differences in receptor isoform, and, more generally, that high InsP3 receptor density promotes fast rising, rapidly inactivating InsP3-evoked [Ca2+]i transients.
Keywords: liver, Purkinje neurons, calcium, InsP3, flash photolysis
introduction
Calcium release from intracellular stores by InsP3 mediates the activation of liver metabolism by several hormones, resulting, for example, in glycogenolysis and bile secretion. In guinea pig and rabbit liver, the rise of [Ca2+]i produces a large increase in K+ and Cl− permeability through Ca2+-activated conductances in the plasma membrane. The increase of [Ca2+]i typically occurs as a sequence of periodic spikes of high concentration lasting several seconds (Woods et al., 1987; Field and Jenkinson, 1987) with frequency dependent on the degree of stimulation. The mechanisms generating this pattern of Ca2+ release appear to depend to some degree on local regulation by InsP3 receptor activation itself, probably via local feedback through Ca2+ released into the cytosol. Evidence supporting this idea is the generation of periodic spiking of the Ca2+ concentration in single hepatocytes by InsP3 alone perfused directly into the cytosol from a patch pipette (Capiod et al., 1987; Ogden et al., 1990) or by stable 5-thio-InsP3 released by photolysis (Wootton et al., 1995), although there are additional factors secondary to receptor activation that modify this process during hormone action (Cobbold et al., 1991).
The regulation of the InsP3 receptor by cytosolic Ca2+ in several tissues has been shown to be facilitatory at low concentrations close to resting levels (Iino, 1990; Bezprozvanny et al., 1991; Finch et al., 1991; Iino and Endo, 1992) and inhibitory at high concentrations of 1 μM or greater (Berridge, 1988; Payne et al., 1988; Iino, 1990; Parker and Ivorra, 1990; Ogden et al., 1990; Bezprozvanny et al., 1991; Finch et al., 1991; Iino and Endo, 1992; Combettes et al., 1993; Khodakhah and Ogden, 1995). The facilitatory action is less pronounced or apparently absent in some studies (see Combettes et al., 1994, Khodakhah and Ogden, 1995), but the inhibitory action of high [Ca2+]i is clearly demonstrated in all studies cited. In hepatocytes, there is one report of facilitation by cytosolic free [Ca2+] (Marshall and Taylor, 1993) and several studies showing inhibition of Ca2+ release (Ogden et al., 1990; Combettes et al.,1993) and Ca2+-induced desensitization of InsP3 receptors (Pietri et al., 1990). Additionally, inactivation processes that do not depend on [Ca2+]i have been described in Xenopus oocytes (Ilyin and Parker, 1994) and in rat hepatocytes (Hajnozcky and Thomas, 1994).
To study the mechanisms of activation and local regulation of InsP3 receptors in single hepatocytes, it is necessary to gain access to the receptors in the cytosol and release InsP3 in a controlled fashion and to measure the kinetics of the resulting Ca2+ release. Generally, kinetic studies of InsP3-activated Ca2+ fluxes have been made with fast perfusion of cell suspensions after permeabilizing the surface membrane, but endogenous regulatory processes and differences between cells would not be detected with these methods. In a previous single cell study, InsP3 was released by flash photolysis of caged InsP3 in the cytosol of single hepatocytes, and the activation by Ca2+ of the endogenous apamin-sensitive Ca2+-activated K+ conductance was used as a monitor of free [Ca2+] (Ogden et al., 1990). This showed that InsP3 produced activation at concentrations of 0.4 μM or higher, that there is delay of up to several hundred milliseconds at low InsP3 concentrations, and that there is a subsequent prolonged inactivation of the Ca2+ release process, requiring ∼1 min to recover, produced by the elevation of cytosolic free [Ca2+]. However, the Ca2+-activated K+ conductance of guinea pig hepatocytes has a strongly cooperative dependence on [Ca2+] (Capiod and Ogden, 1989a ) and is unsuitable for quantitative kinetic investigation of Ca2+ flux, although it provides a useful indicator of free [Ca2+] changes. To overcome this limitation, the experiments described here make use of fluorescent Ca2+ indicators to measure particularly the kinetics of activation and inactivation of Ca2+ release into the cytosol soon after InsP3 is liberated by photolysis in single guinea pig hepatocytes. The delays are shorter than those found with the K+ conductance, the Ca2+ efflux is quantified as d[Ca2+]i/dt and found to be small relative to other tissues, particularly in comparison with cerebellar Purkinje neurons, and the rate and mechanism of termination of Ca2+ efflux from stores is investigated and shown to depend on [Ca2+]i.
Evidence from cell to cell and tissue to tissue variation in the kinetics of Ca2+ release supports the idea that InsP3 receptor density is an important factor determining the duration as well as the magnitude of Ca2+ flux. Large Ca2+ flux which results from high channel density produces a rapid termination of release by inactivating closed InsP3 channels via local high free [Ca2+]. Hepatocytes have a low density of InsP3 receptor/channels, producing small Ca2+ flux and slow termination of release. Comparison is made with similar data from cerebellar Purkinje neurons, where the receptor density is very high and which have high flux (Khodakhah and Ogden, 1995) and rapid rates of termination. The results suggest that InsP3 receptor density can account for most of the differences in InsP3 action between hepatocytes and Purkinje neurons and supports the idea that the density of open InsP3 receptor/channels determines the time course of the rise and fall of free [Ca2+] during hormonal signalling in hepatocytes.
methods
Cell Preparation and Solutions
Guinea-pig hepatocytes were isolated by perfusion with collagenase followed by mechanical dispersion (Capiod and Ogden, 1989a , b ). Cells were plated from suspension onto 40-mm collagen-coated quartz coverslips in Williams medium E and kept at 37°C in a hydrated atmosphere of CO2/5% in air. Recordings were made after 2–6 h in Cl−-free solution with gluconate as the major anion. External solution contained (in mM): Na gluconate, 145; K gluconate, 5.6; CaSO4, 5; MgSO4, 1.2; HEPES, 8. For experiments in absence of external Ca2+, solutions contained (in mM): Na gluconate, 149; K gluconate, 5.6; MgSO4, 3; EGTA, 0.04; HEPES, 8. Internal Cl−-free solutions contained (in mM): K gluconate 153; ATPNa2, 3; MgSO4, 3; HEPES, 8; 200 μM fluo-3 or 500 μM furaptra and caged InsP3 or caged 5-thio-InsP3. Fura-2–buf-fered internal solutions contained (in mM): K gluconate, 40; ATPNa2, 3; MgSO4, 3; fura-2–K5, 10; CaCl2, 4 or 7.5; HEPES, 100; KOH, 40. All the solutions were buffered at pH 7.3 and 0.2-μm filtered. Experiments were made at room temperature (∼27°C).
Somata of rat cerebellar Purkinje neurons were isolated from slices of cerebellar cortex from 12–16-d-old Wistar rats by mild proteolysis (Sigma Type 23, 3 mg · ml−1 for 7 min at 37°C; Sigma Chemical Co., St. Louis, MO) and gentle dissociation (see Khodakhah and Ogden, 1995).
Whole-cell Recordings
Standard tight-seal whole-cell recording techniques were used (Hamill et al., 1981). Patch pipettes were made from pyrex glass and coated with a wax comprising parafilm (40%) and mineral oil (60%).
Fluorescence Measurements and Flash Photolysis
The fluorescent indicator used to detect changes in Ca2+ concentration was chosen according to the type of measurement made. Fluo-3 has a dissociation constant of K = 0.7 μM in situ, close to the resting [Ca2+]i, has a large fluorescence increase on binding Ca2+, and was used to measure delays in the activation of Ca2+ release.
Estimates of the time course of [Ca2+]i changes from changes in fluo-3 fluorescence were found to be distorted when compared with data obtained with lower affinity indicators (see Ogden et al., 1995). This results presumably from saturation of the fluo-3 at high local [Ca2+] near release sites, averaging fluorescence changes across the cell producing underestimates of the [Ca2+] changes at early times after InsP3 release. Therefore experiments to measure the time course of the rise and decline of [Ca2+]i were made with the low affinity indicator furaptra, (K = 44 μM, Konishi et al., 1991; K = 48 μM, Ogden et al., 1995; K estimated as 100 μM in frog muscle myoplasm, Zhao et al., 1996).
Finally, in some experiments it was desired to buffer cytosolic free [Ca2+] with high concentrations of fura-2/calcium mixtures. To obtain precise values of free [Ca2+], the concentration of fura-2 was determined from the absorbance of the solution and extinction coefficient e362 = 28,700 M−1 cm−1 (Baylor and Hollingworth, 1988), and Ca2+ was added to give the desired free [Ca2+] assuming K = 0.2 μM (see, e.g., Zhou and Neher, 1993).
Fluo-3 (200 μM), furaptra (500 μM), or fura-2 (10 mM) free acids were introduced into the cell together with caged compounds via the patch pipette, and diffusional equilibration between pipette solution and cell was determined from the fluorescence record; recordings were made at least 5 min after membrane rupture. Microspectrofluorimetry was on a Nikon TMD microscope with 40× 1.3 NA objective. Excitation light (fluo-3, 450–490 nm; furaptra or fura-2, 400–440 nm) was from a xenon arc lamp, and light emitted from a single cell was viewed with long pass filters at 520 nm (fluo-3) or 470 nm (furaptra, fura-2). The area viewed was restricted to a single cell by an adjustable rectangular diaphragm, and emitted light was detected by a photomultiplier operated in photon counting mode. Pulse output was counted by a Tecmar interface, corrected for missed pulses, and stored via software (Photon Technology International, South Brunswick, NJ). Photon counts were converted in parallel to an analogue signal by an integrating amplifier with correction for missed counts (Cairn Research) and stored on FM tape.
Fluorescence changes in fluo-3 were expressed as a ratio with respect to the initial resting fluorescence. Furaptra was used at a single excitation wavelength of 420 nm (in most experiments 400–440 nm) conditions in which the fluorescence is quenched close to zero on binding Ca2+. The method for and background to the calculation of free Ca2+ from the fluorescence has been described previously (Ogden et al., 1995; see Konishi et al., 1991). Briefly, the intrinsic fluorescence recorded before whole cell recording was taken as the fluorescence at saturating [Ca2+]i, F Camax, where furaptra fluorescence is quenched. The resting [Ca2+]i in guinea pig hepatocytes has been estimated as 0.2 μM (Burgess et al., 1984) and therefore the fluorescence of furaptra under resting conditions can be taken as an estimate of F Camin. The free Ca2+, Ca f,was calculated from the fluorescence F by means of the relation:
 |
1 |
Fura-2 was used at high free concentration, 2.5 or 5 mM, to buffer Ca f to levels near resting [Ca2+], i.e., conditions in which it is the predominant source of intracellular Ca2+ binding. Fura-2 was used at a single excitation wavelength of 420 nm, and emission was measured at >470 nm, conditions in which the fluorescence is quenched by high [Ca2+] to zero. As for furaptra, the intrinsic fluorescence recorded before fluophore loading was taken as the fluorescence at saturating free [Ca2+], F Camax. The dissociation constant K, the free and bound indicator concentrations, D f, D Ca, and the Ca f are related by:
 |
Total indicator and Ca2+ concentrations are:
 |
which on substitution gives:
 |
The dissociation constant for fura-2 binding Ca2+ was assumed to be K = 0.2 μM (see Zhou and Neher, 1993), and D T and Ca T have values such that Ca f is << Ca T, so
 |
2 |
Ca2+ released into the cytosol binds predominantly to fura-2 and is measured as the change of D Ca. To measure changes of D Ca an estimate of F Camin is needed. If Ca T and D T added to the cytosol have fluorescence F = F 0 , and Ca f << Ca T as above, rearranging Eqs. 1 and 2 gives:
 |
permits calculation of F Camin from the initial fluorescence, F 0, the composition of the fura-2/Ca mixture, and F Camax, which in these measurements was close to zero. Thus at high fura-2 concentration, Ca2+ released onto fura-2 appears as an increase of D Ca and was calculated from the fura-2 fluorescence, F, as the proportion of F Camin quenched, by:
 |
 |
The Ca2+-dependent K+ conductance has a range of activation by cytosolic Ca2+ ion concentration of 0.3–1.5 μM and a maximum open probability of 0.9 (Capiod and Ogden, 1989a ). It is not detectably activated at [Ca2+]i less than 0.3 μM and provides a good index of low resting [Ca2+]i. Cells with any degree of activation of Ca2+-dependent K+ conductance before InsP3 stimulation were not used. The Ca2+-dependent K+ conductance was also used as an index of changes of [Ca2+]i during experiments.
Photolysis of caged InsP3, the P-4 or the P-5 1-(2-nitrophenyl)ethyl esters of InsP3 (Walker et al., 1989), was produced by a 1-ms pulse from a short arc xenon flashlamp (Rapp and Guth, 1988) focused to produce an image 2–3 mm across at the cell as described previously (Ogden et al., 1990). The output of the lamp was adapted for most experiments to be adjustable in the range producing 6–14% photolysis of caged InsP3. The coefficient of variation of photolysis of caged ATP was 10%, indicating the degree of reproducibility of photolysis of InsP3 in each cell. In some experiments a caged stable analogue of InsP3, caged 5-thio-InsP3, the S-1 (2-nitrophenyl)ethyl ester of 1-d-myo-inositol 1,4 bisphosphate 5-phosphothiorate. This has a smaller quantum yield than caged InsP3, 0.57 compared to 0.65, and a slower conversion, 87 against 220 s−1 (Wootton et al., 1995).
The optical artefact, mainly phosphorescence in the objective, arising from the UV pulse was minimized (4–8 ms) by use of quartz coverslips and UV block (suntan) oil between the cell and objective (Carter and Ogden, 1992; Ogden et al., 1993). This artefact constituted the main limitation to resolving the latency of responses at high InsP3 concentration, the fluorescence changes of fluo-3 and furaptra following photolysis of DM-Nitrophen being complete in less than 4 ms. Photolysis of caged InsP3 by fluorescence excitation was minimized by shuttering the xenon lamp when not recording.
Data were recorded on FM tape at 200 Hz (fluorescence) or 1 kHz (membrane current) bandwidth, and in software fluorescence was integrated over 10 or 20 ms.
Materials
Chemicals were Analar grade from BDH Chemicals Ltd. (Poole, UK) or Sigma Chemical Co. Collagenase CLS 2 was from Worthington Biochemical Corp., (Freehold, NJ). Fluo-3, furaptra and fura-2 were from Molecular Probes (Eugene, OR). The concentration of fura-2 stock solutions was determined spectroscopically with extinction coefficient at 362 nm of 2.8 × 10⁴ M−1 cm−1 (Baylor and Hollingworth, 1988).
results
Rate of Change of [Ca2+]i as a Measure of InsP3-evoked Ca2+ Flux
Activation of InsP3 receptors results in flux of Ca2+ from stores into the cytosol which appears as an increase of free [Ca2+]. The rate of change of free [Ca2+], d[Ca2+]i/dt (units moles · s−1 · liters−1), is proportional to the net flux of Ca2+ into unit volume of cytosol (Ogden et al., 1990), the proportionality depending on the fraction of Ca2+ bound to endogenous buffers and to the Ca2+ indicator itself. Measurement of d[Ca2+]i/dt with spatially averaged fluorescence of Ca2+ indicators is susceptible to distortion arising from local Ca2+ accumulation and the saturating relation between fluorescence and [Ca2+]i. Precise measurement depends on K Ca of the indicator being several fold higher than the peak local free Ca2+ so that spatial summation occurs on the linear part of the fluorescence-[Ca2+] relation. Furaptra used here has K Ca = 48 μM, and at 500 μM binds approximately 10 Ca2+ ions for each free Ca2+ ion, producing minimal exogenous Ca2+ buffering. Peak d[Ca2+]i/dt of each response was estimated from the slope of a straight line fitted to the rising phase.
The characteristic time course of the [Ca2+]i and Ca2+-dependent K+ conductance of guinea pig hepatocytes after flash photolysis of caged InsP3 in the cytosol is illustrated by the records shown in Fig 1. After the flash the [Ca2+]i increases after a delay, rises quickly due to net Ca2+ flux into the cytosol, then declines slowly due to net loss of Ca2+ from the cytosol. The rate of rise of [Ca2+]i due to InsP3 was up to 52 μM · s−1 and the rate of decline following the peak was −0.2 to −1.3 μM s−1 (range, n = 9). In Purkinje neurons peak flux was much higher (<1,400 μM · s−1), and rates of decline were similar to hepatocytes (Khodakhah and Ogden, 1995). At the peak [Ca2+]i, where d[Ca2+]i/dt = 0, the net flux is zero, and the InsP3-evoked efflux at this point is similar in magnitude to the flux of Ca2+ from the cytosol during the decline, small when compared to the maximum d[Ca2+]i/dt. The flux, d[Ca2+]i/dt, was estimated as the slope of a straight line fitted to the maximum rate of rise. The analysis presented below is of (a) the delay and its dependence on InsP3 concentration, (b) the rate of rise of [Ca2+]i as a measure of activation of InsP3 gated Ca2+ efflux, (c) the mechanism that terminates InsP3-gated flux at the peak of the response, and therefore determines the period of high efflux, and (d) the effect of InsP3 concentration on the duration of Ca2+ release.
Figure 1.

InsP3-evoked increase of [Ca2+]i and Ca2+-activated K+ current. Single hepatocyte whole cell voltage clamp at 0 mV with pipette solution containing 500 μM furaptra and 10 μM caged InsP3. 1.2 μM InsP3 released by 1-ms UV pulse at time indicated by the arrow. Ca2+-activated K+ current at 0 mV (lower trace) and [Ca2+]i calculated from fluorescence (upper trace) after release of InsP3. Rate of decline in [Ca2+]i illustrated by the dashed line (left panel). (Right panel) Expanded records illustrating the delays (D1, fluorescence; D2, Ca2+-activated K+ current), rate of rise (d[Ca2+]/dt) and duration (10–90%) of the increase in [Ca2+]i.
The lower record in Fig. 1 shows the K+ current recorded at 0 mV membrane potential and measures the activation of Ca2+-dependent K+ conductance of the plasma membrane by cytosolic Ca2+. This conductance has been characterized (activation range 0.3–1.5 μM free [Ca2+], Capiod and Ogden, 1989a ) and serves to show that the resting [Ca2+]i is low, and the Ca2+ indicator does not affect the response. Because of the steep dependence on free Ca2+ (Capiod and Ogden, 1989a ) and saturation at relatively low free [Ca2+], the Ca2+- dependent K+ conductance cannot be used to measure absolute values of d[Ca2+]i/dt for kinetic studies.
Initial Delay of InsP3 - evoked Ca2+ Release
Previous work (Ogden et al., 1990) had shown a delay of up to 1 s between releasing low concentrations, <0.5 μM InsP3, and activation of the plasmalemmal Ca2+- dependent K+ conductance, and that this delay was reduced to a minimum of ∼120 ms at high (>2 μM) InsP3 concentration. To measure the delays in [Ca2+]i changes, increases in cytosolic [Ca2+] close to the resting level were detected with the high affinity Ca2+ indicator fluo-3 to reduce noise near resting [Ca2+]i (K Ca ∼ 0.4 μM). The delay was estimated as the time from the flash until the fluorescence deviates from the baseline (Fig. 2 A). Delays in the rise of fluo-3 fluorescence declined from a mean of 290 ± 90 ms (mean ± SEM, n = 6) at 0.4 μM InsP3 to <30 ms at >5 μM InsP3 (data summarized in Fig. 2 B). The delays in the rise of the Ca2+-dependent K+ conductance were longer than those of the Ca2+ increase detected by fluo-3, from 1,000 ± 170 ms at 0.4 μM InsP3 declining to 104 ± 16 ms at 10 μM InsP3 (Ogden et al., 1990). The difference can be explained by the need to raise [Ca2+]i to 0.3 μM to activate the Ca2+-dependent K+ conductance, higher than resting [Ca2+]i, and the steep activation of the Ca2+-dependent K+ conductance by free Ca2+. The minimum delay in fluo-3 fluorescence at high InsP3 concentration was often obscured by an optical artifact lasting up to 20 ms due to flashlamp discharge. Even at very high InsP3 concentrations of 25–100 μM, the delays were >20 ms.
Figure 2.
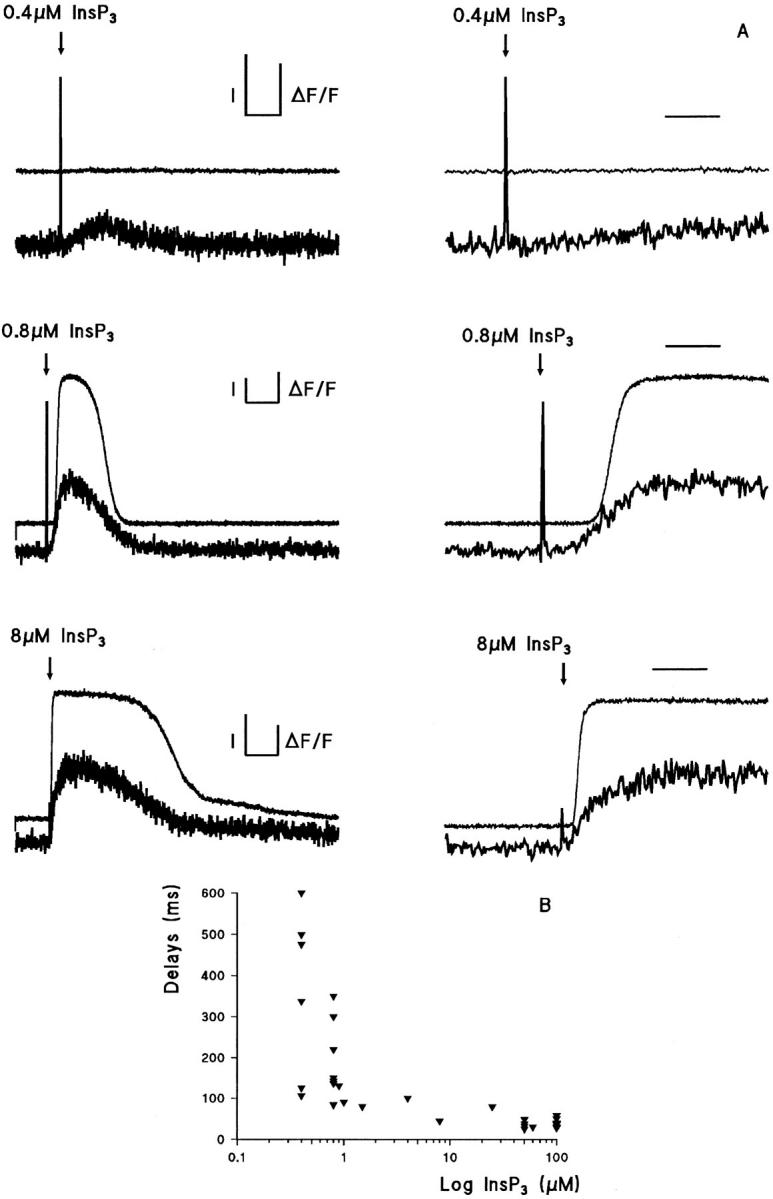
Initial delays in time course of InsP3-evoked [Ca2+]i and Ca2+-activated K+ current increases. (A) Whole cell voltage clamp with 200 μM fluo-3 at 0 mV. The Ca2+-induced fluorescence change (ΔF) is expressed as a fraction of fluorescence (F) in the unstimulated cell. (Left) Whole cell Ca2+-activated K+ current at 0 mV (upper traces) and fluo-3 fluorescence (lower traces) after release of 0.4, 0.8, and 8 μM InsP3 at the times indicated by the arrows in three different hepatocytes. (Right) Expanded records illustrating the delay and initial rate of rise. Horizontal bar, 2 s (left), 500 ms (right); left vertical bar, I = 200 pA; right vertical bar, ΔF/F = 0.5. (B) Delays between InsP3 release and initiation of Ca2+ flux plotted against InsP3 concentration (log scale).
Two explanations for the delay in Ca2+ release may be cooperativity in the binding of InsP3 to produce activation, data in RBL cells suggesting n = 4 (Meyer et al., 1988), or a cooperative effect of Ca2+ ions at concentrations around the resting level, shown by Iino (1990), Bezprozvanny et al. (1991), and Finch et al. (1991). In the present experiments, when cells were loaded with 500 μM furaptra, the delay to a pulse of InsP3 was substantially reduced when [Ca2+]i was elevated by Ca2+ influx, as illustrated by the records in Fig. 3, which show Ca2+ release by 1.2 μM InsP3 in the same hepatocyte in the presence (middle trace) and absence (upper and lower pre and post controls) of elevated [Ca2+]i evoked by hyperpolarization. In five experiments of this kind, no delay was discernible with prior elevation of [Ca2+]i, whereas control release of the same InsP3 concentration in the same cells had delays of mean 380 ± 62 ms (mean ± SEM, n = 5). These results agree with the idea that the initial efflux of Ca2+ ions produces a localized increase of [Ca2+]i and accelerates activation of the InsP3 receptor. It should be noted for later reference that although the delays were reduced, the subsequent Ca2+ flux induced by InsP3, measured by d[Ca2+]i/dt, was also reduced in the same cells by the rise in [Ca2+]i (discussed below).
Figure 3.
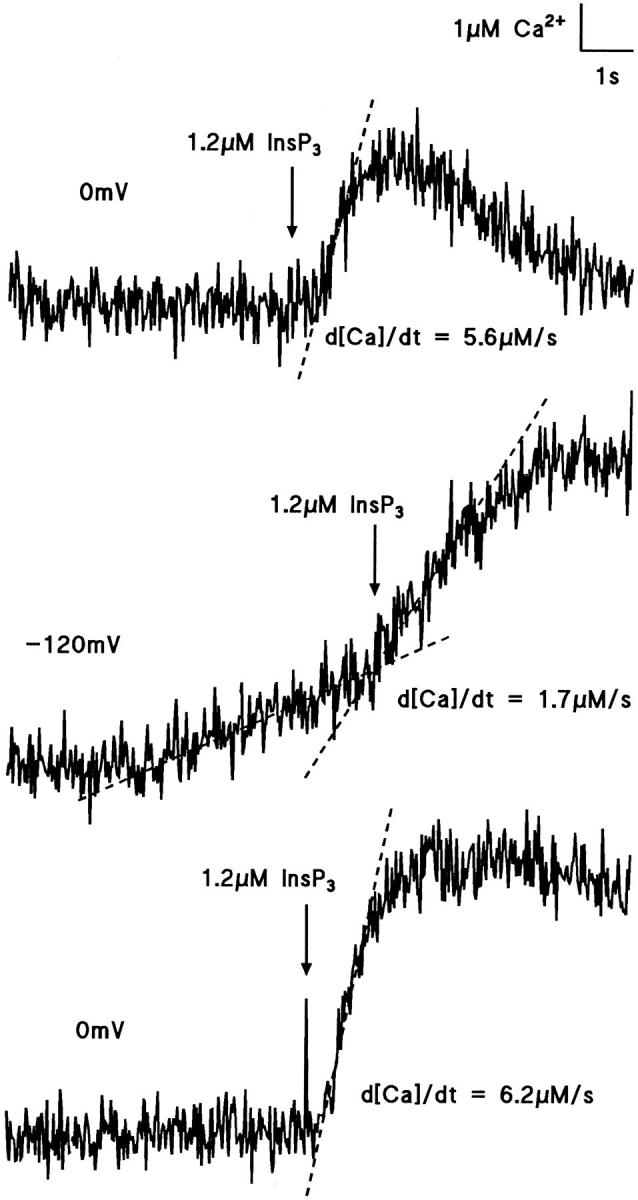
Effect of raised [Ca2+]i on InsP3-evoked Ca2+ flux and delay. The cell was loaded with 500 μM furaptra, and 1.2 μM InsP3 was released as indicated by the arrows. The top and bottom traces show the control responses at 0 mV with rates of rises in [Ca2+]i (d[Ca2+]i /dt) of, respectively, 5.6 and 6.2 μM · s−1. An elevation in [Ca2+]i of ∼2 μM obtained by hyperpolarizing the cell to −120 mV (middle trace) resulted in a slower rate of Ca2+ release, d[Ca2+]/dt of 1.7 μM · s−1, after the release of InsP3. Flash release of InsP3 evoked an increase in [Ca2+]i without detectable delay when [Ca2+]i was elevated (middle trace) and with a delay of ∼500 ms in control conditions at 0 mV in the same cell (upper trace). Each traces were separated by a interval of 2 min.
Mean delays at similar InsP3 concentrations were not significantly shorter with fluo-3 (200 ± 40 ms at 0.8 μM InsP3, range 80–350 ms, n = 7) than with furaptra (310 ± 40 ms at 1.2 μM InsP3, range 90–560 ms, n = 11). However, the low affinity Ca2+ dye furaptra is less likely to detect small changes in [Ca2+]i than fluo-3, making it more difficult to estimate the deviation of the trace from the baseline.
The cooperativity and narrow range of [Ca2+]i producing Ca2+ activation of the K+ conductance in guinea pig liver cells (Capiod and Ogden, 1989a ) is most likely responsible for the additional delay, saturation at submaximal InsP3 concentrations (>0.6 μM), and steep rise of the conductance increase compared to the rise of [Ca2+]i (see Fig. 1).
Amplitude and Rate of Rise of [Ca2+]i
Experiments with fluo-3 as the Ca2+ indicator showed evidence of distortion of the kinetics and amplitude of the [Ca2+]i increase averaged over the cell as measured by the fluorescence change (Ogden et al., 1995). The problem was overcome by use of the lower affinity indicator furaptra to extend the range of linear summation of [Ca2+]i (Raju et al., 1989, Konishi et al., 1991) (see methods). The effect of increasing the InsP3 concentration released by a flash in cells loaded with 500 μM furaptra was to increase the rate of rise and peak amplitude of [Ca2+]i in the range of InsP3 concentrations 0.2 μM to ∼5 μM. The maximum rate of rise, d[Ca2+]i/dt, provides a measure of the InsP3-evoked Ca2+ flux into unit cytosolic volume and can be used to compare different InsP3 concentrations in the same cell, and the variation from cell to cell at the same InsP3 concentration. The effect of increasing concentration within single hepatocytes is shown by the records of [Ca2+]i in Fig. 4. Fig. 4 A shows an increase of peak and rate of rise of [Ca2+]i between pulses of 0.7 and 1.4 μM InsP3 in the same cell. The d[Ca2+]i/dt (slopes of the fitted lines ± SD) were significantly different (P < 0.01). Fig. 4 B shows [Ca2+]i in response to 7 and 13 μM in another cell with no increase in either parameter at the higher concentration, showing saturation of the response. The pooled data show saturation of the InsP3-evoked flux, measured as the maximum rate of rise in [Ca2+]i at 5–10 μM InsP3. The data normalized to 1.2 μM InsP3 in each of 10 hepatocytes is shown for peak [Ca2+]i in Fig. 5 A and for d[Ca2+]i/dt in Fig. 5 B. Both parameters increased in each cell with InsP3 concentrations from 0.6 to 2.4 μM, showing that the InsP3-evoked flux increased in this range of concentrations. An estimate of the Hill coefficient for InsP3-evoked flux measured by d[Ca2+]i/dt in this range was 1.5, but was poorly defined.
Figure 4.
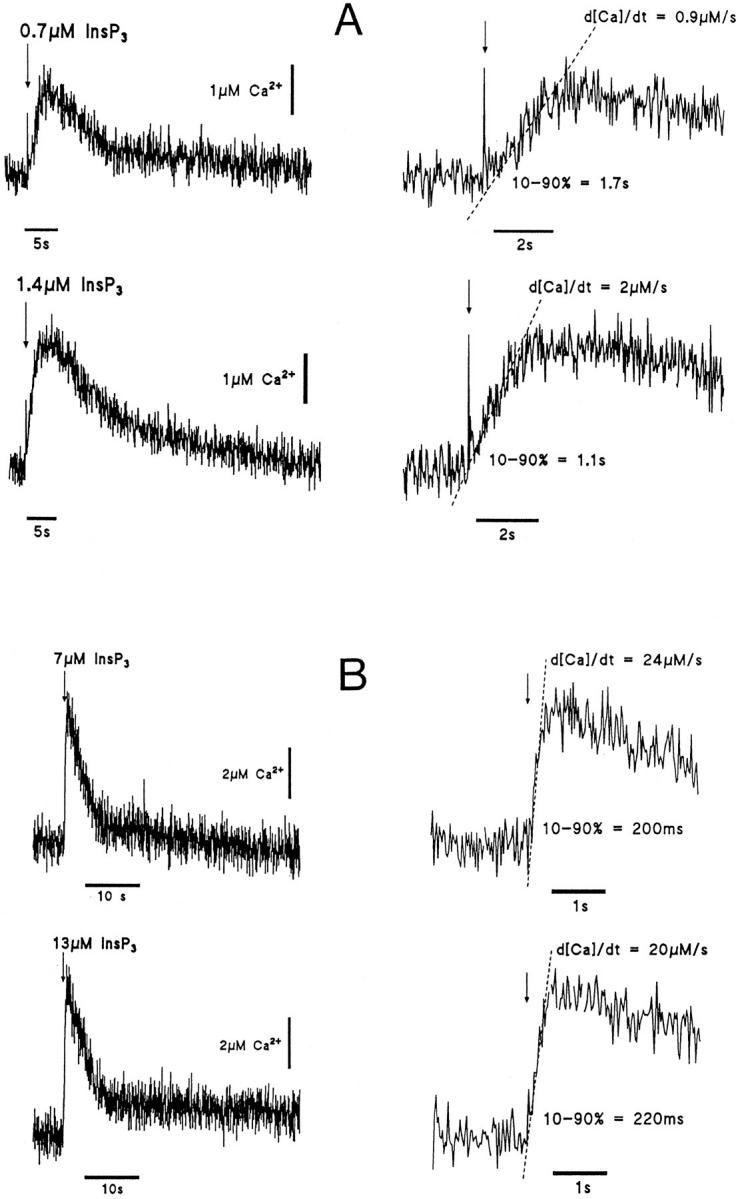
Concentration dependence of the InsP3-evoked [Ca2+]i increase. Increase in [Ca2+]i evoked by InsP3 in two different hepatocytes loaded with 500 μM furaptra at 0 mV. The photolytic releases indicated by the arrows of 0.7 and 1.4 μM InsP3 in the first hepatocyte are shown in the top four traces (A) and of 7 and 13 μM in the second in the four bottom traces (B). Expanded records illustrating the delays, rates of rise (d[Ca2+]i /dt) and durations (10–90%) of the increase in [Ca2+]i are shown on the right sides of the figure.
Figure 5.

Dependence of Ca2+ flux and peak [Ca2+]i on InsP3 concentration. (A) Peak [Ca2+]i (Δ[Ca]) and (B) rates of rise of free [Ca2+]i (d[Ca]i/dt) normalized to value at 1.2 μM InsP3 in each cell and plotted against InsP3 concentration (log scale). Data from 10 hepatocytes whole cell voltage clamped with 500 μM furaptra at 0 mV. (C) Peak [Ca2+]i and (D) d[Ca2+]i /dt plotted against InsP3 concentration released by photolysis of caged InsP3 in 48 guinea-pig hepatocytes. 500 μM furaptra, 0 mV.
Pooled data from 48 hepatocytes showed considerable variability in the amplitude and rate of rise of the response from cell to cell. This is shown by the data plots in Fig. 5, C and D, which show a large variation in both parameters at each InsP3. The differences in d[Ca2+]i/dt at each InsP3 concentration from cell to cell may be due to real differences in Ca2+ flux because of differing InsP3 receptor densities, from differing single InsP3 receptor-channel properties, or the Ca2+ flux may be similar but with differences in Ca2+ buffering, resulting in lower d[Ca2+]i/dt when buffering is high. The variations in free d[Ca2+]i/dt from cell to cell are analyzed further below.
Termination of InsP3-evoked Ca2+ Efflux
The time course of the InsP3-evoked rise of [Ca2+]i shown in Figs. 1 and 3 has a well-defined peak where the net flux of Ca2+ ions into the cytosol, measured as d[Ca2+]i/dt, is zero. The mechanism terminating Ca2+ efflux was investigated previously with twin pulse protocols in hepatocytes (Ogden et al., 1990) and showed that Ca2+ release evoked by a second pulse of InsP3 is inhibited for a period of ∼1 min after a response to the initial pulse, an effect that recovers with a half-time of 10–20 s for the pulse interval. The Ca2+-activated K+ conductance was used to monitor Ca2+ flux by InsP3 in the earlier study but could not show the time course of the onset of this effect because of the distortion produced by cooperative activation of the K+ conductance by Ca2+. The onset close to peak [Ca2+]i was tested here with twin pulse experiments monitoring [Ca2+]i with furaptra, and results from three cells are shown in Fig. 6 to illustrate the onset of inhibition. (1) On the left-hand side (Fig. 6 A), the upper record shows Ca2+ release evoked by 0.4 μM InsP3, the peak flux d[Ca2+]i/dt = 25 μM · s−1 is indicated by the line fitted to the fast rise. The middle trace shows that a second pulse of 0.4 μM InsP3 500 ms later, before [Ca2+]i had peaked, produced no further activation of Ca2+ flux, i.e., no further increase of d[Ca2+]i/dt above 24 μM · s−1 produced by the first pulse. The effect was not due to receptor saturation as 1.4 μM InsP3 subsequently produced a larger flux (d[Ca2+]i/dt = 46 μM · s−1) in the same cell shown in the lower trace. (2) This effect is shown in another cell where a second photolytic release of 0.6 μM InsP3 at about 50% of the rising phase of [Ca2+]i showed no change in the slope (Fig. 6 B, upper trace), and a single release of 0.6 μM InsP3 in the same cell evoked a response of similar amplitude and rate of rise of [Ca2+]i as that established by the first flash with submaximal InsP3 concentration (Fig. 6 B, bottom trace). It may be noted that InsP3 sensitivity was suppressed at the time of the second pulse in both Fig. 6, A and B, although receptor/channels were still open as judged by the high steady flux occurring at that time. This suggests that closed receptor/channels were inhibited at the time of the second pulse (see discussion). (3) Finally, in the third example illustrated, twin pulses of 0.6 μM in a cell with low flux showed a significant increase of d[Ca2+]i/dt from 1 μM · s−1 to 3.4 μM · s−1 (slopes of the fitted lines ± SD, P < 0.01) after the second flash with a 1.6-s interval (Fig. 6 C, upper trace). The delay after the first pulse of InsP3 was determined with the Ca2+-dependent K+ conductance (not shown). The rate of rise in [Ca2+]i after the second flash can be compared to that evoked by a single release of 1.2 μM InsP3 (Fig. 6 C, bottom trace), which produced a flux of 3.7 μM · s−1 later in the same cell showing that in this case the effect of two pulses of 0.6 μM were similar to a single pulse of 1.2 μM. The data of Fig. 6, A and B, show that the onset of the inhibition can occur early in the response even though InsP3 receptor/channels are still activated; a difference in the cell of Fig. 6 C, where no clear inhibition was seen, was the smaller magnitude of the Ca2+ flux.
Figure 6.

Time course of onset of loss of InsP3 sensitivity. [Ca2+]i after photolytic release of InsP3 at times indicated by the arrows in three different guinea pig hepatocytes loaded with 500 μM furaptra at 0 mV. Traces separated by ∼2 min. Rates of rise of [Ca2+]i (d[Ca]i/dt) are indicated by lines fitted to data. (A) Top trace shows the control to 0.4 μM InsP3, middle trace two successive releases of 0.4 μM InsP3 with a interval of 500 ms showing no change in the rate in [Ca2+] release (d[Ca]i /dt) after the second flash, and the bottom trace the response to photolytic release of 1.4 μM InsP3. (B) Two successive pulses of 0.6 μM InsP3 (top trace) show no change in the rate of rise of [Ca2+]i after the second flash (600-ms interval) when compared to a single pulse of 0.6 μM InsP3 later in the same cell (bottom trace). (C) Two successive pulses of 0.6 μM InsP3 (top trace) show an increase in the rate of rise of [Ca2+]i after the second flash (1.6-s interval). Bottom trace shows a single release of 1.2 μM InsP3 in the same cell.
These results and experiments reported earlier with twin pulses of InsP3 (Ogden et al., 1990) and stable 5-thio-InsP3 (Wootton et al., 1995) rule out the possibility that the Ca2+ release is terminated by InsP3 breakdown. There is evidence in guinea pig (Ogden et al., 1990) and rat hepatocytes (Combettes et al., 1993) that elevation of [Ca2+]i inhibits InsP3-evoked Ca2+ release. It is well documented that high [Ca2+]i inhibits the InsP3 receptor of several other cell types (Payne et al., 1988; Iino 1990; Parker and Ivorra, 1990; Bezprozvanny et al., 1991; Finch et al., 1991). Ca2+ appears to act on both closed and open InsP3 channels (Bezprozvanny et al., 1991; Finch et al., 1991; Bezprozvanny and Ehrlich, 1994). One possible mechanism for the abrupt termination is inhibition of InsP3 channels by the locally elevated [Ca2+] released by InsP3. This hypothesis was tested in two ways, first by clamping the [Ca2+]i with a high concentration of fura-2 and recording the Ca2+ flux as the increase in Ca2+-bound indicator concentration, second by producing an elevation of [Ca2+]i independently of InsP3 and testing inhibition of Ca2+ release measured by free d[Ca2+]i/dt.
High Ca2+ Buffering with Fura-2
An experiment in which [Ca2+]i was controlled is shown in Fig. 7. The stable 5-thio analogue of InsP3 was released photolytically from caged 5-thio-InsP3 to avoid complications arising from metabolism of InsP3. 5-thio-InsP3 is about 5 times less potent than InsP3 in guinea pig hepatocytes (Wootton et al., 1995). The cell was perfused from the pipette with 36 μM caged 5-thio InsP3, 10 mM fura-2, and 7.5 mM total Ca2+. There was a small activation of the Ca2+-dependent K+ conductance suggesting that the [Ca2+]i was elevated above the normal resting level as expected for this mixture. When the fura-2 fluorescence was steady, release of 5-thio InsP3 produced Ca2+ flux into the cytosol, measured as the increase of Ca2+ bound to fura-2, at a rate similar to the generation of free Ca2+ seen with furaptra as the Ca2+ indicator, but with much prolonged duration. Data from two cells are shown in Fig. 7. The upper trace shows release evoked by 2 pulses of 4.5 μM 5-thio-InsP3 separated by 2 s. Ca2+ flux in response to the first pulse is 60 μM · s−1, is increased by release of a further 4.5 μM 5-thio-InsP3 to 90 μM · s−1 2 s later, and the total duration of the response is 4 s. The lower record shows in another cell the Ca2+ flux produced by a single release of 9 μM 5-thio-InsP3, with flux also of ∼100 μM · s−1 and duration 2 s. Once the flux had declined to zero at the peak, further release of 5-thio-InsP3 evoked no further flux. In these experiments no additional activation of the Ca2+-dependent K+ conductance was seen, showing that [Ca2+]i was buffered. These data show first that the Ca2+ flux is much prolonged when [Ca2+]i is prevented from rising by high fura-2 concentrations, that the inhibition of a second pulse of InsP3, which normally occurs within 0.5 s, is not operating even at 2 s when [Ca2+]i is buffered to near resting levels, and, finally, that further release does not occur at the peak of the response even though [Ca2+]i has not changed and is near resting levels, suggesting that another inhibitory mechanism, possibly simply store depletion, has occurred.
Figure 7.
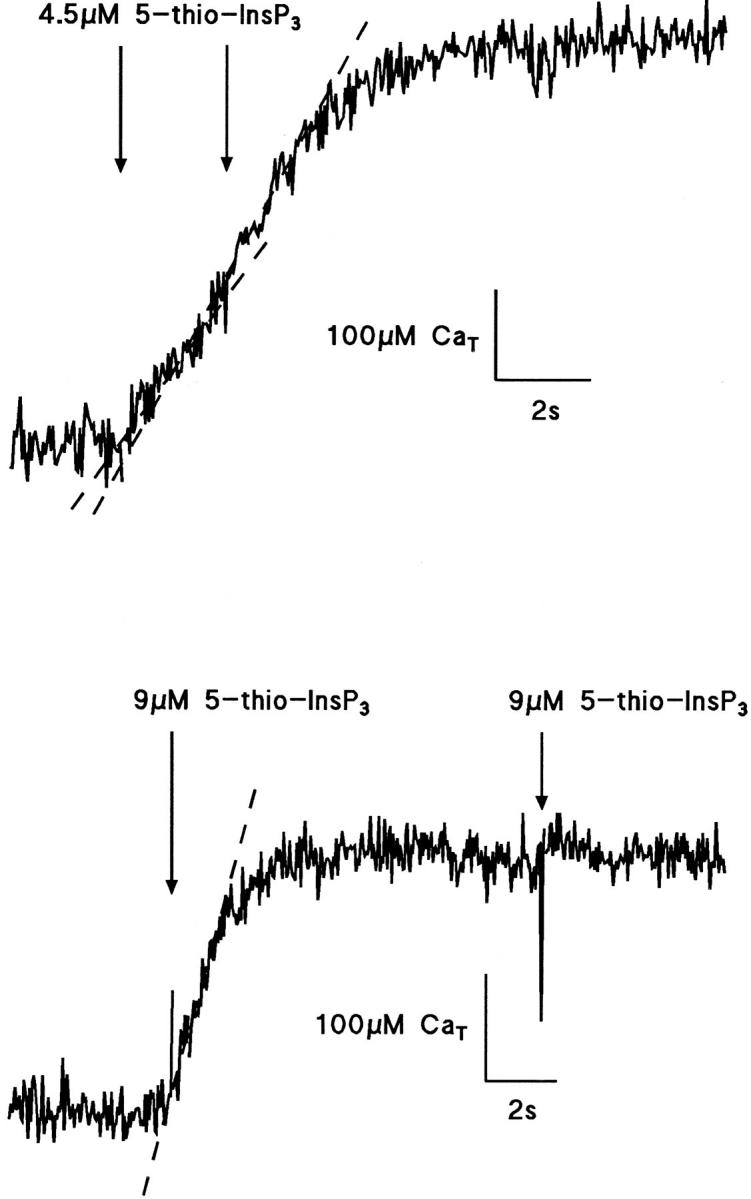
Total Ca2+ increases evoked by photolytic release of 5-thio-InsP3 in [Ca2+]i clamped cells. The two traces show the effect of photolytic release of 4.5 and 9 μM 5-thio-InsP3 in two different guinea pig hepatocytes loaded with 10 mM fura-2 and 7.5 mM Ca2+. The top trace shows the response to successive release of 4.5 μM 5-thio-InsP3 with an interval of 2 s. An increase in the rate of total Ca2+ release from 60 to 90 μM · s−1 was observed after the second release. A third release of 4.5 μM 5-thio-InsP3 at the plateau had no effect (not shown). The release of 9 μM 5-thio-InsP3 raised total Ca2+ by 200 μM at a rate of 100 μM · s−1 (bottom trace). A second release of 9 μM 5-thio-InsP3 at the plateau had no effect. Holding potential 0 mV.
Prior Elevation of [Ca2+]i
Cytosolic free [Ca2+] was raised by polarizing the membrane to −120 mV to increase Ca2+ leak from the external solution. As discussed above in connection with Fig. 3, the effects on InsP3-evoked release were to greatly reduce the latency before Ca2+ efflux, and also to decrease the magnitude of the InsP3-evoked efflux. In Fig. 3 the upper record shows the Ca2+ efflux of 5.6 μM · s−1 evoked by 1.2 μM InsP3 at 0 mV, the middle trace an InsP3-evoked efflux of 1.7 μM · s−1 2 min later in the same cell, after [Ca2+]i had been elevated to ∼2 μM by Ca2+ from the external solution at V = −120 mV, and the lower record shows a further control producing a flux of 6.2 μM · s−1 at 0 mV 2 min later. The main effect of prior elevation of [Ca2+]i to ∼2 μM was to suppress the InsP3-evoked efflux to 33% (±6% SD, n = 6) of the control flux in the same cell. This confirms more rigorously data reported previously (Ogden et al., 1990) in which elevation of [Ca2+]i by a bile acid was shown to inhibit InsP3-evoked release as judged by the rate of change of the Ca2+-dependent K+ conductance in guinea pig hepatocytes. Other effects noted in these experiments were a reduction of the delay in InsP3 activation of efflux (discussed above) and also a larger second response amplitude, possibly as a result of additional Ca2+ loading of the stores by the prior elevation of [Ca2+]i.
Rate of Termination of Ca2+ Flux Correlates with d[Ca2+]i/dt
Inspection of many [Ca2+]i records from hepatocytes, and comparison with data from other tissues such as Purkinje neurons, showed that the duration of the period of InsP3-evoked Ca2+ flux was brief when the flux was high, suggesting a mechanistic link between duration and Ca2+ flux. Evidence was presented above that InsP3-evoked flux was inhibited at the peak [Ca2+]i, indicating that the rate of the process terminating Ca2+ release determines the duration of the Ca2+ flux. The relation between duration and magnitude of flux was examined by making use of cell to cell variation of the flux, d[Ca2+]i/dt, shown in Fig. 5 D. The rate of termination was measured as the reciprocal of the 10–90% risetime of the [Ca2+]i and is plotted in Fig. 8 A against the flux measured as d[Ca2+]i/dt (moles · s−1 · liters−1 cytosol) for each response. A good linear correlation was found between the rate of termination and the magnitude of flux (r = 0.91). Further, the large cell– cell variation when Ca2+ flux or peak [Ca2+]i was plotted against InsP3 concentration (see Fig. 5) is not apparent in the dependence of duration on flux shown in Fig. 8.
Figure 8.
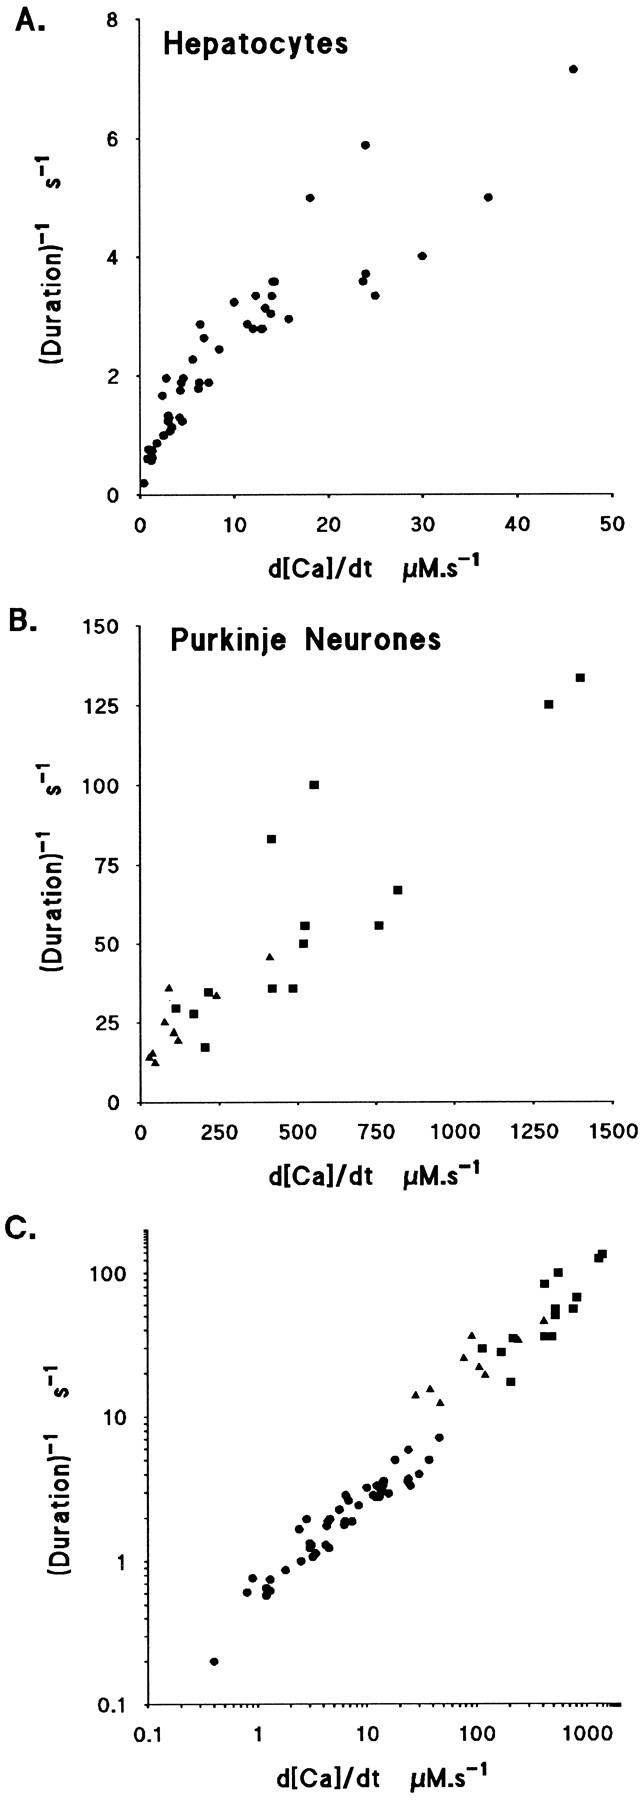
Relation between rate of termination of Ca-flux and d[Ca2+]i/dt in hepatocytes and Purkinje neurons. The duration of the InsP3-evoked Ca2+ flux estimated as the reciprocal of the 10– 90% risetime (as indicated in Fig. 1) plotted against d[Ca2+]i/dt. (A) Rate of termination (duration−1) of the rise of [Ca2+]i plotted against d[Ca2+]i /dt on linear scales data from 48 hepatocytes. (B) Data from 14 isolated Purkinje neuronal soma, linear scales. Squares represent control cells, triangles data where [Ca2+]i was elevated via voltage-dependent Ca2+ channels before InsP3 release, inhibiting d[Ca2+]i/dt to 10–20% of control. (C) Data from hepatocytes and Purkinje neurons plotted on log scales.
Cerebellar Purkinje neurons have large InsP3-evoked Ca2+ fluxes, measured by d[Ca2+]i/dt, and brief duration of [Ca2+]i rise. This difference between tissues was used to see if a similar relation holds more generally over a wide range of Ca2+ flux. A plot of data obtained with the same protocol from Purkinje neurons, shown in Fig. 8 B, also has a good correlation between rate of termination and d[Ca2+]i/dt. The data from hepatocytes and Purkinje neurons are shown plotted together on log scales in Fig. 8 C. If termination of Ca2+ flux is produced by Ca2+ binding to and inactivating channels then the rate of termination should be proportional to local Ca2+ concentration and hence the flux produced locally by open channels. The Ca2+ concentration in the cytosol close to InsP3-gated channels due to Ca2+ flux through open channels will reach a high level quickly after activation, in <10 ms at distances up to 0.5 μm (see, e.g., Stern, 1992). In this model the rate of termination should be proportional to free [Ca2+] and hence to d[Ca2+]i/dt. This mechanism and an alternative, store depletion, are discussed below.
Prolongation of [Ca2+]i Increase by High InsP3 Concentration
Evidence was obtained of prolongation of [Ca2+]i as the InsP3 concentration released by photolysis was increased and occurred even in conditions where the initial flux was the same. This effect was seen by integrating the [Ca2+]i records in twin pulse experiments and is illustrated by the experiment in Fig 9. Initially (upper trace), a single pulse of 0.4 μM InsP3 produced Ca2+ flux of d[Ca2+]i/dt = 21 μM · s−1, 10–90% risetime of high d[Ca2+]i/dt of 240 ms, and area 34 μM · s. In the middle record the InsP3 concentration was doubled by applying 2 pulses of 0.4 μM separated by 400 ms, producing no additional flux with the second pulse. The effect was to increase the area under the [Ca2+]i trace to 52 μM · s without substantially increasing the flux (25 μM · s−1), the duration of high d[Ca2+]i/dt (10– 90% rise 280 ms), or peak [Ca2+]i, thus indicating that the effect was to prolong the declining phase of [Ca2+]i by prolonging release or inhibiting sequestration of free Ca2+. Subsequent photolytic release of 1 μM InsP3 in the same cell produced a Ca2+ flux of d[Ca2+]i/dt = 38 μM · s−1, 10–90% risetime of 180 ms and area 67 μM · s, showing that responses to 0.4 μM and 2× 0.4 μM were submaximal. In five experiments of this kind the areas resulting from a single pulse releasing 1.2 μM InsP3 were compared with the areas for 2 pulses of 1.2 μM InsP3 in quick succession. The twin pulse areas were increased to 190 ± 42% (mean ± SEM, n = 5) relative to single pulse with no increase of peak flux. This can be compared with the area evoked by a single pulse releasing 2.4 μM InsP3 which produced 201 ± 30% (mean ± SEM, n = 5) of the area evoked by a single pulse of 1.2 μM InsP3 in the same cell. Comparison of the 10–90% risetimes in twin pulse experiments with those in controls shows that risetimes are prolonged by 116 ± 7% (mean ± SEM, n = 5) and that the 190% prolongation occurs predominantly after the peak [Ca2+]i. Experiments in Ca2+-free medium showed no effect of Ca2+ removal on duration and that the prolonged [Ca2+]i increase at high InsP3 concentration is not a result of enhanced Ca2+ entry from the extracellular fluid. These data suggest that the InsP3-evoked flux is prolonged at high InsP3 concentration even when the peak flux is the same as at low concentration. The simplest explanation would be repeated activation of receptors recovering from Ca2+ inactivation, an effect that would be prolonged by the higher concentrations. Alternatively, a weaker inhibitory effect of elevated free Ca2+ at higher InsP3 concentrations (Combettes et al., 1994) or a reduced rate of Ca2+ pumping into stores or out of the cell may account for the prolonged responses in double flash experiments.
Figure 9.
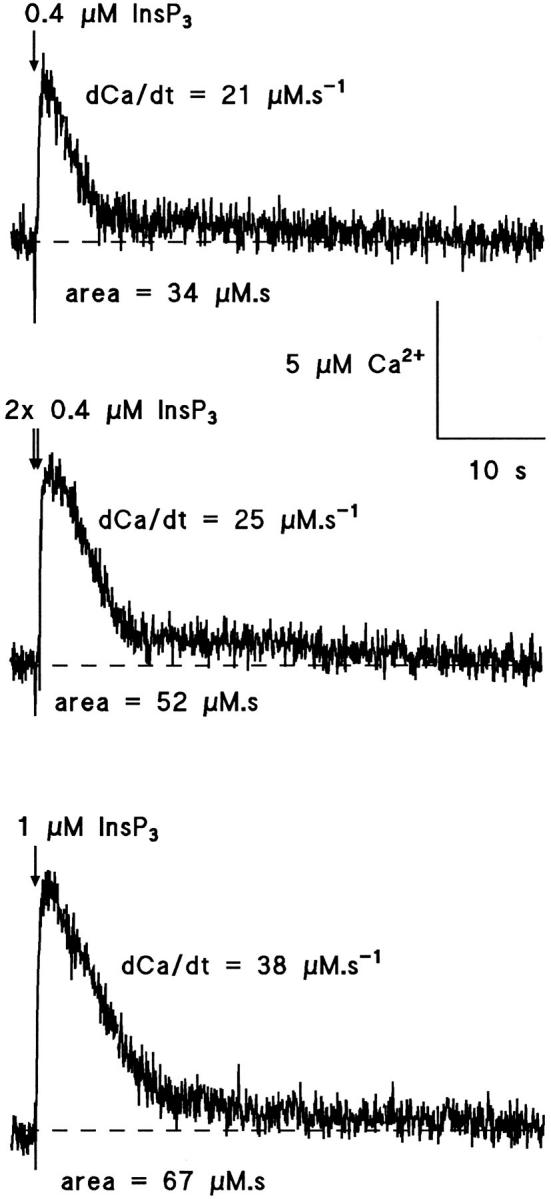
Dependence of the duration of [Ca2+]i increase on InsP3 concentration in hepatocytes. Photolytic release of InsP3 indicated by the arrows in a single hepatocyte. Areas under the [Ca2+]i increase compared between records following release of InsP3. Records separated by 2 min. 500 μM furaptra, 0 mV. (Top record) Single pulse of 0.4 μM InsP3 produced flux 21 μM · s−1, peak [Ca2+]i 6 μM and area 34 μM · s. (Middle record) Twin pulses of 0.4 μM InsP3 separated by 500 ms. Flux 25 μM · s−1, peak [Ca2+]i 7 μM and area 52 μM · s. (Lower record) Single pulse of 1 μM InsP3. Flux 38 μM · s−1, peak [Ca2+]i 9 μM, area 67 μM · s.
discussion
The hormonal activation of guinea pig hepatocytes, for example by norepinephrine, results in release of Ca2+ from intracellular stores as a series of spikes of high [Ca2+]i relative to resting [Ca2+]i, with fast rise and decline and a period of ∼20 s (Field and Jenkinson, 1987; rat hepatocytes, Woods et al., 1987). Spikes of [Ca2+]i of similar waveform and period can be generated by perfusing InsP3 directly into the cytosol from a patch pipette in whole cell patch clamp (Capiod et al., 1987; Ogden et al., 1990). This observation suggests that the mechanisms important in forming the spikes involve properties inherent in the InsP3 receptor and its interaction with InsP3 and free Ca2+. The aim of the experiments described above was to analyze in situ in single cells the kinetics of activation and inactivation of Ca2+ release, following InsP3 release as a well defined pulse, to see how receptor properties shape the Ca2+ spike. The time course of [Ca2+]i change after InsP3 release comprises a latency, a period of rapid Ca2+ efflux into the cytosol which terminates abruptly at the peak where d[Ca2+]i/dt is zero, and a slow recovery as Ca2+ is removed from the cytosol. InsP3-evoked Ca2+ flux into the cytosol was measured as the rate of change of free cytosolic [Ca2+], d[Ca2+]i/dt, and the rate of termination of the Ca2+ flux as the reciprocal of the 10– 90% risetime to the peak [Ca2+]i.
InsP3 Concentrations
InsP3 reproducibly produced Ca2+ release in hepatocytes in whole cell patch clamp at concentrations of 0.1–0.2 μM or greater, approximately the same as that reported in permeabilized guinea pig hepatocytes (Burgess et al., 1984; Combettes et al., 1989) and similar to those in whole cell clamp endothelial cells (Carter and Ogden, 1992) and astrocytes, but much less than the concentrations needed in cerebellar Purkinje neurons (Khodakhah and Ogden, 1993). As judged by shortening of delays and the saturation of d[Ca2+]i/dt, maximal InsP3 concentrations were between 2 and 10 μM.
At low InsP3 concentration (0.4 μM), a delay of mean 290 ms was found between release and the start of Ca2+ flux. In a previous study with photorelease of metabolically stable 5-thio-InsP3 in hepatocytes, it was found that delays of many seconds duration occurred at low concentrations of 5-thio InsP3 (Wootton et al., 1995), suggesting that in the absence of phosphatase activity lower concentrations of InsP3 might be effective and produce longer delays. Further, this observation suggests that the accumulation of InsP3 is important during hormone action, requiring InsP3 generation locally at a rate that exceeds breakdown in order to produce a response and resulting in gradients of InsP3 concentration (see Marty et al., 1989, for discussion).
It was found that the [Ca2+]i increase was prolonged as InsP3 concentration was increased and was due to an action additional to the increase in peak Ca2+ flux. This effect was demonstrated in closely spaced twin pulse experiments when, although the InsP3 concentration was doubled, the peak flux activated was not increased and the duration of elevated [Ca2+]i increased by a factor of 1.9. Comparison of 10–90% risetimes between twin pulse and control responses shows that the prolongation occurs after the peak [Ca2+]i when the efflux from stores has fallen to a low level. If InsP3 remaining after the peak [Ca2+]i produces a low level of Ca2+ release, possibly due to the recycling of inactivated InsP3 channels on a seconds timescale, then this result is expected simply because the higher concentration takes longer to metabolize and the low level activation of receptors persists for longer. The possibility that a second pool of activatable receptors is recruited to produce the prolongation is not supported by the observation that the second pulse of InsP3 produces no immediate increase in Ca2+ flux into the cytosol, requiring simultaneous activation of a new pool of receptors as the initial pool is inhibited to sustain this explanation. The importance of breakdown of InsP3 in the total duration of action is also apparent from data with 5-thio-InsP3, which induces a small, steady, persistent component of Ca2+ release in hepatocytes (Wootton et al., 1995) and Purkinje neurons (Khodakhah and Ogden, 1995).
Origin of the Delay in Activation of Ca2+ Efflux at Low InsP3 Concentrations
The delay between InsP3 release in the cytosol and the rise of fluorescence of fluo-3 from baseline levels at resting [Ca2+]i decreased from mean 290 ms at 0.4 μM InsP3 to 30 ms or less at high concentration, close to the kinetic limit imposed by photolytic release of InsP3. Similar delays were reported in fast perfusion experiments with permeabilized guinea pig hepatocytes (Champeil et al., 1989). Delays have also been reported in InsP3 activation of Ca2+ release in smooth muscle (Walker et al., 1987; Somlyo et al., 1992), RBL cells (Meyer et al., 1990), oocytes (Parker and Ivorra, 1990), and Purkinje neurons (Khodakhah and Ogden, 1993, 1995). Evidence that Ca2+ ions act cooperatively with InsP3, thus generating the delay at low InsP3 concentration, was obtained in experiments in which the [Ca2+]i was elevated before InsP3 release, resulting in delays reduced or abolished when compared with controls in the same cell. In previous work (Ogden et al., 1990), elevation of [Ca2+]i by a bile acid was shown to reduce the delay in the activation of the Ca2+-dependent K+ conductance. Reduction of the latency has also has been reported by Iino and Endo (1992) in smooth muscle and by Parker et al. (1996) in Xenopus oocytes. The whole cell averaged [Ca2+]i required to produce this effect here was ∼2 μM, but the local concentration could be different because influx is via the plasma membrane. In the same recordings, it was found that [Ca2+]i was high enough to have produced inhibition of the InsP3-evoked Ca2+ efflux.
A minimal delay at high InsP3 concentration has been reported in 2 studies, by Parker et al. (1996) in Xenopus oocytes with a protocol similar to that used here, who found a minimal delay of about 30 ms at resting [Ca2+]i, and by Marchant and Taylor (1996) who found a minimal delay of about 30 ms in a perfused microsomal preparation of hepatocytes. Champeil et al. (1989) found a minimum resolvable delay of 20 ms in perfused permeabilized hepatocytes, which is, however, attributable to the resolution of rapid mixing studies. In the experiments reported here, the mean latency at 5–10 μM InsP3 was 30 ms with a minimum of 25 ms. The photolysis of caged InsP3 has a half-time of 3 ms, so it might be expected that a 5–10-fold supramaximal concentration would act with no detectable delay. Responses at 25–100 μM InsP3 showed delays that could be distinguished from the optical artifact, supporting the idea that there is a minimal delay. The effect of raising [Ca2+]i in reducing the delay to zero supports the interpretation of Parker et al. (1996) that Ca2+ priming of the receptor occurs before activation by InsP3.
It is not clear from the present experiments, as in many other studies, whether there is cooperativity produced by multiple InsP3 binding at constant [Ca2+]i, as reported at low InsP3 concentrations in RBL cells (Meyer et al., 1988). The concentrations of InsP3 are higher here than those required in RBL and may be in the range where the “low concentration” Hill coefficient is substantially underestimated.
The delay in activation of the Ca2+-dependent K+ conductance is 100 ms longer than the delay of fluo-3 fluorescence at all but very high InsP3 concentrations. This can be explained by the activation of the Ca2+- dependent K+ conductance at free [Ca2+] greater than resting levels and by the strongly cooperative activation by Ca2+ (Ogden et al., 1990; Capiod and Ogden, 1989a ). There is no evidence that the additional delay in activation of the conductance results from slow diffusion of Ca2+ to the membrane.
InsP3-evoked Ca2+ Flux
After the latency, free [Ca2+] rises quite linearly with a rate, d[Ca2+]i/dt, that depends on the flux of Ca2+ into unit cytosolic volume (moles · s−1 · liter−1) and on the proportion of Ca2+ bound to endogenous and exogenous buffers. If the unitary flux through InsP3-gated channels is similar from one to another, then d[Ca2+]i/dt measures in each cell the density of channels open in unit volume. This quantity d[Ca2+]i/dt was found to increase with InsP3 concentration up to 2.4 μM in each cell without showing evidence of cooperative InsP3 binding and was maximal by about 7 μM. In guinea pig hepatocytes the peak [Ca2+]i also increased with InsP3 concentration in this range in each cell but with lower slope. The peak [Ca2+]i at high InsP3 concentration were 5–9.5 μM and rates of change d[Ca2+]i/dt up to 52 μM · s−1. These maximum values are small compared with cerebellar Purkinje neurons (Khodakhah and Ogden, 1995) and aortic endothelial cells (Carter and Ogden, manuscript in preparation) examined with the same methods, but are generally high compared with [Ca2+]i reported for hormonal stimulation of hepatocytes in studies with fluorescent Ca2+ indicators (for review, Rooney and Thomas, 1991). In Xenopus oocytes (Parker et al., 1996), an increase in the flux, measured as rate of change of calcium green fluorescence, was found as InsP3 concentration was increased, although the InsP3 and Ca2+ concentrations were not measured.
A striking finding in these experiments was a large cell to cell variation in d[Ca2+]i/dt measured at each InsP3 concentration. This may be due to a large variation in density of InsP3 receptors from cell to cell, a variation in the driving potential for Ca2+ efflux due to different degrees of store loading, or different extents of Ca2+ binding to cytosolic buffers. A large variation of peak [Ca2+]i from cell to cell was also found here and in cerebellar Purkinje neurons (Khodakhah and Ogden, 1995).
Termination of InsP3-evoked Ca2+ Release: Comparison with Cerebellar Purkinje Neurons
The net flux into the cytosol at the peak [Ca2+]i is zero, indicating that the Ca2+ flux due to InsP3 has declined to a low level at this time. It was noted that the duration of the period of high, fairly constant d[Ca2+]i/dt during the rise of [Ca2+]i was shortened when flux, d[Ca2+]i/dt, was high. The rate of the process underlying the termination of flux, whatever the mechanism, can be represented by the reciprocal of the 10–90% rise time of [Ca2+]i. A good linear correlation was found between this rate and d[Ca2+]i/dt in liver cells, shown in Fig. 8 A, suggesting a simple one-step mechanism. The d[Ca2+]i/dt represents the flux of free Ca2+ into unit cytosolic volume and will depend on the density of InsP3 receptors. To test this idea, data from Purkinje neurons, which have a very high receptor density and high Ca2+ flux into the cytosol (Khodakhah and Ogden, 1995), were analyzed and presented in the same way in Fig. 8 B. A linear correlation with similar slope was found but over a much higher range of flux, suggesting that the same mechanism operates to terminate the Ca2+ flux in Purkinje neurons. The data from hepatocytes and Purkinje neurons are plotted together in Fig. 8 C on log–log scales, illustrating a similar correlation over a wide range, four log units, in both tissues. The large cell–cell variability seen when the flux or free [Ca2+] were plotted against InsP3 concentration, was not present in the correlation between duration and flux, supporting a mechanistic link between rate of termination and the flux. Empirically, this correlation indicates that high Ca2+ flux into the cytosol via InsP3 channels, produced, for instance, by a high channel density as in Purkinje neurons, results in a more rapid termination of Ca2+ release, producing a fast rising but brief pulse of free [Ca2+]. Local differences in InsP3 receptor density might be expected to produce localized fast rising, brief free [Ca2+] changes, as well as producing localized high InsP3 sensitivity as proposed by Hirose and Iino (1994).
Mechanism of Termination
The rate of termination correlates with the rate of appearance of free [Ca2+] in the cytosol of hepatocytes and Purkinje neurons over a wide range of flux. Purkinje neurons have a very large endogenous Ca2+ buffering, estimated as 2,000 Ca2+ ions bound for each free, due to high density of Ca2+-binding proteins (Fierro and Llano, 1996), compared with estimates of 50–100:1 in other cells (Neher, 1995), supporting the idea that free Ca2+ is important rather than total Ca2+ flux. The inhibition produced by cytosolic free [Ca2+] of the InsP3 receptor has been shown in many tissues (Payne et al., 1988; Iino, 1990; Ogden et al., 1990; Ivorra and Parker, 1990; Bezprozvanny et al., 1991; Finch et al., 1991; Combettes et al., 1993). Strong inhibition of InsP3-evoked Ca2+ release by Ca2+ influx through voltage-gated channels has been shown in Purkinje neurons (Khodakhah and Ogden, 1995) and through nicotinic channels in Xenopus oocytes (Parker et al., 1996). Similar experiments were less straightforward in hepatocytes. Previously (Ogden et al., 1990), a bile acid had been used to release Ca2+ from InsP3-independent stores and shown to reduce the rate of rise of the Ca2+-dependent K+ conductance after InsP3 release. In the present study, the [Ca2+]i was raised more reproducibly by polarizing the membrane to −120 mV to increase the leak of Ca2+, and [Ca2+]i was measured here with a fluorescent indicator. InsP3-evoked flux was inhibited to ∼33% by prior elevation of [Ca2+]i to ∼2 μM. Controlling the [Ca2+]i close to resting levels with a high concentration of free fura-2 during InsP3-evoked release prolonged the period of flux and prevented inactivation of the response normally seen to a second pulse of InsP3 (5-thio-InsP3 in this case). These experiments support the idea that free Ca2+ adjacent to the release sites inactivates InsP3 receptor/channels. The free Ca2+ close to open channels is proportional to the flux through the channels and is established very quickly, in ∼10 ms at 0.5 μm calculated on the basis of Ca2+ diffusion from a discrete source (see Stern, 1992; Roberts, 1994). The linear correlation between rate of termination and free d[Ca2+]i/dt, measuring flux into unit cytosolic volume, can therefore be explained by accumulation of free [Ca2+] close to the release sites and a first order inactivation by Ca2+ binding to channels. Open channels have a high and invariant [Ca2+] within the channel because of high constant flux density in the pore, and fast inactivation by pore [Ca2+] has been reported to determine the channel open lifetime of 2–3 ms (Bezprozvanny and Ehrlich, 1994). The whole cell flux d[Ca2+]i/dt measured here depends on the open probability of InsP3 channels and operates on a slower timescale of 10–1,000 ms. Peak open probability of InsP3-gated channels is low (<0.15; Bezprozvanny et al., 1991) so a large proportion of channels are closed even with high InsP3 concentrations. Because open channels have a high, constant rate of inhibition due to high pore [Ca2+], the dependence of termination rate on whole cell flux indicates an inhibition of closed channels by Ca2+ accumulating in the cytosol within a few hundred nm adjacent to open channels, an effect that would increase at high density of open channels (observed here as high d[Ca2+]i/dt). This is supported by the observations discussed in connection with Fig. 6, that a second pulse of InsP3 is ineffective even when applied during the period of high flux when open probability is high but submaximal, indicating that the process terminating flux acts on the closed channels. The first order dependence on [Ca2+]i implied in the linear correlation between rate of termination and flux in both hepatocytes and Purkinje neurons differs from the conclusions of Oancea and Meyer (1996) from Ca2+ injection experiments, who found a relation suggesting 3–4 Ca2+ ions bind to produce inhibition of InsP3-evoked Ca2+ transients in RBL cells.
Alternatively, the correlation between duration and size of flux could also be explained on the basis of store depletion, the higher the flux the sooner store Ca2+ runs out. The observation that the peak [Ca2+]i is increased by increasing the InsP3 concentration released in each cell, showing that, at low InsP3, stores are not depleted when the flux is terminated. Furthermore, the prolonged responses in high fura-2 concentration also argue against store depletion acting alone. However, the observation, e.g., in Fig. 3, that loading the store by increasing Ca2+ influx into the cytosol increases the peak [Ca2+]i evoked by InsP3 indicates that store loading can influence Ca2+ flux in hepatocytes. The strong inhibitory effect of raised [Ca2+]i suggests that Ca2+ feedback is the primary mechanism, but store depletion or InsP3-evoked desensitization of receptors (Hajnozcky and Thomas, 1994; Ilyin and Parker, 1994) may contribute to termination of the Ca2+ flux.
The conclusions from these experiments are (a) that the properties of the InsP3 receptor can account for the time course of [Ca2+]i spikes in guinea pig hepatocytes, the onset and rise determined by the activation and inactivation of InsP3 receptor, and the minimum duration of the interspike period by the recovery of InsP3 sensitivity described previously (Ogden et al., 1990), and (b) that the differences in kinetics of InsP3-evoked Ca2+-release between hepatocytes and Purkinje neurons can be explained by the differences in InsP3 receptor density. The longer latencies at low concentration, slower rise of free [Ca2+], and longer duration of the InsP3-evoked flux into the cytosol are mostly explicable by the low density of InsP3 receptors in liver, producing small flux and correspondingly long periods of Ca2+ release due to slow Ca2+-inactivation of release channels. These properties are consistent with prolonged, pulsatile Ca2+ signalling in liver cells which underlies hormonal regulation of processes such as glycogenolysis. The different receptor subtypes, mainly type 2 InsP3 receptors with some type 1 in hepatocytes, and type 1 alone in Purkinje neurons (DeSmedt et al., 1994) would appear secondary to receptor density in determining the kinetics of Ca2+ release but may be important in determining other factors such as InsP3 sensitivity or susceptibility to phosphorylation. More generally, the linear relation between Ca2+ flux into unit cytosolic volume and rate of termination of Ca2+ release, shown here for hepatocytes and Purkinje neurons over a wide range of Ca2+ flux, indicates that regulation of the InsP3 receptor by cytosolic free [Ca2+] produces fast rising but brief pulses of [Ca2+]i at high InsP3 receptor densities.
Acknowledgments
We thank Laurent Combettes (INSERM U442, Orsay, France) for comments on the manuscript, and David Trentham and John Wootton (National Institute of Medical Research, Mill Hill, London) for providing caged InsP3 and caged 5-thio-InsP3.
Footnotes
The work was supported by the Medical Research Council, MRC-INSERM exchange and by the Franco-British Joint Research Program ALLIANCE.
Preliminary accounts of this work have been previously published in abstract form (Ogden, D.C., T. Capiod, and T. Carter. 1991. J. Physiol. (Lond.). 434:39P; Ogden, D.C., and T. Capiod. 1994. Biophys. J. 66: A49; Ogden, D.C., T. Carter, and T. Capiod. 1996. Biophys. J. 70: A180).
Thierry Capiod's permanent address is INSERM U442, UPS Bât.443, 91405 Orsay, France.
references
- Baylor SM, Hollingworth S. Fura-2 calcium transients in frog skeletal muscle fibres. J Physiol (Lond) 1988;403:151–192. doi: 10.1113/jphysiol.1988.sp017244. [DOI] [PMC free article] [PubMed] [Google Scholar]
- Berridge MJ. Inositol trisphosphate induced membrane potential oscillations in Xenopusoocytes. J Physiol (Lond) 1988;403:589–599. doi: 10.1113/jphysiol.1988.sp017266. [DOI] [PMC free article] [PubMed] [Google Scholar]
- Bezprozvanny I, Ehrlich BE. Inositol (1,4,5)-trisphosphate (InsP3)-gated Ca channels from cerebellum: conduction properties for divalent cations and regulation by intraluminal calcium. J Gen Physiol. 1994;104:821–856. doi: 10.1085/jgp.104.5.821. [DOI] [PMC free article] [PubMed] [Google Scholar]
- Bezprozvanny I, Watras J, Ehrlich BE. Bell-shaped calcium-response curves of Ins(1,4,5)P3-gated and calcium-gated channels from endoplasmic reticulum of cerebellum. Nature (Lond) 1991;351:751–754. doi: 10.1038/351751a0. [DOI] [PubMed] [Google Scholar]
- Burgess GM, Irvine RF, Berridge MJ, McKinney JS, Putney JW. Actions of inositol phosphates on Ca2+pools in guinea-pig hepatocytes. Biochem J. 1984;224:741–746. doi: 10.1042/bj2240741. [DOI] [PMC free article] [PubMed] [Google Scholar]
- Capiod T, Field AC, Ogden DC, Sandford CA. Internal perfusion of guinea-pig hepatocytes with buffered Ca2+ or inositol 1,4,5-trisphosphate mimics noradrenaline activation of K+ and Cl−conductances. FEBS Lett. 1987;217:247–252. doi: 10.1016/0014-5793(87)80672-5. [DOI] [PubMed] [Google Scholar]
- Capiod T, Ogden DC. The properties of calcium-activated potassium ion channels in guinea-pig isolated hepatocytes. J Physiol (Lond) 1989a;409:285–295. doi: 10.1113/jphysiol.1989.sp017497. [DOI] [PMC free article] [PubMed] [Google Scholar]
- Capiod T, Ogden DC. Properties of membrane ion conductances evoked by hormonal stimulation of guinea-pig and rabbit isolated hepatocytes. Proc R Soc B. 1989b;236:187–201. doi: 10.1098/rspb.1989.0020. [DOI] [PubMed] [Google Scholar]
- Carter TD, Ogden DC. Kinetics of intracellular calcium release by inositol 1,4,5-trisphosphate and extracellular ATP in porcine cultured aortic endothelial cells. Proc R Soc B. 1992;250:235–241. doi: 10.1098/rspb.1992.0154. [DOI] [PubMed] [Google Scholar]
- Champeil P, Combettes L, Berthon B, Doucet E, Orlowski S, Claret M. Fast kinetics of calcium release induced by myo-inositol trisphosphate in permeabilized rat hepatocytes. J Biol Chem. 1989;264:17665–17673. [PubMed] [Google Scholar]
- Cobbold PH, Sanchez-Bueno A, Dixon CJ. The hepatocyte calcium oscillator. Cell Calcium. 1991;12:87–95. doi: 10.1016/0143-4160(91)90011-3. [DOI] [PubMed] [Google Scholar]
- Combettes L, Berthon B, Doucet E, Erlinger S, Claret M. Characteristics of bile acid mediated calcium release from permeabilized liver cells and live microsomes. J Biol Chem. 1989;264:157–167. [PubMed] [Google Scholar]
- Combettes L, Claret M, Champeil P. Calcium control on InsP3-induced discharge of calcium from permeabilised hepatocyte pools. Cell Calcium. 1993;14:279–292. doi: 10.1016/0143-4160(93)90049-c. [DOI] [PubMed] [Google Scholar]
- Combettes L, Hannaert-Merah Z, Coquil JF, Rousseau C, Claret M, Swillens S, Champeil P. Rapid filtration studies of the effect of cytosolic Ca2+ on inositol 1,4,5-trisphosphate-induced 45Ca2+release from cerebellar microsomes. J Biol Chem. 1994;269:17561–17571. [PubMed] [Google Scholar]
- DeSmedt H, Missiaen L, Parys JB, Bootman MD, Mertens L, VanDenBosch L, Casteels R. Determination of relative amounts of inositol trisphosphate receptor mRNA isoforms by ratio polymerase chain reaction. J Biol Chem. 1994;269:21691–21698. [PubMed] [Google Scholar]
- Field AC, Jenkinson DH. The effect of noradrenaline on the ion permeability of isolated mammalian hepatocytes, studied by intracellular recording. J Physiol (Lond) 1987;392:493–512. doi: 10.1113/jphysiol.1987.sp016793. [DOI] [PMC free article] [PubMed] [Google Scholar]
- Fierro L, Llano I. High endogenous calcium buffering in Purkinje cells from rat cerebellar slices. J Physiol (Lond) 1996;496:617–625. doi: 10.1113/jphysiol.1996.sp021713. [DOI] [PMC free article] [PubMed] [Google Scholar]
- Finch EA, Turner TJ, Goldin SM. Calcium as a coagonist of inositol 1,4,5-trisphosphate induced calcium release. Science (Wash DC) 1991;252:443–446. doi: 10.1126/science.2017683. [DOI] [PubMed] [Google Scholar]
- Hajnoczky G, Thomas AP. The inositol trisphosphate calcium channel is inactivated by inositol trisphosphate. Nature (Lond) 1994;370:474–477. doi: 10.1038/370474a0. [DOI] [PubMed] [Google Scholar]
- Hamill OP, Marty A, Neher E, Sakmann B, Sigworth FJ. Improved patch-clamp techniques for high-resolution current recording from cells and cell-free membrane patches. Pflüg Arch. 1981;391:85–100. doi: 10.1007/BF00656997. [DOI] [PubMed] [Google Scholar]
- Hirose K, Iino M. Heterogeneity of channel density in inositol 1,4,5-trisphosphate-sensitive Ca2+stores. Nature (Lond) 1994;372:791–794. doi: 10.1038/372791a0. [DOI] [PubMed] [Google Scholar]
- Iino M. Biphasic Ca2+ dependence of inositol 1,4,5-trisphosphate-induced Ca2+release in smooth muscle cells of the guinea-pig Taenia Caeci. J Gen Physiol. 1990;95:1103–1122. doi: 10.1085/jgp.95.6.1103. [DOI] [PMC free article] [PubMed] [Google Scholar]
- Iino M, Endo M. Calcium-dependent immediate feedback control of inositol 1,4,5-trisphosphate-induced Ca2+release. Nature (Lond) 1992;360:76–78. doi: 10.1038/360076a0. [DOI] [PubMed] [Google Scholar]
- Ilyin V, Parker I. Role of cytosolic Ca2+ in inhibition of InsP3-evoked Ca2+ release in Xenopusoocytes. J Physiol (Lond) 1994;477:503–509. doi: 10.1113/jphysiol.1994.sp020211. [DOI] [PMC free article] [PubMed] [Google Scholar]
- Khodakhah K, Ogden DC. Functional heterogeneity of calcium release by inositol 1,4,5-trisphosphate in single Purkinje neurons, cultured cerebellar astrocytes and peripheral tissues. Proc Natl Acad Sci USA. 1993;90:4976–4980. doi: 10.1073/pnas.90.11.4976. [DOI] [PMC free article] [PubMed] [Google Scholar]
- Khodakhah K, Ogden DC. Fast activation and inactivation of inositol trisphosphate evoked calcium release in rat cerebellar Purkinje neurons. J Physiol (Lond) 1995;487:343–358. doi: 10.1113/jphysiol.1995.sp020884. [DOI] [PMC free article] [PubMed] [Google Scholar]
- Konishi M, Hollingworth S, Hawkins AB, Baylor SM. Myoplasmic Ca transients in intact frog skeletal muscle fibres monitored with the fluorescent indicator furaptra. J Gen Physiol. 1991;97:271–302. doi: 10.1085/jgp.97.2.271. [DOI] [PMC free article] [PubMed] [Google Scholar]
- Marchant, J.S., and C.W. Taylor. 1996. Delayed opening of inositol trisphosphate receptors in permeabilized rat hepatocytes. J. Physiol. (Lond.). 495:85P (Abstr.).
- Marshall ICB, Taylor CW. Biphasic effects of cytosolic Ca2+ on Ins(1,4,5)P3-stimulated Ca2+-mobilization in hepatocytes. J Biol Chem. 1993;268:13214–13220. [PubMed] [Google Scholar]
- Marty, A., R. Horn, Y.P. Tan, and J. Zimmerberg. 1989. Delay of the Ca mobilization response to muscarinic stimulation. In Secretion and Its Control. G. Oxford and C.M. Armstrong, editors. The Rockefeller University Press, New York. 97–110. [PubMed]
- Meyer T, Holowka D, Stryer L. Highly cooperative opening of calcium channels by inositol 1,4,5-trisphosphate. Science (Wash DC) 1988;240:653–656. doi: 10.1126/science.2452482. [DOI] [PubMed] [Google Scholar]
- Meyer T, Wensel T, Stryer L. Kinetics of calcium channel opening by inositol 1,4,5-trisphosphate. Biochemistry. 1990;29:32–37. doi: 10.1021/bi00453a004. [DOI] [PubMed] [Google Scholar]
- Neher E. The use of Fura-2 for estimating Ca buffers and Ca fluxes. Neuropharmacology. 1995;34:1423–1442. doi: 10.1016/0028-3908(95)00144-u. [DOI] [PubMed] [Google Scholar]
- Oancea E, Meyer T. Reversible desensitisation of inositol trisphosphate-induced calcium release provides a mechanism for repetitive calcium spikes. J Biol Chem. 1996;271:17253–17260. doi: 10.1074/jbc.271.29.17253. [DOI] [PubMed] [Google Scholar]
- Ogden DC, Capiod T, Walker JW, Trentham DR. Kinetics of the conductance evoked by noradrenaline, inositol trisphosphate or Ca2+in guinea-pig isolated hepatocytes. J Physiol (Lond) 1990;422:585–602. doi: 10.1113/jphysiol.1990.sp018002. [DOI] [PMC free article] [PubMed] [Google Scholar]
- Ogden DC, Khodakhah K, Carter TD, Thomas M, Capiod T. Mechanisms of intracellular Ca release during hormone and neurotransmitter action investigated with flash photolysis. Pflüg Arch. 1995;429:587–591. doi: 10.1007/BF00704165. [DOI] [PubMed] [Google Scholar]
- Ogden DC, Khodakhah K, Gray PTA, Carter TD, Capiod T. Mechanisms of intracellular Ca release during hormone and neurotransmitter action investigated with flash photolysis. J Exp Biol. 1993;184:105–127. doi: 10.1242/jeb.184.1.105. [DOI] [PubMed] [Google Scholar]
- Parker I, Ivorra I. Inhibition by Ca2+ of inositol trisphosphate-mediated Ca2+ liberation: a possible mechanism for oscillatory release of Ca2+ . Proc Natl Acad Sci USA. 1990;87:260–264. doi: 10.1073/pnas.87.1.260. [DOI] [PMC free article] [PubMed] [Google Scholar]
- Parker I, Yao Y, Ilyin V. Fast kinetics of calcium liberation induced in Xenopusoocytes by photoreleased inositol trisphosphate. Biophys J. 1996;70:222–237. doi: 10.1016/S0006-3495(96)79565-6. [DOI] [PMC free article] [PubMed] [Google Scholar]
- Payne R, Walz B, Levy S, Fein A. The localization of Ca release in Limulus photoreceptors and its control by negative feedback. Phil Trans R Soc B. 1988;320:359–370. doi: 10.1098/rstb.1988.0082. [DOI] [PubMed] [Google Scholar]
- Pietri F, Hilly M, Mauger JP. Calcium mediates the interconversion of two states of the liver inositol 1,4,5-trisphosphate receptor. J Biol Chem. 1990;265:17478–17485. [PubMed] [Google Scholar]
- Rapp G, Guth K. A low cost high intensity flash device for photolysis experiments. Pflüg Arch. 1988;411:200–203. doi: 10.1007/BF00582315. [DOI] [PubMed] [Google Scholar]
- Raju B, Murphy E, Levy LA, Hall RD, London RE. A fluorescent indicator for measuring cytosolic free magnesium. Am J Physiol. 1989;256:C540–C548. doi: 10.1152/ajpcell.1989.256.3.C540. [DOI] [PubMed] [Google Scholar]
- Roberts WM. Localisation of calcium signals by a mobile calcium buffer in frog saccular hair cells. J Neurosci. 1994;14:3246–3262. doi: 10.1523/JNEUROSCI.14-05-03246.1994. [DOI] [PMC free article] [PubMed] [Google Scholar]
- Rooney TA, Thomas AP. Organization of intracellular calcium signals generated by inositol lipid-dependent hormones. Pharmacol Ther. 1991;49:223–237. doi: 10.1016/0163-7258(91)90056-r. [DOI] [PubMed] [Google Scholar]
- Somlyo AV, Horiuti K, Trentham DR, Kitazawa T, Somlyo AP. Kinetics of InsP3-induced Ca2+ release and contraction induced by photolysis of caged D-myoinositol 1,4,5-trisphosphate in smooth muscle- the effects of heparin, procaine and adenine nucleotides. J Biol Chem. 1992;267:22316–22322. [PubMed] [Google Scholar]
- Stern MD. Buffering of calcium in the vicinity of a channel pore. Cell Calcium. 1992;13:183–192. doi: 10.1016/0143-4160(92)90046-u. [DOI] [PubMed] [Google Scholar]
- Walker JW, Feeney J, Trentham DR. Photolabile precursors of inositol phosphates. Preparation and properties of 1-(2-nitrophenyl)ethyl esters of myo-inositol 1,4,5-trisphosphate. Biochemistry. 1989;28:3272–3280. doi: 10.1021/bi00434a023. [DOI] [PubMed] [Google Scholar]
- Walker JW, Somlyo AV, Goldman YE, Somlyo AP, Trentham DR. Kinetics of smooth and skeletal muscle activation by laser pulse photolysis of caged inositol 1,4,5-trisphosphate. Nature (Lond) 1987;327:249–252. doi: 10.1038/327249a0. [DOI] [PubMed] [Google Scholar]
- Woods NM, Cuthbertson KSR, Cobbold PH. Agonist induced oscillations in cytoplasmic free calcium ion concentration. Cell Calcium. 1987;8:79–100. doi: 10.1016/0143-4160(87)90038-8. [DOI] [PubMed] [Google Scholar]
- Wootton JF, Corrie JET, Capiod T, Feeney J, Trentham DR, Ogden DC. Kinetics of cytosolic Ca2+ concentration following photolytic release of 1D-myo-inositol 1,4-bisphosphate 5-phosphorothioate (5-thio-InsP3) from a caged derivative in guinea pig hepatocytes. Biophys J. 1995;68:2601–2607. doi: 10.1016/S0006-3495(95)80444-3. [DOI] [PMC free article] [PubMed] [Google Scholar]
- Zhao M, Hollingworth S, Baylor SM. Properties of tri- and tetracarboxylate Ca2+indicators in frog skeletal muscle fibers. Biophys J. 1996;70:896–916. doi: 10.1016/S0006-3495(96)79633-9. [DOI] [PMC free article] [PubMed] [Google Scholar]
- Zhou Z, Neher E. Mobile and immobile calcium buffers in bovine adrenal chromaffin cells. J Physiol (Lond) 1993;469:245–273. doi: 10.1113/jphysiol.1993.sp019813. [DOI] [PMC free article] [PubMed] [Google Scholar]