

Abstract
In this and the following paper we have examined the kinetic and steady-state properties of macroscopic mslo Ca-activated K+ currents in order to interpret these currents in terms of the gating behavior of the mslo channel. To do so, however, it was necessary to first find conditions by which we could separate the effects that changes in Ca2+ concentration or membrane voltage have on channel permeation from the effects these stimuli have on channel gating. In this study we investigate three phenomena which are unrelated to gating but are manifest in macroscopic current records: a saturation of single channel current at high voltage, a rapid voltage-dependent Ca2+ block, and a slow voltage-dependent Ba2+ block. Where possible methods are described by which these phenomena can be separated from the effects that changes in Ca2+ concentration and membrane voltage have on channel gating. Where this is not possible, some assessment of the impact these effects have on gating parameters determined from macroscopic current measurements is provided. We have also found that without considering the effects of Ca2+ and voltage on channel permeation and block, macroscopic current measurements suggest that mslo channels do not reach the same maximum open probability at all Ca2+ concentrations. Taking into account permeation and blocking effects, however, we find that this is not the case. The maximum open probability of the mslo channel is the same or very similar over a Ca2+ concentration range spanning three orders of magnitude indicating that over this range the internal Ca2+ concentration does not limit the ability of the channel to be activated by voltage.
Keywords: calcium, potassium channel, BK channel, ion channel gating, barium
introduction
Large conductance Ca-activated K+ channels (often referred to as BK channels)1 have served particularly well as a model system for the study of both channel gating and ion permeation (Latorre et al., 1989; Marty, 1989; McManus, 1991). These channels are found in a wide variety of tissues where they play important roles in a number of physiological processes, for example: smooth muscle contraction (Kume et al., 1989; Jones et al., 1990; Kotlikoff, 1993; Nelson et al., 1995), neurotransmitter release (Roberts et al., 1990; Robitaille and Charlton, 1992; Robitaille et al., 1993), and epithelial ion transport and secretion (Petersen and Maruyama, 1984; Petersen, 1986; Marty, 1989). They have large single channel conductances, typically 150–300 picosiemens, and yet maintain a high degree of selectivity for K+ over other monovalent and divalent ions (Blatz and Magleby, 1984; Yellen, 1984). The gating of BK channels is sensitive to changes in membrane potential as well as to changes in intracellular Ca2+ concentration (Marty, 1981; Pallotta et al., 1981; Barrett et al., 1982; Latorre et al., 1982; Methfessel and Boheim, 1982; Moczydlowski and Latorre, 1983). These channels therefore exhibit many of the essential behaviors of ion channels including: ligand gating, voltage gating, high ion transport rates, and strong ion selectivity—making them an ideal model channel for mechanistic studies. Because of their unusually large single channel conductances, currents from single BK channels can be easily recorded, and studies over the past fifteen years have primarily examined the behavior of these channels at the single channel level. In fact it has been difficult to study these channels as a population in native cells due to difficulties with low channel density, contaminating currents, or controlling the intracellular Ca2+ concentration.
Recently the pore forming α subunits of BK channels from fly (dslo) (Atkinson et al., 1991; Adelman et al., 1992), mouse (mslo) (Butler et al., 1993; Pallanck and Ganetzky, 1994), and human (hslo) (Pallanck and Ganetzky, 1994; Tseng-Crank et al., 1994; McCobb et al., 1995; Wallner et al., 1995) have been cloned and expressed in Xenopus oocytes. The cloned channels have a high degree of amino acid conservation over most of their sequence. They are sensitive to both intracellular Ca2+ concentration and membrane voltage. They have large single channel conductances similar to native channels, and mslo and hslo have been shown to be blocked by toxins known to be specific for native BK channels (Butler et al., 1993; Tseng-Crank et al., 1994; Wallner et al., 1995). The cloning of these channels provides a first glimpse, albeit crude, at the structure of these channels and allows one to begin to make correlations between protein structure and channel behavior (Adelman et al., 1992; Lagrutta et al., 1994; Wei et al., 1994; McManus et al., 1995). Another advance provided by the cloning of these channels is the ability to express the cloned channels in heterologous expression systems with little background current. The high channel density achievable allows for the study of the behavior of a population of BK channels in excised patches while the internal Ca2+ concentration is tightly controlled. While in principle more can be learned from the behavior of a single molecule than from a population of molecules, in practice the ability to determine much more rapidly the mean behavior of a population of channels allows for the study of channel behavior over a much wider range of Ca2+ concentrations and membrane voltages than is feasible with single channel recording.
In this and the following paper (Cui et al., 1997, in this issue) we have examined the kinetic and steady-state properties of macroscopic currents from populations of cloned mslo channels over a wide range of conditions in order to interpret these properties in terms of the molecular mechanisms which underlie gating. Interpreting macroscopic current properties in terms of gating behavior however is not always straight forward as it may often be difficult to distinguish genuine gating behavior from changes in currents due to permeation or block of the channels by exogenous molecules. Block of BK channels by cations has been studied previously at the single channel level (Marty, 1981; Vergara and Latorre, 1983; Yellen, 1984; Eisenman et al., 1986; Miller, 1987; Miller et al., 1987; Oberhauser et al., 1988; see also Diaz et al., 1996; Neyton, 1996). With the increased ability to record the behavior of populations of expressed BK channels, a careful assessment of the potential effects of block and permeation properties on macroscopic currents is a necessary prerequisite for detailed studies of gating. Here we investigate three effects of changing voltage or internal Ca2+ concentration on macroscopic mslo currents which are not due to gating but rather are due to the action of these stimuli on channel permeation or block: a saturation of the single channel current at high voltage, a rapid Ca2+ block, and a slow Ba2+ block. We describe means by which complications arising from these effects not related to channel gating can be avoided, and thereby voltage-dependent gating properties can be measured accurately. We also provide some assessment of the impact which the effects that cannot be eliminated will have on the measurement of gating parameters. The interpretation of ionic current properties in terms of molecular mechanisms can be misleading if these effects are not considered. For instance, macroscopic current measurements appear to suggest that mslo channels do not reach the same maximum open probability at all Ca2+ concentrations. This would indicate that Ca2+ concentration can have a limiting effect on the gating of the mslo channel. When permeation and blocking effects are taken into account, however, we find that this is not the case. mslo channels reach the same, or very similar, maximum open probabilities over a Ca2+ concentration range spanning three orders of magnitude. Over this Ca2+ range the internal Ca2+ concentration does not limit the ability of voltage to activate the channel.
materials and methods
Channel Expression
All experiments were performed with the mbr5 clone of the mouse homologue of the slo gene (mslo), which was kindly provided to us by Dr. Larry Salkoff (Washington University School of Medicine, St. Louis, MO). The mbr5 cDNA was propagated in a modified Blue Script vector BS-MXT (Stratagene Inc., La Jolla, CA) in the E. coli strain DH5-α. cRNA was transcribed from this vector in vitro using the mMessage mMachine kit with T3 polymerase (Ambion Inc., Austin TX). To facilitate future mutagenesis, several silent restriction sites were introduced into the mbr5 cDNA before expression. To record macroscopic currents ∼0.05–0.5 ng of cRNA were injected into Xenopus laevis oocytes 2–6 d before recording. For unitary recordings 10- to 20-fold less cRNA was injected.
Electrophysiology
All recordings were done in the inside out patch clamp configuration (Hamill et al., 1981) except where noted. Patch pipettes were made of borosilicate glass (VWR Micropipettes, West Chester, PA). Their tips were coated with wax (Sticky Wax, Emeryville, CA) and fire polished before use. Data were acquired using an Axopatch 200-A patch clamp amplifier (Axon Instruments, Foster City, CA) in the resistive feedback mode and a Macintosh based computer system using Pulse acquisition software (HEKA Electronik, Lambrecht, Germany) and the ITC-16 hardware interface (Instrutech Scientific Instruments, Great Neck, NY). Unless otherwise indicated records were digitized at 20-μs intervals (50,000 samples per s) and low pass filtered at 10 kHz with the Axopatch's 4 pole bessel filter. Experiments were carried out at 23°C. Data were analyzed using Igor Pro graphing and curve fitting software (WaveMetrics Inc., Lake Oswego, OR) using the Levenberg-Marquardt algorithm to perform nonlinear least squares fits. Before current records were analyzed and displayed capacity and leak currents were subtracted using a P/5 leak subtraction protocol with a holding potential of −120 mV and voltage steps opposite in polarity to those in the experimental protocol. For experiments at high internal Ca2+ concentration ([Ca]i: 490 and 1,000 μM), where activity of mslo channels at negative potentials precluded the use of a leak pulse protocol, records taken under nominally zero [Ca]i conditions (1 mM EGTA, no added Ca2+) were usually subtracted from high [Ca]i traces to remove capacity and leak currents. In some cases leak current was estimated from linear extrapolation of the holding current at −180 mV, and then only a steady-state component of current corresponding to the leak was removed from the records. As estimated from the amplitude and decay time constant of capacity currents, the series resistance (Rs) under our experimental conditions was 5–6 megaohms. Typically 50–90% of Rs was compensated for using the Axopatch 200-A's Rs compensation circuitry. To increase the signal to noise ratio typically three to eight current series were taken consecutively under identical conditions and averaged before analysis and display.
Solutions
Recording solutions were composed of the following (in mM): Internal: 140 KMeSO3, 20 HEPES, 2 KCl, 1 HEDTA, and CaCl2 to give the appropriate free Ca2+ concentration (pH = 7.20); Pipette: 140 KMeSO3, 20 HEPES, 2 KCl, 2 MgCl2 (pH = 7.20). Methane sulfonate, rather than Cl−, was used as the major anion in these solutions to prevent contamination by Ca-activated Cl− currents endogenous to the oocytes. In some preliminary experiments 10 mM Mg2+ was included in the internal solution. Mg2+ blocked mslo currents at high voltage, and appeared to have a potentiating effect at lower voltages, an effect which was Ca2+ dependent (see also Golowasch et al., 1986; Oberhauser et al., 1988; Solaro et al., 1995). To avoid these complications, Mg2+ was excluded from the internal solution in subsequent experiments. Internal Na+ and choline were also found to have substantial blocking effects and, therefore, were not included in our solutions (see also Marty, 1983; Yellen, 1984).
In most experiments the concentration of free Ca2+ in the internal solution was varied. The method of Bers (1982) was used to set the concentration of free Ca2+ in internal solutions with HEDTA (Sigma Chemical Co., St. Louis MO) as the Ca2+ chelating agent. Briefly, a calcium-sensitive electrode (Orion Research Inc., Boston, MA) was used to measure the free Ca2+ concentration in solutions containing nominally 1 mM HEDTA and a known amount of added CaCl2 (100 mM CaCl2; Orion Research Inc.). From these measurements a Scatchard plot was created and used to estimate the affinity of HEDTA for Ca2+ under our experimental conditions (3.2 μM) as well as its purity (94%). Given these values, the appropriate amount of total Ca2+ (CaCl2) to add to the base internal solution containing nominally 1 mM HEDTA to yield the desired free Ca2+ concentration was calculated. After CaCl2 was added, free Ca2+ was measured with the Ca-sensitive electrode, and this value was recorded. Free Ca2+ measurements were precise to within ∼8%. For solutions containing >124 μM free Ca2+, no Ca2+ buffer was used. Standard Ca2+ solutions for calibration of the Ca-sensitive electrode were prepared by adding known amounts (1, 10, 100, 1,000, 10,000 μM) of standard CaCl2 solution to a solution identical to our base internal solution excepting that no HEDTA was added. Endogenous Ca2+ in this solution was estimated from the deviation from linearity of the Ca-sensitive electrode's response at 10 μM added Ca2+, and it was typically ∼10–20 μM. Endogenous Ca2+ was then compensated for when making Ca2+ buffered solutions. In some experiments solutions were buffered to 50 nM free Ca2+ or less with either 1 or 5 mM EGTA. The Ca2+ concentrations in these solutions were determined to be in the low nanomolar range using the Ca2+ indicator fura-2 (91 μM) and standard ratiometric methods (Tsien et al., 1985). The dye was excited at λ of 350 and 380 nm, and light was collected at λ > 480 nm as described by Dolmetsch and Lewis (1994).
While recording mslo currents, the concentration of Ca2+ in the solution bathing the cytoplasmic face of the patch was exchanged using a sewer pipe flow system (DAD 12) purchased from Adams and List Assoc. Ltd. (Westbury, NY). Briefly, the system consisted of 12 syringe type reservoirs each fitted with a solenoid valve and a thin tube leading to a common housing. A single polyacrylamide coated quartz tubing (ID 100 μm) formed the output from this housing such that when the valve to any one reservoir was actuated, solution would flow from the reservoir, through the housing, and out the output tube. Flow was aided by air pressure applied to each reservoir, typically 200 psi. During an experiment, after excision, the patch was situated in front of the output tube such that it was immersed in the laminar flow from the tube. The switching of reservoir valves was computer controlled. Solution exchanges typically occurred in <1 s. Slower exchanges were taken to be indicative of vesicle formation, and the experiment was discontinued.
results
In Fig. 1 A is shown a series of current traces recorded during an experiment in which the internal Ca2+ concentration ([Ca]i) was buffered to 10.2 μM while the membrane voltage was stepped from −100 mV to a series of test potentials (−80 to +150 mV) and then repolarized to −80 mV. Na+ and Mg2+ were excluded from our internal solution to avoid block by these ions. Some important features of these current traces are evident. First, at −100 mV, although the patch was exposed to 10.2 μM [Ca]i, there was very little probability of the channels being open. In fact, when the amplifier gain was increased and the holding current was examined more closely, it was possible to see only occasional brief individual channel openings at this voltage despite the presence of ∼70 channels in the patch (data not shown). Second, upon depolarization to potentials above 0 mV, large outward currents were observed which rapidly relaxed to their new steady-state level. This relaxation became more rapid as the test potential increased. And third, upon repolarization to −80 mV, the current traces quickly relaxed to a low level producing large inward tail currents.
Figure 1.

Macroscopic mslo K+ currents recorded from an inside-out membrane patch during superfusion with an internal solution buffered to a free Ca2+ concentration ([Ca]i) of 10.2 μM. (A) Current traces were elicited with 20-ms voltage steps to test potentials between −80 and +150 mV in 10-mV increments from a −100 mV holding potential. After depolarization the membrane potential was repolarized to −80 mV. The traces displayed represent the average of four series recorded in succession. The dashed horizontal line indicates zero current. (B) Peak I-V relation for the data in A. Current amplitudes were measured as the mean current in a 1-ms range straddling the point of maximum outward current.
mslo Single Channel Current Saturates at High Voltage
To interpret the properties of macroscopic currents in terms of gating behavior, we must separate voltage- dependent effects on ion permeation or channel block from the behavior which arises from the conformational changes of the channel protein. One interesting feature of these data is the plateau in the peak current vs. membrane voltage relation (I-V) observed at voltages above ∼+120 mV (Fig. 1 B). For a uniform population of ion channels the macroscopic current can be defined as:
 |
1 |
,
where I is the macroscopic current, N is the number of channels in the patch, Po is the probability of any single channel being open, and i is the single channel current. The question arises as to whether the plateau observed in the I-V relation at high voltage is due to any or all of the following: (a) an anomalous gating behavior decreasing Po at high voltage; (b) a voltage-dependent block of the mslo channels which might appear to affect either Po or i depending on the block and unblock rates; or (c) a saturation of the single channel current (i) which might otherwise be expected to increase with voltage as the driving force for K+ flux increases.
To distinguish between these possibilities, we first examined the instantaneous I-V relation. An example of such an experiment with 10.2 μM [Ca]i is shown in Fig. 2 A (right). After 20-ms depolarizations to +100 mV to activate the channels maximally, the membrane voltage was stepped to a series of test potentials from −80 to +150 mV and the amplitudes of the tail currents just after stepping to the test potential were recorded. These amplitudes are plotted as a function of test voltage in Fig. 2 B (open squares). It is clear that the plateau observed in the macroscopic I-V curve of Fig. 1 B is also present in the instantaneous I-V curve. If this plateau is due to a gating process, then it must be very rapid, settling in less than 200 μs. Alternatively, the plateau in both I-V curves could be due to a rectification of the single channel conductance at high voltage.
Figure 2.

(A) Macroscopic mslo tail currents recorded after 20-ms depolarizations to +180 mV(0.84 μM [Ca]i), +100 mV(10.2 μM [Ca]i), and +80 mV(124 μM [Ca]i). (B) Tail current amplitudes were measured at the indicated test potentials 200 μs (arrow) after the beginning of the repolarizing step, normalized to their values at +80 mV, and plotted as a function of test potential.
The latter interpretation was confirmed when single channel current amplitudes were directly measured over a range of voltages (Fig. 3). Like the instantaneous I-V curve of Fig. 2 B, the single channel i-V curve starts to bend toward the voltage axis at +110 to +120 mV, with i approaching 32 pA. It seems possible that under the present conditions (142 mM symmetrical K+) this may represent the limiting rate at which K+ ions can enter and pass through an open mslo channel (Latorre and Miller, 1983; Yellen, 1984; Hille, 1992; see discussion). It might be, however, that this apparent saturation of the single channel current is in fact due to a rapid voltage-dependent block which at the present bandwidth appears as a reduction in i. Under the present ionic conditions, the most likely candidate blocking particle for such a fast, voltage-dependent block is Ca2+, as it is the only positively charged species added to the internal solution other than K+ which might be driven into the channel pore at depolarized voltages. Also, Ca2+ has been previously reported to block BK channels in a voltage-dependent manner (Marty, 1981; Vergara and Latorre, 1983; Oberhauser et al., 1988).
Figure 3.

mslo single channel current voltage relations (i-V) determined at 0.84, 10.2, and 124 μM [Ca]i. Symbols represent the average of between two and four experiments. In each experiment i was determined at each potential as the average of the amplitudes of between one and six (typically four) transitions like those displayed in the lower panel. Amplitudes were determined by eye. The traces in the lower panel have been digitally filtered at 5 kHz.
To examine the possibility that the apparent saturation of single channel current at depolarized voltages could be accounted for by voltage-dependent Ca2+ block the instantaneous tail current I-V (Fig. 2) and the single channel i-V (Fig. 3) were measured at various [Ca]i. If Ca2+ is blocking the channels in a voltage- dependent manner, then at higher [Ca]i it would take less voltage to achieve the same level of block than it would at lower [Ca]i. However, both experiments indicate that the voltage at which rectification begins changes little over the [Ca]i range 0.84–124 μM (Figs. 2 B and 3). Therefore, Ca2+ block cannot account for the plateaus in the I-V curves of Figs. 2 and 3, and we are led to favor the explanation that under the present ionic conditions the rectification observed in both the macroscopic and the single channel current voltage relations is due predominately to a limit on the rate that K+ ions can enter and pass through the mslo channel (see discussion).
Ca2+ Does Block mslo Channels at Higher Concentrations
Although Ca2+ block can not account for the plateaus in the I-V curves of Figs. 2 A and 3, at higher concentrations Ca2+ block was evident. When we raised [Ca]i to 490 μM, we did see a rectification in the single channel i-V relation which became apparent at a lower voltage than that observed with [Ca]i of 124 μM or below (Fig. 4 A, right). At the present bandwidth (5 kHz) individual blocking and unblocking events were not evident but rather a uniform reduction in current amplitude was observed (Fig. 4 A, left). This apparent blocking effect of high [Ca]i was also manifest as a reduction in macroscopic current at depolarized voltages. As shown in Fig. 4 B, when the membrane potential was stepped to +100 mV the outward current decreased as [Ca]i was increased above 124 μM. The Ca2+ block was voltage dependent, as no similar reduction was observed in tail current amplitude measured at −80 mV (Fig. 4 B), and no difference in single channel current amplitude was observed at negative voltages as [Ca]i was increased (Fig. 4 A). The similar amplitudes of the four tail currents in Fig. 4 B (see plot in right panel) suggests that at each [Ca]i mslo channels are activated to very nearly the same extent by depolarization to +100 mV, but as [Ca]i is increased, an increasing portion of the outward current becomes blocked. The lack of a detectable rising phase in the tail current traces measured with 490 and 1,000 μM [Ca]i suggests that the Ca2+ block was relieved faster than could be resolved by the recording system.
Figure 4.

Fast block of mslo currents by Ca2+. (A) (left) Single channel gating transitions recorded at +120 mV and −80 mV at 4 different [Ca]i as indicated. The vertical scale bars represent 40 pA (left, +120 mV) and 30 pA (right, −80 mV). Dashed lines indicate the zero current level. (right) Single channel i-V curves determined as described for Fig. 3 (see legend). (B) (left) Macroscopic current traces recorded with 20 ms steps to +100 mV from holding potentials of −100 mV(10.2 μM [Ca]i), −120 mV(124 μM [Ca]i), and −180 mV(490 and 1,000 μM [Ca]i). Each trace represents the average of 4 consecutive traces recorded under identical conditions. (right) The peak amplitudes of the currents displayed in the left panel (○), as well as tail current amplitudes measured 200 μs after repolarization to −80 mV (○) are plotted as a function of [Ca]i. Also plotted as a function of [Ca]i is the single channel current amplitude at +100 mV (•). In these plots the data have been normalized to their values at 10.2 μM [Ca]i. The differences between currents measured at 10.2 μM and those measured at 1,000 μM [Ca]i (+100 mV) were: 22% peak, 20% single channel, 4% tail.
We would like to use the macroscopic conductance vs. voltage relation (G-V) as an indication of the steady-state level of channel activation under any given stimulus conditions. However, the two phenomena discussed above, the saturation of single channel current at voltages above ∼+120 mV and rapid voltage-dependent Ca2+ block, would tend to complicate the determination of the G-V relation if this determination were made from peak current measurements such as those plotted in Fig. 1 B. Due to the nonlinear single channel i-V relation at depolarized voltages, in order to determine accurately the G-V relation in this way one would have to measure the single channel current at each [Ca]i and voltage. To avoid these complications we have routinely determined G-V relations from the amplitude of tail currents measured after repolarization to a fixed membrane potential (usually −80 mV). This method obviates the need to assume any specific relationship between single channel current and membrane voltage. In addition it avoids potential complications due to Ca2+ block, as such block is quickly relieved upon repolarization.
The Maximum Level of mslo Activity Is Not Limited by Ca2+
In Fig. 5 A (left) is shown a set of G-V curves for several different [Ca]i. Clearly, the major effect of increasing [Ca]i is to shift the G-V curve leftward on the voltage axis such that less positive voltages are required to maximally activate mslo channels. The general nature of this shifting behavior is consistent with many previous reports from both single channel and macroscopic current experiments on native and cloned BK channels (Marty, 1981; Barrett et al., 1982; Methfessel and Boheim, 1982; Wong et al., 1982; Moczydlowski and Latorre, 1983; Adelman et al., 1992; Butler et al., 1993; Tseng-Crank et al., 1994; Wei et al., 1994; Art et al., 1995; DiChiara and Reinhart, 1995; Giangiacomo et al., 1995; McCobb et al., 1995; McManus et al., 1995; Wallner et al., 1995; Meera et al., 1996). In Fig. 5 A we have plotted these data normalized to the maximum tail current at each [Ca]i. This assumes that the maximum level of channel activation is the same at each [Ca]i. Before we can draw any mechanistic conclusions from the relative positions and shapes of theses curves it is necessary to determine if this assumption is valid.
Figure 5.

(A) (left) Macroscopic mslo conductance vs. voltage (G-V) relations determined with 0.84, 10.2, 124, and 1,000 μM [Ca]i. The data are from a single membrane patch. G-V curves were constructed from tail currents amplitudes measured 200 μs after repolarization to −80 mV. These curves were then fitted with the function G = G max(1/(1 + e−(V − V1/2)zF/RT), and each curve was normalized to the maximum of its fit (solid lines). Fit parameters are as follows: [Ca]i 0.84 μM V1/2 = 99 mV, z = 1.80; [Ca]i 10.2 μM V1/2 = 28.2 mV, z = 1.44; [Ca]i 124 μM, V1/2 = −16.7 mV, z = 1.27; [Ca]i 1,000 μM V1/2 = −41.8 mV, z = 1.18. (right) Peak I-V curves determined from the same data as in the left panel. Current values for 1,000 μM [Ca]i (open bow ties) were adjusted to compensate for the fast blocking effect of Ca2+ (filled bow ties) by multiplying each data point by the ratio of the single channel current measured at 10.2 μM [Ca]i to that measured at 1,000 μM [Ca]i (Fig. 4). (B) (left) mslo currents recorded with voltage steps to +200 mV with 0.84 and 124 μM [Ca]i. Holding potentials were −50 and −120 mV, respectively. Repolarizations were to −80 mV. (right) I-V curves determined from the current level at the end of 20 ms voltage steps to membrane potentials ranging between −120 and +200 mV. The data in both panels of B are from the same membrane patch. [Ca]i for each panel of the figure are as designated in the right panel of A.
As stated previously, our G-V relations were determined from the amplitudes of tail currents measured after repolarization from each activating voltage pulse. One way to determine whether the channels reach the same maximum activity at each [Ca]i would be to compare directly the amplitudes of the tail currents used to determine the maximum conductance at each [Ca]i. However, due to experimental difficulties this approach was not practical. First, due to the finite time it takes for the voltage clamp to settle we could not determine tail current amplitudes immediately after the repolarization; instead, we had to measure them at a fixed time point (usually 200 μs after repolarization, see legend to Fig. 5). Second, as can be seen in the tail currents in Fig. 4 B and 5 B (left) the mslo tail currents decayed more rapidly as [Ca]i was decreased. These difficulties would lead to errors because, even if the channel's maximum activity was the same at all [Ca]i, the measured tail current amplitude would be smaller at low [Ca]i where the tail currents are deactivating most rapidly. Also, we have found the extrapolation of exponential fits to the later portion of each tail current (200 μs and later) back in time to the beginning of the repolarizing step to be unreliable.
Another approach to this question is to look at the maximum current level attained at each [Ca]i during the depolarizing test pulse. The macroscopic I-V curves for each [Ca]i should meet at high voltage if the maximum open probabilities and the single channel current amplitudes at each [Ca]i are the same. However, voltage-dependent channel block may complicate the experiment. In the right panel of Fig. 5 A are plotted peak I-V curves derived from the same data as are plotted in the left panel. The curves for 10.2 and 124 μM [Ca]i meet at high voltage indicating that at these [Ca]i the same maximum level of channel activity is attained. At 1000 μM [Ca]i the current is substantially smaller at voltages more positive than +50 mV. However, when this curve is corrected at each voltage for the reduction in single channel current due to Ca2+ block (filled bow ties), it approaches the I-V curves recorded with 10.2 and 124 μM [Ca]i, indicating a similar level of maximum activity. The procedure for this correction was to multiply each point in the I-V curve determined with 1,000 μM [Ca]i by the ratio of the single channel current measured at the corresponding voltage with 10.2 μM [Ca]i to that measured with 1,000 μM [Ca]i (Fig. 4). Fig. 5 A also shows that the I-V curve determined with 0.84 μM [Ca]i does not reach the same maximum amplitude as is seen with 10.2 and 124 μM [Ca]i, but rather levels off at a lower current value. In this case, however, Ca2+ block can not account for the discrepancy since we would expect less block at this low [Ca]i than at 10.2 or 124 μM [Ca]i. This result therefore appears to show that mslo channels can not be fully activated by voltage at this low [Ca]i. However, the following experiments indicate that at the high voltages necessary to fully activate mslo channels with 0.84 μM [Ca]i some other process not related to channel gating decreases the current amplitude.
As shown in Fig. 5 B (right) when the I-V curve for currents recorded at 124 μM [Ca]i is determined over the same voltage range as that for 0.84 μM [Ca]i and current amplitudes are measured at the end of the voltage steps, the two curves do meet at +200 mV, indicating that at this voltage the channels may have a similar open probability. With 124 μM [Ca]i, however, a declining phase in the I-V curve is seen over the voltage range +120 to +200 mV. This decline can be seen in individual current traces as both a decline in peak current and a slow current decay, indicating a slow inactivation or blocking process (Fig 5 B, left). A similar decline is also observed in tail current amplitudes measured at −80 mV after test voltages more positive than +100 mV (see Fig. 6). Therefore, in contrast to the Ca2+ block described in Fig. 4, this slow process is not rapidly reversed upon hyperpolarization.
Figure 6.

Effect of (+)-18-crown-6-tetracarboxylic acid (18C6TA) on macroscopic mslo currents. The membrane patch was depolarized from −100 mV to more depolarized voltages as indicated before (black trace), during (gray or dashed trace) and after (black trace) treatment with 50 μM 18C6TA. Depolarizing steps were 100 ms in duration. [Ca]i was 10.2 μM. Repolarizing steps were to −80 mV. On the right tail currents from each experiment on the left have been expanded to show the effect of 18C6TA on tail current amplitudes.
Diaz et al. (1996) have recently described a similar phenomenon in their studies of macroscopic hslo currents. Usinga Ba2+ chelating agent, (+)-18-crown-6-tetracarboxylic acid (18C6TA), they demonstrated that the slow current decline at high voltage they observed was due to block by Ba2+ which entered into the experimental solutions as a contaminant of the intended constituents. At the single channel level Neyton (1996) has also demonstrated the presence of a slow blocking process arising from contaminant Ba2+. Because our internal solutions are similar to those used by Diaz et al. (1996) and Neyton (1996), we thought it likely that the current decline described above is due to Ba2+ block as well. To test this hypothesis macroscopic mslo currents were recorded with 10.2 μM [Ca]i both in the presence and absence of 50 μM 18C6TA (Fig. 6). In the absence of the Ba2+ chelator, 100-ms voltage steps to +200 mV elicited currents that declined slowly to between 93 and 88% of their peak by 20 ms (the duration of the voltage steps in Fig. 5 B) and to between 58 and 72% of their peak by the end of the step (n = 2). In the presence of the Ba2+ chelator this decline was nearly eliminated, indicating that it was indeed due to Ba2+ block rather than some other process such as K+ accumulation on the external face of the patch. With steps to lower voltages less current decay was observed (Fig. 6) demonstrating that the block was voltage dependent. The currents in Fig. 6 recorded at +150 and +200 mV without chelator have very similar initial amplitudes. This also argues that the current decay observed at +200 mV is voltage dependent but not current dependent. When macroscopic I-V relations were measured in the presence of the Ba2+ chelator with 10.2 and 0.84 μM [Ca]i, the declining phase in the relation recorded with 10.2 μM was less prominent, and both curves appeared to be approaching the same value (Fig. 7). These results therefore indicate that contaminant Ba2+ block can account for the smaller maximum current amplitude recorded with 0.84 μM [Ca]i as compared to higher [Ca]i (Fig. 5 A). They also suggest that Ba2+ block occurs over the entire [Ca]i range. A time-dependent current decay is more evident at higher [Ca]i (Fig 5 B, left), however, because at high [Ca]i the activation time course is much more rapid than the development of block, while at low [Ca]i the activation time course is slower and comparable to that of block.
Figure 7.

Macroscopic mslo I-V relations recorded in the presence of (+)-18-crown-6-tetracarboxylic acid (18C6TA). Currents were determined at the end of 20-ms depolarizations to the indicated test potentials. [Ca]i are as indicated. Data are from the same membrane patch.
The above experiments show that macroscopic current amplitudes measured at various [Ca]i appeared to reach different maximum values (Fig. 5 A) but that these differences can be accounted for by Ca2+ and contaminate Ba2+ block. These results argue that the mslo channel can attain the same maximum open probability at all [Ca]i tested. Supporting this conclusion, very similar maximum open probabilities can also be seen at the single channel level. Fig. 8 shows current traces recorded from a single channel patch with 0.84, 10.2, and 124 μM [Ca]i at +150, +110, and +90 mV, respectively. Since Ba2+ block has been characterized at the single channel level as producing low frequency long shut events (Vergara and Latorre, 1983; Neyton, 1996), traces without long shut events were selected. At each [Ca]i the channel's open probability was very high, ranging between 0.95 and 0.98. mslo channels can therefore be very nearly fully opened by depolarization over a wide range of [Ca]i. Stronger depolarizations are required, however, as [Ca]i is decreased.
Figure 8.

Single mslo channels reach high open probabilities with depolarization over a wide range of [Ca]i. Current traces recorded from a single channel patch with 0.84, 10.2, and 124 μM [Ca]i. Voltages were +150, +110, and +90 mV as indicated. Traces without apparent long shut events were selected. Open probability is indicated to the right of each trace. The channel closes downward. Dashed lines indicate the zero-current level. The data were filtered at 8 kHz.
The Effects of Ba2+ Block on Measured Gating Parameters
Having shown the block of mslo channels by contaminating Ba2+, the question naturally arises as to what extent this block affects the gating parameters which might be determined from data like that of Fig. 1 A? To address this question current families were recorded with 20-ms steps to various potentials in the presence and absence of the Ba2+ chelator. Results of a typical experiment are shown in Fig. 9 (filled symbols represent data recorded in the presence of Ba2+ chelator). At 4.5 and 1.7 μM [Ca]i the Ba2+ chelator had only small effects on the mslo G-V relation, causing little change in the parameters of Boltzmann fits (with 4.5 μM [Ca]i the mean change in V1/2 as compared to the average of control curves recorded before and after chelator treatment was 2.0 ± 2.6 [SD] mV; the mean change in z was −0.01 ± 0.20 [SD], n = 4. With 1.7 μM [Ca]i the mean change in V1/2 was −4.1 ± 8.6 [SD] mV; the mean change in z was −0.15 ± 0.14 [SD], n = 4). In general, one would predict the largest effect of the Ba2+ chelator at 0.84 μM [Ca]i, because at this [Ca]i the mslo G-V relation spans the most positive potentials, where voltage-dependent Ba2+ block is strongest. However, even at 0.84 μM [Ca]i the effects of the Ba2+ chelator were small, and similar to those observed at 1.7 and 4.5 μM [Ca]i. In four experiments the mean change in the half maximal activation voltage (V1/2) as compared to the average of control curves recorded before and after chelator treatment was 3.5 ± 10(SD) mV; while the mean change in the effective valence (z) was −0.20 ± 0.17 (SD). This decrease in effective valence represents an ∼14% change (comparable to the <10% change with 1.7 and 4.5 μM [Ca]i). Because Ba2+ block becomes more prominent as the test voltage is increased, G-V curves determined in the absence of the Ba2+ chelator would be expected to be more steep and shifted to somewhat more hyperpolarized potentials as compared to those measured in the presence of the Ba2+ chelator. The decline in effective valence and the shift in V1/2 observed in the presence of the chelator are therefore in the expected directions. Their magnitudes however are similar to the standard deviation of these measurements and to the variability we see in these parameters from patch to patch with or without the chelator. Such effects therefore will be unlikely to alter significantly the conclusions presented in the rest of this study.
Figure 9.

The effects of (+)-18-crown-6-tetracarboxylic acid (18C6TA) on mslo G-V and Tau-V relations. Normalized conductance vs. voltage relations as well as time constant of activation vs. voltage relations were determined at (A) 0.84, (B) 1.7, and (C) 4.6 μM [Ca]i before (○), during (•), and after (▵) treatment with 50 μM 18C6TA. (left) Normalized conductance vs. voltage relations were determined from the amplitude of tail currents measured 200 μs after repolarization to −80 mV from the indicated test potentials. Each curve was fitted with a Boltzmann function of the form G = G max(1/(1 + e−(V − V1/2)zF/RT), and then normalized to the maximum of the fit. (right) The time course of activation at each test potential was fitted with a single exponential function and the time constants from these fits are plotted as a function of test potential. Parameters for the Boltzmann fits were as follows: A {(○) solid curve V1/2 = +130 mV, z = 1.27; (•) dashed curve V1/2 = +142 mV, z = 1.11; (▵) solid curve V1/2 = +141 mV, z = 1.24}; B {(○) solid curve V1/2 = +122 mV, z = 1.34; (•) dashed curve V1/2 = +120 mV, z = 1.19; (▵) solid curve V1/2 = +122 mV, z = 1.25}; C {(○) solid curve V1/2 = +96.8 mV, z = 1.23; (•) dashed curve V1/2 = +87.4 mV, z = 1.24; (▵) solid curve V1/2 = +88.3 mV, z = 1.29}.
Similarly, as shown in the right panels of Fig. 9, the presence of the Ba2+ chelator had little effect on the time constant of channel activation as determined by exponential fitting. This was the case despite the fact that at the highest voltages somewhat larger currents (10–20%) were observed in the presence of the Ba2+ chelator.
discussion
The recent cloning of several large conductance Ca- activated K+ channels has made it feasible to study their behavior as a population rather than exclusively at the single channel level. It is likely that macroscopic current recording will be used increasingly often to characterize the effects of mutations or chemical modifications on the gating behavior of cloned BK channels.
In the present paper we have investigated three properties of mslo macroscopic currents which do not relate directly to channel gating. These properties are due instead to channel characteristics related to permeation and block, some of which have been described previously at the single channel level (Marty, 1981; Vergara and Latorre, 1983; Yellen, 1984; Eisenman et al., 1986; Miller, 1987; Miller et al., 1987; Oberhauser et al., 1988; see also Diaz et al., 1996; Neyton, 1996). To interpret mslo macroscopic currents in terms of channel gating it is necessary to first understand the effects these characteristics have on the macroscopic currents, and then to separate them from those due to changes in channel gating.
Saturation of Single Channel Current
When recording with symmetrical 142 mM K+, a plateau in the macroscopic peak current-voltage relation is observed at membrane potentials above ∼+120 mV. Similar plateaus are observed in the instantaneous current-voltage relation determined from tail current measurements and the single channel i-V relation. The fact that the same phenomenon is observed in all three measurements indicates that the nonlinearity in the I-V relation is not due to a gating process, at least not one that occurs on a time scale which our measurements can resolve. A possible explanation for the plateau in the I-V relation is voltage-dependent block by an internal cation. Ca2+ would be the most likely candidate because it is the only added cation other than K+ in the internal solution. Furthermore, Ca2+ has been reported previously to block skeletal muscle BK channels in a rapid and voltage-dependent manner (Oberhauser et al., 1988). When [Ca]i was varied between 0.84 and 124 μM, however, we saw little change in the voltage at which deviation from linear behavior began. This result contradicts the prediction of the rapid voltage-dependent Ca2+ block hypothesis that the voltage necessary to achieve the same level of block would decrease as [Ca]i is raised. An additional piece of evidence that argues against a blocking hypothesis is that, as can be seen in the i-V curve of Fig. 3, the single channel i-V relation recorded with 124 μM [Ca]i is sublinear at negative as well as positive potentials. While it is conceivable that the decrease in conductance at negative potentials is due to block by some external cation such as Mg2+, voltage-dependent cation block from the outside cannot simultaneously account for curvature at both extremes. To account for this behavior in terms of channel block one would have to suppose the unlikely scenario of internal anionic block at negative potentials and internal cationic block at positive potentials, or of two cationic or anionic blocking sites, one external and one internal.
A more reasonable alternative is that the plateau observed in each current voltage-relation represents the maximum rate K+ ions can encounter and move through an open channel. The process of ion permeation through an open channel may be divided into five steps (Andersen and Procopio, 1980): diffusion of the permeating ion to the channel entrance; association of the ion with the channel; diffusion through the channel; disassociation from the channel; and diffusion of the permeating ion away from the channel to bulk solution. In principle, with flux rates as high as we are dealing with here—32 pAmps (∼2 × 10⁸ ions/s)—any one of these steps might be slow enough to be rate limiting, and in this paper we do not provide evidence to discriminate between these possibilities. As pointed out by Latorre and Miller (1983), however, a step which might well be rate limiting under these conditions is the first: diffusion of K+ to the channel entrance. Indeed, Yellen (1984) has observed a sublinear curvature in the current-voltage relation of a BK channel in chromaffin cells. To account simultaneously for this behavior as well as the strong voltage dependence of Na+ block, he proposed that the rate of K+ diffusion to the channel entrance limited the single channel current at high voltages. Similar sublinear behavior attributed to diffusion limitation has also been observed with skeletal muscle BK channels (Eisenman et al., 1986).
The diffusion limited saturating current value for flux through a cylindrical pore of capture radius r can be approximated as:
 |
2 |
(Hille, 1992) where D k is the K+ diffusion coefficient (1.96 × 10⁻⁵ cm2 s−1, 25°C [Hille, 1992]), [K] is the K+ concentration on both sides of the membrane (142 mM), z is the K+ valence (z = 1), and F is Faraday's constant. The unknown parameter in this equation is r which can be approximated as the difference between the pore radius at the point where K+ ions are no longer freely diffusing and the radius of the permeating ion (Andersen and Procopio, 1980; Latorre and Miller, 1983). Substituting 32 pAmps into Eq. 2 and solving for r yields a capture radius of 1.9 Å or a pore radius of ∼3.2 Å (the Pauling radius of K+ is 1.33 Å). Although the geometry of the BK channel pore is not known, 3.2 Å is within the range of values expected for the pore radius at the point where K+ ions are no longer freely diffusing. It is larger than the selectivity filter of a K+ channel (∼1.5 Å)(Hille, 1973), similar to twice the radius of a K+ ion, and more narrow than the wide outer mouth of the channel (∼20 Å in radius) (Goldstein et al., 1994; Stocker and Miller, 1994; Hidalgo and MacKinnon, 1995; Lu and Miller, 1995). In reality, the channel pore is not likely to be cylindrical, and the diffusion limit could be influenced by factors other than the channel's geometry, for example the electric field profile near the channel entrance, or lateral diffusion of K+ ions in contact with the membrane. The radius estimated in this way therefore is not likely to correspond exactly to a physical dimension. This calculation, however, does illustrate that, assuming reasonable channel dimensions, the maximum flux rate we have observed could be limited by diffusion of K+ ions from bulk solution to the pore. The above discussion, however, is not meant to argue that we have indeed observed diffusion-limited ion flux, but rather only that this is a reasonable possibility. To demonstrate convincingly that this is the case, as was done by Andersen (Andersen and Procopio, 1980; Andersen, 1983a , b , and c) for the gramicidin A channel and Kuo and Hess (1992) for the L-type Ca2+ channel, experiments involving changes in K+ concentration, temperature, and solution viscosity would be necessary.
Regardless of its mechanism the saturation of the mslo single channel conductance at high voltages should not affect macroscopic current kinetics because this saturation becomes manifest immediately upon channel conduction after a voltage step. As discussed earlier, however, if this nonlinearity is not considered when constructing G-V relations from peak current measurements, serious underestimates of the total conductance at high voltages could result. Such underestimates would tend to steepen the G-V relation as well as shift its midpoint leftward along the voltage axis. These errors can be avoided by determining the G-V relation from tail current amplitudes at a fixed time point after repolarization from the test voltage.
Rapid Ca2+ Block
Although little effect was observed on the mslo single channel i-V curve when Ca2+ was varied between 0.84 and 124 μM, at higher [Ca]i a decline in single channel current at high voltages was seen as [Ca]i was increased. A similar Ca-dependent current reduction was also observed in macroscopic current recordings at high voltages. Three lines of evidence support the hypothesis that these two effects are due to a rapid voltage-dependent Ca2+ block as described by Marty (1981) and Oberhauser et al. (1988) at the single channel level. First, the extent of current reduction in both macroscopic and single channel records showed similar voltage dependence. This is made evident in Fig. 5 A (right) by the fact that the smaller current values in the macroscopic I-V curve determined with 1,000 μM [Ca]i can be fully compensated by correcting for the amount of block observed in single channel records under the same conditions. Second, the extent of current reduction in both macroscopic and single channel records showed similar Ca2+ dependence (Fig. 5 B). And third, discrete blocking events were not apparent in single channel records but rather a uniform reduction in current amplitude was observed indicating that the blocking equilibrium was faster than our recording system could resolve. Also indicating a rapid blocking equilibrium, upon hyperpolarization the reversal of macroscopic current reduction was more rapid than could be observed in the time course of tail current relaxation.
Rapid Ca2+ block has been reported previously for native BK channels (Marty, 1981; Oberhauser et al., 1988). In their studies of the activating effects of many cations on a skeletal muscle BK channel Oberhauser et al. found that most divalent and trivalent ions tested had rapid blocking effects on this channel. Quantitatively, we see less Ca2+ block (∼20%) than predicted by the parameters they used to describe the Ca2+ block they observed (∼70%). This difference could be due to different experimental conditions, as their study was done in artificial bilayers with higher [Ca]i, or it could be due to differences between native and cloned channels.
Voltage-dependent Ca2+ block will depress the amplitude of macroscopic currents more strongly as the membrane voltage is made more positive. It will thereby distort the shape of the G-V relation if it is determined from peak current measurements and Ca2+ block is not taken into account. However, because Ca2+ block is rapidly reversed upon hyperpolarization, this problem can also be easily obviated by determining macroscopic G-V relations from the amplitudes of tail currents recorded in response to repolarization to a fixed negative potential.
Ca2+ block could also affect the time course of mslo current activation. To assess the magnitude of this effect we considered the following simplified kinetic scheme containing closed (C), open (O), and blocked (OB) states:
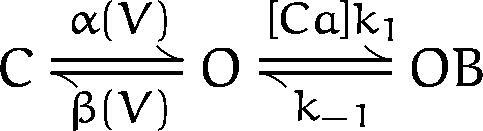
The step between closed and open is assumed to be voltage dependent and to equilibrate much more slowly than the rapid blocking equilibrium. The activation time constant of this system can be approximated by
 |
3 |
where K D is the equilibrium disassociation constant for Ca2+ block (k −1/k 1). Eq. 3 indicates that rapid Ca2+ block will affect the activation time constant by effectively reducing β. Therefore, in general, the activation time constant will be increased by rapid Ca2+ block. For the mslo channel, however, we have seen significant block only at high [Ca]i and high voltage, conditions under which the channel's open probability is quite high and therefore α is much greater than β. The contribution of β to the activation time constant is therefore very small. Further reduction of β due to Ca2+ block, therefore, should have essentially no effect. This would not necessarily be the case, however, for a mutant channel whose activation range at high [Ca]i is shifted to far more depolarized potentials. For more complex schemes it is more difficult to predict how Ca2+ block will affect mslo kinetics. However, the exponential time course of mslo activation even in the presence of block suggests that this simple scheme may reasonably approximate the blocking process.
Ba2+ Block Does Not Significantly Affect Our Measurement of mslo Gating Parameters
Consistent with previous work (Diaz et al., 1996; Neyton, 1996) we found that contaminant Ba2+ in our internal solutions blocks the mslo channel at high voltages. Ba2+ block is a slow equilibrium (Vergara and Latorre, 1983) not quickly relieved upon hyperpolarization (Fig 6). It will therefore affect G-V relations determined from tail current amplitudes. Since Ba2+ block becomes stronger as the membrane voltage is made more positive, it is expected that contaminant Ba2+ will make the mslo G-V relation more steep and left shifted. We have experimentally assessed the magnitude of these effects under our conditions by comparing G-V relations determined in the presence and the absence of the Ba2+ chelator 18C6TA. As expected we found a decrease in the effective valence necessary to fit the 0.84 μM [Ca]i G-V relation when 18C6TA was added to the internal solution, and a right shift in V1/2. These effects were small however and similar to the standard deviation of the measurements (0.2 ± 0.17 [SD] e decline in effective valence, and a 3.5 ± 10 [SD] mV shift in V1/2). At higher [Ca]i the chelator had even less effect, likely due to the fact that as [Ca]i is increased the mslo G-V relation spans less positive potentials. Also, the addition of 18C6TA to the internal solution had no clear effects on the relationship between activation time constant and membrane voltage. From these experiments we conclude that while Ba2+ block may certainly be a complicating factor in many experimental circumstances, its impact on the results of the experiments described in the following paper should be inconsequential.
mslo Channels Can Be Maximally Activated over a Broad Range of [Ca]i
An important question related to BK channel gating is whether or not these channels can be activated to the same extent over a broad [Ca]i range? As shown in Fig. 5, if blocking effects are not considered, macroscopic current measurements could lead to the conclusion that for the mslo channel the maximum open probability is smaller at low [Ca]i (0.84 μM) or high [Ca]i (1,000 μM) than it is at moderate [Ca]i (10.2 μM). This is because at the very high voltages necessary to fully activate the mslo channel at low [Ca]i, contaminant Ba2+ block reduces current amplitude; while, at high [Ca]i and moderate voltages, Ca2+ block reduces current amplitude. When the blocking effects of Ca2+ and Ba2+ are compensated for, however, it is clear that the channel can be activated by voltage to the same maximum open probability at each [Ca]i. This is also evident in single channel records where, excluding long shut times which correspond to Ba2+ blocking events (Neyton, 1996), open probabilities of 0.95 or greater were observed over a wide range of [Ca]i.
These observations have certain mechanistic implications. That the mslo channel can be maximally activated by voltage steps at both low and high [Ca]i indicates that the elementary step before channel opening must not be both Ca2+ dependent and voltage independent. If this were the case, [Ca]i would limit channel opening. Also, the observation that very high open probabilities can be attained over a wide [Ca]i range indicates that the elementary step before channel opening must be either voltage dependent, or independent of both voltage and Ca2+ but heavily biased towards opening.
In conclusion, we have explored several properties of mslo channel permeation and block which may complicate the interpretation of macroscopic currents in terms of channel gating. If these properties are not considered, erroneous conclusions about the gating of the mslo channel can result. Taking these properties into account, however, we have found conditions under which macroscopic currents may be interpreted in terms of channel gating with reasonable certainty.
Acknowledgments
We gratefully acknowledge Larry Salkoff for providing the mslo clone, Marcus Hoth and Richard Lewis for performing Ca2+ concentration measurements by fluorescence microscopy, Gargi Talukder for performing some single channel i-V experiments, and Dr. Victor Corvalan for algorithms for Ca2+ concentration calculations.
This work was supported by a National Institute of Mental Health Silvio Conte Center for Neuroscience Research grant (MH 48108). J. Cui was supported by a postdoctoral fellowship from the Muscular Dystrophy Association. R.W. Aldrich is an investigator with the Howard Hughes Medical Institute.
Abbreviation used in this paper
- BK channels
large conductance Ca-activated K+ channels
references
- Adelman JP, Shen KZ, Kavanaugh MP, Warren RA, Wu YN, Lagrutta A, Bond CT, North RA. Calcium-activated potassium channels expressed from cloned complementary DNAs. Neuron. 1992;9:209–216. doi: 10.1016/0896-6273(92)90160-f. [DOI] [PubMed] [Google Scholar]
- Andersen OS. Ion movement through gramicidin A channels. Interfacial polarization effects on single-channel current measurements. Biophys J. 1983a;41:135–146. doi: 10.1016/S0006-3495(83)84415-4. [DOI] [PMC free article] [PubMed] [Google Scholar]
- Andersen OS. Ion movement through gramicidin A channels. Single-channel measurements at very high potentials. Biophys J. 1983b;41:119–133. doi: 10.1016/S0006-3495(83)84414-2. [DOI] [PMC free article] [PubMed] [Google Scholar]
- Andersen OS. Ion movement through gramicidin A channels. Studies on the diffusion-controlled association step. Biophys J. 1983c;41:147–165. doi: 10.1016/S0006-3495(83)84416-6. [DOI] [PMC free article] [PubMed] [Google Scholar]
- Andersen OS, Procopio J. Ion movement through gramicidin A channels. On the importance of the aqueous diffusion resistance and ion-water interactions. Acta Physiol Scand (Suppl) 1980;481:27–35. [PubMed] [Google Scholar]
- Art JJ, Wu YC, Fettiplace R. The calcium-activated potassium channels of turtle hair cells. J Gen Physiol. 1995;105:49–72. doi: 10.1085/jgp.105.1.49. [DOI] [PMC free article] [PubMed] [Google Scholar]
- Atkinson NS, Robertson GA, Ganetzky B. A component of calcium-activated potassium channels encoded by the Drosophila slo locus. Science (Wash DC) 1991;253:551–555. doi: 10.1126/science.1857984. [DOI] [PubMed] [Google Scholar]
- Barrett JN, Magleby KL, Pallotta BS. Properties of single calcium-activated potassium channels in cultured rat muscle. J Physiol (Lond) 1982;331:211–230. doi: 10.1113/jphysiol.1982.sp014370. [DOI] [PMC free article] [PubMed] [Google Scholar]
- Bers DM. A simple method for the accurate determination of free [Ca] in Ca-EGTA solutions. Am J Physiol. 1982;242:C404–C408. doi: 10.1152/ajpcell.1982.242.5.C404. [DOI] [PubMed] [Google Scholar]
- Blatz AL, Magleby KL. Ion conductance and selectivity of single calcium-activated potassium channels in cultured rat muscle. J Gen Physiol. 1984;84:1–23. doi: 10.1085/jgp.84.1.1. [DOI] [PMC free article] [PubMed] [Google Scholar]
- Butler A, Tsunoda S, McCobb DP, Wei A, Salkoff L. mSlo, a complex mouse gene encoding “maxi” calcium-activated potassium channels. Science (Wash DC) 1993;261:221–224. doi: 10.1126/science.7687074. [DOI] [PubMed] [Google Scholar]
- Cui J, Cox DH, Aldrich RW. Intrinsic voltage dependence and Ca2+ regulation of mslo large conductance Ca-activated K+channels. J Gen Physiol. 1997;109:647–673. doi: 10.1085/jgp.109.5.647. [DOI] [PMC free article] [PubMed] [Google Scholar]
- Diaz F, Wallner M, Stefani E, Toro L, Latorre R. Interaction of internal Ba2+ with a cloned Ca2+-dependent K+(hslo) channel from smooth muscle. J Gen Physiol. 1996;107:399–407. doi: 10.1085/jgp.107.3.399. [DOI] [PMC free article] [PubMed] [Google Scholar]
- DiChiara TJ, Reinhart PH. Distinct effects of Ca2+ and voltage on the activation and deactivation of cloned Ca2+-activated K+channels. J Physiol (Lond) 1995;489:403–418. doi: 10.1113/jphysiol.1995.sp021061. [DOI] [PMC free article] [PubMed] [Google Scholar]
- Dolmetsch RE, Lewis RS. Signaling between intracellular Ca2+ stores and depletion-activated Ca2+ channels generates [Ca2+]ioscillations in T lymphocytes. J Gen Physiol. 1994;103:365–388. doi: 10.1085/jgp.103.3.365. [DOI] [PMC free article] [PubMed] [Google Scholar]
- Eisenman G, Latorre R, Miller C. Multi-ion conduction and selectivity in the high-conductance Ca++-activated K+channel from skeletal muscle. Biophys J. 1986;50:1025–1034. doi: 10.1016/S0006-3495(86)83546-9. [DOI] [PMC free article] [PubMed] [Google Scholar]
- Giangiacomo KM, Garciacalvo M, Knaus HG, Mullmann TJ, Garcia ML, Mcmanus O. Functional reconstitution of the large-conductance, calcium-activated potassium channel purified from bovine aortic smooth muscle. Biochemistry. 1995;34:15849–15862. doi: 10.1021/bi00048a031. [DOI] [PubMed] [Google Scholar]
- Goldstein SA, Pheasant DJ, Miller C. The charybdotoxin receptor of a Shaker K+channel: peptide and channel residues mediating molecular recognition. Neuron. 1994;12:1377–1388. doi: 10.1016/0896-6273(94)90452-9. [DOI] [PubMed] [Google Scholar]
- Golowasch J, Kirkwood A, Miller C. Allosteric effects of Mg2+ on the gating of Ca2+-activated K+channels from mammalian skeletal muscle. J Exp Biol. 1986;124:5–13. doi: 10.1242/jeb.124.1.5. [DOI] [PubMed] [Google Scholar]
- Hamill OP, Marty A, Neher E, Sakmann B, Sigworth FJ. Improved patch-clamp techniques for high-resolution current recording from cells and cell-free membrane patches. Pflüg Arch. 1981;391:85–100. doi: 10.1007/BF00656997. [DOI] [PubMed] [Google Scholar]
- Hidalgo P, MacKinnon R. Revealing the architecture of a K+channel pore through mutant cycles with a peptide inhibitor. Science (Wash DC) 1995;268:307–310. doi: 10.1126/science.7716527. [DOI] [PubMed] [Google Scholar]
- Hille B. Potassium channels in myelinated nerve. Selective permeability to small cations. J Gen Physiol. 1973;61:669–686. doi: 10.1085/jgp.61.6.669. [DOI] [PMC free article] [PubMed] [Google Scholar]
- Hille, B. 1992. Ionic Channels of Excitable Membranes, 2nd ed. Sinauer Associates, Inc. Sunderland, MA. pp. 607.
- Jones TR, Charette L, Garcia ML, Kaczorowski GJ. Selective inhibition of relaxation of guinea-pig trachea by charybdotoxin, a potent Ca(++)-activated K+channel inhibitor. J Pharmacol Exp Ther. 1990;255:697–706. [PubMed] [Google Scholar]
- Kotlikoff M. Potassium channels in airway smooth muscle: a tale of two channels. Pharmacology and Therapeutics. 1993;58:1–12. doi: 10.1016/0163-7258(93)90064-k. [DOI] [PubMed] [Google Scholar]
- Kume H, Takai A, Tokuno H, Tomita T. Regulation of Ca2+-dependent K+-channel activity in tracheal myocytes by phosphorylation. Nature (Lond) 1989;341:152–154. doi: 10.1038/341152a0. [DOI] [PubMed] [Google Scholar]
- Kuo CC, Hess P. A functional view of the entrances of L-type Ca2+channels: estimates of the size and surface potential at the pore mouths. Neuron. 1992;9:515–526. doi: 10.1016/0896-6273(92)90189-k. [DOI] [PubMed] [Google Scholar]
- Lagrutta A, Shen KZ, North RA, Adelman JP. Functional differences among alternatively spliced variants of Slowpoke, a Drosophila calcium-activated potassium channel. J Biol Chem. 1994;269:20347–20351. [PubMed] [Google Scholar]
- Latorre R, Miller C. Conduction and selectivity in potassium channels. J Membr Biol. 1983;71:11–30. doi: 10.1007/BF01870671. [DOI] [PubMed] [Google Scholar]
- Latorre R, Oberhauser A, Labarca P, Alvarez O. Varieties of calcium-activated potassium channels. Annu Rev Physiol. 1989;51:385–399. doi: 10.1146/annurev.ph.51.030189.002125. [DOI] [PubMed] [Google Scholar]
- Latorre R, Vergara C, Hidalgo C. Reconstitution in planar lipid bilayers of a Ca2+-dependent K+channel from transverse tubule membranes isolated from rabbit skeletal muscle. Proc Natl Acad Sci USA. 1982;79:805–809. doi: 10.1073/pnas.79.3.805. [DOI] [PMC free article] [PubMed] [Google Scholar]
- Lu Q, Miller C. Silver as a probe of pore-forming residues in a potassium channel. Science (Wash DC) 1995;268:304–307. doi: 10.1126/science.7716526. [DOI] [PubMed] [Google Scholar]
- Marty A. Ca-dependent K channels with large unitary conductance in chromaffin cell membranes. Nature (Lond) 1981;291:497–500. doi: 10.1038/291497a0. [DOI] [PubMed] [Google Scholar]
- Marty A. Blocking of large unitary calcium-dependent potassium currents by internal sodium ions. Pflüg Arch. 1983;396:179–181. doi: 10.1007/BF00615524. [DOI] [PubMed] [Google Scholar]
- Marty A. The physiological role of calcium-dependent channels. Trends Neurosci. 1989;12:420–424. doi: 10.1016/0166-2236(89)90090-8. [DOI] [PubMed] [Google Scholar]
- McCobb DP, Fowler NL, Featherstone T, Lingle CJ, Saito M, Krause JE, Salkoff L. A human calcium-activated potassium channel gene expressed in vascular smooth muscle. Am J Physiol. 1995;269:H767–H777. doi: 10.1152/ajpheart.1995.269.3.H767. [DOI] [PubMed] [Google Scholar]
- McManus OB. Calcium-activated potassium channels: regulation by calcium. J Bioenerg Biomembr. 1991;23:537–560. doi: 10.1007/BF00785810. [DOI] [PubMed] [Google Scholar]
- McManus OB, Helms LM, Pallanck L, Ganetzky B, Swanson R, Leonard RJ. Functional role of the beta subunit of high conductance calcium-activated potassium channels. Neuron. 1995;14:645–650. doi: 10.1016/0896-6273(95)90321-6. [DOI] [PubMed] [Google Scholar]
- Meera P, Wallner M, Jiang Z, Toro L. A calcium switch for the functional coupling between alpha (hslo) and beta subunits (KV,Ca beta) of maxi K channels. FEBS Lett. 1996;382:84–88. doi: 10.1016/0014-5793(96)00151-2. [DOI] [PubMed] [Google Scholar]
- Methfessel C, Boheim G. The gating of single calcium-dependent potassium channels is described by an activation/ blockade mechanism. Biophys Struct Mech. 1982;9:35–60. doi: 10.1007/BF00536014. [DOI] [PubMed] [Google Scholar]
- Miller C. Trapping single ions inside single ion channels. Biophys J. 1987;52:123–126. doi: 10.1016/S0006-3495(87)83196-X. [DOI] [PMC free article] [PubMed] [Google Scholar]
- Miller C, Latorre R, Reisin I. Coupling of voltage- dependent gating and Ba++ block in the high-conductance, Ca++-activated K+channel. J Gen Physiol. 1987;90:427–449. doi: 10.1085/jgp.90.3.427. [DOI] [PMC free article] [PubMed] [Google Scholar]
- Moczydlowski E, Latorre R. Gating kinetics of Ca2+-activated K+ channels from rat muscle incorporated into planar lipid bilayers. Evidence for two voltage-dependent Ca2+binding reactions. J Gen Physiol. 1983;82:511–542. doi: 10.1085/jgp.82.4.511. [DOI] [PMC free article] [PubMed] [Google Scholar]
- Nelson MT, Cheng H, Rubart M, Santana LF, Bonev AD, Knot HJ, Lederer WJ. Relaxation of arterial smooth muscle by calcium sparks. Science (Wash DC) 1995;270:633–637. doi: 10.1126/science.270.5236.633. [DOI] [PubMed] [Google Scholar]
- Neyton J. A Ba2+ chelator suppresses long shut events in fully activated high-conductance Ca2+-dependent K+channels. Biophys J. 1996;71:220–226. doi: 10.1016/S0006-3495(96)79218-4. [DOI] [PMC free article] [PubMed] [Google Scholar]
- Oberhauser A, Alvarez O, Latorre R. Activation by divalent cations of a Ca2+-activated K+channel from skeletal muscle membrane. J Gen Physiol. 1988;92:67–86. doi: 10.1085/jgp.92.1.67. [DOI] [PMC free article] [PubMed] [Google Scholar]
- Pallanck L, Ganetzky B. Cloning and characterization of human and mouse homologs of the Drosophila calcium-activated potassium channel gene, slowpoke. Hum Mol Genet. 1994;3:1239–1243. doi: 10.1093/hmg/3.8.1239. [DOI] [PubMed] [Google Scholar]
- Pallotta BS, Magleby KL, Barrett JN. Single channel recordings of Ca2+-activated K+currents in rat muscle cell culture. Nature (Lond) 1981;293:471–474. doi: 10.1038/293471a0. [DOI] [PubMed] [Google Scholar]
- Petersen OH. Calcium-activated potassium channels and fluid secretion by exocrine glands. Am J Physiol. 1986;251:G1–G13. doi: 10.1152/ajpgi.1986.251.1.G1. [DOI] [PubMed] [Google Scholar]
- Petersen OH, Maruyama Y. Calcium-activated potassium channels and their role in secretion. Nature (Lond) 1984;307:693–696. doi: 10.1038/307693a0. [DOI] [PubMed] [Google Scholar]
- Roberts WM, Jacobs RA, Hudspeth AJ. Colocalization of ion channels involved in frequency selectivity and synaptic transmission at presynaptic active zones of hair cells. J Neurosci. 1990;10:3664–3684. doi: 10.1523/JNEUROSCI.10-11-03664.1990. [DOI] [PMC free article] [PubMed] [Google Scholar]
- Robitaille R, Charlton MP. Presynaptic calcium signals and transmitter release are modulated by calcium-activated potassium channels. J Neurosci. 1992;12:297–305. doi: 10.1523/JNEUROSCI.12-01-00297.1992. [DOI] [PMC free article] [PubMed] [Google Scholar]
- Robitaille R, Garcia ML, Kaczorowski GJ, Charlton MP. Functional colocalization of calcium and calcium-gated potassium channels in control of transmitter release. Neuron. 1993;11:645–655. doi: 10.1016/0896-6273(93)90076-4. [DOI] [PubMed] [Google Scholar]
- Solaro CR, Nelson C, Wei A, Salkoff L, Lingle CJ. Cytoplasmic Mg2+ modulates Ca2+-dependent activation of mslo by binding to a low affinity site on the channel core. Biophys J. 1995;68:A30. [Google Scholar]
- Stocker M, Miller C. Electrostatic distance geometry in a K+channel vestibule. Proc Natl Acad Sci USA. 1994;91:9509–9513. doi: 10.1073/pnas.91.20.9509. [DOI] [PMC free article] [PubMed] [Google Scholar]
- Tseng-Crank J, Foster CD, Krause JD, Mertz R, Godinot N, DiChiara TJ, Reinhart PH. Cloning, expression, and distribution of functionally distinct Ca(2+)-activated K+channel isoforms from human brain. Neuron. 1994;13:1315–1330. doi: 10.1016/0896-6273(94)90418-9. [DOI] [PubMed] [Google Scholar]
- Tsien RY, Rink TJ, Poenie M. Measurement of cytosolic free Ca2+in individual small cells using fluorescence microscopy with dual excitation wavelengths. Cell Calcium. 1985;6:145–157. doi: 10.1016/0143-4160(85)90041-7. [DOI] [PubMed] [Google Scholar]
- Vergara C, Latorre R. Kinetics of Ca2+-activated K+ channels from rabbit muscle incorporated into planar bilayers. Evidence for a Ca2+ and Ba2+blockade. J Gen Physiol. 1983;82:543–568. doi: 10.1085/jgp.82.4.543. [DOI] [PMC free article] [PubMed] [Google Scholar]
- Wallner M, Meera P, Ottolia M, Kaczorowski R, Latorre R, Garcia ML, Stefani E, Toro L. Characterization of and modulation by a β-subunit of a human maxi KCachannel cloned from myometrium. Receptors and Channels. 1995;3:185–199. [PubMed] [Google Scholar]
- Wei A, Solaro C, Lingle C, Salkoff L. Calcium sensitivity of BK-type KCachannels determined by a separable domain. Neuron. 1994;13:671–681. doi: 10.1016/0896-6273(94)90034-5. [DOI] [PubMed] [Google Scholar]
- Wong BS, Lecar H, Adler M. Single calcium-dependent potassium channels in clonal anterior pituitary cells. Biophys J. 1982;39:313–317. doi: 10.1016/S0006-3495(82)84522-0. [DOI] [PMC free article] [PubMed] [Google Scholar]
- Yellen G. Ionic permeation and blockade in Ca2+-activated K+channels of bovine chromaffin cells. J Gen Physiol. 1984;84:157–186. doi: 10.1085/jgp.84.2.157. [DOI] [PMC free article] [PubMed] [Google Scholar]