Abstract
Single-channel properties of the Xenopus inositol trisphosphate receptor (IP3R) ion channel were examined by patch clamp electrophysiology of the outer nuclear membrane of isolated oocyte nuclei. With 140 mM K+ as the charge carrier (cytoplasmic [IP3] = 10 μM, free [Ca2+] = 200 nM), the IP3R exhibited four and possibly five conductance states. The conductance of the most-frequently observed state M was 113 pS around 0 mV and ∼300 pS at 60 mV. The channel was frequently observed with high open probability (mean P o = 0.4 at 20 mV). Dwell time distribution analysis revealed at least two kinetic states of M with time constants τ < 5 ms and ∼20 ms; and at least three closed states with τ ∼1 ms, ∼10 ms, and >1 s. Higher cytoplasmic potential increased the relative frequency and τ of the longest closed state. A novel “flicker” kinetic mode was observed, in which the channel alternated rapidly between two new conductance states: F1 and F2. The relative occupation probability of the flicker states exhibited voltage dependence described by a Boltzmann distribution corresponding to 1.33 electron charges moving across the entire electric field during F1 to F2 transitions. Channel run-down or inactivation (τ ∼ 30 s) was consistently observed in the continuous presence of IP3 and the absence of change in [Ca2+]. Some (∼10%) channel disappearances could be reversed by an increase in voltage before irreversible inactivation. A model for voltage-dependent channel gating is proposed in which one mechanism controls channel opening in both the normal and flicker modes, whereas a separate independent mechanism generates flicker activity and voltage- reversible inactivation. Mapping of functional channels indicates that the IP3R tends to aggregate into microscopic (<1 μm) as well as macroscopic (∼10 μm) clusters. Ca2+-independent inactivation of IP3R and channel clustering may contribute to complex [Ca2+] signals in cells.
Keywords: Ca2+ signaling, inositol phosphates, calcium release channel, patch clamp, signal transduction
introduction
In many cell types, binding of ligands to plasma membrane receptors activates the hydrolysis of phosphatidylinositol 4,5-bisphosphate by membrane-bound phospholipase C, generating inositol 1,4,5-trisphosphate (IP3).1 IP3 causes the release of Ca2+ from intracellular stores including the endoplasmic reticulum (ER) by binding to its receptors (IP3R) (Taylor and Richardson, 1991; Berridge, 1993; Putney and Bird, 1993). Several types of IP3R as products of different genes (Mignery et al., 1990; Yamamoto-Hino et al., 1994) with alternatively spliced isoforms (Mikoshiba, 1993; Taylor and Traynor, 1995) have been identified and sequenced. The IP3Rs have ∼2,700 amino acid residues in IP3 binding, regulatory (modulatory) and transmembrane channel domains (Mignery and Südhof, 1990; Mikoshiba, 1993; Taylor and Traynor, 1995), and form tetramers (Mignery and Südhof, 1990). The putative transmembrane domains of the receptors have sequence homology with some of those in the ryanodine receptor (Taylor and Traynor, 1995), a muscle sarcoplasmic reticulum Ca2+ channel (Williams, 1992). Reconstitution of purified IP3R demonstrated that the receptor itself is a Ca2+ channel (Supattapone et al., 1988).
Defining the details of the single-channel properties of the IP3R has been hampered by its intracellular location. Single-channel studies have been accomplished by reconstituting the IP3R channels (purified or in membrane vesicles) into planar lipid bilayers (Ehrlich and Watras, 1988; Bezprozvanny et al., 1991, 1994; Watras et al., 1991; Mayrleitner et al., 1991, 1995; Bezprozvanny and Ehrlich, 1993, 1994). However, because reconstitution protocols isolate the IP3R from its native membrane environment and possibly disrupt normal protein–protein and protein–lipid interactions, channel properties and regulation of IP3R observed in bilayers may not faithfully reflect the situation in situ. To circumvent these problems associated with recording currents through intracellular ion channels, we and others (Mak and Foskett, 1994; Stehno-Bittel et al., 1995) have applied the patch clamp technique to isolated cell nuclei. The rationale of this approach is the observed continuity of the ER with the outer membrane of the nuclear envelope (Dingwall and Laskey, 1992) and the successful application of the patch clamp technique to the nuclear envelope despite the presence of nuclear pores (Mazzanti et al., 1990, 1991; Tabares et al., 1991; Bustamante, 1992, 1993, 1994; Matzke et al., 1992). Physiological, biochemical, and immunocytochemical studies have implicated the nuclear envelope as an IP3-sensitive Ca2+ store in several cell types (Lin et al., 1994). Of particular relevance for the present study, the IP3R has been localized to the nuclear envelope in Xenopus laevis oocytes (Parys et al., 1992, 1994; Kume et al., 1993; Callamaras and Parker, 1994). Patch clamp of the outer membrane of isolated Xenopus oocyte nuclei revealed IP3-sensitive ion channel activities, providing the first demonstrations of the single-channel properties of IP3R in its native membrane environment (Mak and Foskett, 1994; Stehno-Bittel et al., 1995).
In our initial study (Mak and Foskett, 1994), we demonstrated that one of the most frequently observed channels in outer nuclear membrane patches exposed to 10 μM IP3 and 200 nM free Ca2+ in the pipette solution, was the IP3R, as evidenced by its activation by IP3 and inhibition by the competitive inhibitor heparin. This IP3R was likely the type 1 isoform since this isoform has been localized to both the ER and nuclear envelope of Xenopus oocytes (Parys et al., 1992, 1994; Kume et al., 1993; Callamaras and Parker, 1994), and it is likely the only sub-type expressed by the oocyte (Kobrinsky et al., 1995). The Xenopus IP3R was found to be weakly Ca2+-selective, with ion permeabilities PCa/PK/ PCl = 8:1:0.05. Multiple conductance states, current-voltage (I-V) relation in symmetric and asymmetric ionic conditions, some kinetic properties, and the inactivation or run-down in the continuous presence of IP3 of the IP3R channel were described. Some of these properties of the IP3R in its native membrane environment were different from those described for rat cerebellar IP3R reconstituted in lipid bilayers (Bezprozvanny et al., 1991; Watras et al., 1991; Bezprozvanny and Ehrlich, 1994, 1995). In this paper, we describe more detailed studies of the endogenous IP3R in the Xenopus oocyte, characterizing for the first time the detailed kinetic properties of the channel and its inactivation, and the distribution of functional IP3R channels in the outer nuclear membrane.
materials and methods
Isolation of Individual Oocyte Nuclei
Maintenance of Xenopus laevis, surgical extraction of ovaries and storage of the extracted ovaries were described previously (Mak and Foskett, 1994). Stage VI oocytes (Smith et al., 1991) were isolated from the ovary just before the experiments and opened mechanically. The translucent nucleus was gently separated from the cytoplasmic material in the bathing solution and transferred to a culture dish containing the same solution on the stage of a microscope for patch-clamp experiments.
Patch Clamping the Oocyte Nucleus
The isolated nucleus was gently immobilized as described previously (Mak and Foskett, 1994). A patch pipette (5–20 MΩ when filled with 140 mM KCl) was placed so that its tip came into contact with the outer membrane of the nucleus, as indicated by an increased (≈10%) pipette resistance. Gigaseals formed (>80% success rate) when gentle suction (5–20 mmHg) was applied to the pipette. To estimate the duration of channel activity, current recording was started as soon as the seal resistance exceeded 200 MΩ (3–10 s after the pipette tip contacted the nucleus), before it attained its final stable value. Due to inactivation or run-down of the IP3R channels (Mak and Foskett, 1994 and this study), all experiments were done in the “on-nucleus” configuration without excision of the patched membrane. No difference was detected in the current-voltage relation of the channels observed before and after excision of the membrane patches (Mak and Foskett, 1994; Fig. 1). This indicated that the cation composition of the solution in the perinuclear space between the inner and outer nuclear membranes is similar to that of the bath solution in these experiments. Following standard conventions, the applied potential is the potential difference between the pipette electrode and the reference bath electrode. Accordingly, positive current flowed from pipette outward. All patch clamp experiments were performed at room temperature under symmetrical ionic conditions with the pipette solution containing 10 μM IP3.
Figure 1.
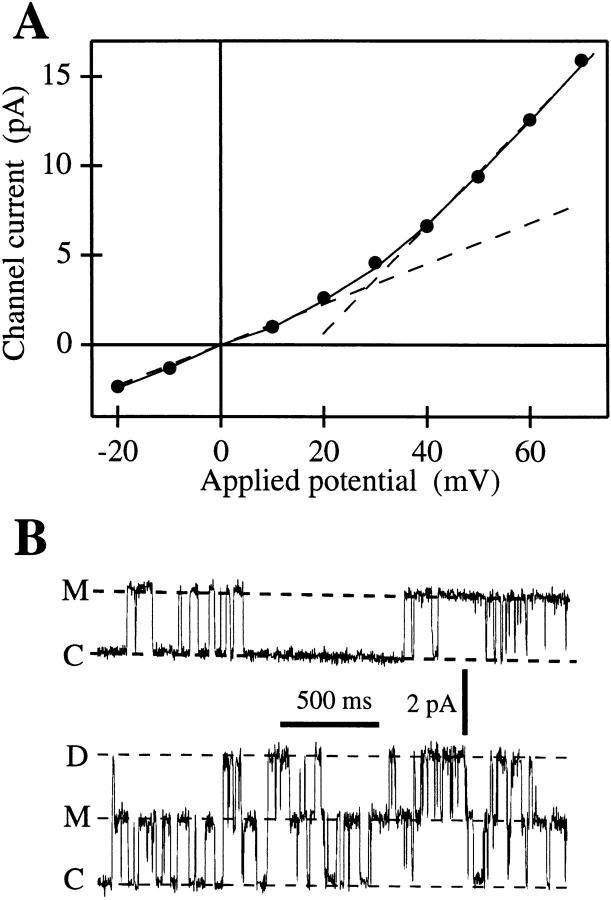
(A) I-V curve of the main state M of the IP3R in the oocyte outer nuclear membrane. Channel current amplitudes in symmetric standard solution (filled circles) were evaluated as the difference between Gaussian peaks fitted to current amplitude histograms of current records containing the closed and main states (n = 12; filtered at 1 or 5 kHz). Current amplitude in an excised patch in symmetric basic oocyte nucleus solution obtained previously (Mak and Foskett, 1994) is also plotted (solid line). The dashed lines represent differential conductances of 113 pS at 0 mV and 300 pS at 60 mV, respectively. (B) Typical current traces of the IP3R channel at 20 mV, showing closed (C), main (M), and double (D) states. Data was digitized at 2 kHz and filtered at 1 kHz.
Data Acquisition and Analysis
Single-channel currents were amplified with an Axopatch-1D amplifier (Axon Instruments, Foster City, CA) with anti-aliasing filtering at 1 or 5 kHz, transferred to a Macintosh Centris 650 via an ITC-16 interface (Instrutech Corp., Great Neck, NY), digitized at 2 or 12.5 kHz, respectively, and written directly onto hard disk by Pulse+PulseFit software (HEKA elektronik, Lambrecht, Germany). Data were analyzed (with further digital filtering when necessary) and fitted with theoretical curves using MacTac 2.0 (Skalar Inst., Seattle, WA), pCLAMP 6.0.2 (Axon Instruments), and Igor Pro 3 (WaveMetrics, Lake Oswego, OR).
Materials and Solutions
IP3 and BAPTA (1,2-bis(O-aminophenoxy)ethane-N,N,N′,N′-tetraacetic acid) were from Molecular Probes (Eugene, OR); ATP (magnesium salt), EGTA, and inorganic salts were from Sigma Chem. Co. (St. Louis, MO). The standard solution contained 140 mM KCl, 10 mM HEPES, 3 mM MgCl2, 1 mM MgATP, 1 mM BAPTA, 0.543 mM CaCl2 at pH 6.95 with calculated free [Ca2+] of 200 nM, and was used in all experiments unless specified otherwise. Free [Ca2+] in various solutions was calculated using Maxchelator software (C. Patton, Stanford University, CA). K+ was used as charge carrier since Ca2+ at high concentrations may inhibit IP3R activity (Bezprozvanny et al., 1991). The basic oocyte nucleus solution (BONS) used previously (Mak and Foskett, 1994) had the same ionic composition but contained no MgATP.
results
Channel Identity
In symmetric standard solution, channels with multiple conductance states were observed in the oocyte outer nuclear membrane. The channel current-applied voltage (I-V) relation of the most-frequently observed conductance state M (“main”) of the channel is nonlinear with rectification at high applied potentials (Fig. 1). The slope conductance of the channel around 0 mV was 113 pS, and gradually increased to ∼300 pS around +60 mV. This I-V relation is practically identical to that of state M of IP3R observed previously in symmetric BONS (Mak and Foskett, 1994). To confirm the identity of these channels as IP3R, statistical means were used to determine the responses to IP3. Multiple patches were obtained from nuclei (4–10 patches from each nucleus) in which the probability (P d) of detecting the described channels in the presence of IP3 was high (>0.5), with the pipette solution alternately containing either no IP3 or 10 μM IP3. Channels as described were observed in 20 of 26 patches with IP3 from 6 different nuclei, but not observed in any of 14 patches with no IP3. In a similar series of experiments with the pipette solutions containing either IP3 or IP3 together with 100 μg/ml heparin (a competitive inhibitor of IP3R), channels as described were observed in 9 of 18 patches with IP3 from 2 nuclei, but not in any of the 10 patches with IP3 and heparin (Mak and Foskett, 1994).
Other channel activities were observed independent of the presence of IP3 in the pipette solution. They were easily distinguished from IP3R channels by their conductances (either >400 pS or ∼20 pS), their linear I-V relation, and their gating kinetics.
IP3R Localization in Clusters
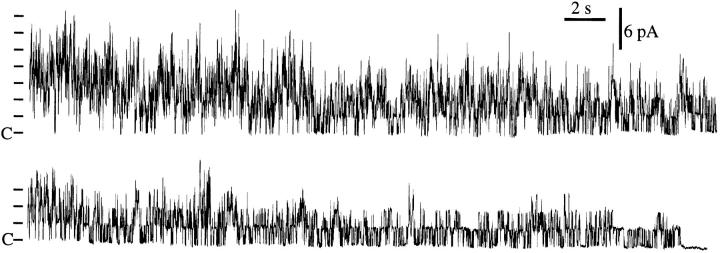
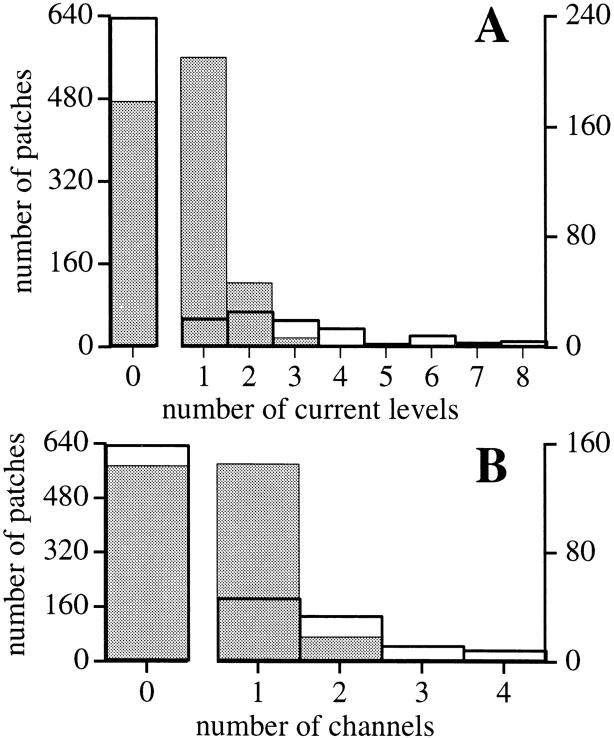
A significant proportion (59/102) of the active patches (102 active/740 patches) in the standard solution in which IP3R activities were detected contained multiple IP3R channels, as identified by current records showing three or more equally spaced current levels, each corresponding to the conductance value of state M (Fig. 2). In contrast, only 19 patches exhibited just one open channel current level of state M. Two equally spaced current levels (M and D) were detected in 24 patches (Fig. 1 B). Whether such double-level records represent two channels or a substate of a single channel is discussed later. In either case, the high proportion of multiple-channel patches suggests that IP3Rs are not distributed evenly over the surface of the outer nuclear membrane, but are localized in clusters (Fig. 3).
Figure 2.
Typical multiple-channel current record showing seven equally-spaced current levels at the beginning of the recording. Channel activity duration for this record is 70.2 s (from the beginning of the record to the final closing event as the last observed channel inactivated). V app was 20 mV. Data were digitized at 2 kHz and filtered digitally at 300 Hz.
Figure 3.
(A) Histogram analysis of current levels observed in 740 patches (unshaded histogram with thick outline). Also plotted (shaded histogram with thin outline) is the Poisson distribution with the same mean current level number per patch (0.44 current level/patch for 740 patches), calculated by assuming that each current level represents an individual IP3R that exhibited only the M state and that the channels were evenly distributed on the outer nuclear membrane. (B) Histogram analysis of number of channels in the 740 patches (unshaded histogram with thick outline) assuming that all IP3R channels observed exhibited the D state, such that every two current levels detected represents one channel. The theoretical Poisson distribution with the same mean channel number per patch (0.25 channel/patch for 740 patches) is also plotted (shaded histogram with thin outline). In both cases, the large number of observed multiple-channel patches compared with the number of observed single-channel patches suggests that the IP3R channels are not evenly distributed in the outer nuclear membrane of oocytes.
In addition to the high frequency of observing patches with multiple channels, other data obtained also support the idea that the IP3R exists in clusters. With the oocyte nucleus secured by a stabilizer (Mak and Foskett, 1994), video imaging enabled membrane patches to be repeatedly obtained from approximately the same area (± 2 μm). In 13 of 67 nuclei in which IP3R activities were detected (137 nuclei examined), “macroscopic regions” on the membrane surface were defined in which P d (0.74, n = 72) was significantly higher than the overall P d (0.14, n = 740), or the P d of other regions on the same nuclei (0.19, n = 52). Also, active patches obtained within such regions contained significantly (P < 0.02) more IP3R channels (202 current levels in 53 patches) than all the other active patches (133 levels in 49 patches). In a 25 × 55 μm region, whose boundary was mapped by a large number of patches obtained, IP3R activities were detected in all 7 patches obtained, with 6 patches showing more than one current level, whereas no IP3R activity was detected in all 4 patches obtained outside the region. In another such region of similar size of another nucleus, multi-level IP3R activities were detected in all 6 patches obtained, and IP3R activity with only one current level was detected in 1 of 8 patches obtained outside the region. While the exact size and shape of such active regions could not be determined because each recording examined only a small membrane area (∼1 μm2), these results strongly suggest that besides the “microscopic clustering” (<1 μm in diameter) of the IP3R channels that give rise to a high frequency of obtaining membrane patches with multiple channels, IP3Rs are also organized into “hot regions” that can extend over several to tens of micrometers.
Normal Kinetics of the IP3R
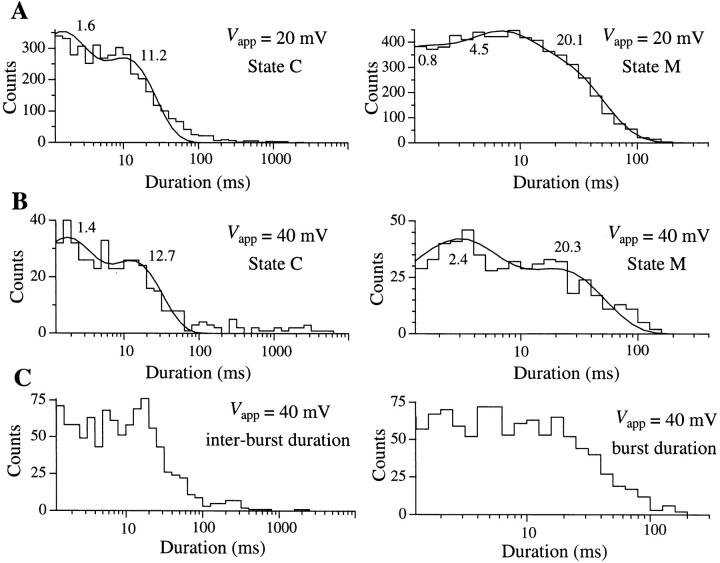
The kinetics of the IP3R observed in the standard solution in the present study (Figs. 1 B and 4) were characterized by a relatively high open probability (P o) (mean P o = 0.4 at 20 mV for 15 experiments lasting a total of 582 s) and average open duration for state M of between 9 and 22 ms (n = 5; filtered at 1 kHz). Intrinsic inactivation or run-down of the IP3R after exposure to IP3 (data presented below) limited the number of long experiments available for detailed kinetic study. In those experiments with sufficient opening and closing events for kinetic analyses (n = 7), dwell time distribution histograms of the closed C and open M states typically had to be fitted with at least 2 exponential components each (Fig. 5). Since the dwell time distributions obviously extend beyond the resolution of our experiments, both states C and M might have exponential components with time constants shorter than 1 ms. Assuming that the channel kinetics are Markovian and steady throughout the duration of channel activity, the dwell time histograms indicated that there are at least two kinetically distinguishable main states with time constants τ < 5 ms and ∼20 ms. The channel also has at least two closed states with time constants τ ∼1 and ∼10 ms. Furthermore, in many experiments (>40%), periods of high channel activity were separated by quiescent (P o = 0) periods that could last from several seconds to >10 s (Fig. 6 A). This indicated that the channel must also have at least one long closed kinetic state Clong with time constant >1 s.
Figure 4.
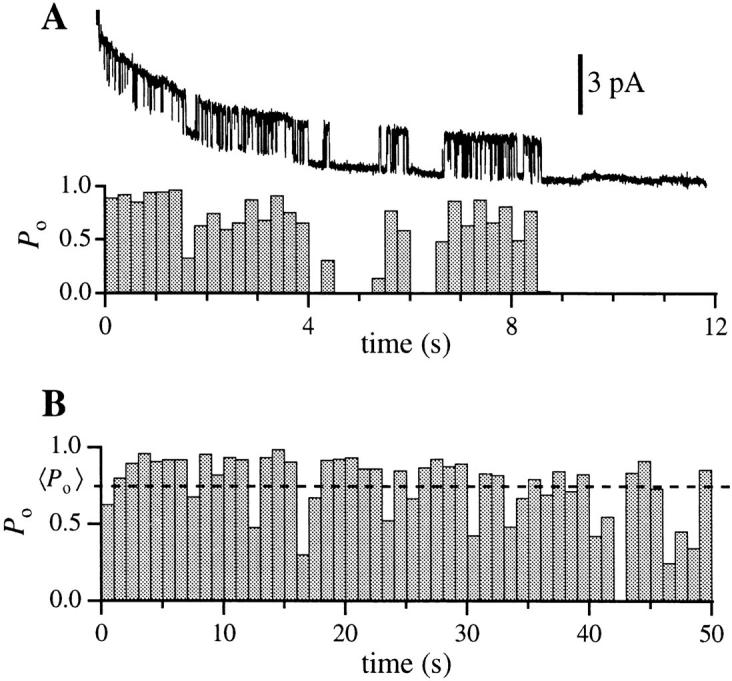
(A) Current trace and open probability histogram of a typical current record with the IP3R channel in the main and closed states. Base-line current level fluctuated in the record because current recording was started before the gigaseal completely stabilized. The channel in the current record inactivated permanently by 9 s after seal formation. Bin width for the histograms is 0.25 s. (B) Open probability histogram for a single IP3R with longer duration of channel activity. Bin width is 1 s. For both records V app was 20 mV, data were digitized at 2 kHz and filtered at 300 Hz digitally.
Figure 5.
Dwell time histograms for the closed state C and open state M of the IP3R at V app = (A) 20 and (B) 40 mV, respectively. Only states C and M were observed in the single-channel current records used for this analysis. 6 records with total duration of 139.1 s were used for A, and 1 record with duration of 42.8 s was used for B. The smooth curves are theoretical probability density functions consisting of two exponentials fitted to the histograms by the maximum likelihood method (Sigworth and Sine, 1987). The time constants for the exponentials fitted are labeled in ms beside the corresponding peaks in the curves. (C) Duration histograms of inter-burst closed state and the activity bursts of an IP3R channel in the flicker mode at V app = 40 mV. The activity burst duration was defined as the interval between the departure of the channel from the closed state into either one of the flicker states (F1 or F2) and its subsequent return to the closed state for a period longer than 1 ms. Data were digitized at 2 kHz, filtered at 800 Hz and analyzed using MacTac software with channel dwell time corrected for the filtering (Colquhoun and Sigworth, 1995).
Figure 6.
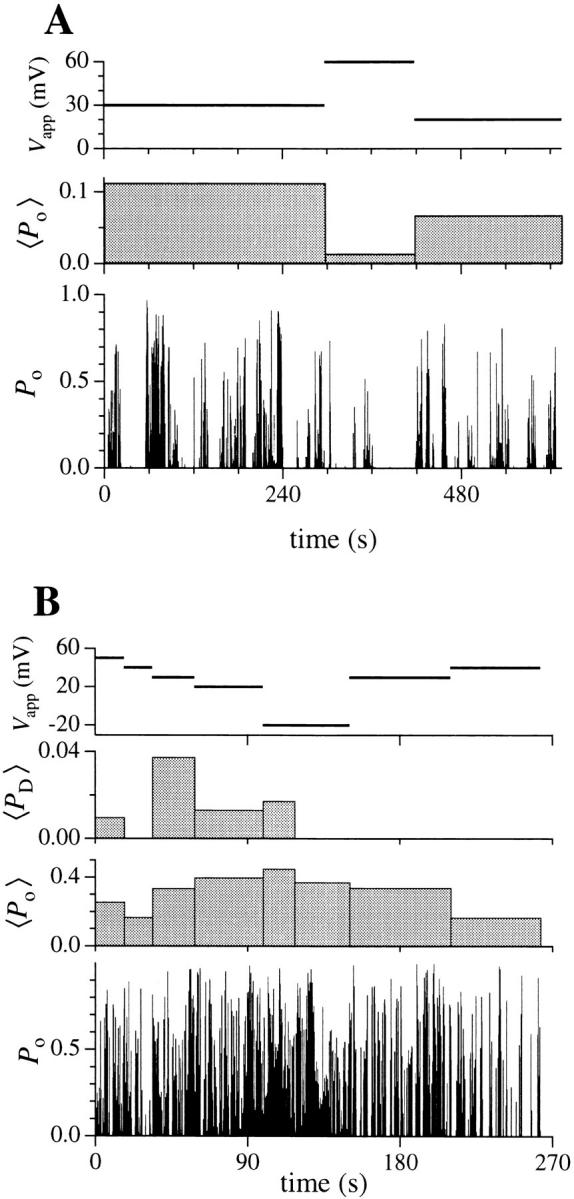
The effect of applied potential on IP3R channel open probability. 〈P o〉 is the overall open probability of the channel averaged over the interval during which the applied potential V app was constant. Bin width of the P o histogram is 0.25 s. The intervals (2– 6 s) during which the applied potential was changed in the experiment were omitted in the graphs to avoid confusion. (A) A single-channel patch in which only states C and M were observed in the entire current record up to the failure of the gigaseal at t = 615 s. (B) A patch showing two equally-spaced channel current levels. The channel(s) observed inactivated at t = 262 s. 〈P D〉 is the probability of observing the channel current in the higher level D, averaged over the interval indicated by the width of the bin. Channel current level D was not observed after t = 117.5 s. P o is the probability of the channel being open, i.e., P o = P D + P M, where P M is the probability of observing the channel current in the main state level.
In patches (n = 5) in which the IP3R remained active long enough for kinetics to be observed at various applied potentials V app (>15 s at each V app), there was no consistent correlation between the dwell time distributions for the main and closed channel states and V app (Fig. 5). In those patches (2/5) that showed current level D, the probability of observing the channel current in level D (P D) also did not show noticeable correlation with V app (Fig. 6 B). The only consistent effect of voltage on channel kinetics was an increase in the number and duration of long quiescent periods observed under higher V app (Figs. 5 and 6 A), which tended to decrease the P o averaged over the whole duration of channel activity at constant applied potential (Fig. 6). However, as shown in Fig. 6 A, long quiescent periods were often observed at low V app as well. Detailed investigation of the voltage dependence of Clong kinetic state was hindered by the inactivation of the channel. As V app increased, the quiescent periods increased and only a few periods of activity could be observed before the channel inactivated.
Conductance States of IP3R
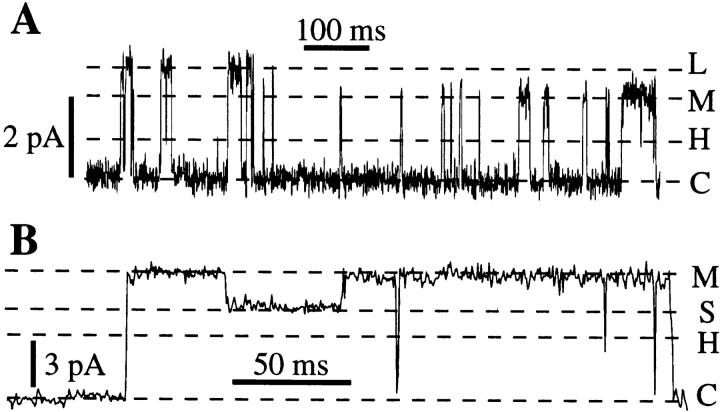
As in BONS (Mak and Foskett, 1994), in addition to state M, a rare state H (“half”) with conductance half that of the main state M in the standard solution was observed briefly (duration <0.1 s) in 6 of 102 active patches. A current level corresponding to the state D (“double”) described in Mak and Foskett (1994) with conductance twice that of state M was observed in 24 of 102 active membrane patches (Fig. 1 B). Two additional states with different conductances were observed in our present study, but only very rarely (<0.1% of total channel open time). These included a large state L (in 9 patches, Fig. 7 A) with conductance value ∼1.3 times that of state M, and a small state S with conductance value ∼0.7 times that of state M (in 5 patches, Fig. 7 B). The relation of state S to the IP3R was established by observations of transitions between IP3R state M and state S without channel closing (Fig. 7 B). Furthermore, both states L and S were only observed in patches in which the main IP3R state M was also observed.
Figure 7.
Current traces showing rarely observed conductance states L (A) and S (B) for channels in normal kinetic mode from 2 separate experiments. Data were digitized at 2 kHz and filtered at 1 kHz. V app = 20 mV for (A) and 50 mV for (B).
The issue of whether current level D is a true substate of a single channel or reflects the activity of two channels is complicated by the fact that its conductance is exactly twice that of the predominant state M. The large number of patches with two equally spaced current levels relative to that of single current-level patches (Fig. 3) suggests that current levels D and M are physically associated and that level D is likely not generated by the random inclusion of two channels in the patches. Several observations further suggest that the gating kinetics of IP3R to levels M and D are highly correlated. Theoretically, two identical, independent active channels should generate currents with open probabilities P 1 and P 2 (probabilities that one or both channels were open, respectively) described by the binomial probability distribution:
 |
However, of the 24 patches showing only current levels M and D, only one demonstrated an experimental probability of the channel current being at level M (P M) that agreed with the theoretical probability P 1, calculated using the experimental probability that the channel current was at level D (P D) as P 2 in the equation (Fig. 8 A). The other patches had P M significantly different from the theoretical P 1 (Fig. 8 B). This suggests that most of the channel records showing current level D were not caused by two identical, independent channels located in the same membrane patch. In most patches with current level D, there were long periods (over several seconds) during which only current level M was observed (t after 117.5 s in Fig. 6 B, and between 110 and 160 s in Fig. 8 B). The P o (P M + P D) during these periods was not noticeably different from that during those periods in which level D was observed (Figs. 6 B and 8, A and B). Also, the dwell time distributions for the closed state C in the presence and absence of current level D were practically indistinguishable (data not shown). Furthermore, two patches showing current levels M and D exhibited long quiescent periods, with levels D and M both occurring within the relatively short periods of channel activities (Fig. 8 C). These observations were unlikely to be caused by two independent channels in the patched membrane even if the channels had erratic open probabilities with long quiescent periods. They probably reflect the presence of either two interdependent cooperative channels each exhibiting state M only, or a single channel with true states M and D.
Figure 8.
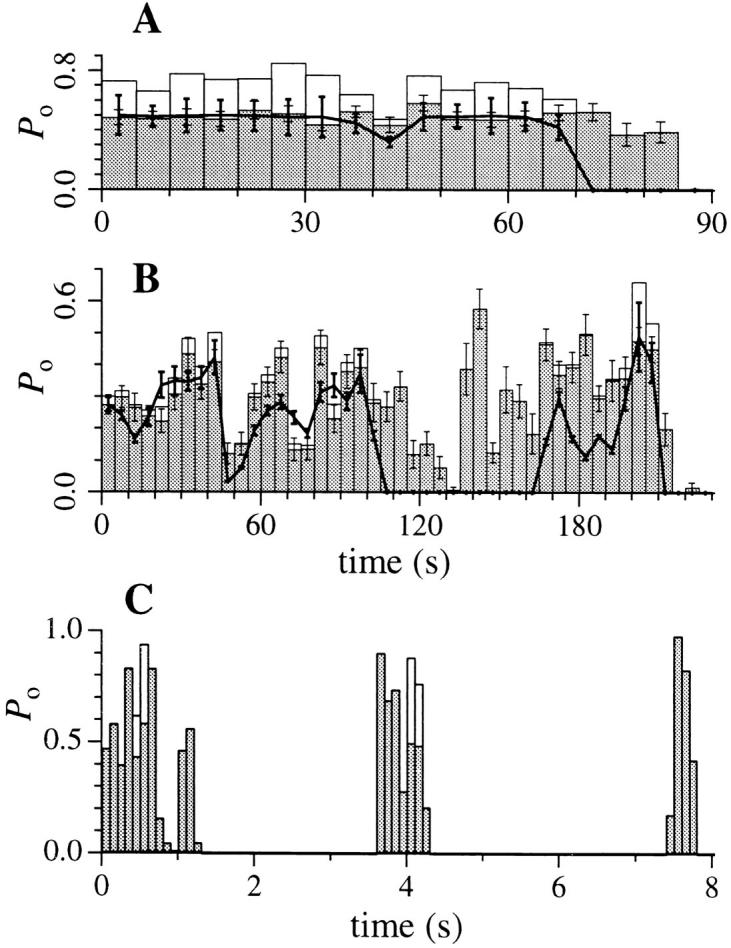
Open probability histograms for experiments in which two evenly spaced current levels (M and D) were detected. (A and B) Histogram bin width is 5 s. Unshaded histogram bars are the measured probability of the channel current in level D (P
D); shaded bars with thin error bars are the measured probability (± SEM) of the channel in state M (P
M). Assuming that current level D is caused by two independent and equivalent channels contained in the same membrane patch opening to state M simultaneously, the theoretical probability P
1 of the channel current being at the level corresponding to a single channel in state M is given by the binomial distribution, The solid lines represent the theoretical probability P
1 evaluated using the measured probability P
D as P
2. The thick error bars represent the errors in P
1 evaluated from the SEM of P
D. In A, the measured P
M agreed well with the theoretical P
1 calculated from P
D, indicating that the patch probably contained two independent and equivalent channels until one channel inactivated after t = 70 s. In B, which is typical of the majority of channel current records showing two evenly spaced current levels, P
M and P
D measured did not obey the binomial distribution expected for two independent and equivalent channels. (C) Open probability histogram of an experiment with current level D that exhibited long quiescent periods. Histogram bin width is 0.1 s. Unshaded histogram bars represent P
D; shaded bars represent P
M.
Inactivation of the IP3R
A prominent feature of the IP3R channel activities observed in our experiments was inactivation or run-down of the channels in the continuous presence of IP3 in the pipette, in standard solution (Fig. 4 A) as well as BONS (Mak and Foskett, 1994). Channels could be activated upon gigaseal formation for >2 h after the nucleus was isolated, indicating that inactivation required activation by IP3. Inactivation was generally abrupt, with no significant difference between P o of a channel just before inactivation and just after it had been activated (Figs. 4 and 6 B). However, the rapidity of the onset of inactivation (usually <2 min) prevented the detailed analysis necessary to determine if the channel kinetics (dwell time distributions of states C and M) varied significantly during the course of inactivation.
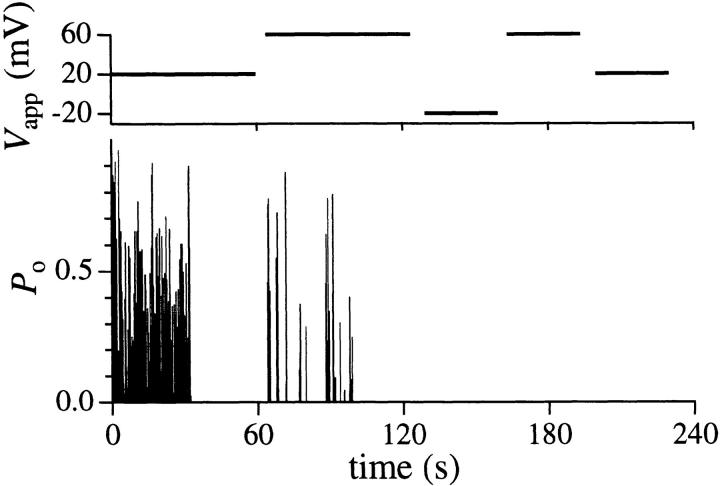
In ∼10% of patches (9/102) with IP3R channel activities, the channels could be reactivated after inactivation, by an increase in V app of 20–40 mV (Fig. 9). In two of these patches, channel inactivation was reversed twice by repeated jumps in V app, using a voltage protocol similar to that shown in Fig. 9. Thus, an active IP3R can enter at least two distinguishable inactivated states: one (IVdep) from which it can be reactivated by a jump in V app (first inactivation in Fig. 9), and an irreversible one (Iirr) from which it cannot exit in the continuous presence of IP3 under our experimental conditions (second inactivation in Fig. 9). In all our experiments, V app was pulsed several times after channel inactivation, as in Fig. 9, to ensure that the observed channels had entered the irreversible inactivated state Iirr before the experiments were terminated.
Figure 9.
Open probability (P o) and applied voltage (V app) graphs of an experiment showing the two different types of channel inactivation: the voltage-reverted inactivation occurring at t = 32.25 s that was reversed by the increase of V app from 20 to 60 mV at t = 60.0 s; and the irreversible inactivation occurring at t = 99.0 s. Bin width of the histogram is 0.25 s.
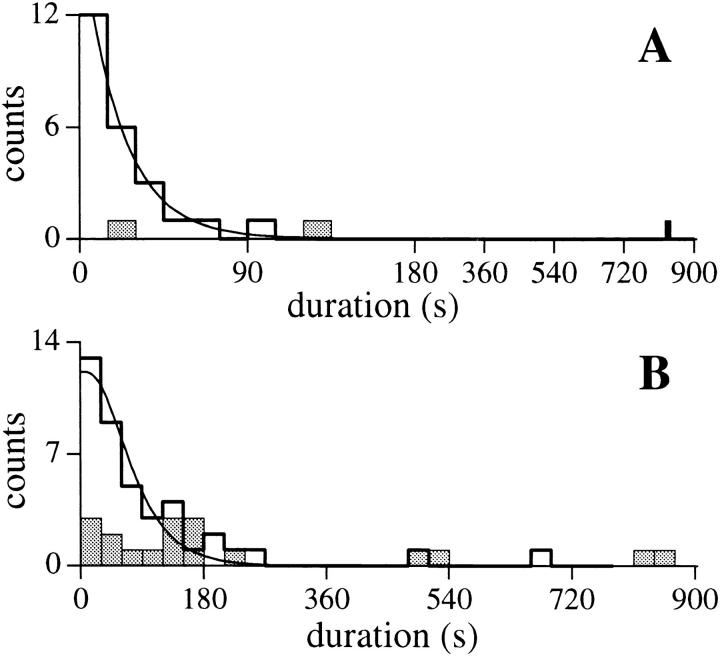
The histogram of the duration of channel activity in patches with only one open channel current level M (Fig. 10 A) could be fitted by one exponential function with a time constant of 21.1 ± 0.6 s (n = 24, including six experiments that had previously been reactivated by a jump in V app). This indicates that channel inactivation is probably a Markovian process with a time-independent probability for an active channel to become inactivated under constant experimental conditions. As IP3R activation by exposure to IP3 probably occurred some time before the seal resistance became high enough for the channel current to be monitored, it was impossible to determine the time of channel activation with accuracy greater than ±5 s, the average time that elapsed from the positioning of the micropipette containing IP3 onto the nuclear membrane to the formation of the gigaseal. Thus, exponential components of inactivation with time constants shorter than 10 s could not be observed properly in our experiments. Also, since each experiment surveyed at most a few active channels, inactivation components with low relative weights and/or long time constants could not be observed properly due to the small sample size.
Figure 10.
Channel activity-duration histograms of the IP3R for (A) single-channel experiments in which only one channel current level (state M) was observed (n = 24, including six inactivations after reactivation by a voltage jump); (B) multiple-channel experiments in which three or more channel current levels were observed (n = 41, including six inactivations after reactivation by a voltage jump). Note the compressed time scale of (A) after t =180 s. The measured duration of channel activity was the duration between the formation of the gigaseal (when seal resistance exceeded 200 MΩ) and the last observed channel closing event. The smooth curve in A is a single exponential functions fitted to the activity duration histogram with time constant of 21.1 ± 0.6 s. The smooth curve in B represents the theoretical functions fitted to the activity duration histogram for k = 4 with time constant of 41 ± 3 s. The theoretical fits for k = 3, 5, and 6 are very similar in shape, with different values for the time constant. Experiments in which the gigaseal broke before the channel(s) inactivated (n = 3 and 18 for A and B, respectively) were excluded from the activity duration histograms. Their duration distributions (shaded histograms) showed that failure of the gigaseal probably does not cause any significant systematic bias in the activity-duration histograms.
The duration of channel activity in patches with more than two equally-spaced channel current levels (from three to eight levels) was defined as the duration between the formation of the gigaseal (when seal resistance exceeded 200 MΩ) and the last observed channel closing event. Assuming that the channels in the same patch were identical and inactivation was Markovian with a single exponential component of time constant τ, the probability that an active channel observed at the time of seal formation (t = 0) becomes inactivated by time t is ∝ 1 − e −(t/τ). The probability that all of the k channels in a multi-channel patch are inactivated by time t is ∝ [1 − e −(t/τ)]k. Thus the probability that any channel in the k-channel patch remains active by time t ∝ {1 − [1 − e −(t/τ)]k}. In 41 experiments showing three or more open channel current levels (no reactivated experiments), the average number of current levels observed was 4.63. The values of τ derived from the best fit of the theoretical equation to the duration histogram (Fig. 10 B) were 47, 41, 38, and 35 s (± 3 s) for k = 3, 4, 5 and 6, respectively. The statistically significant difference between the time constants for channel inactivation in single and multiple-channel patches (P < 0.001 even assuming k = 6) suggested that IP3R channels in multiple-channel patches do not inactivate independently, since they persist longer after IP3 activation than those in single-channel patches.
Flicker Kinetics of the IP3R
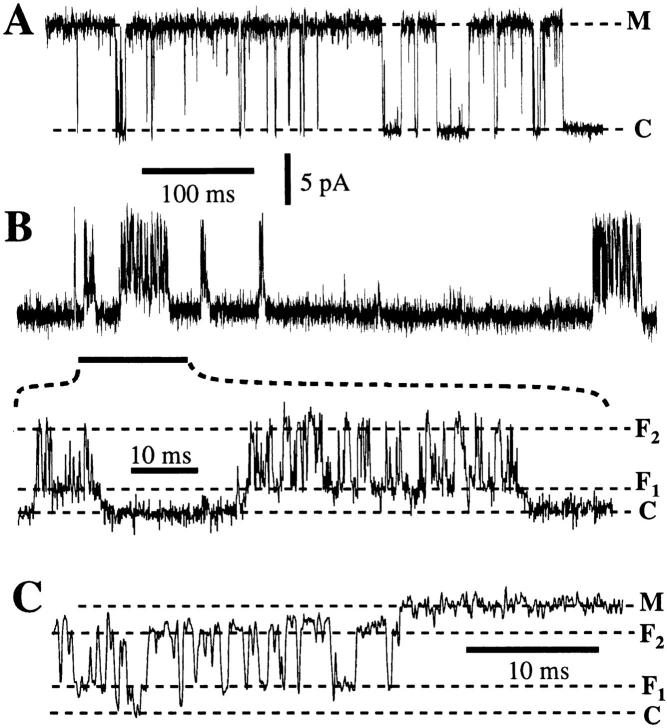
In ∼25% of active patches (26/102), the channels also exhibited a radically different kinetic mode. In this “flicker” mode, a channel demonstrated bursts of activity during which it alternated rapidly between two new conductance states: F1 and F2 (Fig. 11 B). Between the bursts of activity, the channel exhibited a relatively long closed state. Direct transitions between either of the flicker states (F1 and F2) and the closed state (C) were observed (Fig. 11 C). Channels were observed to convert spontaneously between flicker and normal modes, often several times in the same experiment. The channels some times changed directly between the flicker states (F1 and F2) and state M in the normal mode without closing (Fig. 11 C). Channels were found in the flicker mode at the formation of the gigaseal (3/26) or they entered the flicker mode from the normal mode spontaneously (10/26); in half of the experiments with channels in the flicker mode, the flicker activity appeared after the channels were activated by a jump in V app (n = 13, including two patches in which the channel was already in flicker mode before undergoing voltage- reversible inactivation and six patches with no recorded channel activity before the jump in V app). Channels in the flicker mode irreversibly inactivated directly (n = 8), or subsequent to conversion to the normal mode (n = 13). (The gigaseal broke before channel inactivation in the remainder of the experiments that exhibited the flicker channel activity.)
Figure 11.
Typical current trace of an IP3R channel (A) in the normal kinetic mode (B) in the flicker kinetic mode with bursts of activities and (C) in a transition from flicker mode to the normal mode without closing. The dashed lines indicate the current levels of the various conductance states. V app was 50 mV. Data were digitized at 12.5 kHz and filtered at 5 kHz.
In two experiments in which the channel remained in the flicker mode for an extended period (>200 s), a change of V app from positive to negative (20 mV to −20 or −40 mV) caused the channel to close completely. Channel activity only resumed (in the flicker mode) when V app was returned to positive. Channels were never observed in the flicker mode under negative V app. This contrasts with the channels in the normal mode, which were active in both positive and negative V app.
The duration distribution of the inter-burst closed state in the flicker mode (Fig. 5 C) was comparable to that of the closed state in the normal kinetic mode under the same V app (Fig. 5 B). This suggests that the closed states in the flicker and normal modes are kinetically indistinguishable. The increases in number and duration of long quiescent periods under higher V app were also observed for channels in the flicker mode, as for those in the normal mode. The duration of the bursts of activity of an IP3R channel in the flicker mode (Fig. 5 C) had a distribution which was comparable to that of state M in the normal kinetic mode under the same V app (Fig. 5 B).
The current levels for the states C, F1, and F2 and their occupation probability distributions were determined from the current amplitude histogram (Fig. 12 A). The count of current data points was fitted by the sum of three Gaussian functions:
 |
Figure 12.
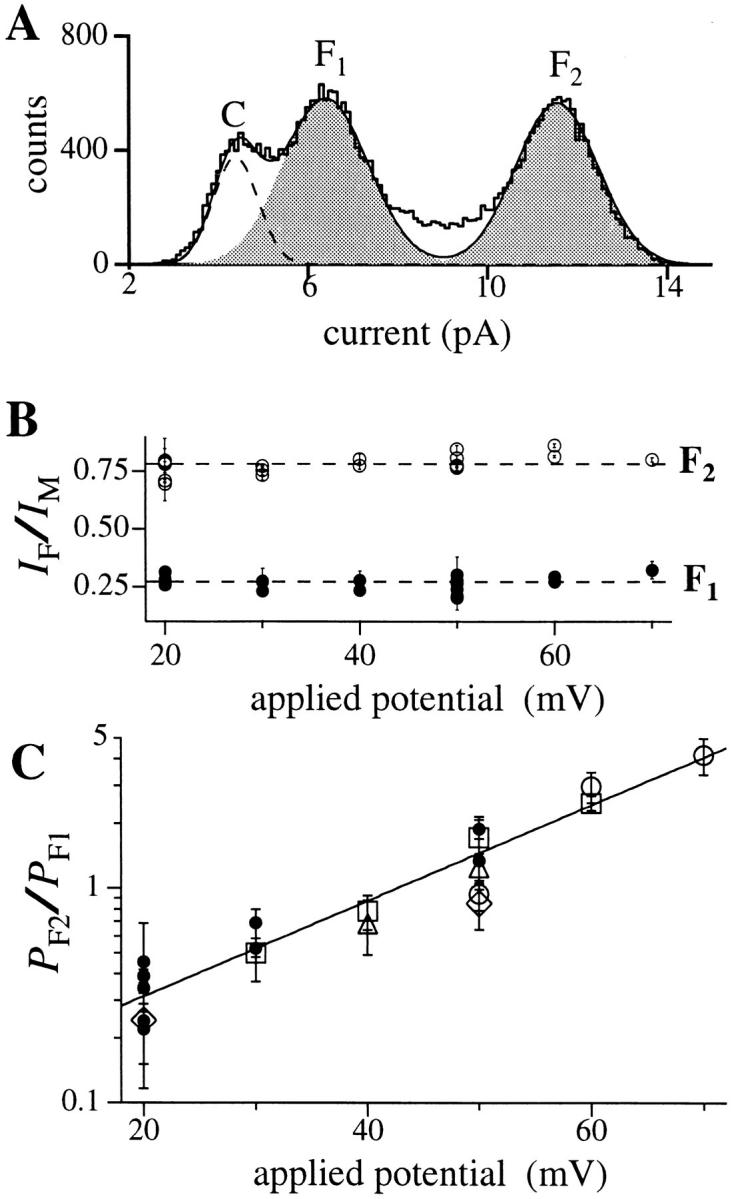
(A) Current amplitude histogram of a channel in the flicker kinetic mode. Segments of current traces during which the channel showed bursts of activities were selected to generate the histogram with bin width of 0.1 pA. V app was 50 mV. Data were digitized at 12.5 kHz and filtered at 5 kHz. Theoretical fit to the histogram (smooth curve) is the sum of three Gaussian functions representing the closed state C (dashed curve), and the flicker states F1 and F2 (shaded areas). (B) Ratios of the channel current amplitude I F1/I M and I F2/I M under various applied potentials. The current amplitudes I F1, I F2, and I M used for each data point were obtained in the same patch clamp experiment. Solid circles represent I F1/I M and open circles I F2/I M. Dashed lines indicate the mean ratios assuming no voltage dependence (0.27 for I F1/I M and 0.78 for I F2/I M). Most of the error in the ratios came from the fitting of the channel current amplitude histogram with the Gaussian functions. (C) Voltage dependence of the relative occupation probability of the flicker channel states P F2/P F1. Each type of open symbol (squares, triangles, circles, and diamonds) represents a series of data points obtained from the same single-channel patch. Filled circles are data points each from an individual patch at only one voltage. The straight line is the theoretical fit assuming that the occupation probability follows a Boltzmann distribution. The larger error in the data points for 20 mV is due to difficulty in fitting the Gaussian function to the scarce F2 state.
where s represents the states C, F1, and F2 (Root and MacKinnon, 1994), and Ws are the relative weights of the Gaussian functions. The mean current level for state s was taken to be the peak current value is of the corresponding Gaussian function. The channel current amplitude I F1 for state F1 is then (i F1 − i C), and I F2 for state F2 is (i F2 − i C). The ratio of the areas under the F1 and F2 Gaussian curves: (W F2 σF2)/(W F1 σF1) was used as the relative occupational probability P F2/P F1 of the flickering states F1 and F2 during the bursts of channel activity. The deviation of the current amplitude histogram from the theoretical fit between i F1 and i F2 in Fig. 12 A was an artifact caused by filtering and was reduced by raising the filtering frequency. However, the relevant features of the theoretical fit, i.e., the ratio between the areas of the F1 and F2 Gaussian peaks (W F2 σF2)/(W F1 σF1) and the location of the Gaussian peaks i C, i F1, and i F2 were not significantly affected by the filtering frequency (between 1 and 5 kHz).
The current amplitude ratios I F1/I M = 0.27 ± 0.01 and I F2/I M = 0.78 ± 0.01 (I M was determined from current amplitude histograms of channels in the normal mode) showed no systematic voltage dependence (Fig. 12 B). Since state M of the channel in the normal kinetic mode had a nonlinear I-V relation (Fig. 1 A), the I-V relation for the flicker mode must also follow the same nonlinear relation over the observed voltage range. This result further confirms that the channel activity in the flicker mode was generated by the IP3R.
The relative occupation probability of the flicker states P F2/P F1 exhibited a voltage dependence (Fig. 12 C), which could be fitted theoretically by a Boltzmann distribution P F2/P F1 ∝ exp(z e V app/kT) with z = 1.33 ± 0.05 corresponding to an equivalent of 1.33 electron charges moving across the entire applied transmembrane electric field when the channel changes from the configuration of state F1 to that of state F2. An increase of 19.5 ± 0.7 mV in V app will cause an e-fold increase in P F2/P F1. The voltage range of our analyzed data was restricted at high V app by the occurrence of long inter-burst quiescent periods, which limited the amount of data that could be obtained, and at low V app due to the difficulty of resolving the F1 and C.
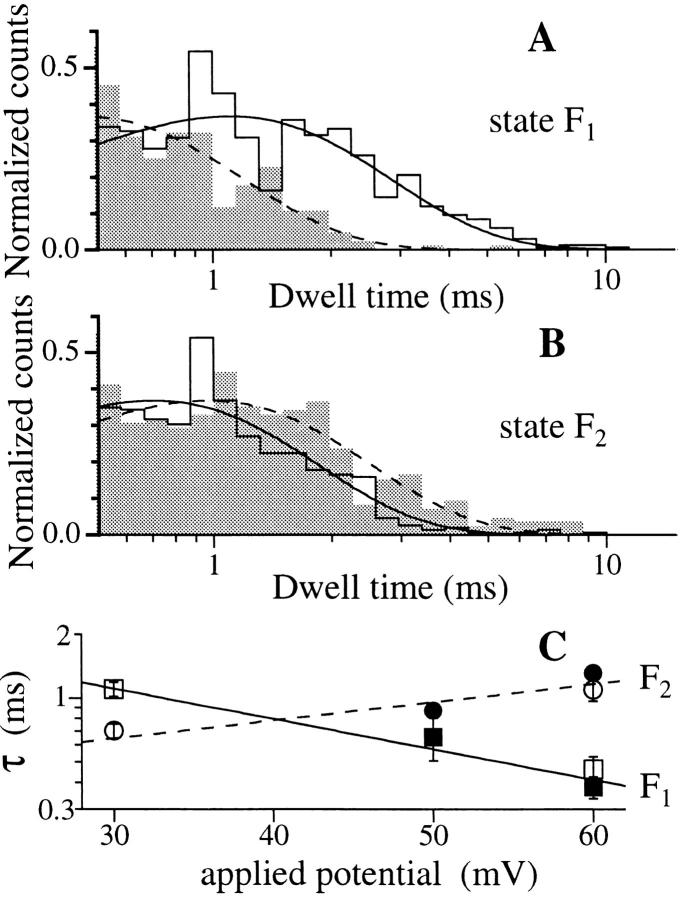
The applied potential affected the dwell time distributions of both flicker states. Increasing V app shortened the mean dwell time of F1 (Fig. 13 A) while lengthening that of F2 (Fig. 13 B). Only one exponential component was resolved for each flicker state. Thus, in the simplest model, the channel has one kinetic state corresponding to F1 and one corresponding to F2. The channel passes through an activated state F* during the transition between F1 and F2. Since the F1 ′ F2 transitions are the predominant transitions (>95%) involving the flicker states, by the Arrhenius theory, the time constant τF1 of state F1 ∝ exp[(− z e d 1 V app)/kT], where (z e d 1 V app) is the voltage-dependent part of the activation energy of the F1 → F2 transition, and d 1 V app is the fraction of the membrane potential that the charge z e experiences when the channel configuration changes from F1 to F*. Similarly, τF2 ∝ exp[(z e d 2 V app)/kT]. Assuming that the value of 1.33 for z deduced from P F2/P F1 is the same as the ones for F1 → F* and F* → F2, the voltage dependence of the time constants of the flickering states (Fig. 13 C) gave d 1 = 0.64 ± 0.07 and d 2 = 0.38 ± 0.07.
Figure 13.
Effect of applied potential on the dwell time distributions of the flicker states F1 and F2. In A and B, V app = 30 mV for the unfilled histograms, and the solid curves are the theoretical probability density functions each with one exponential component fitted using the maximum likelihood method (Sigworth and Sine, 1987). V app = 60 mV for the shaded histograms and the dashed curves are their fitted single-exponential probability density functions. The transition counts were normalized so that the peaks of the fitted probability density functions have the same height. There are 784 and 209 transitions for 30 and 60 mV, respectively, in A; and 543 and 380 transitions for 30 and 60 mV, respectively, for B. Analysis was done on data digitized at 12.5 kHz and filtered at 2 kHz using pClamp 6.0.2. (C) is the graph of the time constants τ of the theoretical probability density functions fitted to the dwell time histograms of the flicker states under various applied potentials. Squares are time constants for F1 and circles are for F2. Open and filled symbols are from two different experiments. The lines are theoretical time constant values fitted according to the Arrhenius theory.
discussion
The Conductance States of IP3R
The Xenopus IP3R ion channel is a multi-conductance cation channel in its native membrane environment, possessing at least four, and possibly five open-channel conductance states. A predominant state M was ∼113 pS at low voltages (between ± 20 mV) in the presence of 140 mM K+. The conductance of state M is twice that of a state H within experimental error (Mak and Fos-kett, 1994). Whether current level D actually represents a separate conductance state of the IP3R cannot be determined conclusively at present. Our analysis indicates an apparent association or cooperativity between levels D and M, but these features may indicate either that D is a true sub-state or a reflection of interactions between two IP3R, each with state M only. Such interactions between IP3R channels may also exist in multi-channel clusters. Conductance states L and S (∼150 pS and 80 pS between ± 20 mV, respectively) were also detected in the current studies. A previous study using similar conditions (Stehno-Bittel et al., 1995) reported four states with conductances of 244 pS, 172 pS, 126 pS, and 90 pS, the 172 pS state being predominant. Assuming that this 172 pS state is the one we term M, the relative conductances of the other states compared to the predominant one are: 1.42, 0.73, and 0.52, respectively. These values agree reasonably well with the conductances of the states L, S, and H relative to state M in our studies, suggesting that the larger conductances reported by Stehno-Bittel et al. (1995) may be explained by their failure to observe and take into account the non-linear behavior of the I-V relation (Fig. 1). Four equally spaced conductance states of the mammalian type 1 receptor have been observed in reconstitution experiments (Watras et al., 1991). Considering the relative conductances of those states, it is possible that the first, second, and fourth level observed in the reconstitution experiments represent states H, M, and D in our experiments. However, reconstituted IP3R occupied the first, second, and third conductance states with similar frequencies (29, 35, and 35%), whereas the fourth state was rarely observed (1%) (Watras et al., 1991). In its native membrane environment in our experiments, state H was rarely observed and no state corresponding to the third state was observed (Mak and Foskett, 1994 and present data).
Kinetic Features of the IP3R
Kinetic analysis of the open (M) and closed (C) states dwell-time distributions of IP3R reveals at least two kinetic states for M with τ of <5 and ∼20 ms, respectively; and at least three kinetic states for C with τ of ∼1 and ∼10 ms and >1 s, respectively. The long open kinetic state (τ ∼20 ms) observed in the present study is longer and occurred more frequently than previously reported (Mak and Foskett, 1994). Its time constant is also considerably longer than that observed for the reconstituted IP3R (Watras et al., 1991), although it is similar to that observed for the reconstituted ryanodine receptor (20 ms; Smith et al., 1986). This latter point suggests that it may not be possible to generalize (Bezprozvanny and Ehrlich, 1994) about the physiological importance of different kinetic behaviors of the two channels in cells which express both ryanodine receptors and IP3R. The reasons for the marked kinetic differences of the channel gating we previously observed compared with those reported here are unknown. ATP in mM concentrations affects the open probability of the reconstituted IP3R (Bezprozvanny and Ehrlich, 1993; Missiaen et al., 1994). The experiments described in our previous report were performed in BONS in the absence of MgATP whereas most experiments in the present study were performed in the presence of 1 mM MgATP. Nevertheless, this variable is unlikely to account for the kinetic changes since similar channel kinetics, including high P o and long open duration, were also observed when we removed MgATP from our solution (unpublished data). To identify any possible effect on channel kinetics of the BAPTA (Richardson and Taylor, 1993; Combettes et al., 1994) experiments were performed in symmetrical low BAPTA solution (0.1 mM BAPTA, n > 20) or EGTA-buffered solution (75 μM EGTA, n = 8) (data not shown). No substantial differences were observed in the I-V relation, Po distribution, open and closed state kinetics, or inactivation of the channel. The IP3R channel kinetics may depend on factors, such as redox (Kaplin et al., 1994) or phosphorylation (Taylor and Richardson, 1991; Joseph, 1995) states of the receptor, not adequately controlled between our previous and current experiments.
A high potential on the cytoplasmic side of the channel increased both the relative frequency of occurrence of the long closed kinetic state and its mean dwell time. Both voltage effects decrease the mean P o of the channel at high cytoplasmic potentials. This voltage dependence is consistent with that exhibited by reconstituted cerebellar IP3R in bilayers (Watras et al., 1991), IP3-sensitive channels in beet vacuole (Alexandre et al., 1990), and the ryanodine receptor (Percival et al., 1994). In contrast, Stehno-Bittel et al. (1995) reported that the Xenopus IP3R exhibited a higher P o under more positive cytoplasmic potentials. We have no explanation for this discrepancy. With K+, Na+, and Cl− ions distributed evenly on either side, as determined by electron probe x-ray study, there is probably little potential difference across the sarcoplasmic reticulum membrane (Somlyo et al., 1977). If the ionic distribution and transmembrane potential of the ER are similar, the voltage dependence of the IP3R detected here may not have physiological significance. However, without independent measurements of the ER membrane potential, it remains possible that steady-state transmembrane voltages or transient shifts of membrane potential due to gating of ER membrane ion conductances, for example during activation of the IP3R, do exist and influence IP3R kinetic properties and P o. In any case, the voltage sensitivities may provide insights into the gating mechanisms observed under low-voltage conditions.
The P o of IP3R measured in our experiments is significantly higher than the maximum values previously reported for single-channel measurement of IP3R either in the nuclear membrane of oocytes (Mak and Foskett, 1994, P o ∼ 0.1; Stehno-Bittel et al., 1995, P o < 0.3) or reconstituted in lipid bilayers from isolated vesicles (Bezprozvanny et al., 1991; Watras et al., 1991; Bezprozvanny and Ehrlich, 1993, 1994; P o ∼ 0.1) or purified protein (Mayrleitner et al., 1995; P o < 0.3). In some current records in the present study, P o remained close to 1.0 for seconds or even tens of seconds (Fig. 3). This observation demonstrates that the P o of the IP3R can switch from 0 in the absence of agonist to nearly unity when IP3 binds, under suitable conditions. This all-or-none behavior would enable the IP3R to mediate a rapid flux of Ca2+ out of intracellular Ca2+ stores, and thus it may contribute to the sharp rapid rise in cytoplasmic Ca2+ concentration observed in cells in response to IP3-generating stimuli (Miyazaki, 1988; Meyer et al., 1990; Finch et al., 1991; Parker et al., 1996). The combined influences of the IP3R channels' high conductance and P o may be expected to result in high concentrations of Ca2+ in the immediate vicinity of the cytoplasmic face of even a single channel. Elevated levels of cytoplasmic Ca2+ concentration may inhibit Ca2+ flux through the IP3R (Bezprozvanny et al., 1991; Marshall and Taylor, 1993; our unpublished observations). However, it is very unlikely that the long quiescent intervals corresponding to Clong reflect negative Ca2+ feedback on the channel. Since [Ca2+] was buffered at 200 nM in the pipette and bathing solutions, the amount of Ca2+ flux through the channel in the present experiments was small, particularly with positive potentials on the cytoplasmic side. It is unlikely therefore that any significant elevations in [Ca2+] occurred adjacent to the cytoplasmic side of the channel in our studies. Thus, the kinetic behavior of the IP3R, at least in response to high IP3 concentrations, is predicted to result in complex local cytoplasmic [Ca2+] signals by virtue of both feedback by [Ca2+] as well as intrinsic gating behavior of the channel.
Inactivation of IP3R
An apparent inactivation of the IP3R was consistently observed in our experiments. The channel activity disappeared with a time constant of ∼30 s, in the continuous presence of IP3 in the micropipette, and in the absence of local change in [Ca2+] (as discussed above). Some (10%) channel disappearances could be reversed by an increase in the applied potential. In those cases, the channels must have entered a true inactivated state (IVdep), remaining functionally intact inside the membrane patch. However, the majority of the channels, once inactivated, could not be reactivated during the course of the experiment. Since inactivation was not reported for IP3R reconstituted in lipid bilayers (Ehrlich and Watras, 1988; Bezprozvanny et al., 1991; Mayrleitner et al., 1991; Watras et al., 1991; Bezprozvanny and Ehrlich, 1994; Mayrleitner et al., 1995), it is possible that the irreversible disappearance of channel activity we observed is an artifact (run-down) caused by the isolation of IP3R in the special environment of the patched membrane. However, neither non-IP3R channels observed in our experiments (data not shown) nor the cystic fibrosis transmembrane conductance regulator C1− channel observed by similar patch clamping of isolated mammalian nuclei (Pasyk and Foskett, 1995) exhibited this behavior. Furthermore, recent patch-clamp measurements of purified IP3R (Thrower et al., 1996) using the “tip-dip” technique (Coronado and La-torre, 1983) revealed no rapid disappearance of IP3R activity in lipid bilayer patches isolated on micropipette tips (Thrower, E., and A.P. Dawson, personal communication). Thus, by itself, the membrane environment in a patch clamp experiment appears to be insufficient to cause the disappearance of IP3R channel activity we observe. In permeabilized hepatocytes, inactivation of Mn2+ fluxes through the IP3R in the ER in the continuous presence of IP3 was observed (Hajnóczky and Thomas, 1994) which had a time constant comparable to that measured for the disappearance of IP3R channel activity in our experiments. Therefore, it seems most likely that the irreversible disappearance of channel activity observed in our experiments is caused by the IP3R channels entering a true inactivated state (Iirr) from which they cannot exit in the presence of a constant concentration of IP3. This inactivated state Iirr may correspond to an inactive, high IP3-affinity state (Piétri et al., 1990; Hilly et al., 1993; Watras et al., 1994) into which the IP3R converts after prolonged exposure to IP3R even in the presence of low [Ca2+] (Coquil et al., 1996). The reported time course for this conversion in isolated sheep cerebellar microsomes (t 1/2 = 20 s at 20°C) is similar to that for channel inactivation seen in our experiments.
The time constant of channel inactivation (∼30 s) is too slow to be responsible for the rapid decline of IP3-stimulated Ca2+ release, observed in oocytes (Parker et al., 1996) and other cell types (Meyer and Stryer, 1991), which may be due to inhibition of IP3R by high local cytoplasmic [Ca2+] generated by the opening of the IP3R (Parker and Ivorra, 1990). However, the Ca2+-independent inactivation we observed may be involved in suppressing the reopening of the IP3R as the local [Ca2+] decreases (Hajnóczky and Thomas, 1994), thus allowing the full dissipation of one [Ca2+] spike before the next cycle of [Ca2+] oscillation (Jacob et al., 1988; Wakui et al., 1989; Parker and Yao, 1991). Further experimentation will be required to determine whether the decline in channel activity we observed is due to true inactivation involving an inactivated state Iirr of the channel rather than run-down, and to define the mechanisms which enable the receptor to escape from this inactivated state.
Spatial Distribution of IP3R
Of 740 membrane patches tested, only 102 showed characteristic IP3R channel activity. It is unlikely that the low P d was caused by formation of membrane vesicles at the tips of the micropipettes (Hamill et al., 1981) because 150 of our patches exhibited other ion channel activities. Of these, 22 showed IP3R activities as well, giving a similar P d (= 0.15) compared with all 740 patches.
We monitored the spatial distribution of functional IP3R by patch clamping over a wide area of the nuclear envelope and mapping the sites of channel activity. Based on this functional readout, we detected groupings of IP3R in two different spatial scales. The high frequency of obtaining membrane patches containing multiple IP3R channels (>8 in some cases), despite the low overall P d, suggests that the IP3R tends to aggregate into clusters (Fig. 3). However, in 26 of 59 patches with more than two current levels, attempts to repeatedly patch the same location failed to yield additional patches containing IP3R channels. Thus, these “micro” IP3R clusters are probably limited to less than 2 μm in diameter. Transient localized increases of cytoplasmic [Ca2+] imaged in the vicinity of the ER just beneath the plasma membrane of intact Xenopus oocytes (Parker and Yao, 1991; Yao et al., 1995) may also be consistent with a patchy distribution of IP3R in clusters. If these “puffs” were caused by the release of Ca2+ from the ER by the opening of IP3R, the Ca2+ current associated with one such Ca2+ “puff” is estimated to be ∼11 to 23 pA (Yao et al., 1995). With the Ca2+ current through unitary IP3R under physiological conditions estimated to be ∼0.5 pA (Bezprozvanny and Ehrlich, 1994), a Ca2+ puff would therefore be generated by the cooperative opening of a cluster of IP3R channels. Because of the considerable uncertainties in estimating variables like endogenous Ca2+ buffering capacity of the oocyte cytoplasm and the intralumenal free [Ca2+] in the ER, which were used in computing Ca2+ currents associated with a Ca2+ puff and a single IP3R channel, the number of IP3R channels that form a single Ca2+ release site in the oocyte ER may not be significantly different from the maximum number of IP3R channels (∼8) we observed in our multi-channel patches. The recent observations of Ca2+ “blips” with amplitudes approximately one-fifth or less of those of “puffs” and their interpretation as representations of unitary IP3R Ca2+ currents (Parker and Yao, 1996) is consistent with our observations of membrane patches with one to over eight IP3R channels, and therefore suggests a similar organization of IP3R in the nuclear envelope and ER in oocytes.
Besides the microscopic IP3R clusters, our experimental results suggest that, at least in some oocyte nuclei, there can also exist a large-scale heterogeneous distribution of functional IP3R with active areas that may extend over several or even tens of micrometers. In such “macro” clusters, membrane patches containing IP3R channels, frequently multiple channels, could be repeatedly obtained with P d close to 1. The grouping of IP3R into such “hot regions” is reminiscent of the self-organization into large-scale arrays of the ryano-dine receptor (Takekura et al., 1995), the Ca2+ channel in muscle cells which has partial sequence homology with the IP3R (Mignery et al., 1989). However, it is possible that the IP3R in the outer nuclear membrane is actually randomly distributed with a high density, but rarely functional except in the active regions. The IP3R has been immunolocalized in the nuclear envelope of Xenopus oocytes (Parys et al., 1992; Kume et al., 1993; Callamaras and Parker, 1994; Parys et al., 1994; Stehno-Bittel et al., 1995), but the resolution was insufficient to discern uneven IP3R distribution.
By demonstrating IP3R channel clustering, our results support the suggestion that heterogeneity of IP3R channel density among Ca2+ stores (Hirose and Iino, 1994) could contribute to the increment detection mechanism observed for Ca2+ mobilization by IP3 (Mual-lem et al., 1989; Meyer and Stryer, 1990; Taylor and Potter, 1990). Two mechanisms, the Ca2+-independent inactivation of IP3R in the continuous presence of a supramaximal concentration of IP3 (present data; Hajnóczky and Thomas, 1994) and the inhibition of Ca2+ release by elevated cytoplasmic [Ca2+] (Bezprozvanny et al., 1991; Iino and Endo, 1992; Marshall and Taylor, 1993), might limit the amount of Ca2+ that can be released from a Ca2+ store before the store is depleted, depending upon the kinetics of inactivation and the magnitude of the Ca2+ fluxes. A heterogeneous distribution of IP3R, as our observations suggest, may provide a mechanism to control the magnitude of the Ca2+ fluxes among different Ca2+ stores in various parts of the cell. For example, when exposed to a submaximal concentration of IP3, only those stores containing a sufficiently high density of IP3R will empty before the channels inactivate. Conversely, stores with a low channel density will only be partially emptied, and therefore able to release more Ca2+ when the IP3R channels are activated again. The delay of IP3R inactivation in regions with high channel density (Fig. 10) might generate a non-linear relationship between channel density and the amount of Ca2+ released, providing an amplification mechanism which could increase the number of “quantal” levels and therefore enable finer tuning of increment detection. Thus, the intrinsic inactivation mechanisms of the IP3R, together with channel clustering, may provide a mechanism to generate quantal release of Ca2+ without requiring a dependence of Ca2+ release on luminal [Ca2+] or heterogeneous sensitivity of the IP3R for IP3 (Bootman, 1994).
Voltage-dependent Behavior of the IP3R
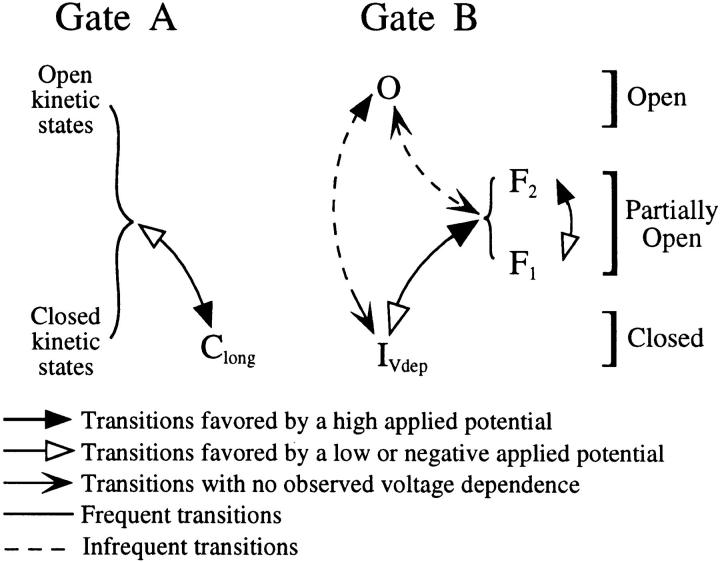
Our investigations have revealed a complex pattern of voltage dependencies of the gating activities of the IP3R channel. First, in either the normal or flicker modes, an increase in V app decreased the average open probability by increasing both the frequency and duration of long channel closures. Second, an increase in V app when the channel was in the flicker mode favored occupancy of F2 over F1 by simultaneously increasing the average dwell time of F2 and decreasing that of F1. Finally, the channel in either mode could be reactivated from an inactive state IVdep by an increase in V app. To provide a framework for integrating these complex voltage- dependent gating behaviors, we developed the following simple model for channel gating (Fig. 14).
Figure 14.
Schematic diagram of the double-gate model, showing transitions, especially voltage-dependent ones, between various kinetic states for the two gates controlling the kinetic behavior of the IP3R channel.
The model assumes, first, that channel opening in both the normal and flicker modes is controlled by the same mechanism (Fig. 9, gate A). This assumption is supported by the observations that (a) the dwell time distribution for the closed state (C) of the IP3R channel in the normal mode is similar to that of the inter-burst quiescent periods in the flicker mode, with the same voltage dependence; and (b) the dwell time distribution for the main state (M) of the normal mode is similar to that for the bursts in the flicker mode. Second, the model assumes that flicker activity is generated by a separate and independent mechanism (Fig. 9, gate B) in series with gate A. The channel is closed when either gate is closed, and is open only when both gates are open (completely or partially). In the normal mode, gate B is in a completely open kinetic state (O) and the channel gating is determined entirely by gate A. Gate A has at least two open and at least three closed kinetic states, as revealed by dwell time analysis of the channel in normal mode. The precise transition scheme among these kinetic states has yet to be determined. Only the transition into and out of the long closed kinetic state Clong is voltage dependent. A high V app increases the rate of transition into state Clong and decreases the rate of transition out of it, thus increasing both the frequency and duration of the long quiescent periods in the normal mode, and the inter-burst periods in the flicker mode.
In this scheme, the channel exhibits flicker behavior when gate B leaves the completely open state O and enters two partially open states, with different conductances corresponding to the F1 and F2 states. Transitions between F1 and F2 are rapid, involving a relatively low activation energy barrier and, therefore, causing the flickering characteristics, as well as voltage dependent, with a high V app increasing the rate of transition F1 → F2 and decreasing the rate of F2 → F1.
Because most of the channels entered the flicker mode after being reactivated by an increase in V app from the inactive state IVdep (n = 13 out of 17 reactivations), the model includes IVdep as a kinetic state of gate B, with an increase in V app favoring the transition of IVdep into F1 and F2 (Fig. 14). This model predicts that a decrease in V app will cause the gate to enter the inactive state IVdep, which agrees with the observations that (a) the channel was never detected in the flicker mode under negative V app; and (b) when the channel was in the flicker mode, a change of V app from positive to negative closed the channel completely until V app was reversed to positive again.
In this model, gate B is usually in state O since the channel is usually observed in the normal mode. Thus, state O of gate B must be kinetically stable. This stability inhibits gate B from closing readily from O to IVdep under negative V app, even though IVdep may be energetically more favorable under negative V app. Thus, unlike in the flicker mode, the channel in the normal mode could be observed under negative V app, with gate B staying in state O.
The model is obviously incomplete. The rarity of conductance states H, S, and L prevents their incorporation into the model, and since the evidence for current level D being a real state of IP3R is not conclusive, that current level was also left out. It is also unclear how the irreversible inactivated state Iirr fits into the model. The fact that the channel activity duration histogram could be fitted with a single exponential component suggests that there is probably one major inactivation pathway to one kinetic state Iirr, which could in principle be caused by the irreversible closing of either gate A or gate B, or could involve an independent gating mechanism. Nevertheless, the two-gate model proposed here can account for much of the single-channel gating behavior of the IP3R we observed, especially those with voltage dependence. Therefore, it provides a framework for developing hypotheses for future experiments.
Along those lines, what might be the nature of gates A and B? IP3R gating in the normal kinetic mode has been observed in native membranes (Mak and Foskett, 1994; present results; Stehno-Bittel et al., 1995), or in artificial lipid bilayers (Ehrlich and Watras, 1988; Bezprozvanny et al., 1991, 1994; Mayrleitner et al., 1991, 1995; Watras et al., 1991; Bezprozvanny and Ehrlich, 1993, 1994), although the kinetic properties observed differed, possibly because of environmental factors. Thus, we speculate that gate A is intrinsic to the channel, with the various closed and main kinetic states corresponding to different conformations of the IP3R molecule. In contrast, those states involving gate B, i.e., F1, F2, and IVdep, have been observed only in our experiments, with the IP3R relatively unperturbed in its native membrane environment. Therefore, it is possible that gate B reflects an accessory molecule associated with the IP3R molecule which is lost during reconstitution. It is interesting to note that the flicker kinetics of the IP3R channel are reminiscent of the ion and drug- induced flickering blocks in other channels (Neher and Steinbach, 1978; Fukushima, 1982). Recent results support the notion that accessory molecules might contribute to the kinetic behavior of intracellular Ca2+ release channels. Both the ryanodine receptor (Jayaraman et al., 1992; Timerman et al., 1996) and IP3R (Cameron et al., 1995) are associated stoichiometrically with FKBP12, a ubiquitous 12-kD protein. FKBP12 binding to the ryanodine receptor is associated with marked changes in the gating properties of the channel (Ahern et al., 1994; Chen et al., 1994; Ma et al., 1995) which may reflect, under some conditions, the kinetics of FKBP12 moving into and out of the channel pore under the influence of trans-membrane electric field (Ma et al., 1995). By analogy, FKBP12 or another protein may be an accessory molecule that constitutes gate B in our model, a hypothesis which will require further investigation.
Acknowledgments
We thank Dr. Peter Drain, Dr. Paul DeWeer and Shawn Wilcox for comments on the manuscript.
Supported by grants from the Medical Research Council of Canada, the NIH and the Cystic Fibrosis Foundation.
Footnotes
Abbreviations used in this paper: BAPTA, 1,2-bis(O -aminophen-oxy)ethane-N,N,N′,N′-tetraacetic acid; BONS, basic oocyte nucleus solution; ER, endoplasmic reticulum; IP3, inositol 1,4,5-trisphosphate; IP3R, IP3 receptor.
references
- Ahern, G.P., P.R. Junankar, and A.F. Dulhunty. Single channel activity of the ryanodine receptor calcium release channel is modulated by FK-506. FEBS (Fed. Eur. Biochem. Soc.) Lett. 352:369–374. [DOI] [PubMed]
- Alexandre J, Lassalles JP, Kado RT. Opening of Ca2+channels in isolated red beet root vacuole membrane by inositol 1,4,5-trisphosphate. Nature (Lond) 1990;343:567–570. [Google Scholar]
- Berridge MJ. Inositol trisphosphate and calcium signaling. Nature (Lond) 1993;361:315–325. doi: 10.1038/361315a0. [DOI] [PubMed] [Google Scholar]
- Bezprozvanny I, Bezprozvannaya S, Ehrlich BE. Caffeine-induced inhibition of inositol(1,4,5)-trisphosphate-gated calcium channels from cerebellum. Mol Biol Cell. 1994;5:97–103. doi: 10.1091/mbc.5.1.97. [DOI] [PMC free article] [PubMed] [Google Scholar]
- Bezprozvanny I, Ehrlich BE. ATP modulates the function of inositol 1,4,5-trisphosphate-gated channels at two sites. Neuron. 1993;10:1175–1184. doi: 10.1016/0896-6273(93)90065-y. [DOI] [PubMed] [Google Scholar]
- Bezprozvanny I, Ehrlich BE. Inositol (1,4,5)-trisphosphate (InsP3)-gated Ca channels from cerebellum: conduction properties for divalent cations and regulation by intraluminal calcium. J Gen Physiol. 1994;104:821–856. doi: 10.1085/jgp.104.5.821. [DOI] [PMC free article] [PubMed] [Google Scholar]
- Bezprozvanny I, Watras J, Ehrlich BE. Bell-shaped calcium-response curves of Ins(1,4,5)P3- and calcium-gated channels from endoplasmic reticulum of cerebellum. Nature (Lond) 1991;351:751–754. doi: 10.1038/351751a0. [DOI] [PubMed] [Google Scholar]
- Bootman MD. Quantal Ca2+ release from InsP3-sensitive intracellular stores. Mol Cell Endocrinol. 1994;98:157–166. doi: 10.1016/0303-7207(94)90134-1. [DOI] [PubMed] [Google Scholar]
- Bustamante JO. Nuclear ion channels in cardiac myocytes. Pflügers Arch. 1992;421:473–485. doi: 10.1007/BF00370259. [DOI] [PubMed] [Google Scholar]
- Bustamante JO. Restricted ion flow at the nuclear envelope of cardiac myocytes. Biophys J. 1993;64:1735–1749. doi: 10.1016/S0006-3495(93)81545-5. [DOI] [PMC free article] [PubMed] [Google Scholar]
- Bustamante JO. Open states of nuclear envelope ion channels in cardiac myocytes. J Membr Biol. 1994;138:77–89. doi: 10.1007/BF00211071. [DOI] [PubMed] [Google Scholar]
- Callamaras N, Parker I. Inositol 1,4,5-trisphosphate receptors in Xenopus laevis oocytes: localization and modulation by Ca2+ . Cell Calcium. 1994;15:66–78. doi: 10.1016/0143-4160(94)90105-8. [DOI] [PubMed] [Google Scholar]
- Cameron AM, Steiner JP, Sabatini DM, Kaplan AJ, Walensky LD, Snyder SH. Immunophilin FK506 binding protein associated with inositol 1,4,5-trisphosphate receptor modulates calcium flux. Proc Natl Acad Sci USA. 1995;92:1784–1788. doi: 10.1073/pnas.92.5.1784. [DOI] [PMC free article] [PubMed] [Google Scholar]
- Chen SRW, Zhang L, MacLennan DH. Assymmetrical blockage of the Ca2+release channel (ryanodine receptor) by 12-kDa FK506 binding protein. Proc Natl Acad Sci USA. 1994;91:11953–11957. doi: 10.1073/pnas.91.25.11953. [DOI] [PMC free article] [PubMed] [Google Scholar]
- Colquhoun, D., and F.J. Sigworth. 1995. Fitting and statistical analysis of single-channel records. In Single-Channel Recording. 2nd edition. B. Sakmann and E. Neher, editors. Plenum Press, New York. 483–588.
- Coquil J-F, Mauger J-P, Claret M. Inositol 1,4,5-trisphosphate slowly converts its receptor to a state of higher affinity in sheep cerebellum membranes. J Biol Chem. 1996;271:3568–3574. doi: 10.1074/jbc.271.7.3568. [DOI] [PubMed] [Google Scholar]
- Coronado R, Latorre R. Phospholipid bilayers made from monolayers on patch-clamp pipettes. Biophys J. 1983;43:231–236. doi: 10.1016/S0006-3495(83)84343-4. [DOI] [PMC free article] [PubMed] [Google Scholar]
- Dingwall C, Laskey R. The nuclear membrane. Science (Wash DC) 1992;258:942–947. doi: 10.1126/science.1439805. [DOI] [PubMed] [Google Scholar]
- Ehrlich BE, Watras J. Inositol 1,4,5-trisphosphate activates a channel from smooth muscle sarcoplasmic reticulum. Nature (Lond) 1988;336:583–586. doi: 10.1038/336583a0. [DOI] [PubMed] [Google Scholar]
- Finch EA, Turner TJ, Goldin SM. Calcium as a coagonist of inositol 1,4,5-trisphosphate-induced calcium release. Science (Wash DC) 1991;252:443–446. doi: 10.1126/science.2017683. [DOI] [PubMed] [Google Scholar]
- Fukushima Y. Blocking kinetics of the anomalous potassium rectifier of tunicate egg studied by single channel recording. J Physiol (Lond) 1982;331:311–331. doi: 10.1113/jphysiol.1982.sp014374. [DOI] [PMC free article] [PubMed] [Google Scholar]
- Hajnóczky G, Thomas AP. The inositol trisphosphate calcium channel is inactivated by inositol trisphosphate. Nature (Lond) 1994;370:474–477. doi: 10.1038/370474a0. [DOI] [PubMed] [Google Scholar]
- Hamill OP, Marty A, Neher E, Sakmann B, Sigworth F. Improved patch-clamp techniques for high-resolution current recording from cells and cell-free membrane parches. Pflügers Arch. 1981;391:85–100. doi: 10.1007/BF00656997. [DOI] [PubMed] [Google Scholar]
- Hilly M, Piétri-Rouxel F, Coquil J-F, Guy M, Mauger J-P. Thiol reagents increase the affinity of the inositol 1,4,5-trisphosphate receptor. J Biol Chem. 1993;268:16488–16494. [PubMed] [Google Scholar]
- Hirose K, Iino M. Heterogeneity of channel density in inositol 1,4,5-trisphosphate-sensitive Ca2+stores. Nature (Lond) 1994;372:791–794. doi: 10.1038/372791a0. [DOI] [PubMed] [Google Scholar]
- Iino M, Endo M. Calcium-dependent immediate feedback control of inositol 1,4,5-trisphosphate-induced Ca2+release. Nature (Lond) 1992;360:76–78. doi: 10.1038/360076a0. [DOI] [PubMed] [Google Scholar]
- Jacob R, Merritt JE, Hallam TJ, Rink TJ. Repetitive spikes in cytoplasmic calcium evoked by histamine in human endothelial cells. Nature (Lond) 1988;335:40–45. doi: 10.1038/335040a0. [DOI] [PubMed] [Google Scholar]
- Jayaraman T, Brillantes A-M, Timerman AP, Fleischer S, Erdjument-Bromage H, Tempst P, Marks AR. FK506 binding protein associated with the calcium release channel (ryanodine receptor) J Biol Chem. 1992;267:9474–9477. [PubMed] [Google Scholar]
- Joseph SK. The inositol trisphosphate receptor family. Cell Signaling. 1996;8:1–7. doi: 10.1016/0898-6568(95)02012-8. [DOI] [PubMed] [Google Scholar]
- Kaplin AI, Ferris CD, Voglmaier SM, Snyder SH. Purified reconstituted inositol 1,4,5-trisphosphate receptors. Thiol reagents act directly on receptor protein. J Biol Chem. 1994;269:28972–28978. [PubMed] [Google Scholar]
- Kobrinsky E, Ondrias K, Marks AR. Expressed ryano-dine receptor can substitute for the inositol 1,4,5-trisphosphate receptor in Xenopus laevisoocytes during progesterone-induced maturation. Dev Biol. 1995;172:531–540. doi: 10.1006/dbio.1995.8058. [DOI] [PubMed] [Google Scholar]
- Kume S, Muto A, Aruga J, Nakagawa T, Michikawa T, Furuichi T, Nakade S, Okano H, Mikoshiba K. The Xenopus IP3 receptor: structure, function and localization in oocytes and eggs. . Cell. 1993;73:555–570. doi: 10.1016/0092-8674(93)90142-d. [DOI] [PubMed] [Google Scholar]
- Lin C, Hajnóczky G, Thomas AP. Propagation of cytosolic calcium waves into the nuclei of hepatocytes. Cell Calcium. 1994;16:247–258. doi: 10.1016/0143-4160(94)90088-4. [DOI] [PubMed] [Google Scholar]
- Ma J, Bhat MB, Zhao J. Rectification of skeletal muscle ryanodine receptor mediated by FK506 binding protein. Biophys J. 1995;69:2398–2404. doi: 10.1016/S0006-3495(95)80109-8. [DOI] [PMC free article] [PubMed] [Google Scholar]
- Mak DD, Foskett JK. Single-channel inositol 1,4,5-trisphosphate receptor currents revealed by patch clamp of isolated Xenopusoocyte nuclei. J Biol Chem. 1994;269:29375–29378. [PubMed] [Google Scholar]
- Matzke AJM, Behensky C, Weiger T, Matzke MA. A large conductance ion channel in the nuclear envelope of a higher plant cell. FEBS (Fed Eur Biochem Soc) Lett. 1992;302:81–85. doi: 10.1016/0014-5793(92)80290-w. [DOI] [PubMed] [Google Scholar]
- Mayrleitner M, Chadwick CC, Timerman AP, Fleischer S, Schindler H. Purified IP3 receptor from smooth muscle forms and IP3 gated and heparin sensitive Ca2+channel in planar bilayers. Cell Calcium. 1991;12:505–514. doi: 10.1016/0143-4160(91)90032-a. [DOI] [PubMed] [Google Scholar]
- Mayrleitner M, Schäfer R, Fleischer S. IP3 receptor purified from liver plasma membrane is an (1,4,5) IP3 activated and (1,3,4,5) IP4inhibited calcium permeable ion channel. Cell Calcium. 1995;17:141–153. doi: 10.1016/0143-4160(95)90083-7. [DOI] [PubMed] [Google Scholar]
- Mazzanti M, DeFelice LJ, Cohen J, Malter H. Ion channels in the nuclear envelope. Nature (Lond) 1990;343:764–767. doi: 10.1038/343764a0. [DOI] [PubMed] [Google Scholar]
- Mazzanti M, DeFelice LJ, Smith EF. Ion channels in murine nuclei during early development and in fully differentiated adult cells. J Membr Biol. 1991;121:189–198. doi: 10.1007/BF01870532. [DOI] [PubMed] [Google Scholar]
- Meyer T, Stryer L. Transient calcium release induced by successive increments of inositol-1,4,5-trisphosphate. Proc Natl Acad Sci USA. 1990;87:3841–3845. doi: 10.1073/pnas.87.10.3841. [DOI] [PMC free article] [PubMed] [Google Scholar]
- Meyer T, Stryer L. Calcium spiking. Annu Rev Biophys Biophys Chem. 1991;20:153–174. doi: 10.1146/annurev.bb.20.060191.001101. [DOI] [PubMed] [Google Scholar]
- Meyer T, Wensel T, Stryer L. Kinetics of calcium channel opening by inositol-1,4,5-trisphosphate receptor. Biochemistry. 1990;29:32–37. doi: 10.1021/bi00453a004. [DOI] [PubMed] [Google Scholar]
- Mignery GA, Newton CL, Archer BT, III, Südhof TC. Structure and expression of the rat inositol 1,4,5-trisphosphate receptor. J Biol Chem. 1990;265:12679–12685. [PubMed] [Google Scholar]
- Mignery GA, Südhof TC. The ligand binding site and transduction mechanism in the inositol-1,4,5-trisphosphate receptor. EMBO (Eur Mol Biol Organ) J. 1990;9:3893–3898. doi: 10.1002/j.1460-2075.1990.tb07609.x. [DOI] [PMC free article] [PubMed] [Google Scholar]
- Mignery GA, Südhof TC, Takei K, De Camilli P. Putative receptor for inositol-1,4,5-trisphosphate similar to ryano-dine receptor. Nature (Lond) 1989;342:192–195. doi: 10.1038/342192a0. [DOI] [PubMed] [Google Scholar]
- Mikoshiba K. Inositol 1,4,5-trisphosphate receptor. Trends Pharmacol Sci. 1993;14:86–89. doi: 10.1016/0165-6147(93)90069-v. [DOI] [PubMed] [Google Scholar]
- Missiaen L, Parys JB, de Smedt H, Himpens B, Casteels R. Inhibition of inositol trisphosphate-induced calcium release by caffeine is prevented by ATP. Biochem J. 1994;300:81–84. doi: 10.1042/bj3000081. [DOI] [PMC free article] [PubMed] [Google Scholar]
- Miyazaki S. Inositol 1,4,5-trisphosphate-induced calcium release and guanine nucleotide-binding protein-mediated periodic calcium rises in golden hamster eggs. J Cell Biol. 1988;106:345–353. doi: 10.1083/jcb.106.2.345. [DOI] [PMC free article] [PubMed] [Google Scholar]
- Muallem S, Pandol SJ, Beeker TG. Hormone-evoked calcium release from intracellular stores is a quantal process. J Biol Chem. 1989;264:205–212. [PubMed] [Google Scholar]
- Neher E, Steinbach JH. Local anaesthetics transiently block currents through single acetylcholine-receptor channels. J Physiol (Lond) 1978;277:153–176. doi: 10.1113/jphysiol.1978.sp012267. [DOI] [PMC free article] [PubMed] [Google Scholar]
- Parker I, Ivorra I. Inhibition by Ca2+ of inositol tris-phosphate-mediated liberation: A possible mechanism for oscillatory release of Ca2+ . Proc Natl Acad Sci USA. 1990;87:260–264. doi: 10.1073/pnas.87.1.260. [DOI] [PMC free article] [PubMed] [Google Scholar]
- Parker I, Yao Y. Regenerative release of calcium from functionally discrete subcellular stores by inositol trisphosphate. Proc Royal Soc B. 1991;246:269–274. doi: 10.1098/rspb.1991.0154. [DOI] [PubMed] [Google Scholar]
- Parker I, Yao Y, Ilyin V. Fast kinetics of calcium liberation induced in Xenopusoocytes by photoreleased inositol trisphosphate. Biophys J. 1996;70:222–237. doi: 10.1016/S0006-3495(96)79565-6. [DOI] [PMC free article] [PubMed] [Google Scholar]
- Parys JB, McPherson SM, Mathews L, Campbell KP, Longo FJ. Presence of inositol 1,4,5-trisphosphate receptor, calreticulin, and calsequestrin in eggs of sea urchins and Xenopus laevis. . Dev Biol. 1994;161:466–476. doi: 10.1006/dbio.1994.1045. [DOI] [PubMed] [Google Scholar]
- Parys JB, Sernett SW, DeLisle S, Snyder PM, Welsh MJ, Campbell KP. Isolation, characterization, and localization of the inositol 1,4,5-trisphosphate receptor protein in Xenopus laevis oocytes. . J Biol Chem. 1992;267:18776–18782. [PubMed] [Google Scholar]
- Pasyk EA, Foskett JK. Mutant (ΔF508) cystic fibrosis transmembrane conductance regulator Cl−channel is functional when retained in endoplasmic reticulum of mammalian cells. J Biol Chem. 1995;270:12347–12350. doi: 10.1074/jbc.270.21.12347. [DOI] [PubMed] [Google Scholar]
- Percival AL, Williams AJ, Kenyon JL, Brinsell MM, Airey JA, Sutko JL. Chicken skeletal muscle ryanidine receptor isoforms: ion channel properties. Biophys J. 1994;67:1834–1850. doi: 10.1016/S0006-3495(94)80665-4. [DOI] [PMC free article] [PubMed] [Google Scholar]
- Piétri F, Hilly M, Mauger J-P. Calcium mediates the interconversion between two states of the liver inositol 1,4,5-trisphosphate receptor. J Biol Chem. 1990;265:17478–17485. [PubMed] [Google Scholar]
- Putney JW, Jr G.St.J. Bird. The Inositol phosphate-calcium signaling system in nonexcitable cells. Endocr Rev. 1993;14:610–631. doi: 10.1210/edrv-14-5-610. [DOI] [PubMed] [Google Scholar]
- Root MJ, MacKinnon R. Two identical noninteracting sites in an ion channel revealed by proton transfer. Science (Wash DC) 1994;265:1852–1856. doi: 10.1126/science.7522344. [DOI] [PubMed] [Google Scholar]
- Sakmann, B., and E. Neher. 1995. Geometric parameters of pipettes and membrane patches. In Single-Channel Recording. 2nd edition. B. Sakmann and E. Neher, editors. Plenum Press, New York. 637–650.
- Sigworth FJ, Sine SM. Data transformations for improved display and fitting of single-channel dwell time histograms. Biophys J. 1987;52:1047–1054. doi: 10.1016/S0006-3495(87)83298-8. [DOI] [PMC free article] [PubMed] [Google Scholar]
- Smith J, Coronado R, Meissner G. Single-channel measurements of the calcium release channel from skeletal muscle sarcoplasmic reticulum. Activation by Ca2+ and ATP and modulation by Mg2+ . J Gen Physiol. 1986;88:573–588. doi: 10.1085/jgp.88.5.573. [DOI] [PMC free article] [PubMed] [Google Scholar]
- Smith, L.D., W. Xu, and R.L. Varnold. 1991. Oogenesis and oocyte isolation. In Methods in Cell Biology. Vol. 36 Xenopus laevis: Practical Uses in Cell and Molecular Biology. B.N. Kay and H.B. Peng, editors. Academic Press, San Diego. 45–61. [DOI] [PubMed]
- Somlyo AV, Shuman H, Somlyo AP. Elemental distribution in striated muscle and effects of hypertonicity: electron probe analysis of cryosections. J Cell Biol. 1977;74:828–857. doi: 10.1083/jcb.74.3.828. [DOI] [PMC free article] [PubMed] [Google Scholar]
- Stehno-Bittel L, Lückhoff A, Clapham DE. Calcium release from the nucleus by InsP3receptor channels. Neuron. 1995;14:163–167. doi: 10.1016/0896-6273(95)90250-3. [DOI] [PubMed] [Google Scholar]
- Supattapone S, Worley PF, Baraban JM, Snyder SH. Solubilization, purification and characterization of an inositol trisphosphate receptor. J Biol Chem. 1988;263:1530–1534. [PubMed] [Google Scholar]
- Tabares L, Mazzanti M, Clapham DE. Chloride channels in the nuclear membrane. J Membr Biol. 1991;123:49–54. doi: 10.1007/BF01993962. [DOI] [PubMed] [Google Scholar]
- Takekura H, Takeshima H, Nishimura S, Takahashi M, Tanabe T, Flockerzi V, Hofmann F, Franzini-Armstrong C. Co-expression in CHO cells of two muscle proteins involved in excitation-contraction coupling. J Muscle Res Cell Motility. 1995;16:465–480. doi: 10.1007/BF00126431. [DOI] [PubMed] [Google Scholar]
- Taylor CW, Potter BVL. The size of inositol 1,4,5-trisphosphate-sensitive Ca2+store depends on inositol 1,4,5-trisphosphate concentration. Biochem J. 1990;266:189–194. doi: 10.1042/bj2660189. [DOI] [PMC free article] [PubMed] [Google Scholar]
- Taylor CW, Richardson A. Structure and function of inositol trisphosphate receptors. Pharmac Ther. 1991;51:97–137. doi: 10.1016/0163-7258(91)90043-l. [DOI] [PubMed] [Google Scholar]
- Taylor CW, Traynor D. Calcium and inositol trisphosphate receptors. J Membr Biol. 1995;145:109–118. doi: 10.1007/BF00237369. [DOI] [PubMed] [Google Scholar]
- Timerman AP, Onoue H, Xin H-B, Barg S, Copello J, Wiederrecht G, Fleischer S. Selective binging of FKPB12.6 by the cardiac ryanodine receptor. J Biol Chem. 1996;271:20385–20391. doi: 10.1074/jbc.271.34.20385. [DOI] [PubMed] [Google Scholar]
- Thrower E, Duclohier H, Lea EJA, Molle G, Dawson AP. The inositol 1,4,5-trisphosphate-gated Ca2+channel: effect of the protein thiol reagent thimerosal on channel activity. Biochem J. 1996;318:61–66. doi: 10.1042/bj3180061. [DOI] [PMC free article] [PubMed] [Google Scholar]
- Wakui M, Potter BVL, Petersen OH. Pulsatile intracellular calcium release does not depend on fluctuations in inositol trisphosphate concentration. Nature (Lond) 1989;339:317–320. doi: 10.1038/339317a0. [DOI] [PubMed] [Google Scholar]
- Watras J, Bezprozvanny I, Ehrlich BE. Inositol 1,4,5-trisphosphate-gated channels in cerebellum: presence of multiple conductance states. J Neuroscience. 1991;11:3239–3245. doi: 10.1523/JNEUROSCI.11-10-03239.1991. [DOI] [PMC free article] [PubMed] [Google Scholar]
- Watras J, Moraru I, Costa DJ, Kindman LA. Two inositol 1,4,5-trisphosphate binding sites in rat basophilic leukemia cells: relationship between receptor occupancy and calcium release. Biochemistry. 1994;33:14359–14367. doi: 10.1021/bi00251a050. [DOI] [PubMed] [Google Scholar]
- Williams AJ. Ion conduction, and discrimination in the sarcoplasmic reticulum ryanodine receptor/calcium-release channel. J Muscle Res Cell Motility. 1992;13:7–26. doi: 10.1007/BF01738423. [DOI] [PubMed] [Google Scholar]
- Yamamoto-Hino M, Sugiyama T, Hikichi K, Mattei MG, Hasegawa K, Sekine S, Sakurada K, Miyawaki A, Furuichi T, Hasegawa M, Mikoshiba K. Cloning and characterization of human type 2 and type 3 inositol 1,4,5-trisphosphate receptors. Receptors and Channels. 1994;2:9–22. [PubMed] [Google Scholar]
- Yao Y, Choi J, Parker I. Quantal puffs of intracellular Ca2+ evoked by inositol trisphosphate in Xenopus oocytes. . J Physiol. 1995;482:533–553. doi: 10.1113/jphysiol.1995.sp020538. [DOI] [PMC free article] [PubMed] [Google Scholar]


