

Abstract
Slowing of relaxation is an important characteristic of skeletal muscle fatigue. The aim of the present study was to quantify the relative contribution of altered Ca2+ handling (calcium component) and factors down-stream to Ca2+ (cross-bridge component) to the slowing of relaxation in fatigued fibers of Xenopus and mouse. Two types of Xenopus fibers were used: easily fatigued, type 1 fibers and fatigue resistant, type 2 fibers. In these Xenopus fibers the free myoplasmic [Ca2+] ([Ca2+]i) was measured with indo-1, and the relaxation of Ca2+-derived force, constructed from tetanic [Ca2+]i records and in vivo [Ca2+]i-force curves, was analyzed. An alternative method was used in both Xenopus and mouse fibers: fibers were rapidly shortened during the initial phase of relaxation, and the time to the peak of force redevelopment was measured. These two methods gave similar results and showed proportional slowing of the calcium and cross-bridge components of relaxation in both fatigued type 1 and type 2 Xenopus fibers, whereas only the cross-bridge component was slowed in fatigued mouse fibers. Ca2+ removal from the myoplasm during relaxation was markedly less effective in Xenopus fibers as compared to mouse fibers. Fatigued Xenopus fibers displayed a reduced rate of sarcoplasmic reticulum Ca2+ uptake and increased sarcoplasmic reticulum Ca2+ leak. Some fibers were stretched at various times during relaxation. The resistance to these stretches was increased during fatigue, especially in Xenopus fibers, which indicates that longitudinal movements during relaxation had become less pronounced and this might contribute to the increased cross-bridge component of relaxation in fatigue. In conclusion, slowing of relaxation in fatigued Xenopus fibers is caused by impaired Ca2+ handling and altered cross-bridge kinetics, whereas the slowing in mouse fibers is only due to altered cross-bridge kinetics.
Keywords: [Ca2+]i-force relation, sarcoplasmic reticulum
introduction
Repeated activation of skeletal muscle causes fatigue which is characterized by reduced isometric force, reduced shortening velocity, and slowed relaxation (for recent reviews see Fitts, 1994; Allen et al., 1995). During normal locomotion the slowing of relaxation may be of great importance because slowed relaxation of antagonist muscles might counteract the desired movement during rapid, alternating movements (Josephson, 1993). The nervous system, of course, can compensate for this by shortening the period during which muscles are activated in each phase of the movement. However, this adjustment of the activation pattern will result in reduced power output during the desired movement.
Relaxation can be divided into two components: (a) Ca2+ removal from the myoplasm (calcium component) and (b) Ca2+ dissociation from troponin followed by cross-bridge detachment (cross-bridge component). Consequently, slowing of relaxation can be caused by slowing of one or both of these components. We have recently developed a method to separate the two components (Westerblad and Allen, 1993a ). This method involves construction of Ca2+-derived force records from measurements of the myoplasmic free [Ca2+] ([Ca2+]i) during tetani and the steady-state [Ca2+]i-force relation. The Ca2+-derived force records will represent a situation where force is responding instantly to changes in [Ca2+]i, i.e., without delays due to, for example, cross-bridge attachment and detachment. By comparing real and Ca2+-derived force it is possible to distinguish between the postulated calcium and cross-bridge components of the slowing of relaxation in fatigue. We have applied this method to intact, single fibers from a mouse toe muscle during fatigue produced by repeated, short tetani and found the slowing of relaxation to be caused by factors down-stream to Ca2+-handling; i.e., the cross-bridge component (Westerblad and Allen, 1993b ).
In the present study we used the Ca2+-derived force method to analyze the cause of the more profound slowing of relaxation observed during fatigue of fibers from Xenopus frogs. In addition, we used a method originally described by Ritchie (1954), on both Xenopus and mouse fibers: fibers were rapidly shortened during relaxation, and the time to the peak of force redevelopment was measured. If during fatigue [Ca2+]i remained high enough to maintain cross-bridge attachment for a longer time during relaxation (i.e., increased calcium component), we would expect a larger force redevelopment with the peak occurring later. If, on the other hand, the slowing is due to a slowing of the cross-bridge component, the peak of force redevelopment would be expected to occur at about the same time as under control conditions.
The two methods gave similar results and show that about half of the slowing of relaxation in Xenopus fibers can be ascribed to the calcium component and the other half to the cross-bridge component. In fatigued mouse fibers, on the other hand, all of the slowing seems to be due to the cross-bridge component. These results suggest that the Ca2+ removal from the myoplasm is less effective in Xenopus frog fibers as compared to mouse fibers and this suggestion was supported by analysis of the Ca2+ uptake into the sarcoplasmic reticulum (SR).1 The origin of the cross-bridge component is unclear, but in fatigue we observed an increased resistance to stretch during relaxation, especially in Xenopus fibers. This indicates that longitudinal movements during relaxation become less pronounced during fatigue and this might contribute to the cross-bridge component.
materials and methods
Adult, female Xenopus laevis were killed by stunning followed by decapitation. Single fibers were then dissected from the lumbrical muscles of the hindlimb following a procedure described elsewhere (Lännergren and Westerblad, 1986). Two fiber types with different fatigue resistance were used: easily fatigued fibers which are large and transparent (type 1) and fatigue-resistant fibers which are somewhat smaller and have a more granular appearance (type 2) (Westerblad and Lännergren, 1986). Fibers were stretched to the length giving maximum tetanic force (sarcomere length ∼2.3 μm) and stimulated by 350–400 ms trains of brief current pulses (0.5-ms duration, 1.2 × threshold) at 70 Hz. Under control conditions fibers were allowed to rest for at least 3 min between tetanic contractions. Fatigue was produced by initially producing tetani at a 4-s interval, and then the interval was gradually reduced until tetanic force was reduced to ∼40% of the control (Westerblad and Lännergren, 1986).
Male mice were killed by rapid neck disarticulation, and the flexor brevis muscle of the hindlimb was removed. Fiber dissection and mounting have been described elsewhere (Lännergren and Westerblad, 1987). Fibers were stretched to the length where maximum tetanic force was obtained (sarcomere length ∼2.4 μm). Stimulation and fatiguing protocol were as described for Xenopus fibers above, except that the tetanus duration was slightly shorter (330–350 ms).
All experiments were performed at room temperature (22°C). Xenopus fibers were bathed in a standard Ringer solution of the following composition (mM): NaCl, 115; KCl, 2.5; CaCl2, 1.8; Na-phosphate buffer, 3.0; pH = 7.0. During experiments mouse fibers were superfused by a standard Tyrode solution (mM): NaCl, 121; KCl, 5.0; CaCl2, 1.8; MgCl2, 0.5; NaH2PO4, 0.4; NaHCO3, 24.0; glucose, 5.5; EDTA, 0.1; 0.2% FCS was added to the solution. This solution was bubbled with 5% CO2 and 95% O2 which gives a pH of 7.3.
Values are presented as mean ± SEM; t tests were used to evaluate statistical significance and the significance level was set at 0.05.
Measurement of [Ca2+]i and Construction of Ca2+-derived Force Records
[Ca2+]i was only measured in Xenopus fibers. For this purpose the fluorescent Ca2+ indicator indo-1 was pressure injected into fibers; methods for measuring fluorescence signals and converting these into [Ca2+]i, using an intracellularly established calibration curve, are given in Westerblad and Allen (1996b). During fatigue fibers become acidified which will affect the Ca2+ sensitivity of indo-1 (Lattanzio, 1990; Westerblad and Allen, 1993a ). We have corrected for this, taking in vitro values of the pH sensitivity of indo-1 from Westerblad and Allen (1993a) and measured values of the acidosis in fatigue: 0.6 and 0.3 pH-units in type 1 and 2 fibers, respectively (Westerblad and Lännergren, 1988). Thus, under control conditions the dissociation constant of indo-1 is 311 nM (Westerblad and Allen, 1996b ), and this value was multiplied by 1.15 for fatigued type 1 fibers and 1.07 for fatigued type 2 fibers.
Ca2+-derived force records were constructed from the [Ca2+]i signal during tetani and the steady-state [Ca2+]i-force relation in the same fiber (Westerblad and Allen, 1993a ). The upper part of the [Ca2+]i-force relation under control conditions was obtained from tetani at reduced frequencies, whereas the lower part was obtained after fatiguing stimulation when fibers were recovering from post-contractile depression (PCD; Westerblad and Lännergren, 1986; for full description see Westerblad and Allen, 1996a ). The [Ca2+]i-force relation in fatigue was obtained from tetani produced during late fatigue.
[Ca2+]i-force data points were obtained from averages over the final 100 ms of stimulation or an integral number of stimuli at reduced stimulus frequencies. The following Hill equation was fitted to the data points:
 |
1 |
where P is the relative force, P max is the force at saturating [Ca2+]i, Ca50 is the [Ca2+]i giving 50% of P max, and N is the Hill coefficient which is related to the steepness of the relation. The continuous relation from this expression was used to convert tetanic [Ca2+]i signals to Ca2+-derived force. It should be noted that errors in the dissociation constant for indo-1 and its pH correction (see above) will not have any significant effect on Ca2+-derived force because tetanic [Ca2+]i signals and the [Ca2+]i-force relation will be affected to the same extent.
Changes of both Ca2+-derived and real force relaxation were assessed as the time from the end of stimulation until force had fallen to 70% of the maximum force in the tetanus. This force level was chosen so that measurements should not be affected by the bump in the [Ca2+]i record during relaxation. This bump coincides with the transition between the linear and exponential phase of relaxation (see Fig. 2) and may reflect Ca2+ unloading from troponin due to an increased rate of cross-bridge detachment and hence reduced Ca2+ affinity of troponin (Cannell, 1986).
Figure 2.

Typical records of tetanic [Ca2+]i (A) and force (B) in control and during fatigue. Records from a type 2 fiber. Periods of stimulation are indicated below the force records. [Ca2+]i records shown with thick lines were produced without kinetic correction; in the records with more noise (thinner lines) a kinetic correction has been performed using a Ca2+ off rate of indo-1 of 52 s−1.
Analysis of the SR Ca2+ Uptake
The prolonged increase in [Ca2+]i after tetani were used to estimate the function of the SR Ca2+ uptake as originally described by Klein et al. (1991; see also Westerblad and Allen, 1994a ). A double exponential function is first fitted to the prolonged elevation in [Ca2+]i after a tetanus and from this function data-points of the rate of [Ca2+]i decline (d[Ca2+]i/dt) vs. [Ca2+]i are obtained. Thereafter the following equation is fitted to these data-points:
 |
2 |
where A reflects the rate of SR Ca2+ uptake, N is a power function, and L is the SR Ca2+ leak.
Releases during Relaxation
Experiments with releases during relaxation were performed on both Xenopus and mouse fibers. In these experiments one tendon of the fiber was attached to the moveable arm of a galvanometer (G120DT; General Scanning, Watertown, MA). The position of this arm could be changed rapidly by altering the current passing through the galvanometer coil. During the initial part of relaxation the fiber was rapidly shortened to a length where zero force was produced (slack length); during fatiguing stimulation these shortening steps were performed in every tenth tetanus. The step sizes ranged between 100 and 250 μm in the longer Xenopus fibers (fiber lengths 1.5–2.0 mm) and between 50 and 70 μm in the shorter mouse fibers (fiber lengths 0.6–0.8 mm). The timing and length of the shortening step were kept constant in each experiment and set so that a small, but clear redevelopment of force was obtained under control conditions.
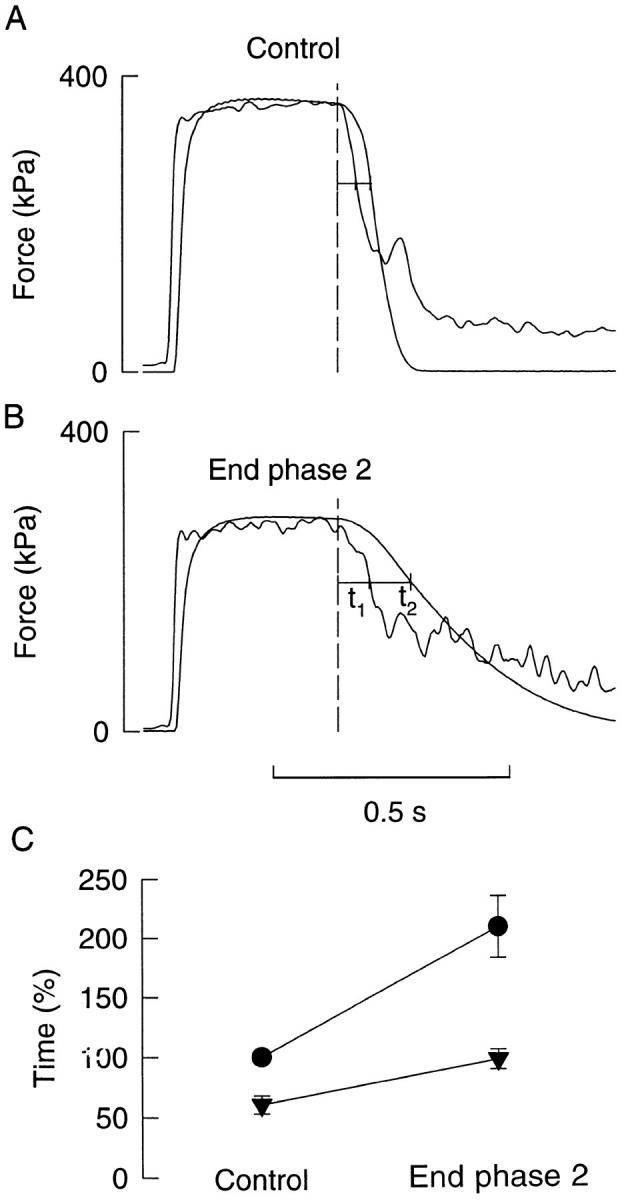
Measurements of the relaxation speed were performed in two successive tetani, one with and one without shortening. In tetani with shortening we measured the time from the end of stimulation until the peak of redeveloped force (t1 in Fig. 6 B); in tetani without shortening we measured the time from the end of stimulation until force had declined to the same level as the peak force after shortening (t1 + t2 in Fig. 6 B). In mouse fibers there was a small decline in the resting force after the shortening step. The peak force after the release was therefore measured from the resting force level after the tetanus, which meant that in tetani with and without releases measurements at the same relative force were performed at slightly different absolute force levels (difference equals the change in force baseline; see Fig. 6, C and D).
Figure 6.

Releases during relaxation in a Xenopus fiber (A and B) and in a mouse fiber (D and E). Records were obtained in control (A and D) and at the end of phase 2 (B and E). Force records with full lines were obtained with the release and records with dashed lines in a preceding tetanus without release. Upward arrows show time of releases; the amplitude of releases was 200 μm for the Xenopus fiber and 70 μm for the mouse fiber. Measurements were performed from the end of stimulation (dotted lines) to the time of peak force after the release (t1) and then to the time when the same relative force was produced in the preceding tetanus without release (t2). Note that in the mouse fiber the shortening step resulted in a reduction of the resting force, and measurements were therefore performed at somewhat different absolute force levels. Mean data of the time of real force relaxation (t1 + t2, •) and the time to peak force after the release (t1, ▾) obtained in Xenopus fibers (C; n = 6) and mouse fibers (F ; n = 4). The relaxation time of real force in control was in each experiment set to 100%.
The rationale behind measuring the time to the peak of force redevelopment is that the peak would, at least in a simplified model, reflect the instant when the effective Ca2+ concentration gives equal rates of cross-bridge attachment and detachment. Thus it might relate to one point on the relaxation of a Ca2+- derived force record. The time between the peak of force redevelopment and the same force level in the preceding tetanus without shortening would then represent the cross-bridge component of relaxation.
In the paper of Ritchie (1954) where the above method was originally described, releases were given at various times and in this way complete “active state” curves during relaxation could be obtained. However, during fatiguing stimulation there is not a steady-state situation and slowing of relaxation gradually becomes more prominent. Thus complete active state curves cannot be obtained during fatigue since this would require measurements from a series of tetani in which the relaxation of later tetani will be markedly slower. Because of this we decided to use only one type of release with constant timing and step size throughout each experiment. Furthermore, by using a constant step size we avoid the problem that different step sizes give different active state curves (Briden and Alpert, 1972).
Fiber Stretching
In some experiments fibers were stretched during the plateau of tetani and at various times during relaxation. The equipment used for these experiments was the same as for the shortening experiments. The lengthening step was 100 μm in Xenopus fibers and 40 μm in mouse fibers and occurred at a constant velocity of about 0.6 mm s−1.
results
[Ca2+]i Measurements during Fatigue
Changes of tetanic [Ca2+]i and force during fatigue of Xenopus fibers (Fig. 1) showed a pattern similar to that previously observed in Xenopus fibers (Allen et al., 1989; Lee et al., 1991) and also in mouse fibers (Westerblad and Allen, 1991, 1993b ). Thus during the initial 10–20 tetani there was a rapid fall of force to ∼80% of the control accompanied by an increase of tetanic [Ca2+]i (phase 1). Then followed a period where force fell more slowly (phase 2), and, finally, force again started to fall more rapidly (phase 3). Tetanic [Ca2+]i was markedly reduced during phase 2, but it still remained high enough to provide almost complete activation of the contractile machinery; that is, tetanic [Ca2+]i fell along the flat part of [Ca2+]i-force curves (see Fig. 3). During phase 3, on the other hand, tetanic [Ca2+]i fell along the steep part of [Ca2+]i-force curves and hence contributed to the rapid reduction of force observed during this period. As described previously (e.g., Westerblad and Lännergren, 1986), type 1 fibers fatigued more rapidly than type 2 fibers; 82 ± 21 tetani given at a final interval of 3 s were required to reduce force to 40% of the control in type 1 fibers, whereas 236 ± 28 tetani given at a final interval of 1–1.5 s were needed in type 2 fibers.
Figure 1.

Tetanic force and [Ca2+]i during fatiguing stimulation in type 1 and type 2 fibers. Mean values (±SEM) of tetanic force (A) and tetanic [Ca2+]i (B) during fatigue in type 1 fibers (○; n = 3) and type 2 fibers (•; n = 4). Data obtained in the first tetanus, the tenth tetanus, the 20th tetanus, at the end of phase 2, and at the end of fatiguing stimulation. [Ca2+]i signals were corrected for changes in pH (see materials and methods) at the end of phase 2 and at the end of fatiguing stimulation.
Figure 3.

[Ca2+]i-force relations of a type 1 fiber in control and during fatigue. (A) Examples of tetanic [Ca2+]i and force records used to construct [Ca2+]i-force curves. Dashed lines indicate how measurements were performed. The “Control” tetanus was produced at a reduced stimulation frequency (15 Hz) before fatiguing stimulation, while the “Control (recovery)” tetanus was produced at 20 min after the end of fatiguing stimulation. Periods of stimulation are indicated below force records. Curves in B represent least square fits of Eq. 1 to data-points obtained in control (○, reduced stimulation frequency; ▿, during recovery after fatiguing stimulation) and during fatigue (•), respectively. Arrows indicate data-points from the tetani shown above.
Fig. 2 shows selected tetani from a typical fatigue run obtained in a type 2 fiber. It can be seen that relaxation is slowed during fatigue and so is the decline of [Ca2+]i at the end of stimulation. However, it cannot be directly concluded that this slowed [Ca2+]i decline is the cause of the reduced rate of force relaxation because it might be counteracted by a reduced myofibrillar Ca2+ sensitivity as shown for mouse fibers (Westerblad and Allen, 1993b ). The [Ca2+]i records obtained in control and in the tenth fatiguing tetanus display a clear bump during relaxation (Cannell, 1986). This bump starts at about the time of transition between the initial slower phase of force relaxation and the subsequent faster phase. At the end of phase 2, on the other hand, the decline of [Ca2+]i during relaxation is generally slowed and the bump is less clear.
The Ca2+ indicator used in the present study, indo-1, is relatively slow and might not accurately follow [Ca2+]i changes during tetani. In Fig. 2 we also show records where the indo-1–derived [Ca2+]i has been corrected for the kinetics of indo-1. The correction has been performed using a Ca2+ off rate of indo-1 of 52 s−1, which is the value obtained when indo-1 [Ca2+]i transients during twitches were compared with transients obtained with the much faster indicator mag-indo-1 (Westerblad and Allen, 1996b ). The correction was performed exactly as described in Westerblad and Allen (1996b) and shows an initial spike of [Ca2+]i at the onset of contractions, which was not present without correction. During the rest of the tetani, the corrected and uncorrected records were similar except for a higher noise level with correction. During relaxation the corrected and uncorrected records are virtually identical; a close inspection reveals that the corrected records precede the uncorrected by 1–2 ms. Thus, kinetic correction of indo-1 does not have any significant impact on [Ca2+]i during relaxation and all analyses in the following have been performed on uncorrected records.
[Ca2+]i - force Relations
[Ca2+]i - force curves under control conditions and during fatigue were constructed as described in materials and methods. Fig. 3 shows typical examples from a type 1 fiber. It can be seen that the two methods used to construct [Ca2+]i-force curves under control conditions (tetani at reduced stimulation frequency and tetani during PCD) give similar results and overlap.
Mean values of Pmax, Ca50, and N (Eq. 1) are given in Table I. During fatigue there was a reduction of the maximum force (Pmax) by ∼15% in both type 1 and type 2 fibers, while the power function (N) was not significantly altered in any of the two fiber types. Ca50 was significantly increased in type 1 fibers but showed no change in type 2 fibers, which means that the myofibrillar Ca2+ sensitivity was reduced in type 1 fibers but not in type 2 fibers. Under control conditions type 1 fibers appeared to be more sensitive to Ca2+ than type 2 fibers but this difference was not significant.
Table I.
Changes of the [Ca2+]i - force Relation in Fatigue
| Type 1 (n = 3) | Type 2 (n = 4) | |||
|---|---|---|---|---|
| Pmax end phase 2 (%) | 87.3 ± 3.8‡ | 84.5 ± 3.2* | ||
| Ca50 (nM) | ||||
| Control | 392 ± 14 | 646 ± 94 | ||
| End phase 2 | 522 ± 16* | 651 ± 60 | ||
| N | ||||
| Control | 2.3 ± 0.6 | 4.1 ± 1.1 | ||
| End phase 2 | 3.5 ± 0.6 | 4.5 ± 0.7 |
Significant changes (P < 0.05) as compared to controls in two-tailed (
) and one-tailed (
) t tests.
Ca2+-derived Force
Ca2+-derived force records were constructed from tetanic [Ca2+]i records and [Ca2+]i-force curves obtained in the same fiber. These Ca2+-derived force records were compared to real force records under control conditions and at the end of phase 2. Fig. 4, A and B, shows a representative example of this type of analysis performed in a type 1 fiber. It can be seen that relaxation of both the real and Ca2+-derived force was markedly slowed at the end of phase 2. Fig. 4 C summarizes the results from all seven fibers studied (three type 1 fibers and four type 2 fibers); data from the two fiber types have been pooled since the results from type 1 and type 2 fibers showed no significant difference. The time to 70% relaxation of real force (t1 + t2) in control amounted to 70.0 ± 6.8 ms and was in each experiment set to 100%. At the end of phase 2, the time for real force relaxation had increased by 110% due to a slowing of both the calcium component (corresponding to t1) and the cross-bridge component (corresponding to t2) of relaxation. Moreover, the relation between the calcium and the cross-bridge component showed some decline during fatigue: t1/(t1 + t2) being 0.61 in control and 0.47 at the end of phase 2.
Figure 4.
Real and Ca2+-derived force of Xenopus fibers in control and at the end of phase 2. Records obtained from a type 1 fiber in control (A) and at the end of phase 2 (B). Records with higher noise level represent Ca2+-derived force. Dashed lines indicate end of tetanic stimulation. Measurements were performed at 70% of the tetanic force (horizontal lines); t1 represents the calcium component, and t2 represents the cross-bridge component of relaxation. C shows collected data (mean ± SEM; n = 7) of the relative time of real force relaxation (t1 + t2, •) and relaxation of the calcium component (t1, ▾). The relaxation time of real force in control was in each experiment set to 100%.
The effect of the bump in [Ca2+]i during relaxation is clearly seen in the Ca2+-derived force record obtained in control (Fig. 4 A). Relaxation of the Ca2+- derived force reverses transiently at ∼40% of the tetanic force and thereafter real force relaxation precedes Ca2+-derived force. Thus at this time relaxation is no longer driven by a decline in [Ca2+]i; rather it would be determined by longitudinal movements within the fiber with some parts shortening while others are being lengthened (Huxley and Simmons, 1970; Cleworth and Edman, 1972). It should be noted that any influence of the bump on measurements of Ca2+-derived force relaxation was avoided by measuring relaxation times at 70% of the tetanic force, i.e., before the occurrence of the bump. At the end of phase 2, the rate of decline of Ca2+-derived force was slowed at ∼50% of the tetanic force (Fig. 4 B). Relaxation seems to be more isometric in fatigue than in control (see below) and the slow, final decline of Ca2+-derived force at the end of phase 2 might therefore have a large impact on real force relaxation.
Analysis of the Rate of SR Ca2+ Uptake
The prolonged elevation of [Ca2+]i after tetani was used to estimate changes of the SR Ca2+ uptake in fatigue as described in materials and methods. There was no obvious difference between these prolonged elevations in type 1 and type 2 fibers and therefore the analysis has been performed on pooled data from both fiber types. Fig. 5 A shows average records of [Ca2+]i after tetani in control and at the end of phase 2. [Ca2+]i during relaxation was markedly larger at the end of phase 2 whereas the rate of [Ca2+]i decline was more similar, which clearly indicates an altered Ca2+ handling during fatigue.
Figure 5.

Analysis of the function of SR Ca2+ pumps in control and at the end of phase 2. (A) Average records from seven fibers of [Ca2+]i after tetanic stimulation in control and at the end of phase 2. Dashed curves obtained by a least square fit of the sum of two exponentials to the records. Tetanic stimulation ended at 0 s. B shows plots of the rate of [Ca2+]i decline (d([Ca2+]i)/dt) vs. [Ca2+]i in control and at the end of phase 2. Data-points for control (○) and end of phase 2 (•) were obtained from fitted curves in A. Curves in B were produced by fitting Eq. 2 to the data-points.
In Fig. 5 B data-points of d[Ca2+]i/dt vs. [Ca2+]i obtained from the double exponential fit of [Ca2+]i after tetani (dashed lines, Fig. 5 A) are plotted. The curves were obtained by fitting Eq. 2 to these data-points. To simplify comparison of the present data with data previously obtained in mouse fibers, the power function (N) was set to 4 (Westerblad and Allen, 1993b ), and this gave a decent fit both in control and at the end of phase 2. During fatigue there is a clear rightward shift of the curve, which reflects a reduced rate of SR Ca2+ uptake (A): at the end of phase 2, A was reduced to 52.4 μM−3 s−1 from a control value of 238 μM−3 s−1. The analysis also indicates an increased SR Ca2+ leak in fatigue and L was increased from 7.0 nM s−1 in control to 39.5 nM s−1 at the end of phase 2.
Releases during Relaxation
Fig. 6, A and B, shows a typical example of the force response to rapid shortening steps in Xenopus fibers. The redevelopment of force after the shortening step is much larger, and the peak occurs later at the end of phase 2 as compared to control. This indicates that during relaxation [Ca2+]i remains high enough to promote cross-bridge attachment for a longer period at the end of phase 2. The dashed lines show the force of preceding tetani without shortening. It can be seen that both the time to peak force redevelopment (t1) and the lag between the peak and real force (t2) increase significantly during fatigue. This means that both the calcium component (corresponding to t1) and the cross-bridge component (corresponding to t2) contribute to the slowing.
Relaxation releases during fatigue were performed in six Xenopus fibers (three type 1 fibers and three type 2 fibers). No significant fiber type difference concerning the response to relaxation releases was observed and mean results from both fiber types are plotted in Fig. 6 C; t1 + t2 in control was in each experiment set to 100%. At the end of phase 2, t1 + t2 had increased by 91% due to significant increases of both t1 and t2. The relation between t1 and t2 was not significantly changed during fatigue: t1/(t1 + t2) was 0.49 in control and 0.46 at the end of phase 2. Thus, these results agree with the above results obtained with the Ca2+-derived force analysis (see Fig. 4 C) and show that the relaxation rate was about halved in fatigued Xenopus fibers and that this was due to significant slowing of both the calcium component and the cross-bridge component.
In a previous study on mouse muscle fibers using Ca2+-derived force analysis, we found the slowing of relaxation in these fibers to be exclusively caused by the cross-bridge component (Westerblad and Allen, 1993b ). This contrasts with the present results in Xenopus fibers obtained both with Ca2+-derived force and releases during relaxation. We have therefore looked at the response to rapid releases during relaxation in four mouse fibers and one typical experiment is shown in Fig. 6, D and E. A marked difference compared to Xenopus fibers can be seen: as relaxation slows during fatigue there was no clear increase of either the amplitude of force redevelopment or the time to its peak (Fig. 6 E). Mean data (Fig. 6 F) showed that the calcium component (t1) was not significantly altered during fatigue, whereas the cross-bridge component (t2) increased significantly by 30%. Thus, these results support the conclusion of our previous study (Westerblad and Allen, 1993b ) that the slowing of relaxation in fatigued mouse fibers is due to a slowed cross-bridge component. Furthermore, a comparison of Fig. 6, C and F, shows that there is a large difference in the degree of slowing in Xenopus and mouse fibers: the total relaxation time was approximately doubled in Xenopus whereas it increased by only 30% in mouse.
It may be argued that the force redevelopment after the release mainly depends on altered mechanical properties of the fibers during relaxation rather than on the calcium component. For example, after the transition between the initial slow phase of relaxation and the following faster phase, force redevelopment may be precluded due to longitudinal movements within fibers (Huxley and Simmons, 1970; Cleworth and Edman, 1972). We therefore measured the time from the end of stimulation to the midpoint of the “shoulder” on force relaxation records obtained in the accompanying tetani without releases and compared these measurements with the time to peak force after releases. Under control conditions, the time to the midpoint of the shoulder was 72.5 ± 5.1 ms in Xenopus fibers, which is significantly less than the time to peak force after releases (92.2 ± 4.9 ms). Thus in this case peak force occurred during the fast phase of relaxation (see Fig. 6 A). The shoulder was less clear in fatigued Xenopus fibers which prevented accurate measurements of its duration. Moreover, relaxation also seems to be more isometric in fatigued Xenopus fibers (see below), which would reduce potential problems with altered mechanical properties. Mouse fibers displayed a clear shoulder during relaxation both in control and fatigue. The time to the midpoint of the shoulder increased from 43.3 ± 3.8 ms in control to 68.3 ± 2.5 ms at the end of phase 2. These values are higher than those for the time to peak force after releases (38.5 ± 5.5 ms and 44.3 ± 6.4 ms, respectively) and hence peak force consistently occurred during the linear phase of relaxation in mouse fibers.
Releases during Relaxation of Xenopus Fibers Exposed to an Inhibitor of SR Ca2+ Uptake
As a control for the accuracy of the method with releases during relaxation, we conducted experiments with releases of Xenopus fibers exposed to 500 nM 2,5-di(tert-butyl)-1,4-benzohydroquinone (tBuHQ or TBQ). tBuHQ was originally shown to inhibit endoplasmic reticulum Ca2+ pumps in hepatocytes (Moore et al., 1987), and we have more recently shown that it inhibits SR Ca2+-pumps of mouse skeletal muscle fibers (Westerblad and Allen, 1994a ). Thus application of tBuHQ would be expected to slow relaxation by increasing the calcium component while having little effect on the cross-bridge component. Fig. 7 shows records from one of these experiments. As expected, application of tBuHQ slows relaxation and the amplitude of force redevelopment after the release is markedly increased and its peak delayed.
Figure 7.
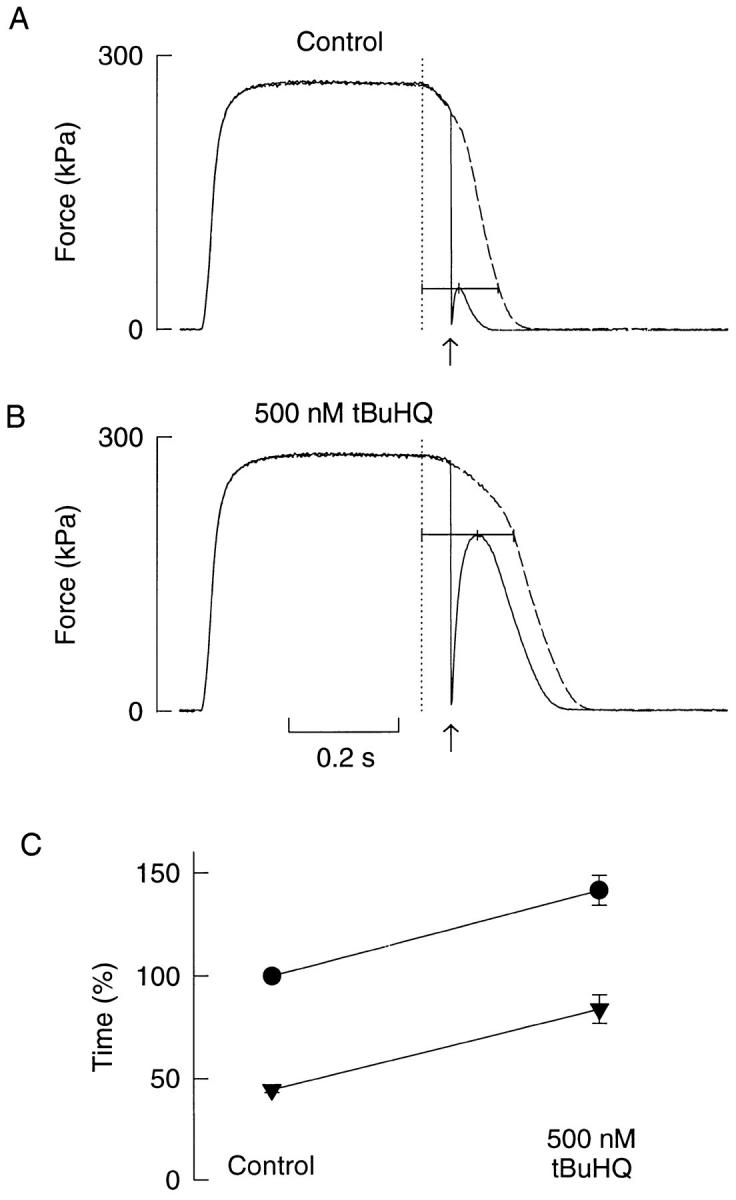
Releases during relaxation in a Xenopus fiber where the SR Ca2+ uptake was inhibited by tBuHQ. Force records with (full lines) and without (dashed lines) releases before (A) and after 10-min exposure to 500 nM tBuHQ (B). Dotted lines show end of tetanic stimulation; upward arrows indicate the time when a 250 μm release was performed. Measurements indicated by horizontal lines; observe that the time to peak force after the release (i.e., the calcium component) increased in tBuHQ, whereas the time from the peak to the same real force level (i.e., the cross-bridge component) remained constant. C shows mean data (n = 6) of the relative relaxation time of real force (•) and the calcium component (▾) from control and tBuHQ.
Fig. 7 C shows mean data from six Xenopus fibers exposed to tBuHQ (t1 + t2 in control set to 100%). With application of tBuHQ, t1 was almost doubled whereas t2 showed no significant change. This means that the slowing could be fully explained by an effect on the calcium component of relaxation while the cross-bridge component remained unchanged.
Ramp Stretches during Relaxation
The slowing of relaxation in fatigue of both Xenopus and mouse fibers involved a clear cross-bridge component. The origin of this alteration of cross-bridge kinetics is unclear; for example, during fatigue the reduction of maximum shortening velocity, which is a direct measure of cross-bridge kinetics, occurs with a time-course markedly different from that of the slowing of relaxation (Westerblad and Lännergren, 1994). The extent of longitudinal, intrafiber movements during relaxation is reduced in fatigue (Curtin and Edman, 1989). This increased homogeneity might result in an increased resistance to stretch during later parts of relaxation which might contribute to the slowing of relaxation. In order to test this hypothesis, fibers were stretched at various times during relaxation, and the force response was compared to that obtained in stretches performed during the tetanic plateau. The upper part of Fig. 8 shows records from one such experiment performed in a Xenopus type 1 fiber. Under control conditions, a stretch at the end of the linear phase of relaxation resulted in a small force increase which ended at the time of the shoulder despite continuing stretch (Fig. 8 A). At the end of phase 2, on the other hand, a stretch performed later during relaxation resulted in a more marked force increase and force promptly declined at the end of the stretch, which indicates that the fiber responded to the stretch throughout the period of stretching (Fig. 8 B); a stretch performed at the same time in control gave no force response (record not shown). Similar results were obtained in three more fibers (two type 1 and one type 2). Under control conditions, a stretch during the tetanic plateau resulted in a marked force increase which was maintained throughout the period of stretch and amounted to 28 ± 3% of the tetanic force (measured as the maximum force increase during the stretch). At the end of phase 2, the stretch induced increase of force during the tetanic plateau was similar to the increase in control in absolute terms, but since force declines during fatigue it amounted to 40 ± 5% of the tetanic force. A stretch during early relaxation (as in Fig. 8 A) resulted in a transient force increase of 4 ± 2% in control, whereas the force response to this stretch was large (23 ± 5%) and maintained throughout the stretching period at the end of phase 2. Finally, the stretch late during relaxation (as in Fig. 8 B) gave no noticeable force response in control, but a clear-cut increase (8 ± 4%) at the end of phase 2.
Figure 8.

Ramp stretches at constant velocity performed during relaxation in a Xenopus fiber (A and B) and a mouse fiber (C and D). Dashed lines show force of tetani produced immediately before the tetani with stretches. Dotted lines mark the beginning and end of stretches; the amplitude of the stretch was 100 μm for the Xenopus fiber and 40 μm for the mouse fiber. Periods of stimulation are given below each force record. Observe that the stretch in the Xenopus fiber was produced later into relaxation at the end of phase 2 than in control. Note also the different time scales for Xenopus and mouse.
Changes of stretch resistance in fatigue were studied in four mouse fibers. Under control conditions, stretches during the tetanic plateau increased force by 44 ± 2% of the tetanic force. In agreement with the results from Xenopus fibers, the resistance to stretch during the plateau was not significantly reduced at the end of phase 2 despite a reduction of the tetanic force of about 30%. The lower part of Fig. 8 shows records from a typical experiment with stretches during relaxation. Under control conditions, stretches during the initial, linear phase of relaxation gave a transient force increase which ended at the time of the shoulder (Fig. 8 C). At the end of phase 2, a stretch with the same timing resulted in a somewhat larger force increase (Fig. 8 D). However, as in the control, the force during the stretch started to decline at the time of the shoulder, and hence the larger stretch response at the end of phase 2 can be explained by the prolongation of the linear phase of relaxation in fatigue. Stretches performed after the shoulder never gave any noticeable force response. Thus, fatigued mouse fibers did not show the marked increase of stretch resistance during relaxation observed in fatigued Xenopus fibers.
One possible explanation for the difference in stretch resistance between fatigued mouse and Xenopus fibers is that Xenopus fibers are significantly acidified in fatigue (Westerblad and Lännergren, 1988) whereas mouse fibers are not (Westerblad and Allen, 1992), and it has been shown that acidosis results in a more isometric relaxation in frog fibers (Curtin and Edman, 1989). To test this, stretches were produced in three mouse fibers which were acidified by about 0.5 pH-units by exposure to 30% CO2 (Westerblad and Allen, 1992). Acidosis increased the time to 70% relaxation of these fibers by 34 ± 10%. In acidosis stretches performed early during relaxation resulted in a force increase which was somewhat larger than in control, but ended promptly at the time of the shoulder. Stretches performed after the shoulder gave no clear force increase. Thus, the lack of acidosis in fatigued mouse fibers cannot explain their smaller stretch response as compared to fatigued Xenopus fibers.
discussion
The main novel result of the present study is that the slowing of relaxation in fatigued Xenopus fibers is caused by slowing of a Ca2+-related component and a cross-bridge related component. This contrasts to the situation in fatigued mouse fibers where the slowing of relaxation, which is markedly smaller than in Xenopus fibers, seems to be exclusively caused by the cross-bridge related component. This conclusion is based on the results of experiments where the relative contribution of the two components of relaxation has been assessed by two completely independent methods: Ca2+-derived force and releases during relaxation. Both these methods are susceptible to various sources of error and these are discussed below. Nevertheless, the two independent methods gave qualitatively almost identical results, and hence the above conclusion seems to be justified.
Ca2+-derived Force and [Ca2+]i - force Curves
The Ca2+-derived force method depends on the accuracy of constructed [Ca2+]i-force curves. Under control conditions these curves were constructed from data-points obtained from unfatigued tetani with reduced stimulation frequency and from tetani during recovery from PCD. There are problems with both these situations. In tetani with reduced stimulation frequency there are large fluctuations of both force and [Ca2+]i, and thus the [Ca2+]i-force relation will to some extent depend on how records are measured (see Westerblad and Allen, 1993a ). During PCD there are changes of the fiber architecture with formation of large vacuoles (Lännergren et al., 1990), and it may be argued that these changes might affect the indo-1 signal; for example, some indo-1 may be trapped in vacuoles and may therefore not respond to changes of [Ca2+]i. However, the results of these two methods were very similar and frequently data-points of the two methods overlapped. Since the sources of error are markedly different in the two situations, this might indicate that the accuracy of [Ca2+]i-force relations is relatively good. It should also be noted that errors in the calibration of indo-1 and hence translation of fluorescent signals to [Ca2+]i will have little impact on Ca2+-derived force; for instance, an increase of the dissociation constant of indo-1 will increase tetanic [Ca2+]i but also result in a corresponding rightward shift of the [Ca2+]i-force curve, and the Ca2+-derived force record will remain unaffected.
One unexpected finding in the present study was that fatigued type 2 fibers showed no reduction of the myofibrillar Ca2+ sensitivity. In these fibers there is an acidosis of about 0.3 pH-units in fatigue (Westerblad and Lännergren, 1988), and the phosphocreatine store would be almost depleted at the end of phase 2 (Nagesser et al., 1993), which would result in a marked increase of inorganic phosphate (Pi). Both acidosis and increased Pi are known to reduce Ca2+ sensitivity (e.g., Godt and Nosek, 1989), and therefore a reduced sensitivity would be expected in fatigue. However, Williams et al. (1993) recently performed experiments on frog fibers which were skinned either under control conditions or after fatiguing stimulation. They found that when bathed in the same solution, fibers skinned after fatiguing stimulation had an increased myofibrillar Ca2+ sensitivity. Thus there seems to be some factor in fatigued muscle fibers which can counteract the reduction of Ca2+ sensitivity induced by acidosis and increased Pi. In type 1 fibers we observed a significant reduction of Ca2+ sensitivity. These fibers display a larger acidosis in fatigue which, assuming all other changes affecting Ca2+ sensitivity in fatigue being equal in type 1 and type 2 fibers, might explain the reduced sensitivity. The additional acidosis in type 1 fibers (0.3 pH-units) increased Ca50 by a factor of 1.3 (522 nM/392 nM; see Table I), which is in reasonable agreement with data from skinned fibers where Ca50 increases by a factor of ∼3 per pH-unit (e.g., Fabiato and Fabiato, 1978; Metzger and Moss, 1990).
Releases during Relaxation
To study force redevelopment after releases during relaxation is an indirect way of estimating the calcium component (or “active state”) during relaxation which may be affected by several sources of error. For example, active state curves have shown to be affected by the amplitude of the shortening step (Briden and Alpert, 1972); to minimize this potential source of error we used the same step size both in control and during fatigue. Furthermore, rapid fiber shortening may affect Ca2+ binding to troponin (Gordon and Ridgway, 1987) and hence also the calcium component of relaxation. Finally, force redevelopment after the release may be affected by the fact that relaxation occurs in two phases: an initial phase with linear force decline where fibers have been shown to be isometric; a second faster, exponential phase with longitudinal movements within fibers (Huxley and Simmons, 1970; Cleworth and Edman, 1972), which might impede force redevelopment. The present results in mouse fibers should not be affected by this because the peak of force redevelopment occurred during the linear phase both in control and at the end of phase 2. In Xenopus fibers the situation is more complex with peak force redevelopment occurring during the exponential phase of relaxation in control and with the two phases of relaxation being not clearly separated in fatigue. Thus, if force redevelopment is inhibited during the exponential phase, the calcium component (t1) would be underestimated in Xenopus fibers in control. This might explain the somewhat lower t1 to (t1 + t2) ratio in control obtained with releases as compared to those obtained in Ca2+-derived force experiments (0.49 vs. 0.61). It is worth noting that a similar relation between the calcium and cross-bridge component of relaxation in unfatigued Xenopus fibers has been obtained in experiments with the caged Ca2+ chelator diazo-2: activation of diazo-2 during relaxation resulted in approximately a doubling of the relaxation rate (Lännergren and Arner, 1992).
The present experiments with tBuHQ support the validity of the method with releases during relaxation. Analysis of the force redevelopment after releases in the presence of tBuHQ showed that the observed slowing of relaxation can be fully explained by slowing of the calcium component. This is the expected result since in mouse fibers tBuHQ has been shown to effectively inhibit the SR Ca2+ pumps while having no marked effect on myofibrillar function, as judged from measurements of the [Ca2+]i-force relation and maximum force production (Westerblad and Allen, 1994a ). Furthermore, tBuHQ has no significant effect on the maximum shortening velocity of Xenopus fibers (Westerblad, H., unpublished observation).
Slowing of the Calcium Component of Relaxation
The present results showed a marked slowing of the calcium component of relaxation in fatigued Xenopus fibers. This contrasts to the situation in fatigued mouse fibers where the calcium component is not slowed as judged from release experiments in the present study and the Ca2+-derived force experiments of Westerblad and Allen (1993b). The present results indicate that the effectiveness of SR Ca2+ uptake is markedly different in frog and mammalian muscle. The analysis of SR Ca2+ uptake in Xenopus fibers gave a value of A (Eq. 2), which reflects the rate of SR Ca2+ uptake of 238 μM−3 s−1 in control which compares to ∼8,700 μM−3 s−1 in mouse fibers (Westerblad and Allen, 1993b ). The rate of SR Ca2+ uptake is markedly reduced in fatigued mouse fibers, and A declines to ∼1,200 μM−3 s−1. However, this is still about five times higher than in unfatigued Xenopus fibers. Thus the SR Ca2+ uptake is much more effective in our mouse fibers, and these fibers may tolerate a marked inhibition of the uptake without displaying any major slowing of force relaxation. In Xenopus fibers, on the other hand, the SR Ca2+ uptake is less effective, and an inhibition will have immediate effects on force relaxation.
The mechanism behind the slower Ca2+ removal from the myoplasm in Xenopus than in mouse fibers is unclear. It appears not simply to be due to differences in function or content of SR Ca2+ ATPase (Simonides and van Hardeveld, 1990), and more elaborate mechanisms have to be envisaged. Our method of analyzing SR Ca2+ uptake cannot distinguish between a reduced rate of Ca2+ uptake and an increased rate of SR Ca2+ efflux, provided these have a similar [Ca2+]i dependence. Thus one possible mechanism is that the SR Ca2+ release channels (ryanodine receptors) close less effectively in frog muscles resulting in an increased SR Ca2+ efflux after tetanic contractions. In line with this hypothesis, there are large differences in SR Ca2+ release of frog and mammalian skeletal muscle; for instance, the voltage-activated flux of Ca2+ from the SR has recently been found to be several-fold larger in frog than in rat fibers (Shirokova et al., 1996) and the ratio of ryanodine to dihydropyridine receptors has consistently been found to be higher in frog than in mammalian muscle indicating that in frog muscle some ryanodine receptors are Ca2+ operated rather than under direct control by the dihydropyridine receptors and voltage changes in the t-tubules (e.g., Anderson et al., 1994; Klein et al., 1996). The SR Ca2+ uptake also depends on the Ca2+ concentration gradient over the SR membrane. There are indications of a higher Ca2+ concentration in the SR of frog muscle as compared to mammalian muscle (Volpe et al., 1988; Shirokova et al., 1996), which then might contribute to the slower SR Ca2+ uptake in Xenopus fibers as compared to mouse fibers.
The slowing of the Ca2+ removal from the myoplasm in fatigue might be due to metabolic factors acting on the SR Ca2+ pumps: a reduction of the free energy of ATP hydrolysis, due to increased concentrations of ADP and Pi and reduced concentration of ATP, might slow the SR Ca2+ pumps (Dawson et al., 1980); the Xenopus fibers are acidified during fatigue and acidosis slows the rate of SR Ca2+ uptake (e.g., Lamb et al., 1992; Westerblad and Allen, 1993a ). Furthermore, studies on homogenates obtained from fatigued muscles have shown a marked reduction of the rate of SR Ca2+ uptake as compared to homogenates from rested muscles (e.g., Byrd et al., 1989). Since these measurements were performed in a constant ionic environment, the reduced rate cannot be ascribed to the direct action of metabolic factors, but rather to some structural derangement of the SR membrane.
Parvalbumin is a soluble, Ca2+ binding protein which exists in relatively large concentrations (up to ∼0.5 mM) both in the present Xenopus and mouse fibers (Westerblad and Lännergren, 1991; Lännergren et al., 1993). Parvalbumin is thought to speed up relaxation in contractions of short duration by acting in parallel with SR Ca2+ pumps to lower [Ca2+]i; during prolonged stimulation parvalbumin will become saturated with Ca2+ and can no longer act as a Ca2+ sink (for brief review see Hou et al., 1993). Results in agreement with this action of parvalbumin have been obtained in Xenopus fibers (Lännergren et al., 1993; Westerblad and Allen, 1996a ), and parvalbumin appears to become saturated with Ca2+ during fatigue (Westerblad and Lännergren, 1990). It should be noted that Ca2+ loading of parvalbumin will have little effect on the slowing of relaxation observed during fatigue with repeated tetani. This is because parvalbumin Ca2+ loading occurs at a rate of about 4 s−1 (Westerblad and Allen, 1996a ), and consequently a large fraction of the parvalbumin Ca2+ binding sites will be occupied with Ca2+ already at the end of the first tetanus of a fatigue run. In mouse fibers we have also obtained results indicating Ca2+ loading of parvalbumin with prolonged stimulation (Westerblad and Allen, 1994b ). However, in contrast to the situation in Xenopus fibers, this has no significant effect on force relaxation, presumably due to the very effective SR Ca2+ uptake in mouse fibers; a clear slowing of relaxation which can be ascribed to parvalbumin Ca2+ loading was obtained when the SR Ca2+ pumps were inhibited by tBuHQ (Westerblad and Allen, 1994b ). Thus, Ca2+ saturation of parvalbumin might contribute to the slowing of the calcium component of relaxation during fatigue only in Xenopus fibers, and the effect is presumably rather small.
Slowing of the Cross-bridge Component of Relaxation
Both the Ca2+-derived force method and the release method showed a clear slowing of the cross-bridge component in fatigued fibers of both Xenopus and mouse. The cross-bridge component involves Ca2+ dissociation from troponin C and subsequent cross-bridge detachment. It is now well established that these two steps interact so that strongly bound cross-bridges promote thin filament activation and Ca2+ binding (e.g., Swartz et al., 1996). An interaction between Ca2+ dissociation from troponin C and cross-bridge detachment is supported by the bump in [Ca2+]i records during relaxation (Cannell, 1986): at the transition between the linear and exponential phases of force relaxation there is a marked reduction, or even reversal, of the rate of [Ca2+]i decline which is believed to represent increased Ca2+ dissociation from troponin C as some part of the fiber starts to give and the number of strongly bound cross-bridges falls rapidly. In the present study this bump is clearly visible in control and early stages of fatigue where there is a clear shoulder in force relaxation (see control and tenth fatiguing tetani in Fig. 2). However, the two phases of force relaxation and the bump in [Ca2+]i records are less clear in the later stages of fatigue in Xenopus fibers (see fatigued tetani in Figs. 2 and 3); at this stage stretches performed late during relaxation give a large force increase (Fig. 8 B), which indicates that strongly bound cross-bridges remain throughout the length of the fiber.
In fatigued mouse fibers the slowed cross-bridge component is mainly due to a slowing and prolongation of the linear phase of relaxation (Westerblad and Lännergren, 1991). Stretch experiments were performed to investigate the mechanism behind this prolongation, and these experiments gave similar results in control and fatigued mouse fibers: the stretch resistance declined rapidly at the transition between the linear and exponential phase of relaxation (Fig. 8, C and D). Similar stretch results were also obtained when relaxation was slowed by producing acidosis in rested mouse fibers. Thus, the prolongation of the linear phase of relaxation in fatigued mouse fibers can simply be explained by a corresponding increase of the period of isometric relaxation.
We propose the following model for the slowed cross-bridge component in fatigued mouse fibers. During fatigue there is a marked increase of Pi due to break-down of phosphocreatine (Nagesser et al., 1993). An increase of Pi has been shown to reduce the rate of myofibrillar ATP turnover during isometric contraction of skinned fibers, presumably by a net shift of cross-bridges from an attached, high-force state (actomyosin-ADP) to an attached, low-force state (actomyosin-ADP-Pi) (e.g., Cooke et al., 1988; Potma et al., 1995). The slowing of myofibrillar ATP turnover will result in a reduced rate of cross-bridge detachment during relaxation leading to a slower force decline during the linear phase of relaxation. The reduced rate of myofibrillar ATP turnover will also lead to an increased duration of the linear phase of relaxation. This is because cross-bridges in the attached, low-force state resist stretch (Iwamoto, 1995), and thus it will take longer to reach the state where the number of attached cross-bridges in some sarcomeres has become so low that these sarcomeres no longer can resist the stretch from other sarcomeres with a larger number of attached, high-force cross-bridges. In addition, the model can explain the force reduction at the end of phase 2: increased Pi will promote a net shift of cross-bridges from the attached, high-force state to the attached, low-force state. The model is also consistent with the finding that the resistance to stretch during the tetanic plateau is not reduced during fatigue: the total number of attached cross-bridges is not reduced and the attached, low-force cross-bridge state can support force upon stretch (Iwamoto, 1995). In support of the model it has been shown that stiffness, a measure of the number of attached cross-bridges, is reduced less than force both with increased Pi (Hibberd et al., 1985; Martyn and Gordon, 1992; Iwamoto, 1995) and during fatigue (Edman and Lou, 1990). Furthermore, the rate of relaxation is reduced by elevated Pi in skinned fiber experiments where relaxation was induced by activation of the caged Ca2+ chelator diazo-2 (Palmer et al., 1993). It should, however, be noted that there are results which show that cross-bridge kinetics might become faster with increasing Pi. For example, the relaxation from rigor due to activation of caged ATP is accelerated by Pi (Hibberd et al., 1985), and after activation of caged Pi, the force decline of isometrically contracting fibers becomes faster as the liberated Pi is increased (Millar and Homsher, 1990). Moreover, a reduction of Pi below the normal resting level has been shown to slow the relaxation of intact, mouse soleus muscle (Phillips et al., 1993), which could be taken as a strong evidence against the model. However, it might be hypothesized that relaxation is slowed both at reduced and elevated Pi, similar to the situation with changes of intracellular pH where both acidification and alkalinization result in slowed relaxation (Westerblad and Allen, 1993a ). Thus, our proposed model should be regarded as an early attempt to explain the cross-bridge component of the slowing of relaxation in fatigued mouse fibers, and further experiments are required to either confirm or disprove the model.
Under control conditions the stretch resistance of Xenopus fibers was similar to that in mouse fibers (Fig. 8 A). In fatigue, on the other hand, stretches performed late during relaxation gave a clear force increase that was maintained throughout the period of stretching (Fig. 8 B). Thus, the period of isometric relaxation seems to be markedly prolonged in fatigued Xenopus fibers, which is consistent with previous results from frog muscle (Curtin and Edman, 1989). This means that the large increase of [Ca2+]i after tetani in fatigued Xenopus fibers might have an important effect on force, whereas this is not the situation in rested fibers where longitudinal movements would prevent force production despite a relatively high [Ca2+]i.
The above proposed model to explain the slowed cross-bridge component of relaxation in fatigued mouse fibers can also be applied to fatigued Xenopus fibers. However, while the cross-bridge component increased by 30% in fatigued mouse fibers, it was doubled in fatigued Xenopus fibers. This extra slowing in Xenopus can be explained, using the same reasoning as above, by the acidification of these fibers during fatigue because acidosis further depresses the rate of myofibrillar ATP turnover in the presence of high Pi (Cooke et al., 1988; Potma et al., 1995).
Conclusion
The reduced relaxation speed in fatigued Xenopus muscle fibers is caused by a slowing of both the Ca2+ and cross-bridge component of relaxation. This contrasts to the situation in fatigued mouse fibers where the slowing of relaxation is only due to altered cross-bridge kinetics. This difference can be explained by a markedly less effective Ca2+ handling by the SR in Xenopus fibers.
Footnotes
The study was supported by grants from the Swedish Medical Research Council (Project No. 3642 and 10842), the Australian National Health and Medical Research Council, the Swedish National Centre for Sports Research, and Harald and Greta Jeanssons Stiftelse.
Dr. David G. Allen's present address is Department of Physiology F13, University of Sydney, NSW 2006, Australia.
Abbreviations used in this paper: PCD, post-contractile depression; Pi, inorganic phosphate ions; SR, sarcoplasmic reticulum; tBuHQ, 2,5-di(tert-butyl)-1,4-benzohydroquinone.
references
- Allen DG, Lännergren J, Westerblad H. Muscle cell function during prolonged activity: cellular mechanisms of fatigue. Exp Physiol. 1995;80:497–527. doi: 10.1113/expphysiol.1995.sp003864. [DOI] [PubMed] [Google Scholar]
- Allen DG, Lee JA, Westerblad H. Intracellular calcium and force in isolated single muscle fibres from Xenopus. . J Physiol (Camb) 1989;415:433–458. doi: 10.1113/jphysiol.1989.sp017730. [DOI] [PMC free article] [PubMed] [Google Scholar]
- Anderson K, Cohn AH, Meissner G. High-affinity [3H]PN200-110 and [3H]ryanodine binding to rabbit and frog skeletal muscle. Am J Physiol. 1994;266:C462–C466. doi: 10.1152/ajpcell.1994.266.2.C462. [DOI] [PubMed] [Google Scholar]
- Briden KL, Alpert NR. The effect of shortening on the time-course of active state decay. J Gen Physiol. 1972;60:202–220. doi: 10.1085/jgp.60.2.202. [DOI] [PMC free article] [PubMed] [Google Scholar]
- Byrd SK, McCutcheon LJ, Hodgson DR, Gollnick PD. Altered sarcoplasmic reticulum function after high-intensity exercise. J Appl Physiol. 1989;67:2072–2077. doi: 10.1152/jappl.1989.67.5.2072. [DOI] [PubMed] [Google Scholar]
- Cannell MB. Effect of tetanus duration on the free calcium during the relaxation of frog skeletal muscle fibres. J Physiol (Camb) 1986;376:203–218. doi: 10.1113/jphysiol.1986.sp016149. [DOI] [PMC free article] [PubMed] [Google Scholar]
- Cleworth DR, Edman KAP. Changes in sarcomere length during isometric tension development in frog skeletal muscle. J Physiol (Camb) 1972;227:1–17. doi: 10.1113/jphysiol.1972.sp010016. [DOI] [PMC free article] [PubMed] [Google Scholar]
- Cooke R, Franks K, Luciani GB, Pate E. The inhibition of rabbit skeletal muscle contraction by hydrogen ions and phosphate. J Physiol (Camb) 1988;395:77–97. doi: 10.1113/jphysiol.1988.sp016909. [DOI] [PMC free article] [PubMed] [Google Scholar]
- Curtin NA, Edman KAP. Effects of fatigue and reduced intracellular pH on segment dynamics in ‘isometric' relaxation of frog muscle fibres. J Physiol (Camb) 1989;413:159–174. doi: 10.1113/jphysiol.1989.sp017647. [DOI] [PMC free article] [PubMed] [Google Scholar]
- Dawson MJ, Gadian DG, Wilkie DR. Mechanical relaxation rate and metabolism studied in fatiguing muscle by phosphorus nuclear magnetic resonance. J Physiol (Camb) 1980;299:465–484. doi: 10.1113/jphysiol.1980.sp013137. [DOI] [PMC free article] [PubMed] [Google Scholar]
- Edman KAP, Lou F. Changes in force and stiffness induced by fatigue and intracellular acidification in frog muscle fibres. J Physiol (Camb) 1990;424:133–149. doi: 10.1113/jphysiol.1990.sp018059. [DOI] [PMC free article] [PubMed] [Google Scholar]
- Fabiato A, Fabiato F. Effects of pH on the myofilaments and the sarcoplasmic reticulum of skinned cells from cardiac and skeletal muscles. J Physiol (Camb) 1978;276:233–255. doi: 10.1113/jphysiol.1978.sp012231. [DOI] [PMC free article] [PubMed] [Google Scholar]
- Fitts RH. Cellular mechanisms of muscle fatigue. Physiol Rev. 1994;74:49–94. doi: 10.1152/physrev.1994.74.1.49. [DOI] [PubMed] [Google Scholar]
- Godt RE, Nosek TM. Changes of intracellular milieu with fatigue or hypoxia depress contraction of skinned rabbit skeletal and cardiac muscle. J Physiol (Camb) 1989;412:155–180. doi: 10.1113/jphysiol.1989.sp017609. [DOI] [PMC free article] [PubMed] [Google Scholar]
- Gordon AM, Ridgway EB. Extra calcium on shortening in barnacle muscle. Is the decrease in calcium binding related to decreased cross-bridge attachment, force, or length? . J Gen Physiol. 1987;90:321–340. doi: 10.1085/jgp.90.3.321. [DOI] [PMC free article] [PubMed] [Google Scholar]
- Hibberd MG, Dantzig JA, Trentham DR, Goldman YE. Phosphate release and force generation in skeletal muscle fibers. Science (Wash DC) 1985;228:1317–1319. doi: 10.1126/science.3159090. [DOI] [PubMed] [Google Scholar]
- Hou, T.-T., J.D. Johnson, and J.A. Rall. 1993. Role of parvalbumin in relaxation of frog skeletal muscle. In Mechanism of Myofilament Sliding and Muscle Contraction. H. Sugi and G.H. Pollack, editors. Plenum Press, New York. 141–153. [DOI] [PubMed]
- Huxley, A.F., and R.M. Simmons. 1970. Rapid ‘give' and tension ‘shoulder' in the relaxation of frog muscle fibres. J. Physiol. (Camb.). 210:32–33P. (Abstr.). [PubMed]
- Iwamoto H. Strain sensitivity and turnover rate of low force cross-bridges in contracting skeletal muscle fibers in the presence of phosphate. Biophys J. 1995;68:243–250. doi: 10.1016/S0006-3495(95)80180-3. [DOI] [PMC free article] [PubMed] [Google Scholar]
- Josephson RK. Contraction dynamics and power output of skeletal muscle. Annu Rev Physiol. 1993;55:527–546. doi: 10.1146/annurev.ph.55.030193.002523. [DOI] [PubMed] [Google Scholar]
- Klein MG, Cheng H, Santana LF, Jiang Y-H, Lederer WJ, Schneider MF. Two mechanisms of quantized calcium release in skeletal muscle. Nature (Lond) 1996;379:455–458. doi: 10.1038/379455a0. [DOI] [PubMed] [Google Scholar]
- Klein MG, Kovacs L, Simon BJ, Schneider MF. Decline of myoplasmic Ca2+, recovery of calcium release and sarcoplasmic Ca2+pump properties in frog skeletal muscle. J Physiol (Camb) 1991;441:639–671. doi: 10.1113/jphysiol.1991.sp018771. [DOI] [PMC free article] [PubMed] [Google Scholar]
- Lamb GD, Recupero E, Stephenson DG. Effect of myoplasmic pH on excitation-contraction coupling in skeletal muscle fibres of the toad. J Physiol (Camb) 1992;448:211–224. doi: 10.1113/jphysiol.1992.sp019037. [DOI] [PMC free article] [PubMed] [Google Scholar]
- Lännergren J, Arner A. Relaxation rate of intact striated muscle fibres after flash photolysis of a caged calcium chelator (diazo-2) J Musc Res Cell Motil. 1992;13:630–634. doi: 10.1007/BF01738252. [DOI] [PubMed] [Google Scholar]
- Lännergren J, Elzinga G, Stienen GJM. Force relaxation, labile heat and parvalbumin content of skeletal muscle fibres of Xenopus laevis. . J Physiol (Camb) 1993;463:123–140. doi: 10.1113/jphysiol.1993.sp019587. [DOI] [PMC free article] [PubMed] [Google Scholar]
- Lännergren J, Westerblad H. Force and membrane potential during and after fatiguing, continuous high-frequency stimulation of single Xenopusmuscle fibres. Acta Physiol Scand. 1986;128:359–368. doi: 10.1111/j.1748-1716.1986.tb07989.x. [DOI] [PubMed] [Google Scholar]
- Lännergren J, Westerblad H. The temperature dependence of isometric contractions of single, intact fibres dissected from a mouse foot muscle. J Physiol (Camb) 1987;390:285–293. doi: 10.1113/jphysiol.1987.sp016700. [DOI] [PMC free article] [PubMed] [Google Scholar]
- Lännergren J, Westerblad H, Flock B. Transient appearance of vacuoles in fatigued Xenopusmuscle fibres. Acta Physiol Scand. 1990;40:437–445. doi: 10.1111/j.1748-1716.1990.tb09019.x. [DOI] [PubMed] [Google Scholar]
- Lattanzio FA., Jr The effects of pH and temperature on fluorescent calcium indicators as determined with Chelex-100 and EDTA buffer systems. Biochem Biophys Res Commun. 1990;171:102–108. doi: 10.1016/0006-291x(90)91362-v. [DOI] [PubMed] [Google Scholar]
- Lee JA, Westerblad H, Allen DG. Changes in tetanic and resting [Ca2+]i during fatigue and recovery of single muscle fibres from Xenopus laevis. . J Physiol (Camb) 1991;433:307–326. doi: 10.1113/jphysiol.1991.sp018427. [DOI] [PMC free article] [PubMed] [Google Scholar]
- Martyn DA, Gordon AM. Force and stiffness in glycerinated rabbit psoas fibers: effects of calcium and elevated phosphate. J Gen Physiol. 1992;99:795–816. doi: 10.1085/jgp.99.5.795. [DOI] [PMC free article] [PubMed] [Google Scholar]
- Metzger JM, Moss RL. Effects on tension and stiffness due to reduced pH in mammalian fast- and slow-twitch skinned skeletal muscle fibres. J Physiol (Camb) 1990;428:737–750. doi: 10.1113/jphysiol.1990.sp018238. [DOI] [PMC free article] [PubMed] [Google Scholar]
- Millar NC, Homsher E. The effect of phosphate and calcium on force generation in glycerinated rabbit skeletal muscle fibers. J Biol Chem. 1990;265:20234–20240. [PubMed] [Google Scholar]
- Moore GA, McConkey DJ, Kass GEN, O'Brien PJ, Orrenius S. 2,5-Di(tert-butyl)-1,4-benzohydroquinone: a novel inhibitor of liver microsomal Ca2+sequestration. FEBS Lett. 1987;224:331–336. doi: 10.1016/0014-5793(87)80479-9. [DOI] [PubMed] [Google Scholar]
- Nagesser AS, van der Laarse WJ, Elzinga G. ATP formation and ATP hydrolysis during fatiguing, intermittent stimulation of different types of single muscle fibres from Xenopus laevis. . J Musc Res Cell Motil. 1993;14:608–618. doi: 10.1007/BF00141558. [DOI] [PubMed] [Google Scholar]
- Palmer, R.E., S.J. Simnett, I.P. Mulligan, and C.C. Ashley. 1993. Phosphate slows the rate of relaxation of single skinned frog fibres upon photolysis of diazo-2. Biophys. J. 64:A251. (Abstr.).
- Phillips SK, Wiseman RW, Woledge RC, Kushmerick MJ. The effects of metabolic fuel on force production and resting inorganic phosphate levels in mouse skeletal muscle. J Physiol (Camb) 1993;462:135–146. doi: 10.1113/jphysiol.1993.sp019547. [DOI] [PMC free article] [PubMed] [Google Scholar]
- Potma EJ, van Graas IA, Stienen GJM. Influence of inorganic phosphate and pH on ATP utilization in fast and slow skeletal muscle fibers. Biophys J. 1995;69:2580–2589. doi: 10.1016/S0006-3495(95)80129-3. [DOI] [PMC free article] [PubMed] [Google Scholar]
- Ritchie JM. The effect of nitrate on the active state of muscle. J Physiol (Camb) 1954;126:155–168. doi: 10.1113/jphysiol.1954.sp005200. [DOI] [PMC free article] [PubMed] [Google Scholar]
- Shirokova N, García J, Pizarro G, Ríos E. Ca2+release from the sarcoplasmic reticulum compared in amphibian and mammalian skeletal muscle. J Gen Physiol. 1996;107:1–18. doi: 10.1085/jgp.107.1.1. [DOI] [PMC free article] [PubMed] [Google Scholar]
- Simonides WS, van Hardeveld C. An assay for sarcoplasmic reticulum Ca2+-ATPase activity in muscle homogenates. Anal Biochem. 1990;191:321–331. doi: 10.1016/0003-2697(90)90226-y. [DOI] [PubMed] [Google Scholar]
- Swartz DR, Moss RL, Greaser ML. Calcium alone does not fully activate the thin filament for S1 binding to rigor myofibrils. Biophys J. 1996;71:1891–1904. doi: 10.1016/S0006-3495(96)79388-8. [DOI] [PMC free article] [PubMed] [Google Scholar]
- Volpe P, Bravin M, Zorzato F, Margreth A. Isolation of terminal cisternae of frog skeletal muscle. J Biol Chem. 1988;263:9901–9907. [PubMed] [Google Scholar]
- Westerblad H, Allen DG. Changes in myoplasmic calcium concentration during fatigue in single mouse muscle fibers. J Gen Physiol. 1991;98:615–635. doi: 10.1085/jgp.98.3.615. [DOI] [PMC free article] [PubMed] [Google Scholar]
- Westerblad H, Allen DG. Changes of intracellular pH during repeated tetani in single mouse skeletal muscle fibres. J Physiol (Camb) 1992;449:49–71. doi: 10.1113/jphysiol.1992.sp019074. [DOI] [PMC free article] [PubMed] [Google Scholar]
- Westerblad H, Allen DG. The influence of pH on contraction, relaxation and [Ca2+]iin intact single fibres from mouse muscle. J Physiol (Camb) 1993a;466:611–628. [PMC free article] [PubMed] [Google Scholar]
- Westerblad H, Allen DG. The role of [Ca2+]iin the slowing of relaxation in fatigued single fibres from mouse skeletal muscle. J Physiol (Camb) 1993b;46:729–740. doi: 10.1113/jphysiol.1993.sp019797. [DOI] [PMC free article] [PubMed] [Google Scholar]
- Westerblad H, Allen DG. The role of sarcoplasmic reticulum in relaxation of mouse muscle; effects of 2,5-di(tert- butyl)-1,4-benzohydroquinone. J Physiol (Camb) 1994a;474:291–301. doi: 10.1113/jphysiol.1994.sp020022. [DOI] [PMC free article] [PubMed] [Google Scholar]
- Westerblad H, Allen DG. Relaxation, [Ca2+]i and [Mg2+]iduring prolonged tetanic stimulation of intact, single fibres from mouse skeletal muscle. J Physiol (Camb) 1994b;480:31–43. doi: 10.1113/jphysiol.1994.sp020338. [DOI] [PMC free article] [PubMed] [Google Scholar]
- Westerblad H, Allen DG. Slowing of relaxation and [Ca2+]i during prolonged tetanic stimulation of single fibres from Xenopusskeletal muscle. J Physiol (Camb) 1996a;492:723–736. doi: 10.1113/jphysiol.1996.sp021341. [DOI] [PMC free article] [PubMed] [Google Scholar]
- Westerblad H, Allen DG. Intracellular calibration of the calcium indicator indo-1 in isolated fibers of Xenopusmuscle. Biophys J. 1996b;71:908–917. doi: 10.1016/S0006-3495(96)79294-9. [DOI] [PMC free article] [PubMed] [Google Scholar]
- Westerblad H, Lännergren J. Force and membrane potential during and after fatiguing, intermittent stimulation of single Xenopusmuscle fibres. Acta Physiol Scand. 1986;128:369–378. doi: 10.1111/j.1748-1716.1986.tb07990.x. [DOI] [PubMed] [Google Scholar]
- Westerblad H, Lännergren J. The relation between force and intracellular pH in fatigued, single Xenopusmuscle fibres. Acta Physiol Scand. 1988;133:83–89. doi: 10.1111/j.1748-1716.1988.tb08383.x. [DOI] [PubMed] [Google Scholar]
- Westerblad H, Lännergren J. Decreased Ca2+ buffering contributes to slowing of relaxation in fatigued Xenopusmuscle fibres. Acta Physiol Scand. 1990;139:243–244. doi: 10.1111/j.1748-1716.1990.tb08918.x. [DOI] [PubMed] [Google Scholar]
- Westerblad H, Lännergren J. Slowing of relaxation during fatigue in single mouse muscle fibres. J Physiol (Camb) 1991;434:323–336. doi: 10.1113/jphysiol.1991.sp018472. [DOI] [PMC free article] [PubMed] [Google Scholar]
- Westerblad H, Lännergren J. Changes of the force- velocity relation, isometric tension and relaxation rate during fatigue in intact, single fibres of Xenopusskeletal muscle. J Musc Res Cell Motil. 1994;15:287–298. doi: 10.1007/BF00123481. [DOI] [PubMed] [Google Scholar]
- Williams JH, Ward CW, Klug GA. Fatigue-induced alterations in Ca2+and caffeine sensitivities of skinned muscle fibres. J Appl Physiol. 1993;75:586–593. doi: 10.1152/jappl.1993.75.2.586. [DOI] [PubMed] [Google Scholar]