

Abstract
The cystic fibrosis transmembrane conductance regulator forms an anion-selective channel; the site and mechanism of charge selectivity is unknown. We previously reported that cysteines substituted, one at a time, for Ile331, Leu333, Arg334, Lys335, Phe337, Ser341, Ile344, Arg347, Thr351, Arg352, and Gln353, in and flanking the sixth membrane-spanning segment (M6), reacted with charged, sulfhydryl-specific, methanethiosulfonate (MTS) reagents. We inferred that these residues are on the water-accessible surface of the protein and may line the ion channel. We have now measured the voltage-dependence of the reaction rates of the MTS reagents with the accessible, engineered cysteines. By comparing the reaction rates of negatively and positively charged MTS reagents with these cysteines, we measured the extent of anion selectivity from the extracellular end of the channel to eight of the accessible residues. We show that the major site determining anion vs. cation selectivity is near the cytoplasmic end of the channel; it favors anions by ∼25-fold and may involve the residues Arg347 and Arg352. From the voltage dependence of the reaction rates, we calculated the electrical distance to the accessible residues. For the residues from Leu333 to Ser341 the electrical distance is not significantly different than zero; it is significantly different than zero for the residues Thr351 to Gln353. The maximum electrical distance measured was 0.6 suggesting that the channel extends more cytoplasmically and may include residues flanking the cytoplasmic end of the M6 segment. Furthermore, the electrical distance calculations indicate that R352C is closer to the extracellular end of the channel than either of the adjacent residues. We speculate that the cytoplasmic end of the M6 segment may loop back into the channel narrowing the lumen and thereby forming both the major resistance to current flow and the anion-selectivity filter.
Keywords: ion channel, charge selectivity, methanethiosulfonate, MDR, STE6
introduction
Cystic fibrosis transmembrane conductance regulator (CFTR)1 forms a chloride channel whose gating is regulated by phosphorylation by protein kinase A (Cheng et al., 1991; Tabcharani et al., 1991; Berger et al., 1993; Chang et al., 1993; Hwang et al., 1993; Seibert et al., 1995) and by ATP binding and hydrolysis at the nucleotide binding folds (Anderson et al., 1991a ; Smit et al., 1993; Baukrowitz et al., 1994; Hwang et al., 1994; Carson et al., 1995; Gunderson and Kopito, 1995). CFTR is a member of the ATP-binding cassette membrane transporter superfamily. Amino acid sequence analysis suggests that CFTR is formed by two repeats; each repeat contains six membrane-spanning segments and a nucleotide-binding fold (NBF) (Riordan et al., 1989). The two domains are connected by a cytoplasmic regulatory domain (R-domain) (Fig. 1 A).
Figure 1.

Predicted transmembrane topology of CFTR and α-helical representations of the MTS accessible residues in and flanking the M6 membrane-spanning segment. (A) The predicted transmembrane topology of CFTR (Riordan et al., 1989). NBD, nucleotide binding domain. (B) α-Helical net representation of the residues in and flanking the M6 membrane-spanning segment. The extracellular end is at the top, the intracellular end is at the bottom. The x-axis represents position on the circumference of the helix. Residues that are aligned vertically are on the same face of the helix. The residues Lys329 to Ile332 are not drawn as part of the helix to indicate that they are likely to be in the loop connecting the M5 and M6 segments. Based on the original hydrophobicity analysis the M6 segment included residues Gly330 to Val350 (Riordan et al., 1989). (C) α-Helical wheel representation of the residues in and flanking the M6 membrane-spanning segment. In B and C black squares indicate residues that are accessible to the MTS reagents, and open circles indicate residues that were unaffected by the MTS reagents (Cheung and Akabas, 1996).
The molecular determinants of the conductance and anion selectivity of the CFTR channel are not well established. CFTR is an anion-selective channel (Riordan, 1993; Gadsby et al., 1995). Based on bi-ionic permeability measurements, CFTR is not ideally anion selective. The permeability of chloride relative to the permeability of sodium (PCl/PNa) is reported to be between 10 and 20 (Anderson et al., 1991b ; Bear et al., 1991; Tabcharani et al., 1991; Bear et al., 1992). Based on the presence of anomalous mole-fraction effects the CFTR channel was inferred to have multiple anion-binding sites (Tabcharani et al., 1993). Mutation of Arg347 to His resulted in pH-dependent anomalous mole-fraction effects, indicating that the positive charge at this position was important and that Arg347 was at or near one of the anion-binding sites (Tabcharani et al., 1993). The mutation R347E, however, had little or no effect on the halide permeability or conductance sequences (Anderson et al., 1991b ). In contrast, the mutation K335E changed the halide permeability and/or conductance sequences (Anderson et al., 1991b ) but did not alter the anomalous mole-fraction effects (Tabcharani et al., 1993).
To investigate the structure of the CFTR channel, we have used the scanning-cysteine-accessibility method (Akabas et al., 1992; Akabas et al., 1994a ) to identify the water-accessible residues in the M1 and M6 membrane-spanning segments (Akabas et al., 1994b ; Cheung and Akabas, 1996). In the M6 segment, we previously showed that cysteines substituted for Ile331, Leu333, Arg334, Lys335, Phe337, Ser341, Ile344, Arg347, Thr351, Arg352, and Gln353 reacted with charged, hydrophilic, lipophobic, sulfhydryl-specific methanethiosulfonate (MTS) reagents (Fig. 1, B and C; Cheung and Akabas, 1996). We inferred that most of the corresponding wild-type residues line the channel and are likely candidates for interaction with permeating ions. As with any study involving site-directed mutagenesis, the assumption that the accessibility of the engineered cysteine accurately reflects the accessibility of the corresponding wild-type residue is based on the assumption that the mutation does not alter the structure of the protein.
To investigate the functional role of the exposed residues, we determined the voltage dependence of the rate constants of the reactions of the MTS reagents with eight of the exposed cysteine-substitution mutants that were accessible to both negatively and positively charged MTS reagents. From these experiments we have determined the charge selectivity of the access pathway to these exposed residues as well as the electrical distance from the extracellular end of the channel to these exposed residues.
The MTS reagents that we used include the negatively charged MTS - ethylsulfonate (MTSES−, CH3SO2 SCH2CH2 SO3 −) and the positively charged MTS-ethyltrimethylammonium (MTSET+, CH3SO2SCH2CH2N(CH3)3 +) and MTS-ethylammonium (MTSEA+, CH3SO2SCH2CH2NH3 +) (Akabas et al., 1992; Stauffer and Karlin, 1994). In reactions with free sulfhydryls, the MTS reagents form mixed disulfides adding the charged portion −SCH2 CH2X of the MTS reagent onto the cysteine, where X is SO3 − for MTSES−, N(CH3)3 + for MTSET+ and NH3 + for MTSEA+.
materials and methods
Oligonucleotide-mediated Mutagenesis
Generation of the cysteine-substitution mutants has been described previously (Cheung and Akabas, 1996). The cDNA encoding human CFTR in the pBluescript KS(−) vector (CFTR-pBS) was obtained from Genzyme Corp. (Dr. Alan Smith, Cambridge, MA).
Preparation of mRNA and Oocytes
For in vitro mRNA transcription CFTR-pBS was linearized with SmaI and mRNA was synthesized. Oocytes from Xenopus laevis were prepared and maintained as described previously (Akabas et al., 1992). 1 d after the oocytes were harvested, they were injected with 50 nl of mRNA (200 pg/nl). Experiments were performed 1–6 d after mRNA injection.
Sulfhydryl Reagents
The MTS reagents were synthesized as described previously (Stauffer and Karlin, 1994).
Electrophysiology
The reactions between each engineered cysteine and the MTS reagents were assayed using the following protocol. Oocytes were maintained under two-electrode voltage clamp. After the initial impalement of the oocytes the background currents were generally <500 nA at −100 mV and generally <15% of the cAMP-stimulated current. The background currents tend to be somewhat higher (30–50%) in CFTR-injected oocytes than we observed in oocytes injected with either the GABAA or the nicotinic acetylcholine receptor, although this varies with different batches of oocytes. These currents may represent baseline activation of CFTR due to the endogenous levels of cAMP.
The CFTR chloride current was activated by application of a solution containing 200 μM 8-(4-chlorophenylthio) adenosine cyclic monophosphate, 1 mM 3-isobutyl-1-methylxanthine, and 20 μM forskolin to the extracellular bath; this is subsequently referred to as cAMP-activating solution. The holding potential was maintained at −10 mV. Periodically (approximately every 5 min) the holding potential was ramped from −120 to +50 mV over 1.7 s and the current was recorded. From the resulting current-voltage relationship the magnitude of the CFTR-induced current at −100 mV and the reversal potential were determined. When the CFTR-induced current approached a plateau, the membrane potential was clamped at −25, −50, or −75 mV. An MTS reagent was applied in the cAMP-activating solution, and the subsequent current was recorded (Fig. 2 A). For 10 s preceding and for 60– 180 s after the application of the MTS reagents, currents were recorded (Fig. 2 B) by a digital computer using a Dagan 8500 amplifier (Dagan Corp., Minneapolis, MN) and a TL1-125 data interface (Axon Instruments, Foster City, CA). The MTS reagents were mixed with buffer immediately before application and were applied at the following concentrations: 5 mM MTSES−, 0.5 mM MTSET+, or 1.25 mM MTSEA+.
Figure 2.

Activation of T351C mutant and effect of MTSEA+. (A) Illustration of the activation of the CFTR-induced current in an oocyte expressing the T351C mutant under two-electrode voltage clamp. At the arrow marked cAMP the cAMP-activating solution was perfused into the bath. The currents are normalized by the final value 3,281 nA. (B) Continuous recording of current response from oocyte before and after the addition of 1.25 mM MTSEA+ in the cAMP-activating solution to the bath. Currents were recorded from the same oocyte as in A. Holding potential −25 mV.
CFTR-induced currents were recorded from individual oocytes under two-electrode voltage-clamp as described previously (Cheung and Akabas, 1996). Electrodes were filled with 3 M KCl and had a resistance of <2 megaohms. The ground electrode was connected to the bath via a 3 M KCl/agar bridge. During experiments, the oocytes were maintained in Ca2+-free frog Ringer solution (115 mM NaCl, 2.5 mM KCl, 1.8 mM MgCl2, 10 mM HEPES, pH 7.5, with NaOH) at room temperature.
Determination of the MTS Reaction Rate Constants
To determine the reaction rate constants we assume that the rate of inhibition of the CFTR current by the MTS reagent reflects the rate of reaction. Furthermore, we assume that the concentration of the MTS reagent does not change significantly during the reaction and, therefore, we can determine a pseudo–first-order rate constant from the rate of change of the CFTR current. The pseudo–first-order rate constant was determined by fitting the current drop after the addition of the MTS reagent with a single exponential decay function. The second-order rate constants were calculated by dividing the pseudo–first-order rate constants by the concentration of the applied MTS reagent. All curve fitting and linear regressions were performed with routines provided by the Origin program (Microcal Software Inc., Northampton, MA).
Statistics
Data are presented as means ± SEM. Statistical significance was determined by one-way analysis of variance by Duncan's post hoc test (P < 0.05) using the SPSS for Windows statistical analysis program (SPSS, Inc., Chicago, IL).
Theory
Analysis of the voltage-dependence of the MTS reaction rate constants.
The reaction of an MTS reagent with a channel-lining engineered cysteine consists of two steps. In the first step, the MTS reagent moves from bulk solution into the channel to the level of the engineered cysteine. In the second step, the MTS reagent reacts with the thiolate of the engineered cysteine. Because the MTS reagents are charged, the first step, movement through the channel, should be dependent on the membrane potential. If the first step is slower than the second step, and hence rate limiting, then, the second-order rate constant for the overall reaction should be voltage dependent. (These assumptions are similar to those used to analyze proton block of sodium currents [Woodhull, 1973].) The magnitude of the voltage dependence will be determined by the fraction of the electrical potential through which the charge on the MTS reagent moves in order to reach the cysteine residue. The electrical distance, δ, can be calculated by fitting the rate constants as a function of membrane potential with the Boltzmann relationship (Eq. 1). Thus, the second-order rate constant k (ψ) determined at a membrane potential, ψ, should be:
 |
1 |
where, k (ψ=0) is the rate constant at a membrane potential of 0 mV, z is the charge on the MTS reagent, F is Faraday's constant, δ is the electrical distance (i.e., the fraction of the electrical potential traversed by the charge on the MTS reagent), ψ is the membrane potential, R is the gas constant, and T is the temperature in degrees Kelvin. The influence of the electrostatic potential arising from fixed charges, dipoles, etc. in the protein enters into k (ψ=0), the rate constant at 0 mV. It is these forces that determine the anion selectivity of the access pathway. The influence of the applied transmembrane potential on the rate constant enters into the exponent of the Boltzmann equation (Eq. 1). Thus, the effects of these two potentials on the rates of reaction can be separated. For a given channel-lining cysteine and MTS reagent, we plotted the natural log of k (ψ) vs. ψ and fit the data by linear regression with the equation:
 |
2 |
We calculated the electrical distance, δ, from the extracellular end of the channel to the cysteine by dividing the slope of the fit by zF/RT. Furthermore, by extrapolation of the fit to ψ = 0 mV we calculated k (ψ=0).
results
Reaction Rate Constants
The reaction rate constants of the MTS reagents with the substituted cysteines exposed in M6 were determined from experiments similar to those illustrated in Figs. 2 and 3 A for the mutant T351C. After activation of the CFTR-induced current, the voltage was clamped at −25, −50, or −75 mV, and the MTS reagent was added while recording the current response. The pseudo–first-order rate constant was determined by fitting the current drop following the addition of the MTS reagent with a single exponential decay function. The second-order rate constants were calculated by dividing the pseudo–first-order rate constants by the concentration of the applied MTS reagent. The second-order rate constants for the mutants tested at three membrane potentials with MTSES−, MTSEA+, and MTSET+ are summarized in Table I. We did not measure the reaction rate constants for the most extracellular residue, I331C, because we thought that it was unlikely that the reaction rates would be voltage dependent given the absence of voltage dependence at the adjacent, more cytoplasmic residues. We also did not measure the reaction rate constants for the mutants I344C and R347C because, although MTSEA+ reacted with these residues, MTSES− and MTSET+ did not react with these residues and therefore we could not determine the charge selectivity at these positions.2
Figure 3.
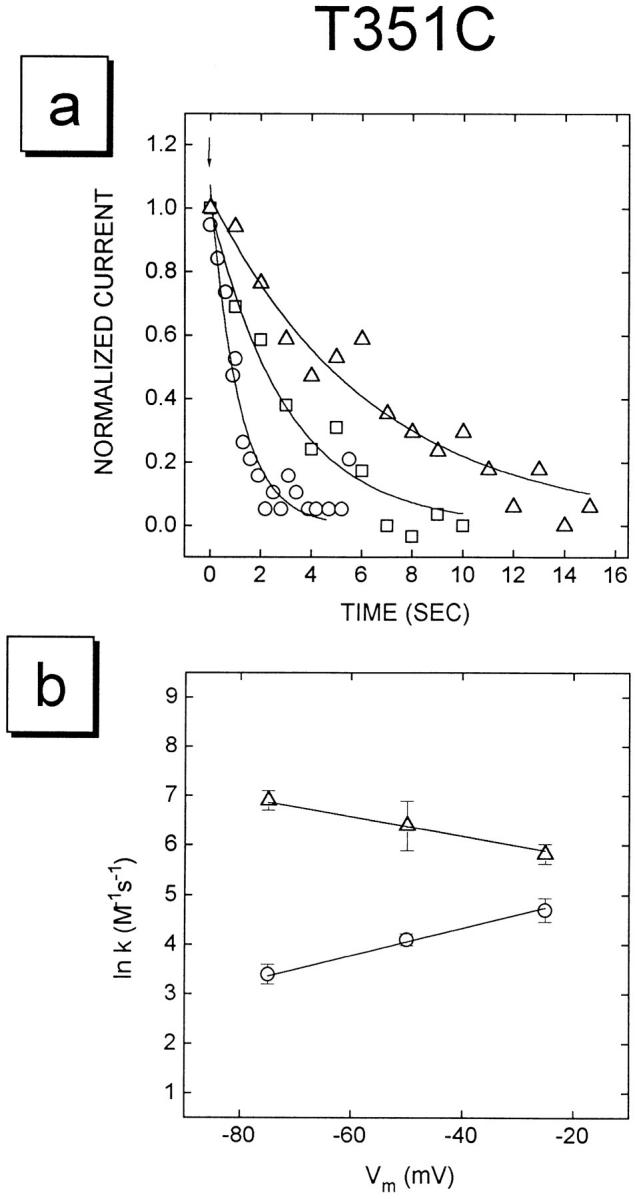
Experiments illustrating data used to determine rates of reaction of the MTS reagents with the T351C mutant. (A) The currents following the addition of 5 mM MTSES− to three oocytes voltage clamped at −25 (open circles), −50 (open squares), and −75 mV (open triangles) are shown. At the downward arrow MTSES was added. The open symbols are a subset of the digitized data points. The solid lines were determined by fitting single exponential decay functions to the experimental data. The currents have been normalized to the initial values. (B) The natural log of the rate constants, k, for MTSES− (circles) and MTSET+ (triangles) reacting with the T351C mutant are plotted as a function of voltage. Solid lines show the linear regression fits to the data points. Note that, as expected, the rate of reaction of the anionic reagent decreases and the rate of reaction of the cationic reagent increases with more negative voltage.
Table I.
Second-order Rate Constants for the Reaction of the MTS Reagents with the Water-exposed Cysteine Mutants
| k ES (M−1s−1) | k EA (M−1s−1) | k ET (M−1s−1) | ||||||||||||||||
|---|---|---|---|---|---|---|---|---|---|---|---|---|---|---|---|---|---|---|
| mutant | −25 mV | −50 mV | −75 mV | −25 mV | −50 mV | −75 mV | −25 mV | −50 mV | −75 mV | |||||||||
| L333C | 71 ± 3(3) | 71 ± 20(2) | 71 ± 23(3) | 320 ± 89(2) | 320 ± 128(2) | 333 ± 139(3) | 952 ± 136(2) | 1,000 ± 350(2) | 1,053 ± 443(2) | |||||||||
| R334C | 48 ± 14(2) | 48 ± 6(3) | 44 ± 8(4) | 145 ± 32(2) | 163 ± 7(2) | 182 ± 21(3) | 444 ± 49(2) | 454 ± 124(2) | 588 ± 95(3) | |||||||||
| K335C | 36 ± 20(3) | 23 ± 11(3) | 27 ± 16(3) | 222 ± 80(3) | 121 ± 51(4) | 107 ± 30(3) | 217 ± 111(3) | 235 ± 28(3) | 217 ± 95(4) | |||||||||
| F337C | 91 ± 17(2) | 80 ± 22(3) | 71 ± 20(4) | 222 ± 74(2) | 222 ± 86(3) | 285 ± 81(3) | 740 ± 246(3) | 740 ± 82(2) | 714 ± 51(2) | |||||||||
| S341C | 56 ± 18(3) | 56 ± 40(2) | 43 ± 12(3) | 93 ± 6(3) | 110 ± 22(3) | 138 ± 34(3) | 690 ± 356(3) | 556 ± 246(3) | 800 ± 224(4) | |||||||||
| T351C | 100 ± 25(5) | 57 ± 6(3) | 26 ± 9(6) | 146 ± 30(4) | 195 ± 42(4) | 296 ± 18(3) | 308 ± 47(10) | 392 ± 78(6) | 769 ± 89(5) | |||||||||
| R352C | 42 ± 4(3) | 26 ± 4(5) | 21 ± 6(4) | 105 ± 76(3) | 137 ± 46(3) | 205 ± 58(2) | 417 ± 138(4) | 800 ± 128(2) | 952 ± 408(2) | |||||||||
| Q353C | 125 ± 23(4) | 51 ± 12(4) | 42 ± 8(4) | 83 ± 24(4) | 116 ± 42(4) | 160 ± 92(3) | 189 ± 48(6) | 220 ± 48(3) | 625 ± 273(4) | |||||||||
The reaction rate constants that we have measured are between 10- and 500-fold slower than the rates of reaction with sulfhydryls in free solution (Table II) (Stauffer and Karlin, 1994). The rates are, however, ∼10-fold faster than rates of reaction with cysteines in the binding site crevice of the dopamine D2 receptor (Javitch et al., 1995). The rate constants that we measured combine the rate of access of the MTS reagents from bulk solution to a position in the channel adjacent to the engineered cysteine and the rate of the actual reaction between the MTS reagent and the cysteine. We assume that the rate of the second step, the covalent reaction, is similar to the rate of reaction of the MTS reagents with sulfhydryls in free solution. The slowness of the measured rates compared to the rates in free solution therefore implies that the rate of access is slow. Furthermore, the voltage dependence of the rates of reaction of MTSES− is opposite to the voltage dependence of the rates of MTSET+ (Fig. 3 B). The simplest interpretation of this is that the rate of access is the rate-limiting and voltage-dependent step and that the pathway from the extracellular solution to the engineered cysteine is through the channel. If the voltage dependence arose from a change in accessibility of the cysteine due to voltage-dependent gating modes (Fischer and Machen, 1994) or to a change in the ionization state of the cysteine, we would not expect the opposite dependence on the voltage of the reaction rates of oppositely charged compounds that we observed. Thus, these results are consistent with our assumption (in the Theory section) that movement into and through the CFTR channel constitutes the rate-limiting step for the reaction of the MTS reagents.
Table II.
Second-order Rate Constants at Holding Potential = 0 mV and Ratios of Rate Constants at V = 0 mV (kmtses/kmtset)
| 1 | 2* k 0,MTSES | 3* k 0,MTSET | 4‡ k 0,MTSES | 5§ k ES/k ET | ||||
|---|---|---|---|---|---|---|---|---|
| Mutant | (M−1 S−1) | (M−1 S−1) | k 0,MTSET | L333C | ||||
| 2-ME‖ | 4300 | 51000 | 0.08 | 1 | ||||
| L333 | 68 | 828 | 0.08 | 1 | ||||
| R334 | 53 | 376 | 0.14 | 2 | ||||
| K335 | 47 | 455 | 0.1 | 1 | ||||
| F337 | 96 | 991 | 0.1 | 1 | ||||
| S341 | 72 | 727 | 0.1 | 1 | ||||
| T351 | 250 | 219 | 1.14 | 14 | ||||
| R352 | 48 | 324 | 0.15 | 2 | ||||
| Q353 | 213 | 102 | 2.09 | 26 |
Columns 2, 3 are the rate constants for MTSES− and MTSET+ at V = 0 mV.
Column 4 is the ratio of the rate constants k 0,mtses/k 0,mtset. Note the difference in the intrinsic rates of reaction of MTSES− and MTSET+ with 2-mercaptoethanol in solution. The same ratio is observed for the rates of reaction with L333C indicating that there is no charge selectivity for the reaction with this residue.
Column 5 is the anion to cation selectivity ratio derived by dividing the data in Column 4 by the ratio obtained for the rates of reaction with L333C. The ratio of the rate constants (k mtses/k mtset) for reaction with an exposed cysteine relative to the ratio of the rate constants for the reaction with L333C gives a measure of the anion to cation selectivity at the level of an exposed cysteine. Towards the cytoplasmic end of the M6 segment the selectivity ratio approaches the measured permeability ratio of C1−/Na+ which is about 10–20.
2-ME, 2-mercaptoethanol; data from Stauffer & Karlin, 1994.
Electrical Distance to MTS Accessible Residues
From the voltage dependence of the rate constants we have determined the electrical distance from the extracellular end of the channel to each exposed residue. In Fig. 3 B the natural log of the rate constants for the reactions of MTSES− and MTSET+ with the mutant T351C are plotted as a function of membrane potential. As expected, as the membrane potential becomes more negative the rate constants for the cationic reagent (MTSET+) increase and the rate constants for the anionic reagent (MTSES−) decrease. For MTSES− and MTSET+ reacting with each residue, the electrical distance, δ, is calculated from the slope of the linear regression fits and is plotted in Fig. 4 A.3 There is a good correlation between the electrical distances calculated for the two reagents. The average electrical distance to each residue is plotted in Fig. 4 B. Note that the electrical distance to the residues from L333C to S341C is close to zero and that the electrical distance to R352C is smaller than the electrical distance to the adjacent residues. Furthermore, the maximum electrical distance measured is ∼0.6. This implies that the channel, and the electric field, extends beyond the position of these residues at the cytoplasmic end of the M6 segment.
Figure 4.

Electrical distance from the extracellular end of the channel to the water exposed residues in the M6 membrane-spanning segment. (A) The electrical distance calculated from the voltage dependence of the reaction of MTSES (black bars) and MTSET (gray bars) with water- accessible cysteine residues. (B) The average electrical distance to the water exposed residues in the M6 segment. The distance from the extracellular end to T351C and Q353C is significantly greater than to the other residues (P < 0.05).
Anion Selectivity of the Reaction of the MTS Reagents with Exposed Residues
We have determined the charge selectivity of the access pathway through the channel to each exposed residue by comparing the reaction-rate constants of the negatively and positively charged MTS reagents at zero membrane potential. The reaction-rate constants at a membrane potential of 0 mV, k (ψ=0), (Table II, columns 2 and 3), are calculated from the y-intercept of the linear regression fit of Eq. 2 to the data in Table I. k (ψ=0) has two major determinants. One is due to the ion selectivity of the access pathway. This may arise from the intrinsic electrostatic potential in the channel due to the protein and from specific interactions among permeating ions, waters of hydration, and channel-lining residues (Andersen and Koeppe, 1992). The second electrostatic effect is due to the fact that the MTS reagents react with the ionized thiolate (RS−) form of cysteine (Roberts, et al., 1986; Stauffer and Karlin, 1994): The cationic MTS reagents, therefore, react faster with small sulfhydryls in solution, such as 2-mercaptoethanol, than does the anionic reagent; the ratio of the rates of reaction of MTSES−/MTSET+ with 2-mercaptoethanol is 0.08 (Stauffer and Karlin, 1994). For the reaction of the MTS reagents with the most extracellular residue tested, L333C, the ratio of the rates of reaction of MTSES−/MTSET+ is also 0.08 (Table II, column 4); this suggests that there is no charge selectivity for access of the MTS reagents to this residue from the extracellular solution. To account for this difference in the intrinsic rates of reaction of the two MTS reagents, we divided the ratio of the rates at a given residue by the ratio of the rates of reaction with L333C. In addition, by taking the ratio of the rates of reaction we factored out differences in the extent of ionization of each engineered cysteine which might vary due to the local environment (Honig and Sharp, 1995). Thus, the ratio of the ratios gives a measure of the anion selectivity of the pathway from the extracellular solution to an exposed cysteine residue. The ratio of the ratios for MTSES−/MTSET+ is plotted in Fig. 5 and shown in Table II, column 5. An anion selectivity ratio of 1 indicates no selectivity for anions over cations, the larger the ratio the greater the anion selectivity. Entry into the extracellular end of the channel seems to be nonselective. The major site of charge selectivity appears to be in the region of T351C and Q353C where the anion to cation selectivity rises to between 15 and 25 (Fig. 5). It is interesting to note that at these two residues the rate of reaction of the anionic reagent, MTSES−, increases compared to the rate of reaction with the other channel-lining residues (Table II, column 2). This region may form an anion binding site where the residence time of the MTSES− is increased leading to the observed increase in the rate of reaction. Furthermore, the rate of reaction of the cationic reagent, MTSET+, with these two residues is decreased compared to the rates of reaction with the other channel-lining residues (Table II, column 3).
Figure 5.

Anion to cation selectivity ratio determined from the relative rates of reaction of MTSES− and MTSET+ with the water exposed residues in the M6 segment. The anion selectivity ratio is calculated as described in Table II, column 5. Note the marked increase in anion selectivity at the residues T351C and Q353C. A ratio of 1 indicates no selectivity between anions and cations. The larger the ratio the greater the anion selectivity.
discussion
We have measured the voltage dependence of the rates of reaction of the MTS reagents with cysteines substituted for eight residues on the water accessible surface of CFTR in and flanking the M6 membrane-spanning segment (Fig. 1 B). From the extracellular end of the channel to the level of Ser341 there is little or no anion selectivity (Fig. 5). A major determinant of anion selectivity is located at the cytoplasmic end of the channel and may involve the residues Arg347 and Arg352 (Fig. 5). We also infer that the electrical potential may not fall linearly along the length of the M6 segment (Fig. 4). Most of the potential appears to fall in the cytoplasmic half of the M6 segment. This suggests that the major resistance to ion movement through the channel is in the cytoplasmic half of the channel. Alternatively, the channel-lining may include residues that are more COOH-terminal than the predicted M6 segment.
Based on the accessibility of three consecutive residues at the cytoplasmic end of the M6 segment, Thr351 to Gln353, we previously inferred that the secondary structure in this region was not α-helical (Cheung and Akabas, 1996). We now show that based on the measured electrical distances R352C appears to be closer to the extracellular end of the channel than either of the adjacent residues. This suggests that residues flanking the cytoplasmic end of the M6 segment may loop back into the channel lumen and line the narrow region of the channel. The ability of the MTS reagents to penetrate from the extracellular end of the channel to the level of Gln353 implies that the diameter of this portion of the channel is at least 0.6 nm. A narrower region of the channel may exist at a more cytoplasmic position and may form the size-selectivity filter. This hypothesis is consistent with the results of Linsdell and Hanrahan (1996) who found that poorly permeant anions and sucrose caused a rapid flickery block when applied to the cytoplasmic end of the channel but had little effect when applied from the extracellular end. This suggests that while the current-voltage relationship of the channel is linear the ends of the channel are asymmetric with respect to their interaction with anions and sucrose.
Location of the Anion-selectivity Filter
The CFTR channel is not ideally anion selective. By measuring the relative rates of reaction of anionic and cationic MTS reagents with water-exposed cysteines in and flanking the M6 segment we have shown that a major determinant of anion selectivity occurs near the cytoplasmic end of the channel; access of the negatively charged MTSES− to T351C and Q353C is favored over the positively charged MTSET+ (Fig. 5). Because the size of these two reagents is similar the differences in the rates of reaction are most likely due to the opposite charge of the reagents. It is likely that the region flanking the cytoplasmic end of the M6 segment forms an anion binding site. Consistent with this, the reaction rate constants for the reaction of MTSES− with T351C and Q353C are larger than the rates with other channel-lining residues (Table II, column 2). This suggests that the residence time of MTSES− is longer here consistent with a binding site.
The arginine that lies between T351C and Q353C, Arg352, appears to be a major determinant of the anion selectivity in this region; when cysteine is substituted for the arginine at position 352 the selectivity is similar to that observed in the rest of the channel (Fig. 5). If other residues in this region were the main determinants of anion selectivity, then, the anion selectivity of the R352C mutant should have been similar to that of the adjacent residues. Based on our measurements of electrical distance, R352C is closer to the extracellular end of the channel than T351C and Q353C (Fig. 4, see below). Thus, ions passing from the extracellular end of the channel would first encounter Arg352, which we infer forms part of the charge-selectivity filter, before they could reach T351C or Q353C; thereby accounting for the greater anion selectivity we observed at these residues.
The halide selectivity sequence observed for CFTR, Br− > Cl− > I− > F− (Anderson et al., 1991b ), implies that the channel contains a moderately strong anion binding site (Wright and Diamond, 1977; Eisenman and Horn, 1983; Hille, 1992). Hanrahan and co-workers observed anomalous mole-fraction effects with solutions of Cl− and SCN− and concluded that CFTR was a multiple ion occupancy channel and that Arg347 was at or near an anion binding site (Tabcharani, et al., 1993); perhaps the anion-binding site(s) is formed by Arg347 and Arg352 and acting together they may form the charge selectivity filter. The increase in the reaction rate constants for MTSES− with the mutants T351C and Q353C (Table II, column 2) is consistent with these residues being near an anion binding site which increases the dwell time of MTSES− in this region of the channel thereby effectively increasing the reaction rate constants. A further suggestion that Arg352 is important in charge selectivity is the increase in the reaction rate of the cationic MTSET+ with the R352C mutant as compared to the adjacent residues (Table II, column 3). Removing the positive charge in the R352C mutant may increase the ability of cations to enter this region near the cytoplasmic end of the channel, thereby accounting for the increase rate of reaction of MTSET+ at R352C compared to the adjacent residues. Further experiments will be necessary to assess the relative contributions of Arg347 and Arg352 to charge selectivity.
Our measurements of anion selectivity reflect the location of the selectivity filter for charged MTS reagents. These reagents, which would fit into a right cylinder 0.6 nm in diameter and 1 nm in length, are larger than a typical permeating anion such as Cl−, which is ∼0.36 nm in diameter. In addition, we do not know whether the MTS reagents are permeable through the CFTR channel, although they are able to penetrate from the extracellular end as far as Gln353. It remains to be shown that selectivity for small monovalent ions such as Cl− and Na+ is determined by the same residues that determine selectivity for the MTS reagents. Experiments are in progress to address this issue.
The ability of the cationic MTS reagents to move past the anion-selectivity filter, i.e., to react with T351C and Q353C, is consistent with the lack of ideal anion selectivity that has been reported by others. Reversal potential measurements indicate that the ratio of Cl− to Na+ permeability (PCl/PNa) is 10–20 for the CFTR channel expressed heterologously in various cells (Anderson et al., 1991b ; Bear et al., 1991; Tabcharani et al., 1991; Bear et al., 1992). Conductance measurements, however, show that the single channel conductance is similar in NaCl and N-methyl-d-glucamineCl (Bear et al., 1991; Kartner et al., 1991). Given the large difference in size and mobility of these two cations this suggests that the cations probably do not contribute significantly to the current passing through the channel.
Based on the effects of the mutations K95D and K335E on halide selectivity sequences, Anderson et al. (1991b) concluded that Lys95 and Lys335 were determinants of halide selectivity. Curiously, neither of these mutations nor the mutations R347E and R1030E were reported to alter the Cl− to Na+ permeability ratio (PCl/PNa), and the latter two mutations had minimal effects on halide permeability or conductance ratios (Anderson et al., 1991b ). Furthermore, the K335E mutation had no effect on anomalous mole-fraction effects suggesting that Lys335 is not part of an anion binding site in the channel (Tabcharani et al., 1993). This result is consistent with our hypothesis that, although Lys335 is on the water-exposed surface of CFTR it may not face into the channel but rather is on the back side of the α helix away from the channel lumen (Fig. 1) (Cheung and Akabas, 1996).
Electrical Distance to the Exposed Residues and the Electrical Potential Profile in the Channel
The electrical potential profile within an ion channel has been the subject of considerable debate. By measuring the electrical distance to channel-lining residues we are effectively measuring the potential profile within the channel. In using the MTS reagents to measure the electrical distance it is important to recognize that the charged end of the molecule is located ∼0.5 nm from the reactive sulfur atom. If the MTS reagents are oriented randomly when they enter the channel, this will not effect the electrical distance because on average the position of the charged end of the molecule will be at the level of the engineered cysteine. However, if the MTS reagents enter the channel in an oriented manner, for example charged end last, the measured electrical distance will be displaced by 0.5 nm from the position of the engineered cysteine residue.
There is little change in electrical distance from Leu333, the presumed extracellular end of the M6 segment, to Ser341. This suggests that there is very little resistance to ion movement from the extracellular end of the channel to the level of Ser341 and, thus, little fall in potential in this region of the channel. The electrical distance increases markedly between Ser341 and Thr351 (Fig. 4) suggesting that most of the electrical potential falls in the distance between these two residues. Therefore, this region of the channel is likely to be a site of major resistance to ion flow. Thus, the channel appears to have a low resistance extracellular end and a high resistance cytoplasmic end. The anion-selectivity filter is located in the high resistance region of the channel.
Alternatively, the exact position of the M6 segment relative to the membrane is unknown, perhaps the residues from Leu333 to Ser341 are not normal to the plane of the membrane. Therefore, access to these residues does not involve movement in the transmembrane electric field. If this is the case, then Ser341 might be at the extracellular end of the channel. Although we cannot exclude this possibility, it would be difficult to reconcile with data from other laboratories such as the electrical distance to the Arg347 (Tabcharani, et al., 1993), the proposed location of the DPC binding site (McCarty et al., 1993; McDonough et al., 1994) and to the role of Lys335 in halide selectivity (Anderson et al., 1991b ). Therefore, we believe that this is an unlikely explanation. Nevertheless, based on hydrophobicity analysis the predicted end of the M6 segment was Val350 (Riordan et al. 1989). Thus, residues in putative cytoplasmic domains appear to be forming part of the channel lining. The largest electrical distances that we measured, to Thr351 and Gln353, is only 0.6. This suggests that the channel extends beyond the level of these residues to involve additional residues that were originally predicted to be part of cytoplasmic domains.
Secondary Structure of the M6 Segment
Based on the pattern of MTS accessible residues in and flanking the M6 segment we previously inferred that the secondary structure of much of the segment was probably α-helical but that the accessibility of three consecutive residues (351–353) at the cytoplasmic end of the segment was inconsistent with an α-helical secondary structure (Fig. 1 B) (Cheung and Akabas, 1996). The electrical distances from the extracellular end of the channel to these three residues, with T351C being more cytoplasmic than R352C, is also inconsistent with an α-helical secondary structure (Fig. 4). We speculate that this region may loop into the channel lumen with Arg352 being closer to the extracellular end than the adjacent residues, Thr351 or Gln353 (Fig. 6). The reentry of these residues into the channel lumen may narrow the channel diameter and create the anion-selectivity filter and the region of high resistance to charge movement. Given the direct link between these residues at the cytoplasmic end of the M6 segment and NBF1 these residues may also be involved in the formation of the channel gate. Further experiments are in progress to investigate this possibility.
Figure 6.

A cartoon of the CFTR channel illustrating the M6 segment residues lining part of the channel wall. The residues at the cytoplasmic end of the M6 segment loop back into the channel; this narrows the lumen and forms the anion-selectivity filter. Black squares indicate MTS accessible residues, open circles indicate MTS inaccessible residues.
Acknowledgments
We thank Gilda Salazar-Jimenez and Alex Fariborzian for technical assistance and Drs. Jonathan Javitch, Arthur Karlin, and Juan Pascual for advice and comments on an earlier version of this manuscript.
This work was supported in part by National Institutes of Health grants DK51794 and NS30808 and a Grant-in-Aid from the New York City Affiliate of the American Heart Association and the Cystic Fibrosis Foundation. Myles Akabas is an Established Scientist of the New York Heart Association and the recipient of a Klingenstein Award in Neuroscience.
Footnotes
In the course of these experiments we discovered that the R347C construct that we had used previously contained a large truncation, deleting most of the R-domain to the COOH terminus. In the full length CFTR construct the R347C mutant is accessible to MTSEA+ which causes 19% inhibition, however, MTSES− and MTSET+ do not react with this mutant.
We did not include the electrical distance based on MTSEA+ in our analysis because it is not permanently charged. The pKa for the ammonium group is unknown and therefore the fraction of the MTSEA that is in the uncharged form and could react in a non-voltage-dependent manner is unknown.
Address correspondence and reprint requests to Dr. Myles Akabas, Center for Molecular Recognition, Columbia University, 630 West 168th Street, New York, NY 10032. Fax: 212-305-5594; E-mail: ma14@columbia.edu
Abbreviations used in this paper: CFTR, cystic fibrosis transmembrane conductance regulator; MTS, methanthiosulfonates; MTSEA+, MTS-ethylammonium; MTSES−, MTS-ethylsulfonate; MTSET+, MTS-ethyltrimethylammonium; NBF, nucleotide binding fold.
references
- Akabas MH, Kaufmann C, Archdeacon P, Karlin A. Identification of acetylcholine receptor channel-lining residues in the entire M2 segment of the α subunit. Neuron. 1994a;13:919–927. doi: 10.1016/0896-6273(94)90257-7. [DOI] [PubMed] [Google Scholar]
- Akabas MH, Kaufmann C, Cook TA, Archdeacon P. Amino acid residues lining the chloride channel of the cystic fibrosis transmembrane conductance regulator. J Biol Chem. 1994b;269:14865–14868. [PubMed] [Google Scholar]
- Akabas MH, Stauffer DA, Xu M, Karlin A. Acetylcholine receptor channel structure probed in cysteine-substitution mutants. Science (Wash DC) 1992;258:307–310. doi: 10.1126/science.1384130. [DOI] [PubMed] [Google Scholar]
- Anderson MP, Berger HA, Rich DP, Gregory RJ, Smith AE, Welsh MJ. Nucleotide triphosphates are required to open the CFTR chloride channel. Cell. 1991a;67:775–784. doi: 10.1016/0092-8674(91)90072-7. [DOI] [PubMed] [Google Scholar]
- Anderson MP, Gregory RJ, Thompson S, Souza DW, Paul S, Mulligan RC, Smith AE, Welsh MJ. Demonstration that CFTR is a chloride channel by alteration of its anion selectivity. Science (Wash DC) 1991b;253:202–205. doi: 10.1126/science.1712984. [DOI] [PubMed] [Google Scholar]
- Andersen OS, Koeppe RE., II Molecular determinants of channel function. Physiol Rev. 1992;72:S89–S158. doi: 10.1152/physrev.1992.72.suppl_4.S89. [DOI] [PubMed] [Google Scholar]
- Baukrowitz T, Hwang T-C, Nairn AC, Gadsby DC. Coupling of CFTR Cl−channel gating to an ATP hydrolysis cycle. Neuron. 1994;12:473–482. doi: 10.1016/0896-6273(94)90206-2. [DOI] [PubMed] [Google Scholar]
- Bear CE, Duguay F, Naismith AL, Kartner N, Hanrahan JW, Riordan JR. Cl− channel activity in Xenopusoocytes expressing the cystic fibrosis gene. J Biol Chem. 1991;266:19142–19145. [PubMed] [Google Scholar]
- Bear CE, Li C, Kartner N, Bridges RJ, Jensen TJ, Ramjeesingh M, Riordan JR. Purification and functional reconstitution of the cystic fibrosis transmembrane conductance regulator (CFTR) Cell. 1992;68:809–819. doi: 10.1016/0092-8674(92)90155-6. [DOI] [PubMed] [Google Scholar]
- Berger HA, Travis SM, Welsh MJ. Regulation of the cystic fibrosis transmembrane conductance regulator Cl−channel by specific protein kinases and protein phosphatases. J Biol Chem. 1993;268:2037–2047. [PubMed] [Google Scholar]
- Carson MR, Travis SM, Welsh MJ. The two nucleotide-binding domains of cystic fibrosis transmembrane conductance regulator (CFTR) have distinct functions in controlling channel activity. J Biol Chem. 1995;270:1711–1717. doi: 10.1074/jbc.270.4.1711. [DOI] [PubMed] [Google Scholar]
- Chang X-B, Tabcharani JA, Hou Y-X, Jensen TJ, Kartner N, Alon N, Hanrahan JW, Riordan JR. Protein kinase A (PKA) still activates CFTR chloride channel after mutagenesis of all 10 PKA consensus phosphorylation sites. J Biol Chem. 1993;268:11304–11311. [PubMed] [Google Scholar]
- Cheng SH, Rich DP, Marshall J, Gregory RJ, Welsh MJ, Smith AE. Phosphorylation of the R domain by cAMP- dependent protein kinase regulates the CFTR chloride channel. Cell. 1991;66:1027–1036. doi: 10.1016/0092-8674(91)90446-6. [DOI] [PubMed] [Google Scholar]
- Cheung M, Akabas MH. Identification of CFTR channel-lining residues in and flanking the M6 membrane-spanning segment. Biophys J. 1996;70:2688–2695. doi: 10.1016/S0006-3495(96)79838-7. [DOI] [PMC free article] [PubMed] [Google Scholar]
- Eisenman G, Horn R. Ionic selectivity revisited: the role of kinetic and equilibrium processes in ion permeation through channels. J Membr Biol. 1983;76:197–225. doi: 10.1007/BF01870364. [DOI] [PubMed] [Google Scholar]
- Fischer H, Machen TE. CFTR displays voltage dependence and two gating modes during stimulation. J Gen Physiol. 1994;104:541–566. doi: 10.1085/jgp.104.3.541. [DOI] [PMC free article] [PubMed] [Google Scholar]
- Gadsby DC, Nagel G, Hwang T-C. The CFTR chloride channel of mammalian heart. Annu Rev Physiol. 1995;57:387–416. doi: 10.1146/annurev.ph.57.030195.002131. [DOI] [PubMed] [Google Scholar]
- Gunderson KL, Kopito RR. Conformational states of CFTR associated with channel gating: the role of ATP binding and hydrolysis. Cell. 1995;82:231–239. doi: 10.1016/0092-8674(95)90310-0. [DOI] [PubMed] [Google Scholar]
- Hille, B. 1992. Ionic Channels of Excitable Membranes. Sinauer Associates, Inc., Sunderland, MA. 607 pp.
- Honig B, Sharp K. Classical electrostatics in biology and chemistry. Science (Wash DC) 1995;268:1144–1149. doi: 10.1126/science.7761829. [DOI] [PubMed] [Google Scholar]
- Hwang TC, Horie M, Gadsby DC. Functionally distinct phospho-forms underlie incremental activation of protein kinase-regulated Cl−conductance in mammalian heart. J Gen Physiol. 1993;101:629–650. doi: 10.1085/jgp.101.5.629. [DOI] [PMC free article] [PubMed] [Google Scholar]
- Hwang TC, Nagel G, Nairn AC, Gadsby DC. Regulation of the gating of cystic fibrosis transmembrane conductance regulator Cl channels by phosphorylation and ATP hydrolysis. Proc Natl Acad Sci USA. 1994;91:4698–4702. doi: 10.1073/pnas.91.11.4698. [DOI] [PMC free article] [PubMed] [Google Scholar]
- Javitch JA, Fu D, Chen J, Karlin A. Mapping the binding-site crevice of the dopamine D2 receptor by the substituted-cysteine accessibility method. Neuron. 1995;14:825–831. doi: 10.1016/0896-6273(95)90226-0. [DOI] [PubMed] [Google Scholar]
- Kartner N, Hanrahan JW, Jensen TJ, Naismith AL, Sun S, Ackerley CA, Reyes EF, Tsui L-C, Rommens JM, Bear CE, Riordan JR. Expression of the cystic fibrosis gene in non-epithelial invertebrate cells produces a regulated anion conductance. Cell. 1991;64:681–691. doi: 10.1016/0092-8674(91)90498-n. [DOI] [PubMed] [Google Scholar]
- Linsdell P, Hanrahan JW. Flickery block of single CFTR chloride channels by intracellular anions and osmolytes. Am J Physiol. 1996;271:C628–C634. doi: 10.1152/ajpcell.1996.271.2.C628. [DOI] [PubMed] [Google Scholar]
- McCarty NA, McDonough S, Cohen BN, Riordan JR, Davidson N, Lester HA. Voltage-dependent block of the cystic fibrosis transmembrane conductance regulator Cl−channel by two closely related arylaminobenzoates. J Gen Physiol. 1993;102:1–23. doi: 10.1085/jgp.102.1.1. [DOI] [PMC free article] [PubMed] [Google Scholar]
- McDonough S, Davidson N, Lester HA, McCarty NA. Novel pore-lining residues in CFTR that govern permeation and open-channel block. Neuron. 1994;13:623–634. doi: 10.1016/0896-6273(94)90030-2. [DOI] [PubMed] [Google Scholar]
- Riordan JR. The cystic fibrosis transmembrane conductance regulator. Annu Rev Physiol. 1993;55:609–630. doi: 10.1146/annurev.ph.55.030193.003141. [DOI] [PubMed] [Google Scholar]
- Riordan JR, Rommens JM, Kerem BS, Alon N, Rozmahel R, Grzelczak Z, Zielenski J, Lok S, Plavsic N, Chou JL, et al. Identification of the cystic fibrosis gene: cloning and characterization of complementary DNA. Science (Wash DC) 1989;254:1066–1073. doi: 10.1126/science.2475911. [DOI] [PubMed] [Google Scholar]
- Roberts DD, Lewis SD, Ballou DP, Olson ST, Shafer JA. Reactivity of small thiolate anions and cysteine-25 in papain towards methyl-methanethiosulfonate. Biochemistry. 1986;25:5595–5601. doi: 10.1021/bi00367a038. [DOI] [PubMed] [Google Scholar]
- Seibert FS, Tabcharani JA, Chang XB, Dulhanty AM, Mathews C, Hanrahan JW, Riordan JR. cAMP-dependent protein kinase-mediated phosphorylation of cystic fibrosis transmembrane conductance regulator residue Ser-753 and its role in channel activation. J Biol Chem. 1995;270:2158–2162. doi: 10.1074/jbc.270.5.2158. [DOI] [PubMed] [Google Scholar]
- Smit LS, Wilkinson DJ, Mansoura MK, Collins FS, Dawson DC. Functional roles of the nucleotide-binding folds in the activation of the cystic fibrosis transmembrane conductance regulator. Proc Natl Acad Sci USA. 1993;90:9963–9967. doi: 10.1073/pnas.90.21.9963. [DOI] [PMC free article] [PubMed] [Google Scholar]
- Stauffer DA, Karlin A. Electrostatic potential of the acetylcholine binding sites in the nicotinic receptor probed by reactions of binding-site cysteines with charged methanethiosulfonates. Biochemistry. 1994;33:6840–6849. doi: 10.1021/bi00188a013. [DOI] [PubMed] [Google Scholar]
- Tabcharani JA, Chang XB, Riordan JR, Hanrahan JW. Phosphorylation-regulated Cl−channel in CHO cells stably expressing the cystic fibrosis gene. Nature (Lond) 1991;352:628–631. doi: 10.1038/352628a0. [DOI] [PubMed] [Google Scholar]
- Tabcharani JA, Rommens JM, Hou YX, Chang XB, Tsui LC, Riordan JR, Hanrahan JW. Multi-ion pore behavior in the CFTR chloride channel. Nature (Lond) 1993;366:79–82. doi: 10.1038/366079a0. [DOI] [PubMed] [Google Scholar]
- Woodhull AM. Ionic blockage of sodium channels in nerve. J Gen Physiol. 1973;61:687–708. doi: 10.1085/jgp.61.6.687. [DOI] [PMC free article] [PubMed] [Google Scholar]
- Wright EM, Diamond JM. Anion selectivity in biological systems. Physiol Rev. 1977;57:109–156. doi: 10.1152/physrev.1977.57.1.109. [DOI] [PubMed] [Google Scholar]