Abstract
In this study, we describe two splice variants of an ether-à-go-go (EAG) K+ channel cloned from bovine retina: bEAG1 and bEAG2. The bEAG2 polypeptide contains an additional insertion of 27 amino acids in the extracellular linker between transmembrane segments S3 and S4. The heterologously expressed splice variants differ in their activation kinetics and are differently modulated by extracellular Mg2+. Cooperativity of modulation by Mg2+ suggests that each subunit of the putative tetrameric channel binds a Mg2+ ion. The channels are neither permeable to Ca2+ ions nor modulated by cyclic nucleotides. In situ hybridization localizes channel transcripts to photoreceptors and retinal ganglion cells. Comparison of EAG currents with IKx, a noninactivating K+ current in the inner segment of rod photoreceptors, reveals an intriguing similarity, suggesting that EAG polypeptides are involved in the formation of Kx channels.
Keywords: ether-à-go-go, retina, potassium channel, cyclic nucleotides
introduction
The bewildering functional diversity of K+ channels is generated by several families of genes encoding K+ channel polypeptides. One class of voltage-activated K+ channels is encoded by the ether-à-go-go (eag)1 gene of Drosophila (Dmeag) (Drysdale et al., 1991) and its vertebrate homologues (Ludwig et al., 1994; Warmke and Ganetzky, 1994; Trudeau et al., 1995). Mutations in the Dmeag gene affect four different types of K+ currents in larval muscles, suggesting that the encoded polypeptide (DmEAG) coassembles with various other subunits to form K+ channels with diverse properties (Zhong and Wu, 1991, 1993).
DmEAG is phylogenetically more closely related to cyclic nucleotide-gated (CNG) channels than to any K+ channel subfamily (Guy et al., 1991; Warmke et al., 1991). In particular, DmEAG carries a cyclic nucleotide-binding motif similar to that found in CNG channels, suggesting that DmEAG channels might be sensitive to cAMP or cGMP. Heterologous expression of the Dmeag gene gives rise to voltage-activated K+ channels. These channels have been reported to be modulated by cAMP and to be permeable to Ca2+ ions (Brüggemann et al., 1993). Both observations are reminiscent of CNG channels that are directly activated by cyclic nucleotides and are permeable to Ca2+ ions (for reviews see Zufall et al., 1994; Kaupp, 1995; Zimmerman, 1995; Finn et al., 1996), and strengthen the idea that EAG channels represent an evolutionary link between voltage-activated K+ channels and cAMP/cGMP-activated nonselective cation channels. The rat homologue is significantly different from DmEAG in activation and deactivation kinetics and ion selectivity (Ludwig et al., 1994; Stansfeld et al., 1996). In addition, extracellular Mg2+ and H+ control the activation of rat EAG channels in a dose- and voltage-dependent manner (Terlau et al., 1996). Unexpectedly, initial experiments indicated that the rat EAG channel, in contrast to DmEAG, is neither sensitive to cyclic nucleotides nor permeable to Ca2+ ions (Ludwig et al., 1994; Robertson et al., 1996).
A straightforward interpretation of previous experiments addressing cyclic nucleotide sensitivity and Ca2+ permeability is hampered by several principal difficulties. Because membrane-permeable analogues of cyclic nucleotides were applied extracellularly to intact cells, these experiments do not readily distinguish between effects on EAG channels themselves and secondary effects mediated by other mechanisms. Experiments on excised patches are plagued by significant rundown of currents that precludes a detailed analysis of cyclic nucleotide effects on the channels (Terlau et al., 1995; Robertson et al., 1996). Ca2+ permeability of heterologously expressed rat and Drosophila EAG channels has been inferred largely from the activation of Ca2+-sensitive Cl− currents in Xenopus oocytes (Brüggemann et al., 1993; Ludwig et al., 1994), but direct evidence for Ca2+ permeation is lacking.
At present, we do not know which native K+ channels may contain EAG polypeptides as subunits. The recent suggestion by Stansfeld et al. (1997) that an EAG polypeptide might contribute to the mammalian M channel is equivocal (Mathie and Watkins, 1997; Marrion, 1997). An M-like current, dubbed IKx, has also been characterized in rod photoreceptors (Attwell and Wilson, 1980; Beech and Barnes, 1989; Wollmuth, 1994). Therefore, we have chosen the mammalian retina to study whether EAG subunit(s) contribute to Kx channels and to determine their sites of expression.
In this paper, we characterize two splice variants of an EAG channel cloned from bovine retina (bEAG1 and bEAG2). We directly measured the Ca2+ permeability of the heterologously expressed channels with a sensitive fluorimetric technique and found no evidence for Ca2+ permeation. We also examined whether bEAG currents can be modulated by cyclic nucleotides rapidly released from caged compounds inside the cell (Hagen et al., 1996). We detected only weak (if any) effects on channel activity by physiological concentrations of cAMP and cGMP. The two splice variants differ from each other by an insertion of 27 amino acid residues in the extracellular linker between transmembrane segments S3 and S4 in bEAG2. The activation kinetics of the splice variants is controlled by extracellular Mg2+ over different ranges of concentration. Eag channel transcripts were localized by in situ hybridization to the photoreceptor layer as well as to ganglion cells of the retina. We discuss the possibility that bEAG polypeptides are part of the IKx conductance that has been identified as the major pathway for the outward dark current in the inner segment of rod photoreceptors.
materials and methods
Screening of Bovine Genomic and cDNA Libraries
A cDNA fragment of Dmeag (residues 798–2033, according to numbering of Warmke et al., 1991) was used to screen a bovine genomic DNA library (BL1015j; Clontech, Palo Alto, CA) at low stringency. Probes were radioactively labeled with a DECAprime kit (Ambion Inc., Austin, TX).
Hybridization was in 5× SSC (20× SSC is 3 M sodium chloride, 0.3 M sodium citrate, pH 7.0), 5× Denhardt's solution (100× Denhardt's contains 2% bovine serum albumin, 2% Ficoll 400, 2% polyvinylpyrolidone), 0.1 mg/ml denatured herring testes DNA, 0.1% SDS, at 52°C for 15 h. Qiabrane filters (Qiagen, Hilden, Germany) were washed twice in 2× SSC, 0.1% SDS for 5 min at room temperature, followed by two washes for 30 min at 55°C. Bovine retinal cDNA libraries in λ-ZAPII (Stratagene, Heidelberg, Germany) were screened with genomic fragments coding for a bovine homologue of the Dmeag gene. Hybridization was in the same solution (see above) at 65°C. Filters were washed twice in 1× SSC, 0.1% SDS at 65°C for 30 min. Overlapping clones encoding either the 5′ or 3′ part of a bovine eag gene (beag) were recombined after digestion with NotI/SacII and SacII/EcoRI, and subcloned into pBluescriptSK(−) vector. Recombinant pbeag1 was sequenced on both strands.
Northern Blot Analysis
Total RNA was prepared from bovine cerebellum, cortex, kidney, and retina by the LiCl/urea method (Baumann et al., 1994). Poly(A)+ RNA was isolated using an Oligotex kit (Qiagen) or a Fast-Track kit (Invitrogen Corp., San Diego, CA). 10 μg of poly(A)+ RNA were fractionated on a denaturing 0.75% agarose gel (Sambrook et al., 1989). RNA was transferred to nylon filters (Qiagen) and cross-linked to the membrane by UV light. Northern blots were hybridized with cDNA probes encompassing the putative transmembrane regions common to both pbeag1 and pbeag 2, or with the insert of pbeag 2. Hybridization was in 50% formamide, 5× SSC, 5× Denhardt's, 0.1 mg/ml denatured herring testes DNA, and 0.1% SDS at 42°C for 16 h. Final washing was twice in 1× SSC, 0.1% SDS at 65°C for 30 min. Autoradiography was for 12–72 h at −80°C.
In Situ Hybridization
For the fixation of bovine retinae, eyecups were immersed in 4% paraformaldehyde/PBS for 90 min at room temperature. The retina was removed from the eyecup, cryoprotected in 30% sucrose/PBS for 30 min, and embedded in Tissue-Tek (Miles Inc., West Haven, CT). Cryosections (16 μm) were mounted on silanized slides, dried, fixed for 5 min in 4% paraformaldehyde/ PBS, and rinsed in PBS. Sections were dehydrated by a series of ethanol washes (50, 70, 80, and 90%) and stored in 90% ethanol at 4°C. Hybridization was carried out with digoxigenin-labeled sense and antisense riboprobes transcribed in vitro from a subclone (corresponding to positions 1994–2110 of pbeag1). Hybridization was performed for 14 h at 37°C in a humidified chamber. The hybridization solution contained: 50% formamide, 4× SSC, 10 mM Tris-HCl at pH 7.5, 1 mM EDTA, 1× Denhardt's, 0.1 mg/ ml denatured herring testes DNA, and labeled probe (500 ng/ ml). After hybridization, the sections were washed three times for 1 h each at 30°C in 50% formamide, 2× SSC. Detection of hybrids was as described in the application manual (Boehringer Mannheim GmbH, Mannheim, Germany). Hybridizations were also performed with digoxigenin-labeled riboprobes transcribed from an EcoRI/SacI subclone of beag1 (corresponding to positions 2160–2908). Hybridization and wash conditions were as described above, except that incubation temperature was 45°C.
Functional Expression of EAG Channels
We generated a truncated form of pbeag1 that lacks the 5′ noncoding region and contains a Kozak consensus sequence (Kozak, 1984) immediately adjacent to the 5′ side of the ATG codon; this form of pbeag was subcloned into the pcDNAI vector (Invitrogen Corp.) to yield pcbeag1. We also constructed a second recombinant that contained an insertion of 81 bp at position 1148 of pbeag1. This latter cDNA fragment was amplified by PCR from retinal cDNA and inserted into the AatII and MluI sites of pcbeag1 to yield pcbeag 2.
bEAG1 and bEAG2 were transiently expressed in HEK 293 cells as described previously (Baumann et al., 1994; Frings et al., 1995). Currents through the channels expressed in HEK 293 cells were measured with the patch-clamp technique in the whole-cell configuration. Leak currents were subtracted for each test pulse separately, using the P/4 protocol. The capacitance of the plasma membrane was measured for each cell and compensated using the capacitance compensation circuitry of the patch-clamp amplifier during voltage steps from −80 to −60 mV. The mean capacitance of 20 representative cells was 23.6 ± 7.6 pF, while the series resistance was 29.0 ± 18.2 MΩ. Series resistance was compensated by adjusting the RS compensation to 75%. The time constant of the resulting voltage clamp was 0.68 ± 0.46 ms. The standard extracellular solution contained (mM): 120 NaCl, 3 KCl, 1 CaCl2, 50 glucose, 10 HEPES, adjusted to pH 7.4 with NaOH, and concentrations of divalent cations as indicated in the text. The patch pipette solution contained (mM): 120 KCl, 8 NaCl, 1 MgCl2, 2 Mg-ATP, 0.3 GTP, 1 EGTA and 10 HEPES, adjusted to pH 7.2 with KOH. All experiments were carried out at room temperature (20–22°C).
Ca2+ permeability was examined by a method that allows quantitative determination of the fraction of current carried by Ca2+ (Schneggenburger et al., 1993; Frings et al., 1995). Briefly, cells were dialyzed with the patch pipette solution containing (mM): 145 KCl, 8 NaCl, 1 MgCl2, 2 Mg-ATP, 0.3 GTP, 10 HEPES, 0.02 EGTA, 1 K5-Fura-2, adjusted to pH 7.2 with KOH; this solution contained the Ca2+-sensitive fluorescent dye Fura-2 at a concentration sufficient to dominate the Ca2+ buffer capacity of the cell (Frings et al., 1995). Each cell was examined consecutively in two bath solutions containing either 1 or 80 mM CaCl2. The first solution contained (mM): 120 NaCl, 3 KCl, 1 CaCl2, 1 MgCl2, 0.001 BaCl2, 50 glucose, 10 HEPES adjusted to pH 7.4 with NaOH. The second solution contained (mM): 10 NaCl, 3 KCl, 80 CaCl2, 1 MgCl2, 0.001 BaCl2, 50 glucose, 10 HEPES, adjusted to pH 7.4 with NaOH. The voltage protocol was designed to maximize Ca2+ influx during the deactivation phase of EAG channels at −120 mV (Brüggemann et al., 1993). Simultaneous recording of whole-cell current and fluorescence change using the Phocal system (Life Science Resources, Cambridge, UK) were made as described previously (Frings et al., 1995). To investigate the deactivation properties of bEAG1, an extracellular solution was used that contained (mM): 70 NaCl, 50 KCl, 1 CaCl2, 1 MgCl2, 50 glucose, 10 HEPES, adjusted to pH 7.4 with NaOH. The K+ equilibrium potential was thus shifted to −30 mV and K+ inward current could be recorded during channel deactivation after voltage steps from +60 to −120 mV. To test the sensitivity of our method for the detection of Ca2+ influx, HEK 293 cells were transfected with the BIII Ca2+ channel from rabbit brain (α1, α2, and β subunits cloned into the pKCR vector; Fujita et al., 1993; see also Frings et al., 1995), and Ca2+ currents of various amplitudes were activated by voltage steps from a holding voltage of −80 mV (Frings et al., 1995). The pipette solution for Ca2+ channel measurements contained (mM): 130 CsCl, 20 TEA-Cl, 2 MgCl2, 2 Na-ATP, 0.2 GTP, 10 HEPES, 0.02 EGTA, 1 K5-Fura-2, adjusted to pH 7.2 with CsOH. The extracellular solution was standard solution containing (mM): 2 CaCl2, 1 MgCl2, 10 TEA-Cl, at pH 7.4.
Experiments with Caged Compounds
Synthesis and chemical characterization of caged 8-Br-cAMP and caged 8-Br-cGMP have been described previously (Hagen et al., 1996). Stock solutions of caged compounds (10 mM) in dimethylsulfoxide were used to prepare the pipette solutions shortly before each experiment; these solutions were used for not more than 90 min. During this time, contamination with free cyclic nucleotides due to solvolysis was below 2%. UV illumination was achieved by guiding light from a 100 W mercury lamp (AMKO, Uetersen, Germany) through an oil immersion objective (40×, n.a. 1.3; Nikon Inc., Tokyo, Japan) to the recording chamber. The concentration steps of cyclic nucleotides produced by photolysis of the caged compounds were estimated using the bovine olfactory CNG channel as described previously (Hagen et al., 1996).
results
Cloning of eag Homologues from Bovine Retina
A cDNA fragment encoding transmembrane regions of DmEAG was used to screen a bovine genomic DNA library under reduced stringency. One recombinant was isolated that contained an exon coding for a region between transmembrane segments S1 and S4. This exon included a splice site that, if alternatively used, would give rise to an extension of the extracellular loop between S3 and S4. A similar insertion has recently been described for an eag homologue cloned from mouse brain (Warmke and Ganetzky, 1994). Our genomic clone was used to screen a bovine retinal cDNA library. Two overlapping cDNA clones were isolated that, when recombined, contained the entire coding region of an eag homologue (bEAG1).
The pbeag1 cDNA consists of 3,405 nucleotides. One long open reading frame was identified. Based on sequence similarity with other EAG channel polypeptides, the translation initiation site was assigned to the first ATG triplet (positions 198–200) of the open reading frame. An in-frame termination codon (TGA) is found at positions 3078–3080. The cDNA does not contain a poly(dA) tract. The deduced polypeptide sequence consists of 960 amino acid residues with a calculated Mw of 108,092 D.
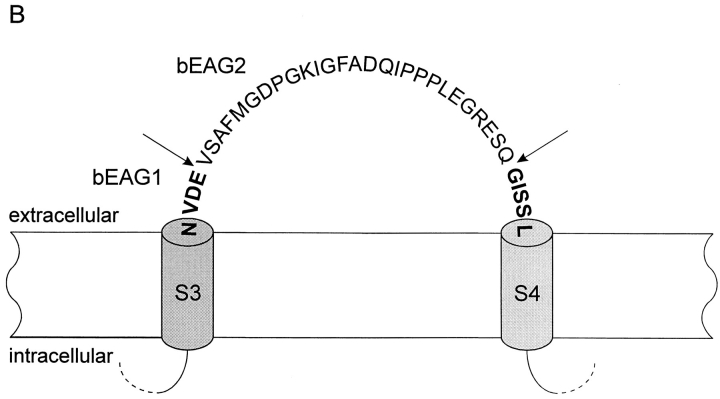
We used PCR analysis to examine whether alternatively spliced transcripts of beag are expressed in the retina. One amplified fragment contained an insertion of 81 nucleotides that is identical to the sequence in the genomic clone. The PCR fragment was subcloned into the pbeag1 construct to give pbeag 2. The bEAG2 channel polypeptide contains 27 additional residues between segments S3 and S4 (see Fig. 1, A and B). A comparison of the amino acid sequences of bEAG2 with rat EAG (rEAG; Ludwig et al., 1994), DmEAG (Warmke et al., 1991), and human EAG-related gene (hERG; Warmke and Ganetzky, 1994) is shown in Fig. 1.
Figure 1.
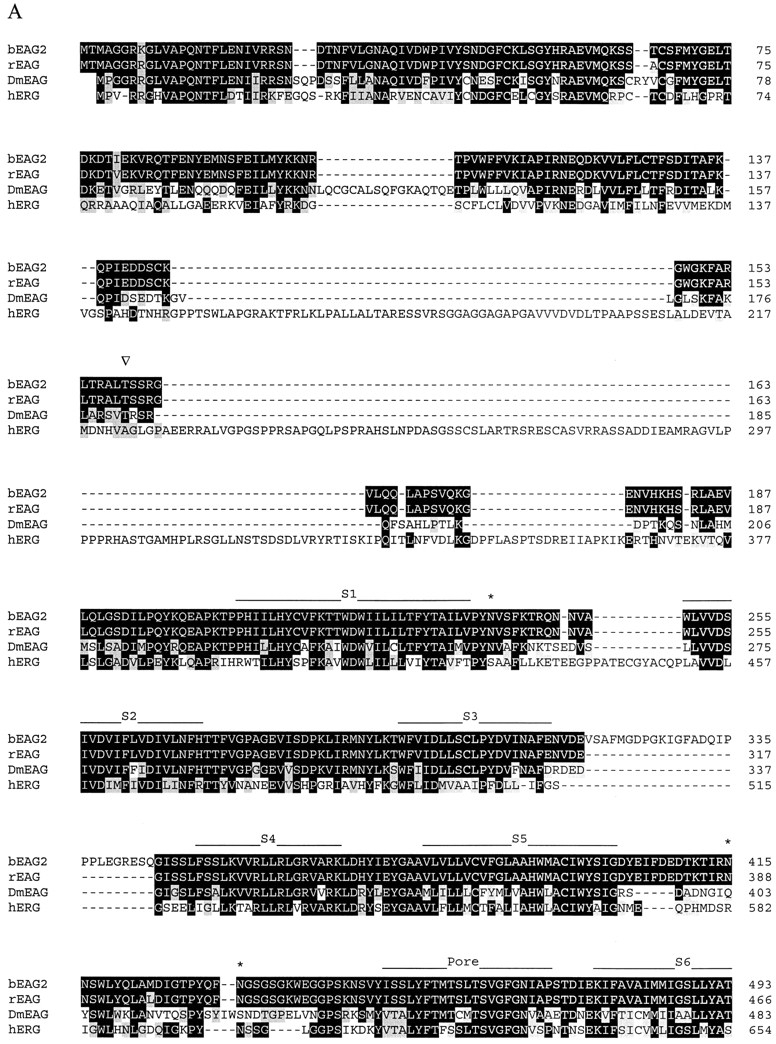
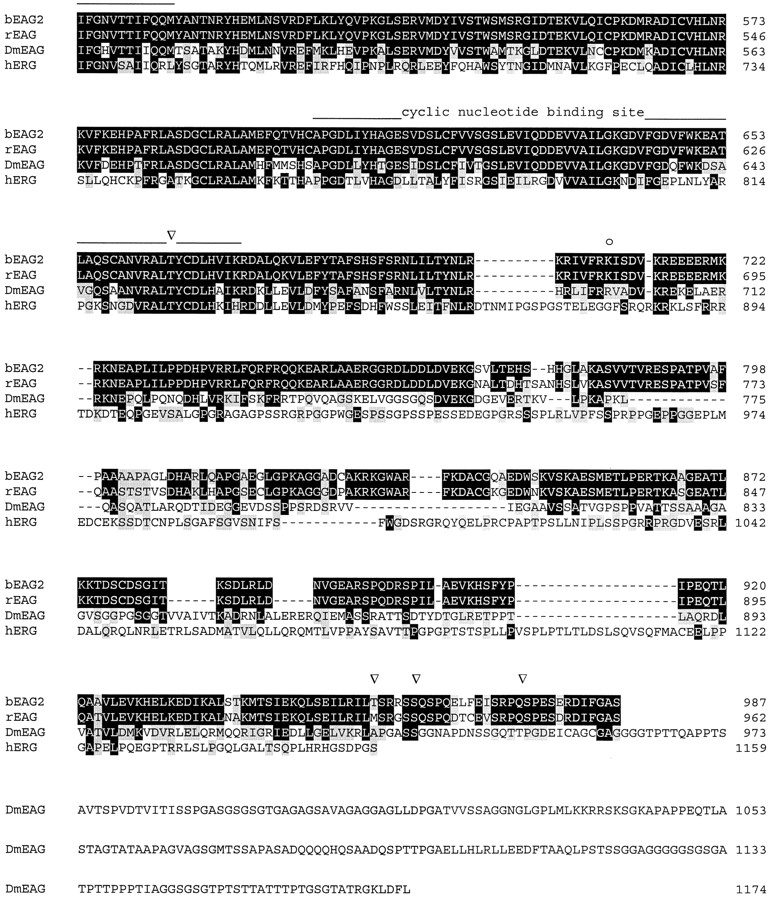
Alignment of amino acid sequences of EAG channel polypeptides. Sequences: bovine EAG splice variant 2 (bEAG 2); rat EAG (rEAG; Ludwig et al., 1994), Drosophila EAG (DmEAG; Warmke et al., 1991) and human EAG (hERG; Warmke and Ganetzky, 1994). (A) Transmembrane regions (S1–S6), the pore region, and the putative cyclic nucleotide-binding site are overlined. Consensus sites for N-linked glycosylation of bEAG2 are labeled by an asterisk. Consensus sites for phosphorylation of bEAG2 by CaM kinase II and cAMP/cGMP-dependent kinases are labeled by open arrowheads and open circles, respectively. Amino acid position is indicated at the right hand side. Identical residues are depicted as white letters on black, conservative substitutions as black letters on gray. Note the insertion of 27 amino acid residues (position 318–344) in bEAG2, that is missing in bEAG1. (B) Amino acid sequence of the S3–S4 linker of bEAG1/2. A topological model of the S3–S4 region of bEAG channels is shown. Residues common to both bEAG1 and bEAG2 are depicted in bold letters. The sites of insertion of 27 additional residues in bEAG2 are indicated by arrows.
Expression Pattern of beag mRNA
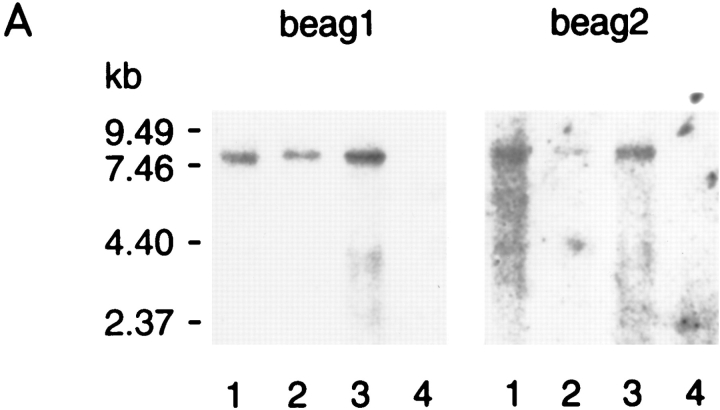
The tissue specificity of beag expression was analyzed by Northern blotting. Labeling with beag1- and beag 2-specific probes was found in lanes containing poly(A)+ RNA from cerebellum, cortex, and retina (Fig. 2 A, lanes 1–3). No signal was observed with RNA from kidney (Fig. 2 A, lane 4). The estimated size of the transcript from the Northern blot is ∼7.5 kb, whereas the cloned cDNA contains only 3,405 nucleotides, implying that ∼4 kb are missing from the 5′- and 3′-untranslated regions of beag.
Figure 2.
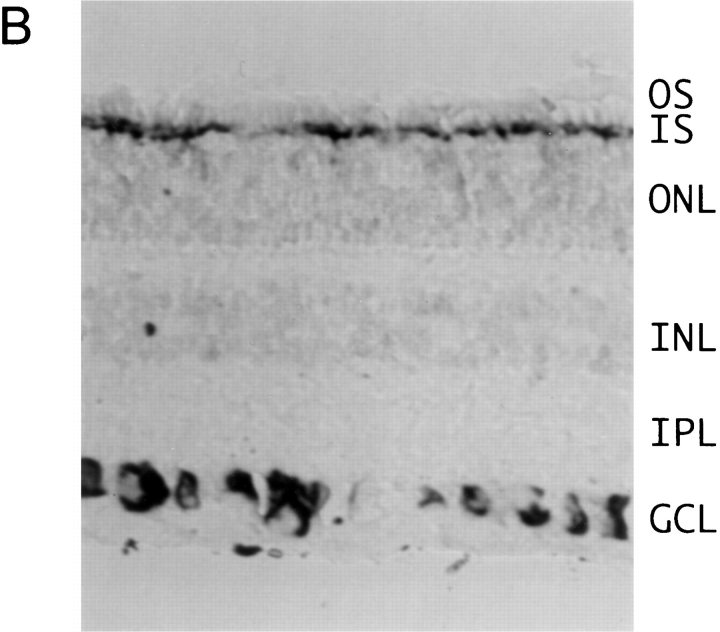
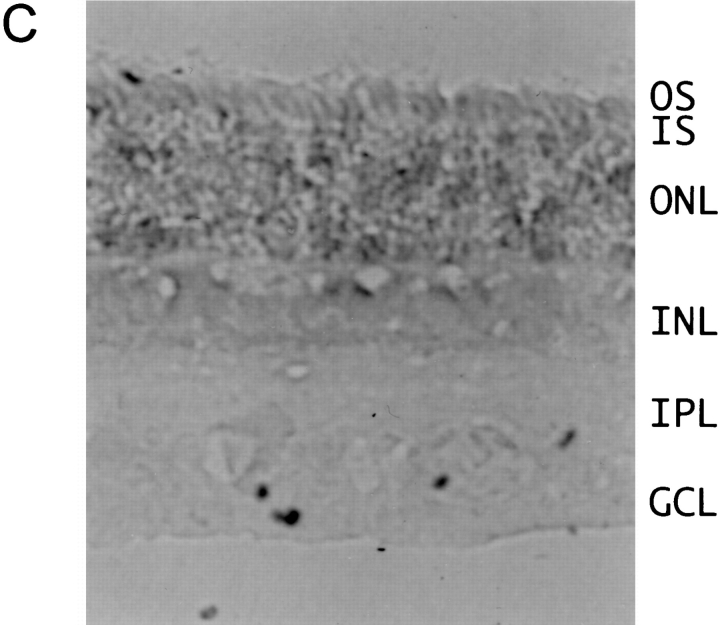
Expression pattern of EAG channel transcripts. (A) 10 μg poly(A)+ RNA from bovine cerebellum (lane 1), cortex (lane 2), retina (lane 3), and kidney (lane 4) were separated on a denaturing 0.75% agarose gel and transferred to Qiagen membrane. Hybridization was to a [32P] dCTP-labeled probe derived from beag1 (left) and to the 81-bp fragment of beag 2 encoding the insertion of 27 amino acids in the S3–S4 linker in bEAG2 (right). A transcript of ∼7.5 kb was detected with both probes. Size standards in kilobase are indicated on the left. (B and C) In situ hybridizations to tissue sections of bovine retina were performed with digoxigenin-labeled antisense (B) and sense (C) probes transcribed in vitro from beag1. Specific labeling with the antisense probe is observed in ganglion cells and in the inner segments of photoreceptor cells. OS, photoreceptor outer segments; IS, photoreceptor inner segments; ONL, outer nuclear layer; INL, inner nuclear layer; IPL, inner plexiform layer; GCL, ganglion cell layer.
The expression pattern of beag1 and beag 2 transcripts in the bovine retina was determined by in situ hybridization of retinal cryosections using antisense and sense riboprobes, both labeled with digoxigenin. For beag1, strong hybridization signals were observed in most ganglion cells of the inner retina and also in the inner segment layer of the photoreceptor cells (Fig. 2 B). A similar distribution of CNG channel transcript in the photoreceptor layer has been observed by Ahmad et al. (1994). The respective sense riboprobes did not recognize ganglion cells and photoreceptors (Fig. 2 C). A similar hybridization pattern was observed using riboprobes transcribed from a COOH-terminal fragment of bEAG1 (data not shown). This fragment did not contain the putative binding site for cyclic nucleotides. An antisense probe specific for the insertion between S3 and S4 of beag 2 also recognized ganglion cells (data not shown). However, the hybridization signals for beag 2 were significantly weaker than for beag1, consistent with the lower abundance of beag 2 transcripts that was determined by PCR amplification.
Kinetic Analysis of bEAG Channel Activation
The channel inventory of the outer and inner segment of rod photoreceptors and their role in generating and shaping the light response has been characterized comprehensively (for reviews see Yau and Baylor, 1989; Barnes, 1994). Comparison of currents carried by heterologously expressed EAG channels (bEAG) with currents in retinal rods offers a unique opportunity to identify the cellular function of EAG channels, and thereby to gain information on their physiological role in phototransduction.
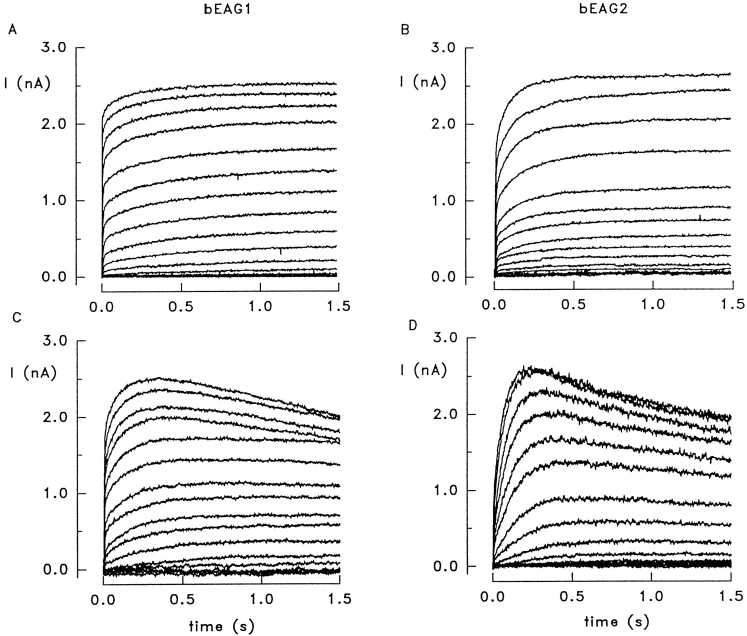
The electrophysiological properties of bEAG polypeptides were investigated by heterologous expression in HEK 293 cells. Fig. 3 shows a series of whole-cell recordings of outward currents in response to depolarizing voltage steps (holding voltage −80 mV) for bEAG1 (A) and bEAG2 (B) in standard extracellular solution. In ∼20% of cells, we observed a pronounced current decline at Vm > 30 mV with both bEAG1 (Fig. 3 C) and bEAG2 (Fig. 3 D). These cells were excluded from kinetic analysis, and no attempt was made to investigate the molecular basis of this decline. A similar decline of current has been previously reported for other EAG homologues (Ludwig et al., 1994; Robertson et al., 1996).
Figure 3.
Potassium outward currents carried by heterologously expressed bEAG channels. (A) Whole-cell recordings of HEK 293 cells expressing the bEAG1 channel. Holding voltage was −80 mV. bEAG channels were activated by stepping the voltage for 1.5 s to values between −70 and +90 mV in 10-mV increments. Standard extracellular solution containing 1 mM Ca2+ and 1 mM Mg2+. (B) Whole-cell recordings of HEK 293 cells expressing the bEAG2 channel. (C) Currents recorded from bEAG1 under identical conditions showing a decline at Vm > +50 mV. (D) Current decline at Vm > +30 mV in bEAG2.
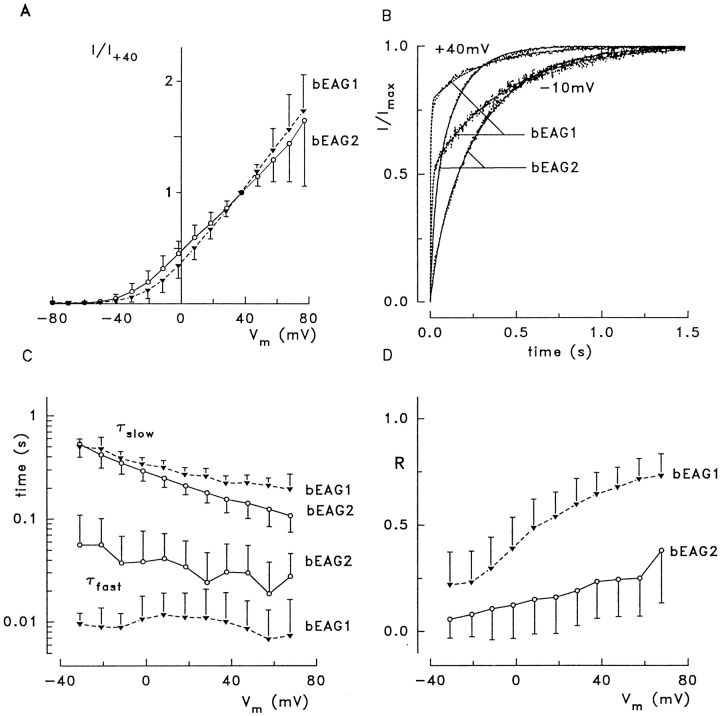
The voltage dependence of current activation was similar for both splice forms; the activation threshold was roughly −45 mV (Fig. 4 A). The time course of channel activation was characterized by two kinetic components that could be fitted with the sum of two weighted exponential functions:
 |
1 |
Figure 4.
Voltage dependence of EAG channel activation at 1 mM [Ca2+]o and 1 mM [Mg2+]o. (A) Current-to-voltage relation of bEAG channel-mediated whole-cell current. All currents are normalized to the current measured at +40 mV. Activation threshold for both channel forms is −50 mV. Mean values ± SD of normalized currents were recorded from eight (bEAG1, ▾) and seven (bEAG2, ○) different cells. The large standard deviations at Vm > 60 mV are due to decline of the current in some of the cells. (B) Activation kinetics of K+ currents after a step from −80 mV to the indicated membrane voltage. The dots represent values of current, lines represent fits of Eq. 1 to the data; dashed lines are for bEAG1, solid lines for bEAG2. The fits gave values of R, τfast, and τslow for bEAG1 (bEAG2) of: 0.78 (0.36), 4.2 (24.7), and 297 (146) ms at +40 mV, and 0.51 (0.16), 9.2 (24.7), and 408 (305) ms at −10 mV. (C) Voltage dependence of the activation time constants. (D) Voltage dependence of the fraction of the fast activating component, R.
wherein τfast and τslow represent the fast and slow time constant, respectively, and R the fraction of the fast kinetic component.
In Fig. 4 B, current recordings were normalized to facilitate comparison of the activation time courses of both channel forms. Currents were activated by stepping the holding voltage from −80 mV to either −10 or +40 mV. The current traces are superimposed with curves that have been fitted to the data with Eq. 1. With both voltage steps, activation of bEAG1 proceeded faster than activation of bEAG2. Analysis of the voltage dependence of τfast, τslow, and R is shown in Fig. 4, C and D. Both time constants (τfast and τslow) were moderately voltage dependent, showing a small decrease towards depolarized voltages (Fig. 4 C). Mean values ± SD for τfast at 0 mV were 10.6 ± 7.3 ms (n = 8) for bEAG1 and 38.4 ± 37 ms (n = 7) for bEAG2. Mean values for τslow at 0 mV were similar for both channels: 340 ± 53 ms (n = 8) for bEAG1 and 291 ± 59 ms (n = 7) for bEAG2. The fraction of the fast activating component, R, in both channel forms increased towards more positive voltages (Fig. 4 D). Mean values ± SD of R determined at 0 mV were 0.39 ± 0.15 (n = 8) for bEAG1 and 0.12 ± 0.15 (n = 7) for bEAG2. In conclusion, the faster activation of bEAG1 currents is due to a larger contribution of the fast activating component. Because both channels differ only in the S3–S4 linker, this extracellular loop probably controls movements of the S4 motif during voltage steps and thereby exerts its effect on channel gating.
Mg2+ Modulates Channel Activation
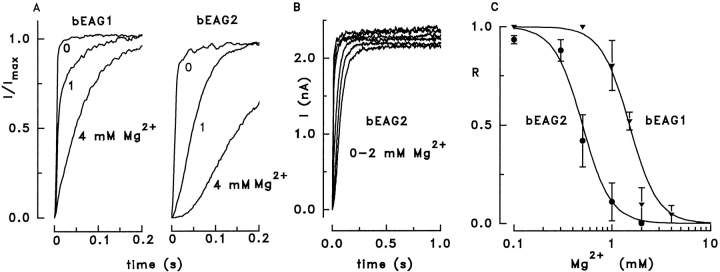
The rat homologue of bEAG is sensitive to extracellular Mg2+ (Terlau et al., 1996). We therefore examined whether the two splice variants of bEAG differ in their Mg2+ sensitivity. The time course of channel activation was dependent on the extracellular Mg2+ concentration ([Mg2+]o). Increasing [Mg2+]o from nominally 0 to 4 mM reversibly slowed the speed of current activation in both channel forms (Fig. 5 A). The bEAG1 channel was less sensitive to [Mg2+]o than the bEAG2 channel (Fig. 5 A). The steady state current amplitude was not affected by [Mg2+]o. Fig. 5 B shows six traces recorded from the same cell at five different Mg2+ concentrations over a period of 9 min. The progressive decrease of the steady state current (∼10%) was also observed with constant Mg2+ concentration and, therefore, does not reflect a Mg2+ effect. The slower time course of activation was solely due to suppression of the fraction of the fast component; the time constants themselves were not significantly affected by extracellular Mg2+ (data not shown). In Mg2+-free solution, both channel forms show an R value close to unity. When [Mg2+]o is increased, R becomes smaller. For bEAG1 and bEAG2, 4 and 1 mM [Mg2+]o, respectively, were sufficient to abolish completely the fast kinetic component at +20 mV. Fig. 5 C shows the dependence of R on the Mg2+ concentration. Data represent the mean from three cells for each splice variant. Records were analyzed at five [Mg2+]o for each cell. The solid lines in Fig. 5 C were constructed using a modified Hill equation
 |
2 |
Figure 5.
Modulation of channel activation kinetics by extracellular Mg2+. (A) Current activation of bEAG1 and bEAG2 channels at 1 mM [Ca2+]o and various values of [Mg2+]o. bEAG channels were activated by voltage steps from −80 to +20 mV. Increasing [Mg2+]o slowed down current activation in both channels, but bEAG2 was more sensitive to changes in [Mg2+]o. Each trace was normalized to its maximal current amplitude. (B) Current traces after voltage steps from −80 to +20 mV at 0, 0.1, 0.3, 0.5, 1, and 2 mM extracellular Mg2+. Traces were recorded at intervals of 90 s from a cell expressing bEAG2. (C) Dependence of the fraction of the fast activating component, R, on [Mg2+]o. Mean values ± SD were obtained from three cells for each channel at +20 mV. The solid lines were constructed with a modified Hill equation as described in the text.
with K 1/2 values of 1.5 and 0.5 mM for bEAG1 and bEAG2, respectively, and with a Hill coefficient n = 3 for both channel forms. The high cooperativity along with the inability of other divalent cations to change channel kinetics (see below) indicates specific binding of Mg2+ to the channel and rules out alternative explanations such as surface charge screening. When [Mg2+]o was increased to values higher than necessary to suppress completely the fast kinetic component, the current activation was further slowed down, and the time course adopted a sigmoidal shape that is no longer described by Eq. 1 (Fig. 5 A; bEAG2 at 4 mM). Our results demonstrate that a mechanism that induces fast current activation is suppressed by extracellular Mg2+ in a cooperative fashion, and that the bEAG2 channel displays a higher Mg2+ sensitivity than the bEAG1 channel. These results fully agree with a more quantitative description of rat EAG channel gating by voltage and [Mg2+]o (Terlau et al., 1996).
bEAG Is Sensitive to Extracellular Ba2+ and Insensitive to Cs+/Cd2+
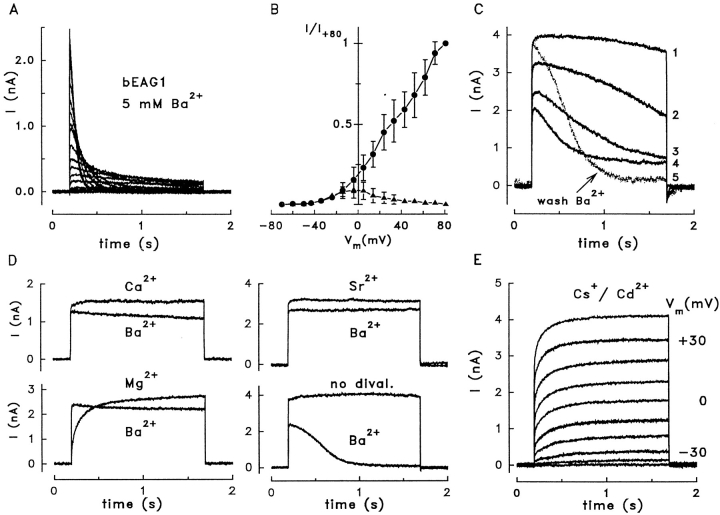
Because the bEAG1 transcript is expressed in the inner segment layer, we compared IEAG with identified currents in rod photoreceptors. Mammalian EAG currents (Ludwig et al., 1994; Terlau et al., 1996; this article) are strikingly similar to IKx, a K+ current in the inner segment (Beech and Barnes, 1989). Both EAG and Kx channels are K+ selective, become activated at Vm ≥ −50 mV, do not inactivate, and have a similar pharmacology (see Table I and discussion). We examined whether two additional features of IKx, its inhibition by extracellular Ba2+ ([Ba2+]o) (Beech and Barnes, 1989; Wollmuth, 1994) and its low sensitivity to Cs+/Cd2+, are also shared by the bEAG1 channel. In the presence of 5 mM extracellular Ba2+ and in the absence of other divalent cations, bEAG1 showed strong voltage-dependent inactivation (Fig. 6 A) that was reminiscent of C-type inactivation in Shaker K+ channels (e.g., Hoshi et al., 1990; Baukrowitz and Yellen, 1995) and in HERG channels (Schönherr and Heinemann, 1996; Smith et al., 1996). At Vm > +40 mV, the residual currents, measured at the end of activation pulses (Fig. 6, A and B, ▴), approached zero, indicating complete inactivation, whereas the voltage threshold of activation was not significantly altered by Ba2+ (Vthreshold ≈ −45 mV) (Fig. 6 B, •). Due to the rapid deactivation kinetics, we were unable to reliably determine the midpoint voltage (V1/2) of activation and the effects of Ba2+ on V1/2.
Table I.
Comparison of Properties of Salamander Rod Photoreceptor Kx and Mammalian EAG Currents
| IKx | IEAG | |||
|---|---|---|---|---|
| Ion selectivity PNa +/PK + * ‡ | 0.02 | <0.01 | ||
| Vm of activation* ‡ § 176 | ≥−50 mV | ≥−45 mV | ||
| Inactivation* ‡ § 176 | Noninactivating | Noninactivating | ||
| Deactivation time* § | ≤10 ms (−100 mV) | ∼1 ms (−120 mV) | ||
| ∼250 ms (−40 mV) | ∼3 ms (−40 mV) | |||
| Blockage* ‡ | TEA >> 4-AP | TEA >> 4-AP | ||
| Mg2+ modulation§ 176 | ND | Strong | ||
| Ba2+ inhibition* 176 | Suppression and V1/2 shift | Suppression and inactivation | ||
| Cs+/Cd2+ sensitivity* 176 | — | — | ||
| pHo sensitivity§ ‖ | ∼7 mV/decade | ∼15 mV/decade |
see also this paper.
Figure 6.
Effects of Ba2+ and Cs+/Cd2+ on bEAG1 currents. (A) Current traces recorded from a HEK 293 cell expressing bEAG1 channels; the extracellular solution contained 5 mM Ba2+ as the only divalent cation. Depolarizing voltage pulses of 1.5-s duration were applied from the holding voltage (−70 mV) to +80 mV in steps of 10 mV. To establish a steady state Ba2+ effect, eight pulses to +45 mV were applied before starting the pulse protocol. All pulses were applied in 15-s intervals. (B) Voltage dependence of channel activation in the presence of 5 mM Ba2+. Peak currents (•), and currents measured at the end of the 1.5-s pulses (▴) are normalized to the peak current at Vm = +80 mV (mean values ± SD from five cells). (C) Use dependence of Ba2+ effect on bEAG1. After 10 min in extracellular solution containing 5 mM Ba2+, the whole-cell configuration was established and depolarizing voltage pulses were applied in 15-s intervals from the holding voltage (−70 mV) to +45 mV. The numbers on the right of each trace indicate the sequence of pulses. For removal of Ba2+, the bath was perfused with extracellular solution without added divalent cations. (D) Exposure to Ca2+, Mg2+, or Sr2+ (5 mM) in the extracellular solution prevents Ba2+-dependent inactivation. The top trace in each panel shows the fifth depolarizing pulse (−70 to +45 mV) in the presence of the indicated divalent cation, but without Ba2+. After exchanging the test ion for 5 mM Ba2+, five pulses were applied in 15-s intervals, and the fifth pulse is superimposed for comparison. A reduction of current amplitude, but not inactivation, is observed with Ba2+ for the cells previously exposed to Ca2+, Mg2+, or Sr2+. In contrast, when no divalent cations were added during the first five pulses, subsequent pulses in 5 mM Ba2+ showed stronger suppression and almost complete inactivation of bEAG1 current. (E) Outward current conducted by bEAG1 in the presence of 5 mM Cs+ and 0.1 mM Cd2+ in the extracellular solution containing 0.5 mM Mg2+. Holding voltage was −70 mV; voltage steps in increments of +10 mV were applied for 1.5 s. In Cs+/Cd2+-free standard solution, this cell displayed a steady state current of 4.8 nA at +40 mV.
The modulation of bEAG1 by Ba2+ required the opening of channels. Even after prolonged exposure to extracellular Ba2+ (≤35 min), the currents activated by the first depolarizing pulse were similar to those in control cells (Fig. 6 C, 1). However, the time course of currents changed dramatically during subsequent pulses (Fig. 6 C, 2–4). A steady state that is characterized by a smaller peak current and pronounced inactivation was reached after three to five pulses. Pulse protocols for testing the voltage dependence of inactivation (Fig. 6 A) were applied in the steady state. After wash-out of Ba2+ (15 s), the suppression of the peak amplitude was removed but inactivation persisted for many minutes (Fig. 6 C, 5).
In the experiments described above, Ba2+ was the only divalent cation added to the extracellular solution. To test whether other divalent cations also cause use-dependent inactivation of bEAG1, we applied extracellularly 5 mM of either Ca2+, Mg2+, or Sr2+ during the first five depolarizing pulses. None of these ions induced inactivation as was observed with Ba2+ (Fig. 6 D). However, bEAG1 channels that have been first exposed to Ca2+, Mg2+, or Sr2+ during the first pulses did not inactivate throughout the next 30 pulses after replacement of the test ions by Ba2+ (Fig. 6 D), although the current was reduced by ∼20% in the presence of Ba2+. Thus, Ba2+ appears to affect bEAG1 in two ways: it suppresses the outward current by 20–50% (at Vm = +45 mV), and it induces a voltage-dependent channel inactivation when it enters the channel in the absence of other divalent cations. Although extracellular Ba2+ also changes IKx in rod photoreceptors of salamander, its effect is different (Beech and Barnes, 1989; Wollmuth, 1994). In the presence of 3 mM Ca2+, Ba2+ suppresses IKx and, in addition, shifts the activation threshold from −55 to −30 mV.
IKx is the only K+ current in photoreceptor cells resistant to 5 mM Cs+/0.1 mM Cd2+ (Beech and Barnes, 1989). We therefore tested the effects of Cs+/Cd2+ on bEAG1. 5 mM Cs+/0.1 mM Cd2+ in the extracellular solution neither affected the kinetics nor the activation threshold of bEAG1 (Fig. 6 E; six cells). In conclusion, both Kx and EAG channels are affected by Ba2+ and are resistant to extracellular Cs+/Cd2+ (see discussion).
Do Cyclic Nucleotides Modulate EAG Channels?
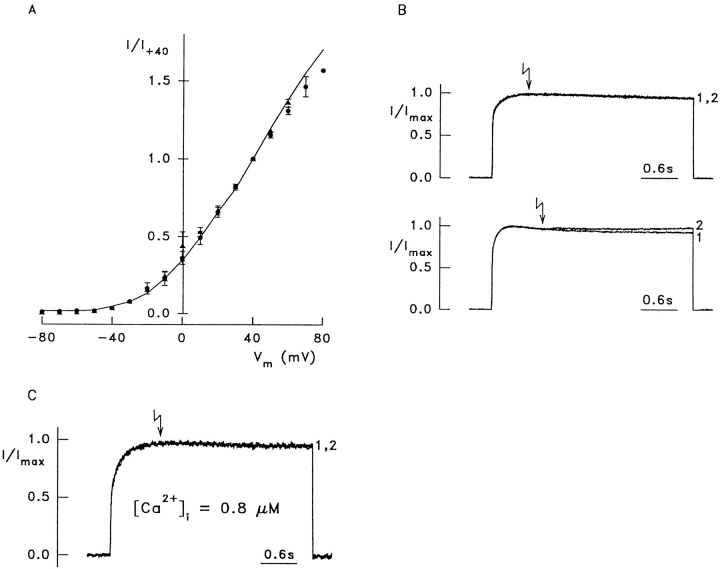
Because of the relatively high sequence similarity between DmEAG and its mammalian homologues, it was surprising that only the Drosophila channel was reported to be sensitive to cAMP (Brüggemann et al., 1993; Ludwig et al., 1994). We therefore examined modulation of the bEAG channels expressed in HEK 293 cells by cAMP and cGMP. Fig. 7 A shows the voltage dependence of bEAG1-mediated whole-cell currents in the absence of cyclic nucleotides (solid line) and after incubation of two different sets of cells for 5 min with either 5 mM of the membrane-permeant 8-Br-cAMP (▴, mean of seven cells) or 8-Br-cGMP (•, mean of six cells) in the extracellular solution. No significant difference was observed between the steady state current– voltage relations with and without cyclic nucleotides.
Figure 7.
Bovine EAG channels are not modulated by cyclic nucleotides. (A) Voltage dependence of bEAG1-mediated whole-cell current in the absence (line, mean of 15 cells) and in the presence of either 5 mM 8-Br-cAMP (▴, mean of seven cells) or 5 mM 8-Br-cGMP (•, mean of six cells). All currents are normalized to +40 mV; [Ca2+]o and [Mg2+]o were 1 mM. Cyclic nucleotides were applied in standard extracellular solution at least 5 min before recording. (B) Recordings from two cells loaded with 100 μM caged 8-Br-cAMP. bEAG1-mediated currents during voltage steps from −80 to +20 mV were normalized for comparison. Current activated by the first voltage pulse (1), current activated by the second pulse (2). The arrows indicate the time when UV flashes were applied during the second pulse, releasing ∼20 μM 8-Br-cAMP. (top) No response can be seen (13 of 22 cells). (bottom) A typical current increase induced by release of 8-Br-cAMP in 9 of 22 cells. (C) Photorelease of 8-Br-cAMP (arrow) in a cell at 0.8 μM [Ca2+]i (measured with Fura-2). The pipette contained 100 μM caged 8-Br-cAMP. Voltage step from −80 to +20 mV.
Superfusion with membrane-permeant cyclic nucleotides in the whole-cell configuration has several disadvantages. In particular, the concentration of cyclic nucleotides inside the cell is not known and transient modulation of the channel by cyclic nucleotides may be obscured. We therefore used a technique that involves rapid photorelease of hydrolysis-resistant 8-Br-cAMP or 8-Br-cGMP from caged compounds (for review see Adams and Tsien, 1993). This method has the extra advantage that persistent concentration steps of cyclic nucleotides are generated rapidly inside the cell. The method and the calibration of the concentration steps of 8-Br-cAMP and 8-Br-cGMP inside the cell have been described previously (Hagen et al., 1996).
HEK 293 cells expressing bEAG1 were loaded for 5 min by dialysis from pipettes that contained solutions of caged compounds. Caged 8-Br-cAMP was used at concentrations of 5, 20, and 100 μM within the pipettes. Under these conditions, the contamination by free 8-Br-cAMP within the cell is less than 0.1, 0.4, and 2 μM, respectively (Hagen et al., 1996). Irradiation of 100 μM caged compound with a single flash of UV light (365 nm) of 200-ms duration resulted in the liberation of ∼20 μM 8-Br-cAMP. At lower concentrations of the caged compound, correspondingly lower concentrations of the free cyclic nucleotide were released.
bEAG1 channels were first activated by stepping Vm from −80 to +20 mV for 3.4 s to record the control current (Fig. 7 B, 1). During a subsequent identical voltage pulse (Fig. 7 B, 2), a UV flash was applied to release the cyclic nucleotide (arrows). In most experiments, the current amplitude decreased in small decrements between successive voltage pulses. Therefore, the two current amplitudes were first normalized and then superimposed for comparison. With 5 or 20 μM caged 8-Br-cAMP, the current was not affected by the photorelease of 8-Br-cAMP (five cells each, data not shown). When 100 μM caged 8-Br-cAMP was used, no change in bEAG currents was detected in the majority of cells (Fig. 7 B, top). However, 9 of 22 cells tested responded with a slight increase of the bEAG1-mediated current (Fig. 7 B, bottom). This increase in current was not significantly enhanced at +60 mV. Photolysis of caged 8-Br-cGMP (80 μM, eight cells) or caged ATP (100 μM, four cells) did not induce any change in current. In the absence of caged compounds, as well as in nontransfected cells loaded with 100 μM caged 8-Br-cAMP, UV flashes had no effect on the current response (data not shown). Taken together, these data suggest that bEAG1 does not respond to 8-Br-cAMP concentrations ≤20 μM under our experimental conditions, or very weakly at 8-Br-cAMP concentrations ≥20 μM.
In experiments with DmEAG, rather high concentrations of cAMP (2 mM) were used to demonstrate cAMP sensitivity in excised patches (Brüggemann et al., 1993). Therefore, in a few experiments (bEAG1, n = 7; bEAG2, n = 6), we included 5 mM 8-Br-cAMP in the pipette while measuring whole-cell currents. No significant changes in activation threshold, activation time constants, or Mg2+ sensitivity were observed under these conditions (data not shown).
Ligand sensitivity of CNG channels is regulated by Ca2+/Calmodulin (for reviews see Kaupp, 1995; Finn et al., 1996; Molday, 1996). Therefore, we considered the possibility that modulation of bEAG currents by 8-Br-cAMP requires higher levels of [Ca2+]i. Fig. 7 C shows a representative experiment with 0.8 μM Ca2+ and 100 μM caged 8-Br-cAMP in the pipette. The [Ca2+]i has been adjusted by Ca2+/EGTA buffer and verified by Fura-2 measurements. bEAG1 showed normal activation properties even at [Ca2+]i exceeding the expected physiological range (Fig. 7 C, 1). The UV flash (Fig. 7 C, arrow) produced only a barely noticeable current increase in two of five cells (Fig. 7 C, 2). This minute increase was not significantly different from that observed in cells with low [Ca2+]i (Fig. 7 B). We conclude that bEAG channels are insensitive to 8-Br-cAMP irrespective of [Ca2+]i. Quite unexpectedly, even at [Ca2+]i as high as 10 μM (data not shown), we found no evidence for Ca2+-dependent channel inactivation as has been reported for the rat EAG channel (Stansfeld et al., 1996).
Ca2+ Permeation
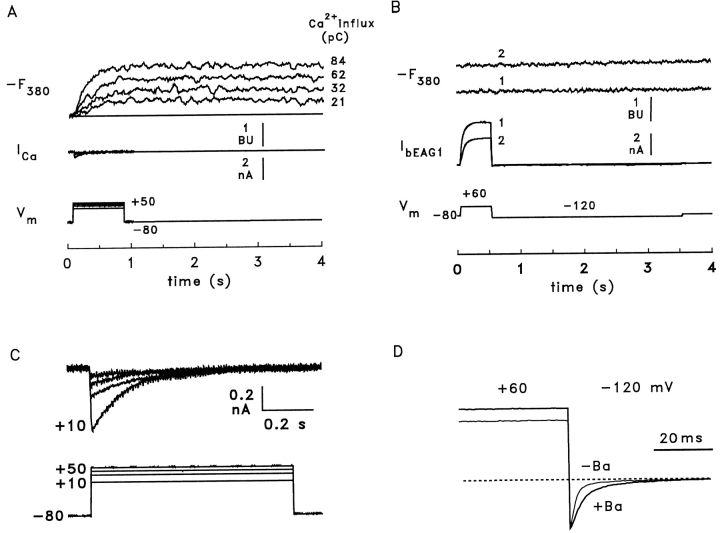
We measured directly the Ca2+ permeation of bEAG channels using a fluorimetric method developed to quantitate the Ca2+ influx through Ca2+-permeable channels (Neher and Augustine, 1992; Schneggenburger et al., 1993; Frings et al., 1995). HEK 293 cells expressing either form of the bEAG channel were loaded with 1 mM Fura-2 in the whole-cell patch-clamp configuration. Inward current and Ca2+ influx were measured simultaneously in the presence of high [Ca2+]o. The lower limit for the amount of Ca2+ that can be detected by this technique was estimated using HEK 293 cells transfected with cloned Ca2+ channel subunits from rabbit brain (BIII Ca2+ channel; Fujita et al., 1993; Frings et al., 1995). Fig. 8 A shows a series of whole-cell currents (ICa) and simultaneous fluorescence recordings (−F380) after activation of Ca2+ channels by stepping the voltage from a holding value of −80 to +10–50 mV for 800 ms (Vm). To allow comparison of currents through Ca2+ and EAG channels, as well as the resulting fluorescence signals, traces are displayed on the same scale in Fig. 8, A and B. Fig. 8 C shows the Ca2+ channel traces at higher resolution. The high sensitivity of the method allows detection of a Ca2+ influx carrying ∼10 pC of charge, or 3 × 10⁷ Ca2+ ions (Fig. 8 A). The experimental protocol to measure Ca2+ permeation of bEAG channels was similar to that described by Brüggemann et al. (1993). bEAG channels were first activated by stepping Vm from −80 to +60 mV for 500 ms; subsequently, the cell was hyperpolarized to −120 mV to provide a strong driving force for Ca2+ entry during deactivation of the channels (Fig. 8 B). To prolong the deactivation time, 1 μM BaCl2 was included in the extracellular solution (Brüggemann et al., 1993). The effect of Ba2+ on the deactivation kinetics is illustrated in Fig. 8 D, which shows normalized tail currents recorded at an elevated extracellular K+ concentration (50 mM). The deactivation time constant was 1.8 ± 0.32 ms (n = 4) without Ba2+ and 4.2 ± 3.2 ms (n = 5) with 1 μM Ba2+. Assuming the same deactivation kinetics for the fluorescence experiments, a peak Ca2+ current of −2.5 pA at −120 mV would generate 10 pC of Ca2+ influx, which would be clearly detectable by the fluorescence measurements. However, in the presence of Ba2+, influx of Ca2+ was observed at neither 1 nor 80 mM [Ca2+]o in cells expressing bEAG1 (Fig. 8 B; n = 5). Identical results were obtained with bEAG2 (two experiments, data not shown). Ca2+ influx was also not detected during 1-s pulses to +30 mV ([Ca2+]o = 80 mM, data not shown). For these conditions, there is still a sizeable driving force for Ca2+, and the prolonged channel opening should give rise to detectable Ca2+ influx. These results demonstrate that homomeric bovine EAG channels show very little, if any, Ca2+ permeation.
Figure 8.
Bovine EAG channels are not permeable to Ca2+. (A) Sensitivity of the method for detection of Ca2+ influx. A HEK 293 cell expressing BIII Ca2+ channels was voltage clamped at −80 mV and Ca2+ currents were activated by 800-ms voltage steps to +10, +30, +40, and +50 mV (ICa), Ca2+ influx was monitored by changes in fluorescence of Fura-2 (−F380). BIII Ca2+ channels inactivate with time constants of 130–150 ms. For comparison, fluorescence and current signals are scaled as in B. Fluorescence intensity was normalized using fluorescent microbeads as described in Frings et al. (1995). 1 bead unit (BU) represents the fluorescence of one microbead. (B) A HEK 293 cell expressing bEAG1 channels was loaded with 1 mM Fura-2 and held at −80 mV. Channels were first activated by a 500-ms voltage pulse to +60 mV; subsequently, the cell was hyperpolarized to −120 mV to create a large driving force for Ca2+ entry during channel deactivation. The extracellular solution contained either 1 mM Ca2+ (1) or 80 mM Ca2+ (2). The current carried by bEAG1 channels was ∼30% smaller at high [Ca2+]o. The fluorescence traces (−F380) corresponding to low (1) and high (2) [Ca2+]o show no detectable Ca2+ influx. The elevated value of −F380 of ∼1 BU shown in trace 2 indicates a slightly elevated cytosolic Ca2+ concentration in the presence of 80 mM extracellular Ca2+. Saturation of the dye with Ca2+ caused an increase of −F380 by > 5 BU (not shown). (C) Ca2+ currents from A at higher resolution. (D) Tail currents recorded during deactivation of bEAG1. Representative traces were obtained from two cells with 50 mM extracellular K+ during voltage steps from +60 to −120 mV and normalized to the peak of the inward current. Absolute current amplitudes were −1.77 nA without and −2.35 nA with Ba2+. Addition of 1 μM extracellular Ba2+ increased the mean deactivation time constant from 1.8 ± 0.32 ms (n = 4) to 4.2 ± 3.2 ms (n = 5).
discussion
Although several K+ channels encoded by the eag gene family have been studied by heterologous expression, their physiological function remained elusive. The principal conclusion from the present experiments is that bovine EAG splice variants that differ in activation kinetics and Mg2+ sensitivity are expressed in both retinal photoreceptors and ganglion cells. In the following, we argue that the bEAG polypeptide may represent a subunit of Kx, a previously identified K+ channel in the inner segment of rod photoreceptors.
Does an EAG Channel Carry the Outward Dark Current in the Rod Inner Segment?
In the dark, a circulating steady current flows through cGMP-gated channels into the outer segment of rod photoreceptors, passes through the connecting cilium, and then leaves the cell at the inner segment (Bader et al., 1979; Baylor et al., 1984a , 1984b ). The inward dark current is carried mainly by Na+ and less by Ca2+ (Nakatani and Yau, 1988), whereas the outward dark current leaving the inner segment is carried by K+ ions. This K+-selective current has been dubbed IKx (Beech and Barnes, 1989). Several functional similarities between IKx and IEAG are striking (Table I), and suggest that EAG polypeptides might be part of the IKx pathway. Other currents identified in the rod inner segment show no similarity to EAG currents: a nonselective current Ih activates at hyperpolarized voltages, and a Ca2+-activated K+ current, as well as Ca2+ or Ba2+ currents, are all abolished by 5 mM Cs+/0.1 mM Cd2+ (Beech and Barnes, 1989). In fact, Cs+/Cd2+ have been applied to isolate experimentally IKx from other currents (Beech and Barnes, 1989). Because bEAG currents are also resistant to Cs+/Cd2+, bEAG subunit(s) are likely candidates to be subunits of Kx channels.
However, EAG and Kx channels differ significantly in their deactivation kinetics and possibly in some aspects of Ba2+ sensitivity. Rat and bovine EAG channels deactivate within a few milliseconds (Terlau et al., 1996; this article), whereas Kx deactivates 10- to 100-fold slower (Beech and Barnes, 1989). The rate of deactivation of Kx displays a bell-shaped voltage dependence that is less pronounced in mammalian EAG (Beech and Barnes, 1989; Terlau et al., 1995; data not shown; see Table I). The currents carried by Kx and bEAG1 are both attenuated by extracellular Ba2+, but the strong Ba2+-induced inactivation of bEAG1 is not observed with Kx. As we were unable to measure V1/2 of bEAG activation, we do not know if Ba2+ also shifted V1/2 to more positive voltages. These differences would make a comparison of bEAG and Kx less convincing. How can we reconcile these discrepancies? First, the Ba2+ effect on IKx was studied in presence of 3 mM extracellular Ca2+. With external Ca2+ present, the strong use-dependent inactivation of bEAG1 by Ba2+ is also prevented (Fig. 6 D). Second, EAG channel kinetics vary among species; for example, deactivation of DmEAG proceeds almost 100-fold slower than deactivation of bovine or rat EAG. Thus, variations among species could account for the difference in kinetics of IKx in the inner segment of salamander when compared with heterologously expressed bovine EAG. In fact, the fast kinetics of bovine and rat EAG channels may reflect an adjustment to the fast photoresponse of rods from the mammalian retina (Baylor et al., 1984; for a comprehensive discussion see Pugh and Lamb, 1993).
The resolution of the apparent differences between IKx, as determined in salamander rods and mammalian EAG currents, could, in principle, be accomplished by cloning and heterologous expression of EAG channels from salamander photoreceptors; however, to the present, neither we nor others have succeeded expressing clones of channels from amphibians. On the other hand, attempts to characterize IKx in the bovine rod photoreceptor were unsuccessful due to the small size of mammalian photoreceptors (S. Barnes, personal communication). Finally, it has been shown that mutations in the eag gene of Drosophila affect four different K+ channels (Zhong and Wu, 1991, 1993). Coexpression of DmEAG with Shaker K+ channel subunits alters the kinetics of EAG channel gating (Chen et al., 1996). These observations support the possibility that native Kx channels are composed of several types of subunits, one of which is bEAG. The determination of the subunit composition of Kx channels, in either amphibians or mammals, is outside the scope of our present study.
If EAG in fact is a component of Kx channels, then some of the properties of EAG might provide mechanisms for modulation of the rod photoreceptor response. Because of (a) the steep Mg2+ dependence of EAG activation kinetics and (b) the competitive effect of H+ on the Mg2+ dependence (Terlau et al., 1996), changes in [Mg2+]o and pHo are expected to alter the kinetics of the light response. Significant changes in the concentration of several ion species in the small interphotoreceptor space including calcium (Gold and Korenbrot, 1980; Yoshikami et al., 1980; Gold, 1986), potassium (Oakley et al., 1979), and protons (Ward and Ostroy, 1972) have been observed during the light response of rod photoreceptors.
Modulation by [Mg2+]o
In accordance with a recent report (Terlau et al., 1996), our data support the notion that, upon binding of Mg2+ ions to an extracellular site, the EAG polypeptide undergoes a conformational transition whereby the channel enters a closed state that permits only slow activation. Where does extracellular Mg2+ bind? Recent studies of voltage-gated Ca2+ and K+ channels have provided substantial evidence for a role of the S3–S4 linker in the control of activation kinetics. Nakai et al. (1994) demonstrated that this domain is necessary (but not sufficient) to determine activation kinetics in skeletal muscle Ca2+ channels. More recently, Mathur et al. (1997) have analyzed the role of the S3–S4 linker in chimeric channel polypeptides constructed from the Shaker K+ channel as acceptor and other K+ channels of Drosophila as donors. Replacement of the Shaker S3–S4 linker with the respective linkers from Shab, Shal, or Shaw causes an increase of activation rate in chimeric channels as predicted from the activation rates observed in the four wild-type channels. In DmEAG channels, Tang and Papazian (1997) showed that deletion of five charged amino acids that form the NH2-terminal part of the S3–S4 linker slows activation in the presence of 0.8 mM [Mg2+]o. In summary, these data suggest that the S3–S4 linker is part of a domain that determines the activation rate in K+ channels. Consistent with this notion is our finding that insertion of an additional 27 amino acids within the S3–S4 linker of bEAG2 changes the activation kinetics of expressed bEAG channels. Taken together, these data indicate that the Mg2+ binding site is located within or near the S3–S4 linker and that the insertion of bEAG2 participates in Mg2+ binding. Alternatively, the Mg2+ binding site could be located in other regions of the channel polypeptide and, by some allosteric mechanism, may interact with the S3–S4 linker. In many Mg2+ binding sites, ions are held in an octahedral arrangement of six oxygen atoms donated by water molecules or by carboxyl groups of aspartate or glutamate residues (Williams, 1993). The S3–S4 linker of bEAG1, and more so the S3–S4 linker of bEAG2, contains several aspartate and glutamate residues that are likely candidates for chelating Mg2+ ions (Fig. 1 B). If EAG channels, like other K+ channels (MacKinnon, 1991), form tetrameric complexes, a cooperativity of n = 3 for the Mg2+ modulation suggests that each subunit may accommodate a single Mg2+ ion.
Ca2+ Ions Do Not Permeate bEAG Channels
Extensive mutagenesis studies have been performed to elucidate structural determinants of ion selectivity and permeation in various cation channels. A characteristic pair of residues (YG) sets apart the pore signature sequence of channels that are K+ selective and Ca2+ impermeable from channels that are not K+ selective and conduct Ca2+; i.e., voltage-activated Ca2+ channels and CNG channels (Heginbotham et al., 1992; Sather et al., 1994). The pore region of EAG channels contains at the corresponding position a similar motif (FG), suggesting that EAG channels are K+ selective. Moreover, Glu residues in the pore loop of CNG and Ca2+ channels, which are crucially important for the interaction with Ca2+ (Root and MacKinnon, 1993; Eismann et al., 1994), are absent in the pore region of EAG channels. Indeed, using a very sensitive detection method, we did not find any evidence for Ca2+ permeation in bEAG channels. It is therefore surprising that the DmEAG channel has been reported to be Ca2+ permeable (Brüggemann et al., 1993), even though the pore regions of EAG channels from mammals and the fly are largely conserved (Warmke et al., 1991; Warmke and Ganetzky, 1994; this article).
A Cyclic Nucleotide-binding Motif without a Function?
A binding motif for cyclic nucleotides present in EAG raises the possibility that EAG channels are directly regulated by either cAMP or cGMP. If EAG forms a subunit of Kx, its control by cyclic nucleotides would be an intriguing concept with interesting implications for photoreceptor physiology. Previous studies (Ludwig et al., 1994; Robertson et al., 1996) detected no modulation of EAG channels by either cyclic nucleotide. We extended these studies by showing for bEAG that 8-Br-cAMP or 8-Br-cGMP were ineffective even when rapidly produced inside the cell from caged compounds. Our method permits generating up to 20 μM of the ligand within a few milliseconds. The concentration steps should be sufficiently large, rapid, and persistent to allow channel modulation. In agreement with the previous studies, we detected no modulation of bEAG channels by cyclic nucleotides.
What could be the significance of a cyclic nucleotide-binding motif in EAG channels? In larval muscle of Drosophila, Zhong and Wu (1993) observed modulation of a K+ current by cGMP analogues; this modulation was altered or even abolished in several eag mutants. These observations suggest that cyclic nucleotide sensitivity requires several distinct subunits, one of which is DmEAG. Similarly, it is possible that the subunit composition of Kx channels in retinal cells changes during development, and that cyclic nucleotide sensitivity may be conferred only on distinct combinations of subunits at specific time(s) in development.
Acknowledgments
We thank Drs. W. Stühmer, L. Pardo, H. Terlau (Max-Planck-Institut, Göttingen, Germany) and Drs. E. Eismann, F. Müller, R. Seifert (Forschungszentrum Jülich) for fruitful discussions and helpful comments on the manuscript. We greatly appreciate the help of Dr. J.E. Brown (Albert Einstein College of Medicine, New York) in improving the manuscript. We are particularly grateful to Drs. S. Barnes and D.E. Kurenny (University of Calgary, Calgary, Alberta, Canada) for many helpful discussions, sharing unpublished data on IKx, and attempts to measure IKx in bovine rod photoreceptors. We gratefully acknowledge the help of S. Balfanz with the in situ hybridization and A. Eckert for preparing the manuscript. The nucleotide sequences for beag1 and beag 2 have been submitted to European Molecular Biology Laboratory Database under accession numbers Y13430 and Y13431, respectively.
This work was supported by a grant from the Deutsche Forschungsgemeinschaft (to S. Frings) and a stipend from the Studienstiftung des Deutschen Volkes (to C. Dzeja).
Footnotes
Abbreviations used in this paper: CNG, cyclic nucleotide-gated; EAG, ether-à-go-go.
references
- Adams SR, Tsien RY. Controlling cell chemistry with caged compounds. Annu Rev Physiol. 1993;55:755–784. doi: 10.1146/annurev.ph.55.030193.003543. [DOI] [PubMed] [Google Scholar]
- Ahmad I, Leinders-Zufall T, Kocsis JD, Shepherd GM, Zufall F, Barnstable CJ. Retinal ganglion cells express a cGMP-gated cation conductance activatable by nitric oxide donors. Neuron. 1994;12:155–165. doi: 10.1016/0896-6273(94)90160-0. [DOI] [PubMed] [Google Scholar]
- Attwell D, Wilson M. Behavior of the rod network in the tiger salamander retina mediated by membrane properties of individual rods. J Physiol (Camb) 1980;309:287–315. doi: 10.1113/jphysiol.1980.sp013509. [DOI] [PMC free article] [PubMed] [Google Scholar]
- Bader CR, MacLeish PR, Schwartz EA. A voltage-clamp study of the light response in solitary rods of the tiger salamander. J Physiol (Camb) 1979;296:1–26. doi: 10.1113/jphysiol.1979.sp012988. [DOI] [PMC free article] [PubMed] [Google Scholar]
- Barnes S. After transduction: response shaping and control of transmission by ion channels of the photoreceptor inner segment. Neuroscience. 1994;58:447–459. doi: 10.1016/0306-4522(94)90072-8. [DOI] [PubMed] [Google Scholar]
- Baukrowitz T, Yellen G. Modulation of K+ current by frequency and external [K+]: a tale of two inactivation mechanisms. Neuron. 1995;15:951–960. doi: 10.1016/0896-6273(95)90185-x. [DOI] [PubMed] [Google Scholar]
- Baumann A, Frings S, Godde M, Seifert R, Kaupp UB. Primary structure and functional expression of a Drosophilacyclic nucleotide-gated channel present in eyes and antennae. EMBO (Eur Mol Biol Organ) J. 1994;13:5040–5050. doi: 10.1002/j.1460-2075.1994.tb06833.x. [DOI] [PMC free article] [PubMed] [Google Scholar]
- Baylor DA, Matthews G, Nunn BJ. Location and function of voltage-sensitive conductances in retinal rods of the salamander, Ambystoma tigrinum. . J Physiol (Camb) 1984a;354:203–223. doi: 10.1113/jphysiol.1984.sp015372. [DOI] [PMC free article] [PubMed] [Google Scholar]
- Baylor DA, Nunn BJ, Schnapf JL. The photocurrent, noise and spectral sensitivity of rods of the monkey Macaca fascicularis. . J Physiol (Camb) 1984b;357:575–607. doi: 10.1113/jphysiol.1984.sp015518. [DOI] [PMC free article] [PubMed] [Google Scholar]
- Beech DJ, Barnes S. Characterization of a voltage-gated K+channel that accelerates the rod response to dim light. Neuron. 1989;3:573–581. doi: 10.1016/0896-6273(89)90267-5. [DOI] [PMC free article] [PubMed] [Google Scholar]
- Brüggemann A, Pardo LA, Stühmer W, Pongs O. Ether-à-go-go encodes a voltage-gated channel permeable to K+ and Ca2+and modulated by cAMP. Nature. 1993;365:445–448. doi: 10.1038/365445a0. [DOI] [PubMed] [Google Scholar]
- Chen M-L, Hoshi T, Wu C-F. Heteromultimeric interactions among K+ channel subunits from Shaker and eag families in Xenopusoocytes. Neuron. 1996;17:535–542. doi: 10.1016/s0896-6273(00)80185-3. [DOI] [PubMed] [Google Scholar]
- Drysdale R, Warmke J, Kreber R, Ganetzky B. Molecular characterization of eag: a gene affecting potassium channels in Drosophila melanogaster. . Genetics. 1991;127:495–505. doi: 10.1093/genetics/127.3.497. [DOI] [PMC free article] [PubMed] [Google Scholar]
- Eismann E, Müller F, Heinemann SH, Kaupp UB. A single negative charge within the pore region of a cGMP-gated channel controls rectification, Ca2+blockage and ionic selectivity. Proc Natl Acad Sci USA. 1994;91:1109–1113. doi: 10.1073/pnas.91.3.1109. [DOI] [PMC free article] [PubMed] [Google Scholar]
- Finn JT, Grunwald ME, Yau K-W. Cyclic nucleotide-gated ion channels: an extended family with diverse functions. Annu Rev Physiol. 1996;58:395–426. doi: 10.1146/annurev.ph.58.030196.002143. [DOI] [PubMed] [Google Scholar]
- Frings S, Seifert R, Godde M, Kaupp UB. Profoundly different calcium permeation and blockage determine the specific function of distinct cyclic nucleotide-gated channels. Neuron. 1995;15:169–179. doi: 10.1016/0896-6273(95)90074-8. [DOI] [PubMed] [Google Scholar]
- Fujita Y, Mynlieff M, Dirksen RT, Kim M-S, Niidome T, Nakai J, Friedrich T, Iwabe N, Miyata T, Furuichi T, et al. Primary structure and functional expression of the ω-conotoxin-sensitive N-type calcium channel from rabbit brain. Neuron. 1993;10:585–598. doi: 10.1016/0896-6273(93)90162-k. [DOI] [PubMed] [Google Scholar]
- Gold GH. Plasma membrane calcium fluxes in intact rods are inconsistent with the “calcium hypothesis.” . Proc Natl Acad Sci USA. 1986;83:1150–1154. doi: 10.1073/pnas.83.4.1150. [DOI] [PMC free article] [PubMed] [Google Scholar]
- Gold GH, Korenbrot JI. Light-induced calcium release by intact retinal rods. Proc Natl Acad Sci USA. 1980;77:5557–5561. doi: 10.1073/pnas.77.9.5557. [DOI] [PMC free article] [PubMed] [Google Scholar]
- Guy HR, Durell SR, Warmke J, Drysdale R, Ganetzky B. Similarities in amino acid sequences of Drosophila eagand cyclic nucleotide-gated channels. Science. 1991;254:730. doi: 10.1126/science.1658932. [DOI] [PubMed] [Google Scholar]
- Hagen V, Dzeja C, Frings S, Bendig J, Krause E, Kaupp UB. Caged compounds of hydrolysis-resistant analogues of cAMP and cGMP: synthesis and application to cyclic nucleotide-gated channels. Biochemistry. 1996;35:7762–7771. doi: 10.1021/bi952895b. [DOI] [PubMed] [Google Scholar]
- Heginbotham L, Abramson T, MacKinnon R. A functional connection between the pores of distantly related ion channels as revealed by mutant K+channels. Science. 1992;258:1152–1155. doi: 10.1126/science.1279807. [DOI] [PubMed] [Google Scholar]
- Hoshi T, Zagotta WN, Aldrich RW. Biophysical and molecular mechanisms of Shakerpotassium channel inactivation. Science. 1990;250:533–538. doi: 10.1126/science.2122519. [DOI] [PubMed] [Google Scholar]
- Kaupp UB. Family of cyclic nucleotide gated ion channels. Curr Opin Neurobiol. 1995;5:434–442. doi: 10.1016/0959-4388(95)80002-6. [DOI] [PubMed] [Google Scholar]
- Kozak M. Compilation and analysis of sequences upstream from the translational start site in eukaryotic mRNAs. Nucleic Acids Res. 1984;12:857–872. doi: 10.1093/nar/12.2.857. [DOI] [PMC free article] [PubMed] [Google Scholar]
- Kurenny DE, Barnes S. Proton modulation of M-like potassium current (IKx) in rod photoreceptors. Neurosci Lett. 1994;170:225–228. doi: 10.1016/0304-3940(94)90324-7. [DOI] [PubMed] [Google Scholar]
- Ludwig J, Terlau H, Wunder F, Brüggemann A, Pardo LA, Marquardt A, Stühmer W, Pongs O. Functional expression of a rat homologue of the voltage gated ether á go-go potassium channel reveals differences in selectivity and activation kinetics between the Drosophilachannel and its mammalian counterpart. EMBO (Eur Mol Biol Organ) J. 1994;13:4451–4458. doi: 10.1002/j.1460-2075.1994.tb06767.x. [DOI] [PMC free article] [PubMed] [Google Scholar]
- MacKinnon R. Determination of the subunit stoichiometry of a voltage-activated potassium channel. Nature. 1991;350:232–235. doi: 10.1038/350232a0. [DOI] [PubMed] [Google Scholar]
- Marrion NV. Does r-EAG contribute to the M-current? . Trends Neurosci. 1997;20:243. doi: 10.1016/s0166-2236(97)86998-6. [DOI] [PubMed] [Google Scholar]
- Mathie A, Watkins CS. Is EAG the answer to the M-current? . Trends Neurosci. 1997;20:14. doi: 10.1016/S0166-2236(96)20057-8. [DOI] [PubMed] [Google Scholar]
- Mathur R, Zheng J, Yan Y, Sigworth FJ. Role of the S3-S4 linker in Shakerpotassium channel activation. J Gen Physiol. 1997;109:191–199. doi: 10.1085/jgp.109.2.191. [DOI] [PMC free article] [PubMed] [Google Scholar]
- Molday RS. Calmodulin regulation of cyclic-nucleotide-gated channels. Curr Opin Neurobiol. 1996;6:445–452. doi: 10.1016/s0959-4388(96)80048-1. [DOI] [PubMed] [Google Scholar]
- Nakai J, Adams BA, Imoto K, Beam KG. Critical roles of the S3 segment and S3-S4 linker of repeat I in activation of L-type calcium channels. Proc Natl Acad Sci USA. 1994;91:1014–1018. doi: 10.1073/pnas.91.3.1014. [DOI] [PMC free article] [PubMed] [Google Scholar]
- Nakatani K, Yau K-W. Calcium and magnesium fluxes across the plasma membrane of the toad rod outer segment. J Physiol (Camb) 1988;395:695–729. doi: 10.1113/jphysiol.1988.sp016942. [DOI] [PMC free article] [PubMed] [Google Scholar]
- Neher E, Augustine GJ. Calcium gradients and buffers in bovine chromaffin cells. J Physiol (Camb) 1992;450:273–301. doi: 10.1113/jphysiol.1992.sp019127. [DOI] [PMC free article] [PubMed] [Google Scholar]
- Oakley B, II, Flaming DG, Brown KT. Effects of the rod receptor potential upon retinal extracellular potassium concentration. J Gen Physiol. 1979;74:713–737. doi: 10.1085/jgp.74.6.713. [DOI] [PMC free article] [PubMed] [Google Scholar]
- Pugh EN, Jr, Lamb TD. Amplification and kinetics of the activation steps in phototransduction. Biochim Biophys Acta. 1993;1141:111–149. doi: 10.1016/0005-2728(93)90038-h. [DOI] [PubMed] [Google Scholar]
- Robertson GA, Warmke JW, Ganetzky B. Potassium currents expressed from Drosophila and mouse eag cDNAs in Xenopusoocytes. Neuropharmacology. 1996;35:841–850. doi: 10.1016/0028-3908(96)00113-x. [DOI] [PubMed] [Google Scholar]
- Root MJ, MacKinnon R. Identification of an external divalent cation-binding site in the pore of a cGMP-activated channel. Neuron. 1993;11:459–466. doi: 10.1016/0896-6273(93)90150-p. [DOI] [PubMed] [Google Scholar]
- Sambrook, J., E.F. Fritsch, and T. Maniatis. 1989. Molecular Cloning: A Laboratory Manual. 2nd ed. Cold Spring Harbor Laboratory Press, New York.
- Sather WA, Yang J, Tsien RW. Structural basis of ion channel permeation and selectivity. Curr Opin Neurobiol. 1994;4:313–323. doi: 10.1016/0959-4388(94)90091-4. [DOI] [PubMed] [Google Scholar]
- Schneggenburger R, Zhou Z, Konnerth A, Neher E. Fractional contribution of calcium to the cation current through glutamate receptor channels. Neuron. 1993;11:133–143. doi: 10.1016/0896-6273(93)90277-x. [DOI] [PubMed] [Google Scholar]
- Schönherr R, Heinemann SH. Molecular determinants for activation and inactivation of HERG, a human inward rectifier potassium channel. J Physiol (Camb) 1996;493:635–642. doi: 10.1113/jphysiol.1996.sp021410. [DOI] [PMC free article] [PubMed] [Google Scholar]
- Smith PL, Baukrowitz T, Yellen G. The inward rectification mechanism of the HERG cardiac potassium channel. Nature. 1996;379:833–836. doi: 10.1038/379833a0. [DOI] [PubMed] [Google Scholar]
- Stansfeld CE, Röper J, Ludwig J, Weseloh RM, Marsh SJ, Brown DA, Pongs O. Elevation of intracellular calcium by muscarinic receptor activation induces a block of voltage-activated rat ether-à-go-gochannels in a stably transfected cell line. Proc Natl Acad Sci USA. 1996;93:9910–9914. doi: 10.1073/pnas.93.18.9910. [DOI] [PMC free article] [PubMed] [Google Scholar]
- Stansfeld C, Ludwig J, Roeper J, Weseloh R, Brown D, Pongs O. A physiological role for ether-à-go-go K+ channels? . Trends Neurosci. 1997;20:13–14. doi: 10.1016/S0166-2236(96)20058-X. [DOI] [PubMed] [Google Scholar]
- Tang C-Y, Papazian DM. Transfer of voltage independence from a rat olfactory channel to the Drosophila ether-à-go-go K+channel. J Gen Physiol. 1997;109:301–311. doi: 10.1085/jgp.109.3.301. [DOI] [PMC free article] [PubMed] [Google Scholar]
- Terlau H, Ludwig J, Pongs O, Stühmer W. Modulation of rat eagchannel by magnesium and reducing agents. Biophys J. 1995;68:A271. [Google Scholar]
- Terlau H, Ludwig J, Steffan R, Pongs O, Stühmer W, Heinemann SH. Extracellular Mg2+ regulates activation of rat eagpotassium channel. Pflügers Arch. 1996;432:301–312. doi: 10.1007/s004240050137. [DOI] [PubMed] [Google Scholar]
- Trudeau MC, Warmke JW, Ganetzky B, Robertson GA. HERG, a human inward rectifier in the voltage-gated potassium channel family. Science. 1995;269:92–95. doi: 10.1126/science.7604285. [DOI] [PubMed] [Google Scholar]
- Ward JA, Ostroy SE. Hydrogen ion effects and the vertebrate late receptor potential. Biochim Biophys Acta. 1972;283:373–380. doi: 10.1016/0005-2728(72)90253-8. [DOI] [PubMed] [Google Scholar]
- Warmke J, Drysdale R, Ganetzky B. A distinct potassium channel polypeptide encoded by the Drosophila eaglocus. Science. 1991;252:1560–1562. doi: 10.1126/science.1840699. [DOI] [PubMed] [Google Scholar]
- Warmke JW, Ganetzky B. A family of potassium channel genes related to eag in Drosophilaand mammals. Proc Natl Acad Sci USA. 1994;91:3438–3442. doi: 10.1073/pnas.91.8.3438. [DOI] [PMC free article] [PubMed] [Google Scholar]
- Williams RJP. Are enzymes mechanical devices? . Trends Biochem Sci. 1993;18:115–117. doi: 10.1016/0968-0004(93)90015-f. [DOI] [PubMed] [Google Scholar]
- Wollmuth LP. Mechanism of Ba2+block of M-like K channels of rod photoreceptors of tiger salamander. J Gen Physiol. 1994;103:45–66. doi: 10.1085/jgp.103.1.45. [DOI] [PMC free article] [PubMed] [Google Scholar]
- Yau K-W, Baylor DA. Cyclic GMP-activated conductance of retinal photoreceptor cells. Annu Rev Neurosci. 1989;12:289–327. doi: 10.1146/annurev.ne.12.030189.001445. [DOI] [PubMed] [Google Scholar]
- Yoshikami S, George JS, Hagins WA. Light-induced calcium fluxes from outer segment layer of vertebrate retinas. Nature. 1980;286:395–398. doi: 10.1038/286395a0. [DOI] [PubMed] [Google Scholar]
- Zhong Y, Wu C-F. Alteration of four identified K+ currents in Drosophila muscle by mutations in eag. . Science. 1991;252:1562–1564. doi: 10.1126/science.2047864. [DOI] [PubMed] [Google Scholar]
- Zhong Y, Wu C-F. Modulation of different K+ currents in Drosophila: a hypothetical role for the eag subunit in multimeric K+channels. J Neurosci. 1993;13:4669–4679. doi: 10.1523/JNEUROSCI.13-11-04669.1993. [DOI] [PMC free article] [PubMed] [Google Scholar]
- Zimmerman A. Cyclic nucleotide gated channels. Curr Opin Neurobiol. 1995;5:296–303. doi: 10.1016/0959-4388(95)80041-7. [DOI] [PubMed] [Google Scholar]
- Zufall F, Firestein S, Shepherd GM. Cyclic nucleotide-gated ion channels and sensory transduction in olfactory receptor neurons. Annu Rev Biophys Biomol Struct. 1994;23:577–607. doi: 10.1146/annurev.bb.23.060194.003045. [DOI] [PubMed] [Google Scholar]


