Abstract
Small-conductance Ca-activated K+ channels play an important role in modulating excitability in many cell types. These channels are activated by submicromolar concentrations of intracellular Ca2+, but little is known about the gating kinetics upon activation by Ca2+. In this study, single channel currents were recorded from Xenopus oocytes expressing the apamin-sensitive clone rSK2. Channel activity was detectable in 0.2 μM Ca2+ and was maximal above 2 μM Ca2+. Analysis of stationary currents revealed two open times and three closed times, with only the longest closed time being Ca dependent, decreasing with increasing Ca2+ concentrations. In addition, elevated Ca2+ concentrations resulted in a larger percentage of long openings and short closures. Membrane voltage did not have significant effects on either open or closed times. The open probability was ∼0.6 in 1 μM free Ca2+. A lower open probability of ∼0.05 in 1 μM Ca2+ was also observed, and channels switched spontaneously between behaviors. The occurrence of these switches and the amount of time channels spent displaying high open probability behavior was Ca2+ dependent. The two behaviors shared many features including the open times and the short and intermediate closed times, but the low open probability behavior was characterized by a different, long Ca2+-dependent closed time in the range of hundreds of milliseconds to seconds. Small-conductance Ca- activated K+ channel gating was modeled by a gating scheme consisting of four closed and two open states. This model yielded a close representation of the single channel data and predicted a macroscopic activation time course similar to that observed upon fast application of Ca2+ to excised inside-out patches.
Keywords: potassium channel, calcium-activated, single channel, afterhyperpolarization, gating
introduction
Intracellular Ca2+ is an important second messenger in most cell types. One pathway by which Ca2+ controls cellular functions is regulating the K+ efflux through the cell membrane. Ca2+-activated K+ channels have been demonstrated in many tissues and have been classified into large, intermediate, and small conductance Ca-activated K+ channels (BK, IK, and SK channels, respectively).1 The three classes differ with respect to their single channel conductance, Ca2+ sensitivity, voltage dependence, and pharmacology (Blatz and Magleby, 1987; Latorre et al., 1989; Ishii et al., 1997). While BK channels have been studied extensively, the biophysical properties of SK and IK channels are less well characterized.
SK channels were first identified in cultured rat skeletal muscle, where they appeared to open independent of membrane potential (Blatz and Magleby, 1986). These channels were more sensitive to Ca2+ and had a smaller single channel conductance than BK channels. In addition, they were blocked by the bee venom toxin apamin, but not by 5 mM tetraethylammonium (Blatz and Magleby, 1986). Since their initial discovery, SK channels have been described from a number of cell types including a rat pituitary cell line (Lang and Ritchie, 1987), T lymphocytes (Grissmer et al., 1992), and adrenal chromaffin cells (Park, 1994). In these cell types, SK channels were activated by submicromolar concentrations of intracellular Ca2+ (EC50 = 0.5–0.7 μM) in a voltage-independent manner. The single channel conductance was 4–14 pS in symmetrical 150–170 mM K+ and channels were blocked by apamin. Channels with similar characteristics have been observed in cultured rat hippocampal neurons (Lancaster et al., 1991). These channels were activated by 1 μM intracellular Ca2+ in a voltage-independent manner. In contrast to the above examples, these channels were not blocked by apamin (25 nM) and exhibited a single channel conductance of 18 pS in symmetrical 140 mM K+ (Lancaster et al., 1991).
The observation of apamin-sensitive and -insensitive Ca-activated channels with otherwise similar characteristics suggested the possibility of SK channel subtypes. The cloning of SK channels has revealed the existence of at least three members of a family (SK1–3). The amino acid sequence of the three subtypes was highly conserved, and hydrophobicity analysis predicted a secondary structure with six membrane-spanning regions. Further, two subtypes examined, rSK2 and hSK1, displayed a calcium dependence and single channel conductance similar to that observed for native channels (Köhler et al., 1996). As seen with native SK channels, differences in apamin sensitivity were observed for the cloned channels. For example, rSK2 was blocked by picomolar concentrations of apamin, whereas hSK1 was apamin insensitive (Köhler et al., 1996). Northern blot analysis showed the mRNA for rSK2 to be present in adrenal gland (Köhler et al., 1996), in agreement with the observation of apamin-sensitive SK channels in adrenal chromaffin cells (Park, 1994). In situ hybridization revealed that the mRNA encoding SK1 was expressed in rat hippocampus (Köhler et al., 1996).
SK channels underlie the prolonged afterhyperpolarization (slow AHP) following trains of action potentials in many neurons (Sah, 1996). The slow AHP differs between tissues in its time course and pharmacology. For example, in bullfrog sympathetic neurons (Pennefather et al., 1985; Goh and Pennefather, 1987), the slow AHP decays within several hundred milliseconds and is blocked by apamin. In contrast, the slow AHP recorded from hippocampal pyramidal neurons follows a slower time course, decaying over several seconds, and is insensitive to apamin (Lancaster and Adams, 1986; Storm, 1987). Both apamin-sensitive and -insensitive AHPs are present in rat and guinea pig vagal neurons (Sah and McLachlan, 1991; Sah, 1993) and cat cortical neurons (Schwindt et al., 1992). Apamin-sensitive and -insensitive AHPs from different tissues have properties suitable for a role in modulating the frequency of action potential firing (Lang and Ritchie, 1990; Neely and Lingle, 1992; Park, 1994; Yarom et al., 1985). This phenomenon has been studied in detail in hippocampal pyramidal neurons, where it is referred to as spike frequency adaptation (Madison and Nicoll, 1984).
In this study, the single channel properties of rSK2 and their dependence on voltage and calcium was examined. Two types of SK channel activity with very different open probabilities were observed, with the two behaviors sharing many characteristics. They were described by two open and three closed times. The open times and the short and intermediate closed times were the same for both types of channel activity, whereas the long closed time differed ∼10-fold. Only the long closed time was Ca dependent. Although relative contributions of open and closed times differed between the two types of channel activity, elevated intracellular Ca2+ favored longer openings and short closures in both behaviors.
methods
Channel Expression
All experiments used the apamin-sensitive clone rSK2 from rat brain cDNA expressed in Xenopus oocytes. Xenopus frogs were handled in accordance with the institutional guidelines and underwent no more than two surgeries separated by at least 3 wk. Standard techniques were practiced during in vitro mRNA synthesis, and oocyte handling and injection (Adelman et al., 1992). Oocytes were studied 15–48 h after injection with 2 ng of mRNA.
Solutions
During recording, oocytes were bathed in 116 mM K-gluconate, 4 mM KCl, 10 mM HEPES, 5 mM EGTA, adjusted to pH 7.2 with KOH. To yield the reported concentration of free Ca2+, CaCl2 was added as calculated using published stability constants (Martell and Smith, 1974). For Ca2+ concentrations >1 μM, EGTA was omitted from the bathing solution and gluconate was used to buffer free Ca2+, assuming a stability constant for calcium gluconate of 15.9 M−1 (Dawson et al., 1969). Electrodes were filled with a solution containing 116 mM K-gluconate, 4 mM KCl, 10 mM HEPES, pH 7.2.
Electrophysiology
All recordings were performed on excised inside-out patches (Hamill et al., 1981) using thick-walled quartz electrodes (13–15 MΩ). Membrane patches were voltage clamped with an Axopatch 200 amplifier using a CV 201A headstage (Axon Instruments, Foster City, CA). Continuous recordings were low pass filtered at 1 kHz with an eight pole Bessel filter (Frequency Devices Inc., Haverhill, MA), acquired at 10 kHz using Pulse software (Heka Electronik, Lambrecht, Germany) and stored directly on a Macintosh Quadra 650 computer. All experiments were performed at room temperature. Except for Figs. 2 and 3, a holding potential of −80 mV was used; however, a variable offset up to 20 mV occurred upon patch excision and was not corrected.
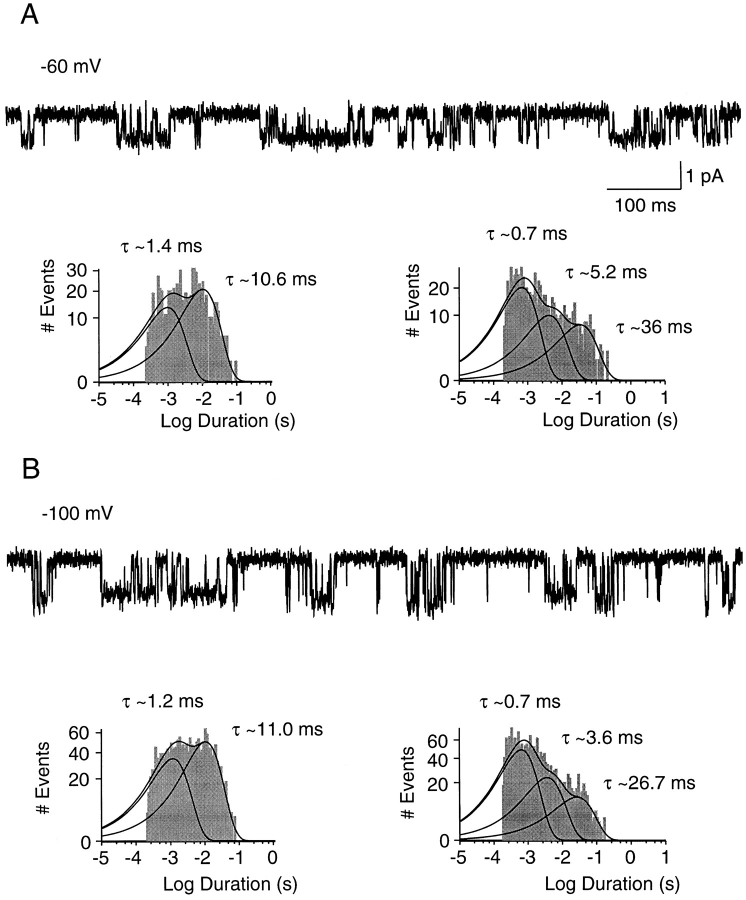
Figure 2.
SK channel activity at different holding potentials. 1-s traces recorded from the patch in Fig. 1 exposed to 1.0 μM Ca2+ at membrane potentials of −60 and −100 mV (A and B, respectively). Channel openings are shown as downward deflections. Open-time (left) and closed-time (right) histograms are shown below each trace. Fitting a sum of two exponentials to the open-time distributions yielded at −60 mV: 1.4 ms, 40%; 10.6 ms, 60%; and at −100 mV: 1.2 ms, 40%; 11.0 ms, 60%. Fitting a sum of three exponentials to the closed-time distributions yielded at −60 mV: 0.74 ms, 57%; 5.2 ms, 25%; 36 ms, 18%; and at −100 mV: 0.65 ms, 58%; 3.6 ms, 28%; 26.7 ms, 14%. Relative amplitudes were obtained from the fitted exponential distributions.
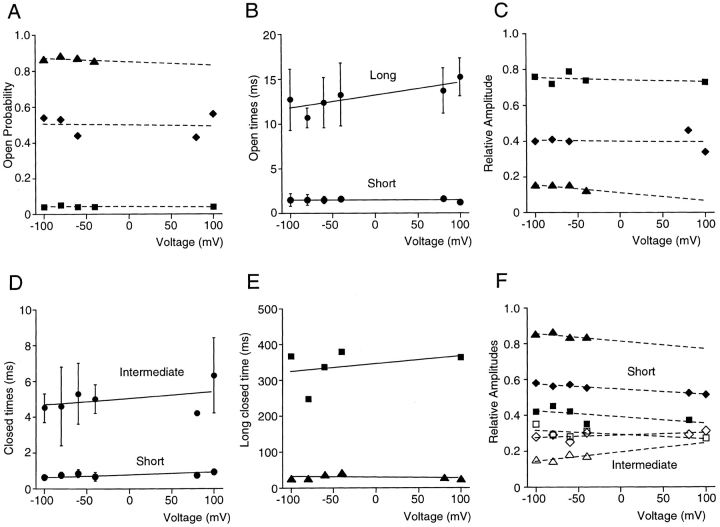
Figure 3.
Voltage independence of kinetic parameters. (A) Open probability is shown as a function of voltage for three patches individually. Values differed between patches, due to different intracellular Ca2+ concentrations (▴, ♦, 1 μM; ▪, 0.8 μM) and different types of channel behavior (high and low open probability behavior, see later), but for all patches open probability was essentially voltage independent. The line was drawn for display purposes only and has no physical meaning. (B) Average short and long open times for the patches in A. Data are shown as mean ± SD, and the lines represent the best fit of the data to single exponential functions. (C) Relative amplitude of the short open-time component as a function of voltage shown individually for each patch in A. The line was drawn for display purposes only. Data from each patch are represented by the same symbol in A, C, E, and F. (D) Short and intermediate closed times for the patches in A. Data are shown as mean ± SD and the lines represent the best fit of the data to exponential functions. (E) Long closed times shown for two patches individually and fit to a single exponential (solid lines). In the patch with the highest open probability, too few events were associated with the longest time constant to reliably fit this component. (F) Relative amplitudes of the short (closed symbols) and intermediate (open symbols) closed-time components plotted individually for the patches in A.
Data Analysis
Single channel recordings were analyzed with MacTac (Bruxton Corp., Seattle, WA) using the “50% threshold” technique to estimate event amplitudes and duration, and each transition was visually inspected before being accepted. Open- and closed-duration histograms were constructed using MacTacfit (Bruxton Corp.), logarithmically binned with 20 bins per decade, and fitted by the sum of exponential probability density functions using the maximum-likelihood method. A correction was made for the rise time of the filter (Colquhoun and Sigworth, 1983) and all bins were used for fitting. The number of statistically significant components was determined using the method of maximum likelihood ratios (Horn and Lange, 1983), which assumes a chi-squared distribution for 2·ln (likelihood 1/likelihood 2). Missed events were not corrected.
Open probability was calculated using a computer program (ReadEvents1.37; Dr. Scott Eliasof, Vollum Institute) to divide the sum of all open times by the total time of recording. All patches included in the analysis, except one, had periods of high channel open probability lasting long enough to establish that only a single channel was present in the patch. No double-level openings were seen in the patch that had only low channel open probability, and closed times were similar to the ones observed in other single-channel patches.
Single channel kinetics were simulated using CSIM 2.0 (Axon Instruments). Simulations were run at the same output rate as the experimental sampling rate, 0.15 pA RMS of pseudo-random Gaussian noise was added to the data, and a Gaussian low pass filter was applied at 1 kHz. Resulting simulated data files were analyzed in the same fashion as channel recordings. Initial estimates of rate constants were obtained from the life times and relative amplitudes of each exponential component in the duration histograms, and from the channel open probability. The simulated traces and duration histograms were compared with the experimental data, and rate constants were adjusted to obtain good agreement. For the model containing three open and four closed states presented in Figs. 10 and 11, 46 estimates of rate constants were examined. Macroscopic currents were simulated using SCoP (Simulation Resources, Inc., Berrien Springs, MI). Values were expressed as mean ± SD and P values were derived from unpaired, two-tailed Student's t tests. Results were considered significantly different at P < 0.01.
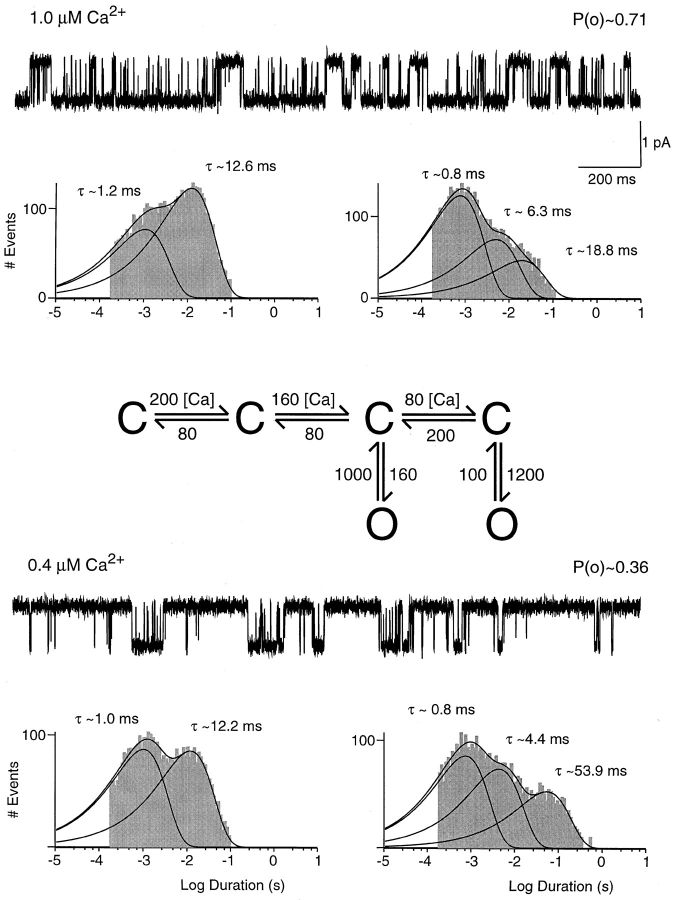
Figure 10.
Simulation of SK channel activity using a sequential gating scheme. Traces were obtained from simulations of the gating scheme presented here. In this scheme, forward transitions between closed states are calcium dependent and are expressed as absolute rate constants in units of seconds−1 per micromolar−1, all other rates are in units of seconds−1. The rates for transitions between open and closed states were derived from the measured open and closed times, whereas the rates for transitions between closed states reflect the longest closed time as well as the relative contributions of different time constants. Simulations used the same acquisition rate and filter frequency as was used in single channel recordings, and simulated data were analyzed in the same manner as recorded data. Resulting open-duration histograms are shown on the left, closed-duration histograms on the right. Relative amplitudes of open-duration components were in 1.0 μM Ca2+: 1.2 ms, 29%; 12.6 ms, 71%; in 0.4 μM Ca2+: 1.0 ms, 51%; 12.2 ms, 49%. Relative amplitudes of closed-duration components were in 1.0 μM Ca2+: 0.8 ms, 71%; 6.3 ms, 21%; 18.8 ms, 8%; in 0.4 μM Ca2+: 0.8 ms, 49%; 4.4 ms, 33%; 53.9 ms, 18%.
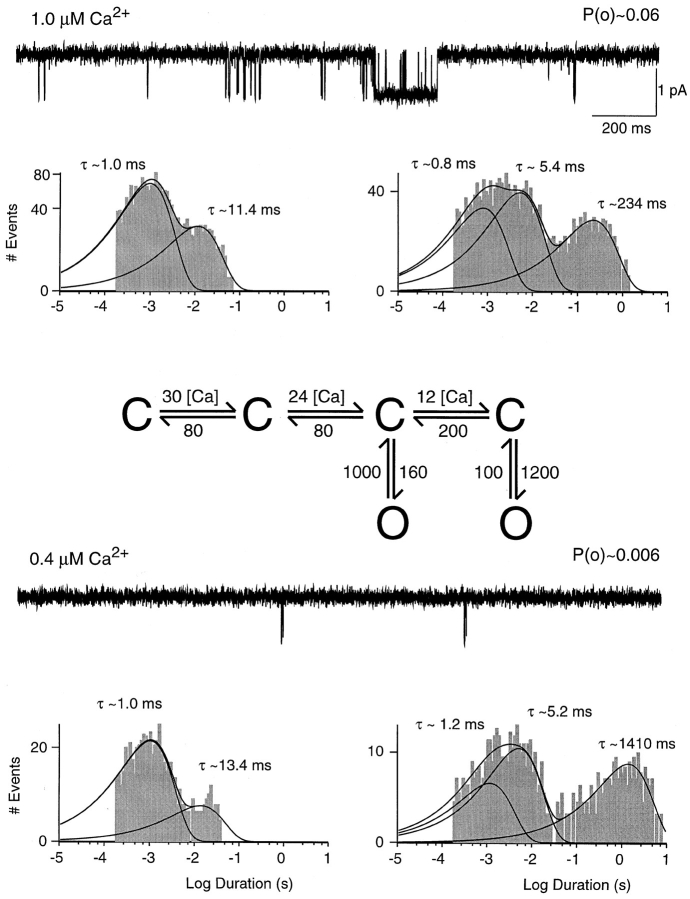
Figure 11.
Simulation of low open probability behavior. Traces were obtained from simulations of the modified gating scheme shown in this figure. Calcium-dependent rates are lower by a factor of 6.7 compared with the gating scheme in Fig. 7 and are expressed as absolute rate constants in units of seconds−1 per micromolar−1, whereas all other rates are in units of seconds−1. Open-duration histograms are shown on the left, closed-duration histograms on the right. Relative amplitudes of open-duration components were in 1.0 μM Ca2+: 1.0 ms, 73%; 11.4 ms, 27%; in 0.4 μM Ca2+: 1.0 ms, 89%; 13.4 ms, 11%. Relative amplitudes of closed-duration components were in 1.0 μM Ca2+: 0.8 ms, 32%; 5.4 ms, 44%; 234 ms, 24%; in 0.4 μM Ca2+: 1.2 ms, 19%; 5.2 ms, 48%; 1,410 ms, 33%.
results
rSK2 Channels Were Activated by Intracellular Calcium
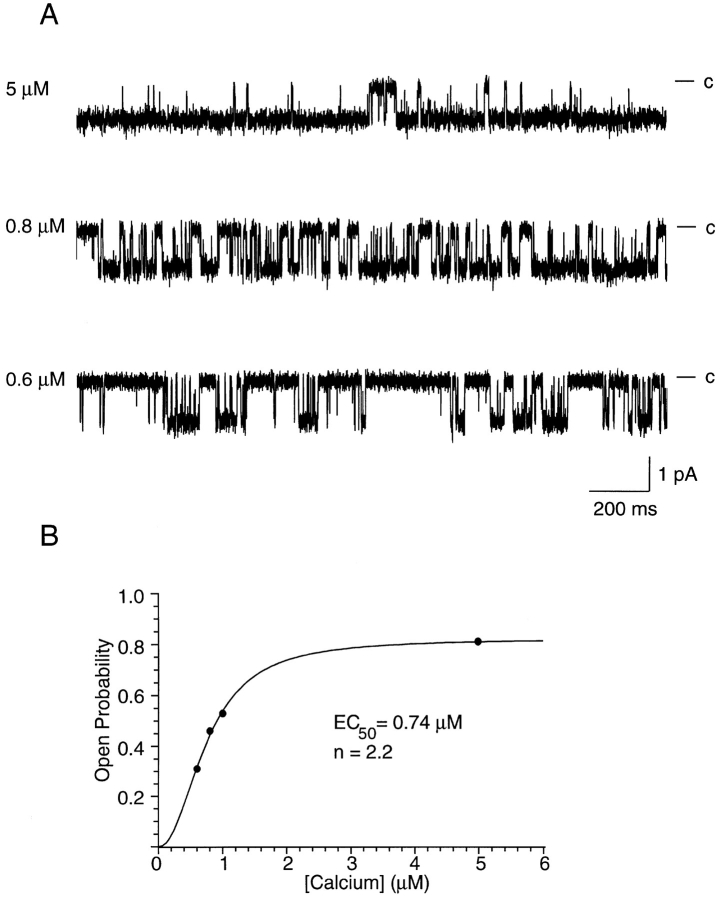
Macroscopic currents recorded from oocytes expressing rSK2 were Ca dependent (Köhler et al., 1996). At the single channel level, this dependence manifested itself as an increase in open probability as a function of increased intracellular Ca2+ concentration. Fig. 1 A shows traces recorded from an excised inside-out patch containing a single rSK2 channel. In these traces, openings became more frequent as the Ca2+ concentration was increased from 0.6 to 5 μM. In four patches, the average open probability was 0.42 ± 0.12 in 0.6 μM Ca2+ and 0.74 ± 0.16 in 1 μM Ca2+. Fig. 1 B shows a plot of the open probability as a function of Ca2+ concentration for the patch in A. Fitting of the data to the Hill equation yielded an EC50 of 0.74 μM and a Hill coefficient of 2.2, mean values from three patches were 0.62 ± 0.14 μM and 3.2 ± 1.0, respectively. The EC50 was the same as that observed using macropatches (0.63 ± 0.23, P > 0.1). The Hill coefficient was somewhat reduced from the value of 4.8 ± 1.5 seen in macropatches (Köhler et al., 1996), although the difference was not statistically significant (P > 0.01, see discussion).
Figure 1.
Calcium dependence of SK channel activity. (A) Recordings from an inside-out patch in different calcium concentrations at a holding potential of −80 mV. Traces show 2-s periods of the single channel recordings used to calculate the open probabilities in B. Channel openings are shown as downward deflections and calculated free intracellular [Ca2+] is noted on the left. Channel current was slightly smaller in the trace recorded in 5 μM Ca2+ due to an off-set of ∼11 mV that occurred upon switching to the EGTA-free solution (see methods). (B) Open probability as a function of intracellular calcium concentration. 30–60-s steady state recordings in 0.6, 0.8, 1.0, and 5.0 μM Ca2+ were used to calculate the open probability. Least squares fitting of the data to the Hill equation of the form P o = P o,max · [Ca2+]n/(EC50 n+ [Ca2+]n) (where P o,max is the maximal open probability in saturating [Ca2+], and other terms have their usual meanings) yielded P o,max = 81%, EC50 = 0.74 μM, and n = 2.2.
rSK2 Channels Were Voltage Independent
To examine the voltage dependence of rSK2 single channel kinetics, inside-out patches were held at membrane potentials from −100 to +100 mV. Analysis of the current amplitudes as a function of voltage yielded a slope conductance of 10.3 ± 1.3 pS in three single channel patches (data not shown), similar to the value previously reported (Köhler et al., 1996). Traces recorded from the patch in Fig. 1 at −60 and −100 mV were shown together with the corresponding open-time distributions (left) and closed-time distributions (right) in Fig. 2. Traces recorded at the two membrane potentials showed no obvious differences in channel activity. Both traces contained short and long openings, and open-time distributions were best fit by the sum of two exponentials with time constants of ∼1 and 11 ms. Independent of membrane potential, three exponentials were needed to adequately fit closed-time distributions. Time constants were similar at both membrane potentials and were ∼0.7, 4.5, and 30 ms.
The voltage dependence of the single channel behavior is summarized in Fig. 3. As discussed in detail below, only some of the parameters describing SK channel kinetics were Ca2+ dependent. Since the three patches examined were exposed to different Ca2+ concentrations, the Ca2+-dependent parameters were plotted individually for each patch, whereas Ca2+-independent parameters were shown as mean values. Patch membrane voltage did not significantly affect channel open probability (Fig. 3 A). As seen in Fig. 2, open-time histograms were best fit by the sum of two exponentials. The mean time constants were plotted as a function of voltage in Fig. 3 B. Voltage did not significantly affect either open-time constant. In addition, the relative contribution of each time constant to the open-time histogram was similar at all voltages examined (Fig. 3 C).
Three exponentials were needed to fit the closed-time histograms in two patches, whereas two exponentials were adequate for a third patch (see Fig. 3, legend). The short and intermediate closed times, present in all three patches, were shown as mean values in Fig. 3 D, and the long closed time was plotted for the two patches individually in Fig. 3 E. As was the case for the open times, voltage did not significantly affect the three closed-time constants, as illustrated by the exponential fits (Fig. 3, D and E, solid lines). Finally, the relative amplitudes of the short (Fig. 3 F, closed symbols) and intermediate (Fig. 3 F, open symbols) closed-time components were also insensitive to voltage. Because membrane potential did not affect any of the open and closed times, a single holding potential of −80 mV (plus off-set, see methods) was used during the remainder of this study.
Ca2+ Affected the Longest Closed Time as well as Open- and Closed-Time Distributions
Fig. 4 shows 2-s segments of recordings from a single channel patch exposed to different concentrations of intracellular Ca2+. As seen in Fig. 1, the open probability increased with higher Ca2+ concentration. The change in open probability was reflected in both the open- and closed-time distributions. In all three concentrations of Ca2+, open-time histograms (Fig. 4, left) showed two components with lifetimes independent of Ca2+. However, an increased concentration of intracellular Ca2+ resulted in a larger fraction of long openings. For the recordings in Fig. 4, 49% of all openings in 0.4 μM intracellular Ca2+ contributed to the long open-time constant compared with 66% in 1 μM Ca2+. Independent of Ca2+ concentration, closed-time histograms showed three components (Fig. 4, right). The short and intermediate closed times were unaffected by a change in Ca2+ concentration (see Fig. 5). In contrast, the long closed time increased from 20 ms in 1 μM to 60 ms in 0.4 μM free Ca2+. Ca2+ also affected the relative amplitude of the closed-time components, shifting the distribution towards the shorter closed times. For the patch in Fig. 4, 71% of all closures in 1.0 μM Ca2+ were of the short time-constant compared with 63% in 0.4 μM.
Figure 4.
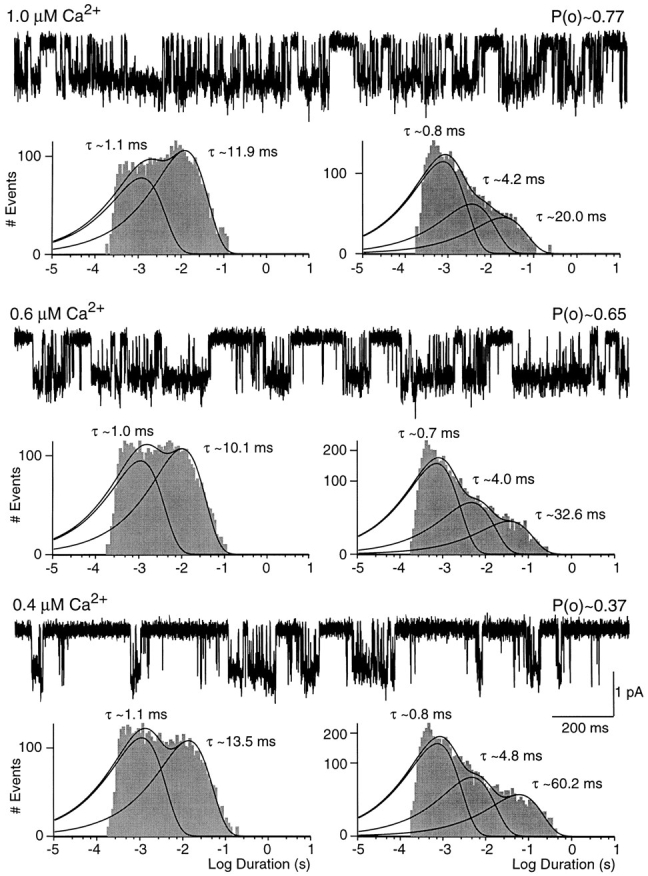
SK channel activity in different concentrations of Ca2+. Data shown are from a single channel patch voltage clamped at −80 mV. Scaling is the same for all traces and open probabilities are noted above each trace. Open-duration histograms are displayed on the left and closed-duration histograms on the right underneath the corresponding 2-s traces. Solid lines and time constants represent maximum likelihood fits to the sum of two or three exponential components shown for each component separately as well as for the sum. Relative amplitudes of open-duration components were in 1.0 μM Ca2+: 1.1 ms, 34%; 11.9 ms, 66%; in 0.6 μM Ca2+: 1.0 ms, 43%; 10.1 ms, 57%; in 0.4 μM Ca2+: 1.1 ms, 51%; 13.5 ms, 49%. Relative amplitudes of closed-duration components were in 1.0 μM Ca2+: 0.8 ms, 71%; 4.2 ms, 19%; 20.0 ms, 10%; in 0.6 μM Ca2+: 0.7 ms, 67%; 4.0 ms, 23%; 32.6 ms, 10%; in 0.4 μM Ca2+: 0.8 ms, 63%; 4.8 ms, 25%; 60.2 ms, 12%.
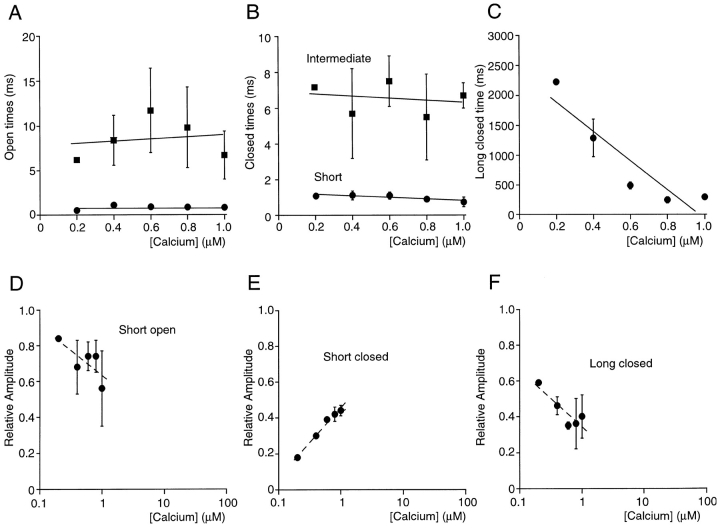
Figure 5.
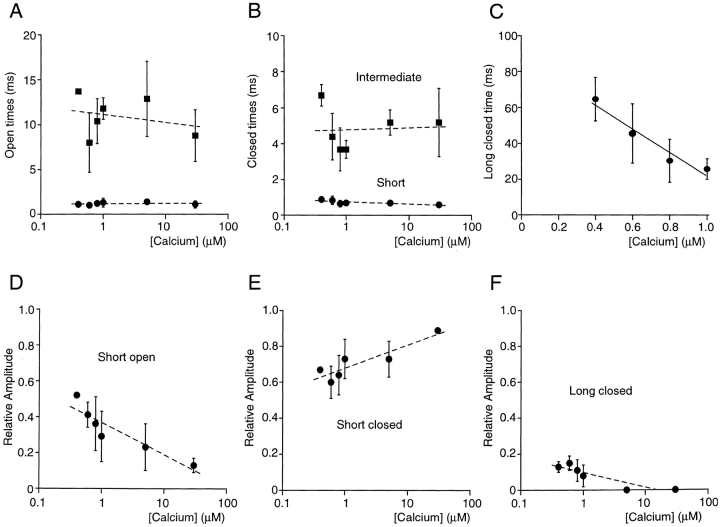
Calcium dependence of channel open and closed durations. Data were from five excised patches, each containing a single channel displaying high open probability behavior (see text). Except in C, lines were drawn to illustrate the Ca2+ independence of the kinetic parameters and are not intended to have physical meaning. (A) Average short and long open times were independent of intracellular Ca2+ concentration. (B) Average short and intermediate closed-times were independent of Ca2+ concentration. (C) Ca2+ dependence of the average long closed times. Linear regression analysis of the means yielded a slope of −66 ms μM−1. (D) The relative amplitude of the short open-time component decreased as a function of Ca2+ concentration. (E) The relative amplitude of the short closed-time component increased with increasing Ca2+ concentration. (F) Increasing Ca2+ concentrations lead to a decrease in the relative amplitude of the long closed-time component.
The Ca2+ dependence of the kinetic parameters is summarized in Fig. 5. Fig. 5, A and B show the mean open and closed times from five single channel patches as a function of Ca2+ concentration. Neither the open times nor the short and intermediate closed time changed notably over the range of 0.4 to 30 μM Ca2+. In contrast, the long closed time was clearly Ca2+ dependent and linear regression analysis yielded a slope of −66 ms μM−1 (Fig. 5 C). In addition, the relative contributions of open- and closed-time constants to the respective lifetime histograms were Ca2+ dependent. As shown in Fig. 5 D, the average relative amplitude of the fast open-time component decreased approximately fourfold when the Ca2+ concentration was increased from 0.4 to 30 μM. Concurrent with the increasing relative contribution of long openings, elevated Ca2+ concentrations increased the occurrence of closures of the short time constant (Fig. 5 E) and decreased the number of closures of the long time constant (Fig. 5 F). In 5 and 30 μM Ca2+, two exponentials corresponding to the short and intermediate closed-time constants were sufficient to describe closed-time histograms.
SK Channel Behavior Changed Spontaneously
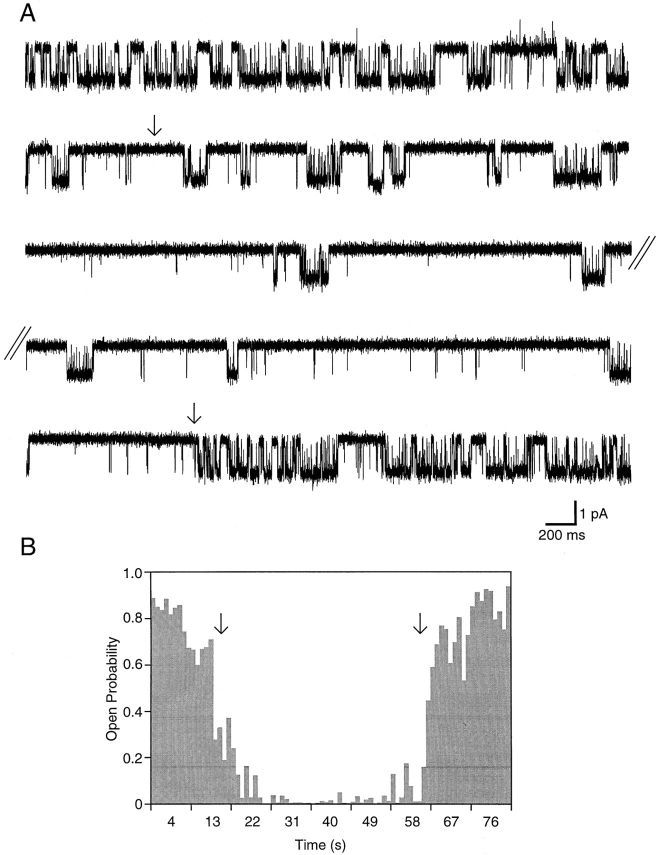
The traces in Fig. 6 A represent part of a continuous recording obtained from an inside-out patch bathed in 1 μM Ca2+. Approximately 13 s after patch excision (Fig. 6 A, arrow), the open probability of the channel decreased spontaneously. In this example, the decline of activity appeared to be somewhat gradual. However, in other examples, channel behavior changed more abruptly. Open probability remained low for ∼47 s before it reverted back to the starting level (Fig. 6 A, arrow). Fig. 6 B shows the open probability during 1-s intervals plotted as a function of time after patch excision. During the segment of lower activity, the open probability was 0.03 compared with 0.81 during the combined segments of high activity.
Figure 6.
Low and high open probability behavior. The traces in A show 20 s of a recording from a single channel patch voltage clamped at −100 mV starting 11 s after excision into 1.0 μM free Ca2+. The parallel lines mark a 32-s break in the continuously acquired recording. Approximately 19 s after patch excision (arrow), channel open probability decreased from ∼60% to <10%. During the same continuous recording, ∼63 s after patch excision (second arrow), channel open probability spontaneously increased to its starting level. B shows the open probability during 1-s intervals as a function of time after patch excision with the arrows indicating the switches in channel activity (same as A).
During the period of low channel activity, short and long openings were seen similar to what was observed during periods of high activity, but openings or clusters of openings were separated by longer closures. The similarity became more obvious when openings during the high and low open probability periods were analyzed separately. Open times of 0.9 and 9.4 ms vs. 0.9 and 8.9 ms were obtained for high and low channel activity, respectively, with more of the openings being of the long time constant during high open probability (74%, compared with 35% during low open probability). Closed-time histograms representing the high open probability behavior showed three components of 0.6 (72%), 4.2 (23%), and 34 (5%) ms. Three closed-time constants were also seen during the low open probability period, and the short and intermediate components had similar dwell times of 0.6 (37%) and 5.1 (32%) ms, respectively. However, the third, long closed-time component had a dwell time of 320 ms and accounted for 31% of closures (data not shown, but see Fig. 8).
Figure 8.
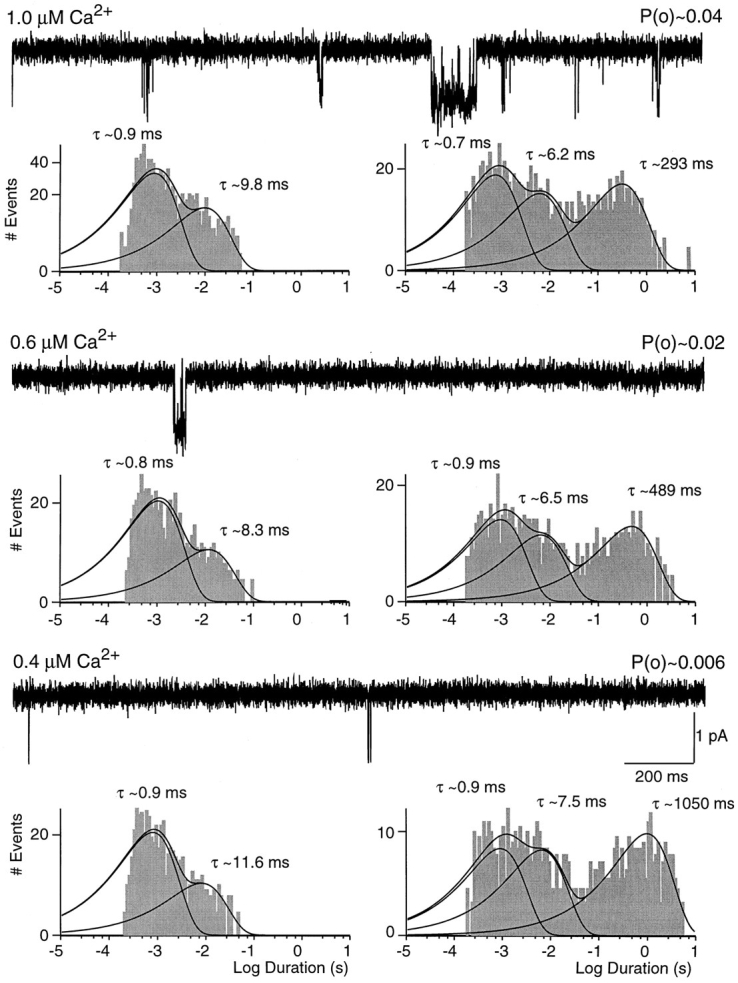
Low open probability SK channel behavior in different concentrations of calcium. Traces shown are from a single channel patch exposed to 1.0, 0.6, and 0.4 μM intracellular Ca2+. Scaling is the same for all traces, and open probabilities are noted above each trace. Open-duration histograms are displayed on the left and closed-duration histograms on the right. Solid lines and time constants represent maximum likelihood fits to the sum of two or three exponential components (see Fig. 3). Relative amplitudes of open- duration components were in 1.0 μM Ca2+: 0.9 ms, 71%; 9.8 ms, 29%; in 0.6 μM Ca2+: 0.8 ms, 80%; 8.3 ms, 20%; in 0.4 μM Ca2+: 0.9 ms, 83%; 11.6 ms, 17%. Relative amplitudes of closed-duration components were in 1.0 μM Ca2+: 0.7 ms, 41%; 6.2 ms, 27%; 293 ms, 32%; in 0.6 μM Ca2+: 0.9 ms, 39%; 6.5 ms, 27%; 489 ms, 34%; in 0.4 μM Ca2+: 0.9 ms, 31%; 7.5 ms, 26%; 1,050 ms, 43%.
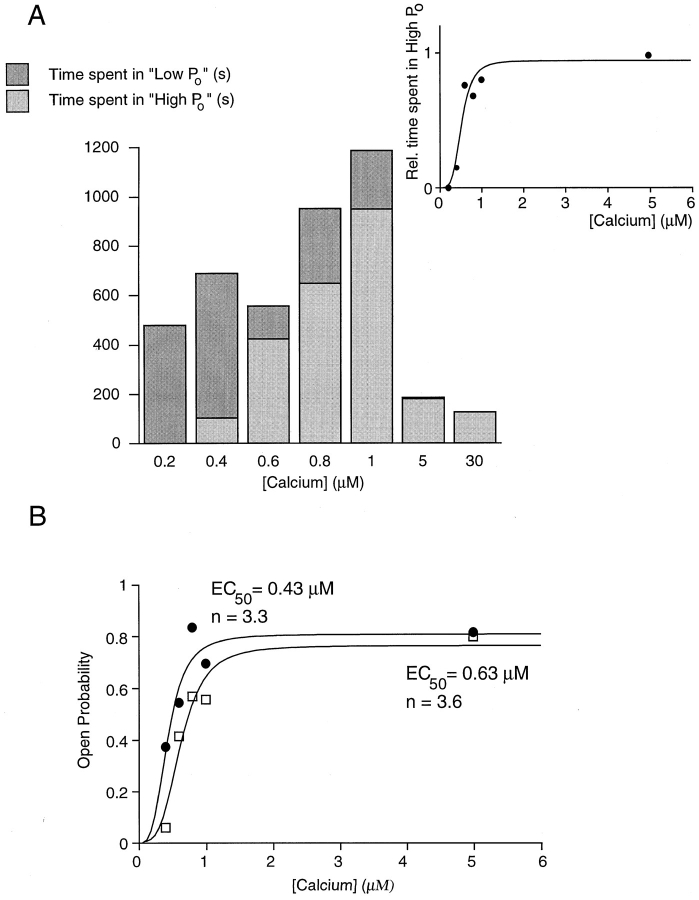
Periods of high and low open probability behavior were seen in 8 of 13 patches. Switches occurred either within continuously acquired recordings (16 examples in six patches) or during times between recordings when the intracellular Ca2+ concentration was changed (nine examples in five patches). The latter switches were always to high open probability when the Ca2+ concentration was raised and to low open probability when Ca2+ was decreased. Spontaneous switches in constant Ca2+ were most often seen in Ca2+ concentrations close to the EC50. No switches were seen at the lowest (0.2 μM) or the highest (30 μM) Ca2+ concentration examined, and in the two patches exposed to 0.2 μM free Ca2+ for a total of 565 s, channels exhibited only low open probability. In contrast, channels showed only high open probability when exposed to 30 μM Ca2+ (three patches) and out of two patches exposed to 5 μM Ca2+ for 80 and 100 s, only one showed a very brief (4-s) period of low open probability. These observations suggested that the preference for each type of channel activity was Ca2+ dependent. To illustrate this point, Fig. 7 A shows the total time of recording (all patches combined) exhibiting the two types of behavior for each Ca2+ concentration tested. In the inset, the time during which high open probability was observed was normalized to the total recording time in each concentration of Ca2+. Fitting of the data to the Hill equation yielded an EC50 of 0.52 μM and a Hill coefficient of 4.1. Since, on the time scale of a typical recording, switches occurred infrequently, it was not possible to directly measure the overall open probability including both behaviors. However, since the low open probability (0.04 in 1 μM Ca2+) was essentially negligible compared with the high open probability, an “effective open probability” (Fig. 7 B, □) was calculated by multiplying the single channel open probability from a recording of high open probability behavior (Fig. 7 B, •; EC50 = 0.43 μM, Hill coefficient = 3.3) by the relative amount of time channels spent exhibiting high open probability behavior (Fig. 7 A, inset). Fitting the effective open probability to the Hill equation predicted a macroscopic EC50 of 0.63 μM and Hill coefficient of 3.6 (see discussion).
Figure 7.
Calcium dependence of low and high open probability behavior. (A) Absolute recording time (in seconds) from all single channel patches combined during which low (dark gray) and high (light gray) open probability was observed. An open probability of <10% and the appearance of a closed-time constant >100 ms were taken as indicators of low open probability (see Fig. 8). The inset shows the fraction of the total recording time during which high open probability was observed and a fit of the data to the Hill equation yielding an EC50 of 0.52 μM and a Hill coefficient of 4.1. (B, •) The single channel open probability for a representative patch containing a channel displaying only high activity (P o(high)). (□) The “effective open probability” obtained by multiplying the single channel open probability by the relative time channels spent in high open probability behavior (P o(high) · f (high)) (Fig. 7 A, inset). Lines represent fits to the Hill equation, yielding an EC50 of 0.43 μM and a Hill coefficient of 3.3 for the single channel open probability, and an EC50 of 0.63 μM and a Hill coefficient of 3.6 for the “effective open probability.”
A Ca2+-dependent Time Constant of Hundreds of Milliseconds to Several Seconds Characterized Periods of Low Open Probability
Most patches exhibited periods of low channel open probability (see above) lasting from a few seconds to >15 min. Channels were observed to switch between behaviors (see above), and no double-level openings were seen. In addition, the single channel conductance and the two open-time constants were shared between both types of channel activity. These findings suggested that the channels underlying both types of activity were the same.
Fig. 8 shows steady state recordings from a patch containing a channel that displayed predominantly low open probability activity (0.05 in 1.0 μM calcium). The same patch showed high open probability for almost 3 min, revealing that only a single channel was present. Channel activity during low open probability periods was Ca sensitive and open probability increased as a function of Ca2+ concentration by a factor similar to that in high open probability behavior (Fig. 8). During low open probability periods, SK channel activity exhibited similar open state kinetics as observed during high open probability. Independent of the Ca2+ concentration, open-duration histograms were best fit by the sum of two exponentials (Fig. 8). Average time constants in seven patches were 0.93 ± 0.23 and 9.9 ± 4.4 ms. These open times were not statistically different from those observed during high open probability activity (1.1 ± 0.3 and 10.6 ± 2.9 ms, eight patches, P > 0.05). However, an obvious difference between the two types of SK channel activity was that short-duration openings predominated during low open probability behavior. For example, 71% of the openings observed in 1.0 μM free Ca2+ contributed to the short open-time constant during low open probability behavior (Fig. 8), while only 34% of openings were of short duration during high open probability activity (Fig. 4). Despite this difference, the relative amplitude of the short open-time component decreased with increasing Ca2+ concentration in both types of channel behavior. For example, in the patch shown in Fig. 8, 29% of openings contributed to the long open-time constant in 1.0 μM free Ca2+, compared with 17% in 0.4 μM.
SK channel closed state kinetics during low open probability activity exhibited three exponential components (Fig. 8). The average short and intermediate closed-time constants of 0.9 ± 0.4 and 5.9 ± 1.5 ms (seven patches) were not statistically different from those observed during high open probability activity (0.7 ± 0.2 and 4.6 ± 1.3 ms, eight patches, P > 0.01), but accounted for a smaller fraction of closures (60 ± 12% vs. 92 ± 6% in 1.0 μM Ca2+, three and four patches, P < 0.01). In contrast, the third closed-time constant was significantly longer, measuring 295 ± 26 ms in 1.0 μM Ca2+ during low open probability, compared with 25.9 ± 5.8 ms during high open probability (five and three patches, respectively, P < 0.01). As observed for high open probability behavior, the longest closed time was Ca2+ dependent and decreased from 1,290 ± 320 ms to 295 ± 26 ms (P < 0.01, three patches) when the free Ca2+ concentration was increased from 0.4 to 1.0 μM (see Fig. 9 C). During both types of channel behavior, higher Ca2+ concentrations shifted the distributions toward the shorter closed-time constants. For example, in the patch in Fig. 8, the longest closed-time constant accounted for 32% of closures in 1.0 μM and 43% in 0.4 μM Ca2+.
Figure 9.
Calcium dependence of kinetic parameters describing low open probability behavior. Data are from three single channel patches except in 0.2 μM Ca2+ (one patch) and in 0.6 μM Ca2+ (two patches) during periods of low open probability activity. (A) Average short and long open times were independent of intracellular Ca2+ concentration. Linear regression analysis of the data is shown as the solid lines and illustrates the Ca2+ independence of the open-time constants. (B) Average short and intermediate closed times were independent of Ca2+ concentration. Solid lines represent linear regression analysis. (C) The long closed times during low open probability activity was Ca2+ dependent, similar to what was observed during high channel open probability (compare Fig. 5). Linear regression analysis yielded a slope of −2,460 ms μM−1. (D) The relative amplitude of the short open-time component decreased as a function of Ca2+ concentration. Data are shown on a semi-logarithmic scale for comparison with Fig. 5 (high open probability behavior). The line in D–F is included for display purposes only. (E) The relative amplitude of the short closed-time component increased with increasing Ca2+ concentration. (F) Increasing Ca2+ concentrations lead to a decrease in the relative amplitude of the long closed-time component.
The Ca2+ dependence of the kinetic parameters describing low open probability behavior was summarized in Fig. 9. As seen during high open probability behavior (compare Fig. 4), neither the open times (Fig. 9 A) nor the short and intermediate closed times (Fig. 9 B) were Ca2+ dependent. The long closed time decreased with increasing Ca2+ concentration, and linear regression analysis yielded a slope of −2.5 s μM−1 (Fig. 9 C). The relative contributions to lifetime histograms of the short open time (Fig. 9 D) and the short and long closed-time components (Fig. 9, E and F, respectively) differed from those observed during high open probability behavior, but they showed the same trend with increasing Ca2+ concentration; i.e., the number of short openings and long closures decreased, whereas the number of short closures increased.
discussion
This report describes the effects of membrane potential and intracellular Ca2+ on the single channel kinetics of a recombinant apamin-sensitive SK channel. Previously, little was known about the behavior of single SK channels, with the only available kinetic data being obtained from native apamin-insensitive channels and currents (Lancaster et al., 1991; Valiante et al., 1997; Sah and Isaacson, 1995; Sah, 1995). As might be expected from the high degree of homology between apamin-sensitive and -insensitive recombinant subtypes (66% amino acid identity between rSK2 and hSK1; Köhler et al., 1996), results from these studies were similar to the results reported here for cloned apamin-sensitive SK channels. Apamin-insensitive SK channels recorded from cultured rat hippocampal neurons possessed open times that were fit with a single exponential time constant of 7.8 ms and closed times that were fit with two exponentials with time constants of 0.49 and 1.49 ms. These channels exhibited an open probability of ∼0.5 in 1 μM Ca2+ (Lancaster et al., 1991). Analyses of current fluctuations during the slow AHP in dentate granule neurons yielded similar results. For example, the mean channel open time was 6.9 ms throughout the time course of the slow AHP, whereas the decay of the slow AHP was accompanied by an increase in the mean closed time (Valiante et al., 1997). Assuming that the decay of the slow AHP resulted from the clearance of Ca2+ from the vicinity of the channels, this finding agrees with our observation that only the longest closed time was Ca dependent. Somewhat shorter open times of 1.7 and 3.8 ms were measured using fluctuation analysis of IAHP in hippocampal pyramidal neurons (Sah and Isaacson, 1995) and vagal motoneurons (Sah, 1995), respectively.
SK Channel Activation Could Be Modeled as a Markov Process
The activation of SK channels may be described as a time-homogeneous Markov chain. Single rSK2 channels recorded from oocytes showed open-time distributions that were best fit by the sum of two exponentials, whereas three exponentials were necessary to fit closed-time distributions. The high open probability behavior could be modeled using a gating scheme with two open and four closed states as illustrated in Fig. 10, where the forward transition rates between closed states were dependent on intracellular Ca2+. Strictly sequential gating schemes with two open states that were either connected or separated by closed states did not fit the data. Several gating schemes containing closed loops were also examined and did not yield satisfying results. A scheme similar to the one presented in Fig. 10 but consisting of two open and three closed states yielded a reasonable representation of the data, but only if rate constants were allowed to have a nonlinear dependence on Ca2+ concentration. Since Ca2+-dependent transitions were assumed to reflect simple bimolecular reactions, their rates should vary linearly with Ca2+ concentration. This was achieved by adding a fourth closed state. Due to the similarity of two of the predicted time constants, the gating scheme in Fig. 10 yielded closed-time histograms with three resolvable components rather than the theoretical four components. The rate constants were adjusted such that the predicted lifetimes and relative amplitudes were similar to what was observed experimentally for a representative patch exposed to two Ca2+ concentrations (compare Figs. 4 and 10). As seen in single channel recordings, channel open times and the short and intermediate closed times were unchanged when channel activity was simulated with rate constants for 0.4 and 1.0 μM free Ca2+, respectively. In contrast, the long closed time increased as a function of decreased Ca2+ concentration. In addition, the model correctly predicted the changes in the relative amplitudes of open- and closed-time components.
The low open probability behavior was modeled separately using the same gating scheme (Fig. 11). The best agreement with the experimental data was obtained if all Ca2+-dependent rates were reduced by a factor of 6.7. The model for low open probability behavior predicted dwell times similar to experimentally derived values for the two Ca2+ concentrations used in the simulation (see Figs. 7 and 11). It also reflected the changes seen with changing Ca2+ concentration. A possible shortcoming of the modified model was that it predicted a somewhat larger fraction of intermediate compared with short closures than was observed experimentally. However, this discrepancy was most prominent in low Ca2+, where openings were rare with the obtained histograms containing a relatively small number of events.
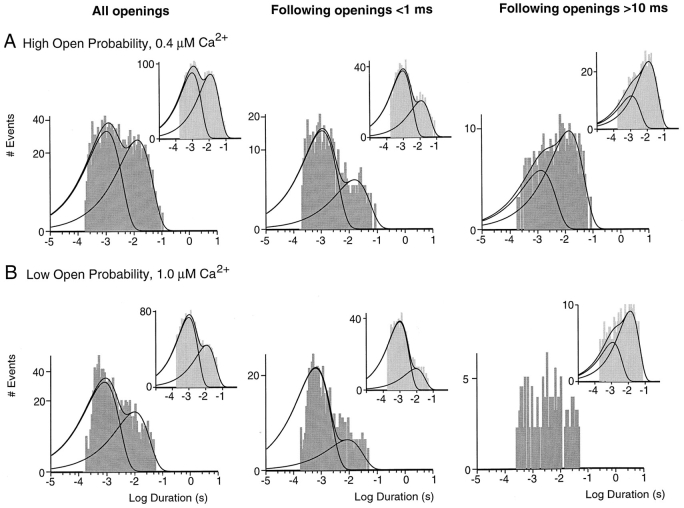
The presented gating schemes predict that both long- and short-duration openings should be grouped; i.e., after a long opening, the channel is more likely to reenter the same long open state rather than transition into the short open state. The same should be true for short openings. Consistent with this prediction, long openings were predominantly followed by other long openings in all three patches examined. Fig. 12 A shows histograms containing all openings (left), openings after openings shorter than 1 ms (middle), and openings after openings longer than 10 ms (right) for the patch illustrated in Fig. 4 exposed to 0.4 μM Ca2+. All three histograms were best fit with two exponentials, and the lifetimes of each exponential component were similar under the three conditions. In contrast, the relative amplitudes of the two components varied considerably with the percentage of long openings decreasing from 49% (of all openings) to 20%, when only openings after short openings were included, and increasing to 74% after long openings. Similar correlations between successive openings were seen in simulations of the model. For the example shown in the insets, 49% of all openings, 23% of openings after short openings, and 81% of openings after long openings were of the long time constant. As illustrated in Fig. 12 B, similar results were obtained for the channel displaying low open probability behavior shown in Fig. 7 (1 μM Ca2+) and the gating scheme in Fig. 11.
Figure 12.
Correlations between successive openings. (A) Open-duration histograms for the patch in Fig. 4 exposed to 0.4 μM Ca2+ including all openings (left), openings after openings shorter than 1 ms (middle), and openings after openings longer than 10 ms (right). The lifetimes and relative amplitudes of the two components were 1.1 ms, 51%, and 13.5 ms for all openings; 1.1 ms, 80%, and 15.8 ms after short openings; and 1.3 ms, 26%, and 14.0 ms after long openings. Insets show corresponding histograms for simulations of the model in Fig. 10. The short and long components had lifetimes of 1.0 ms, 51%, and 12.2 ms for all openings; 1.0 ms, 77%, and 12.3 ms after short openings; and 1.1 ms, 19%, and 12.8 ms after long openings. (B) Open-duration histograms for the channel in Fig. 7 displaying low open probability behavior in 1.0 μM Ca2+. Open times were fit to two components with lifetimes of 0.9 ms, 71%, and 9.8 ms (left). Openings after openings shorter than 1 ms (middle) had lifetimes of 0.7 ms, 92%, and 8.8 ms. Openings after openings longer than 10 ms (right) were predominantly long but could not be fit due to the small number of events. Insets show corresponding histograms for the model in Fig. 11. The two components had lifetimes of 1.0 ms, 73%, and 11.4 ms for all openings; 1.0 ms, 91%, and 9.1 ms after short openings; and 1.2 ms, 24%, and 13.3 ms after long openings.
To assure that the low open probability behavior was not a phenomenon limited to oocytes, stably transfected Chinese hamster ovary cells expressing rSK2 channels were examined. Inside-out patches bathed in 0.8 μM Ca2+ contained SK channels that occasionally switched between periods of high and low open probability with open- and closed-time constants not significantly different from the values reported here for patches excised from oocytes (not shown). Therefore, it seemed likely that the low open probability behavior and the switches between different types of channel activity were inherent properties of SK channels rather than a function of the expression system.
The mechanism underlying switches between high and low open probability behavior is unknown, except that the process has some dependence on Ca2+. Since channels reversibly switched behaviors in the absence of added ATP or Mg2+, it seemed unlikely that channel phosphorylation plays a role, and the two behaviors may reflect intrinsic conformational states of the channel. The Ca dependence of the time channels spent exhibiting each behavior (Fig. 7 A) suggested that switches between the two behaviors could contribute to the Ca2+ dependence of the macropatch current. This was illustrated by the calculation of an effective open probability in Fig. 7 B, which was right-shifted and somewhat steeper than the single channel open probability.
Comparison with Gating Schemes and Mode Shifts Seen with Other Channels
The gating scheme presented here is the first attempt at modeling the Ca2+-dependent activation of SK channels. The model shares some similarities with gating schemes used to describe the voltage- and Ca2+-dependent properties of BK channels in the major gating mode. In particular, the model proposed by DiChiara and Reinhart (1995) for cloned drosophila and human BK channels can be thought of as an expanded version of this model containing an additional closed state connected to a third open state. In addition, DiChiara and Reinhart (1995) also found that only the (three) longest closed states were Ca2+ dependent. However, studies on BK channels from rat skeletal muscle found two of three open times to be Ca2+ dependent and proposed a model in which open states were connected by Ca2+-dependent transitions (McManus and Magleby, 1991). Earlier studies on rat muscle BK channels incorporated into lipid bilayers (Moczydlowski and Latorre, 1983) and cultured rat muscle cells (Magleby and Pallotta, 1983) also found a Ca2+ dependency of the mean open time. A simple sequential model containing two closed and two open states was proposed in the former and a branched model containing three closed and two parallel open states in the latter study. Differences between these models may at least partially be due to differences in the time resolution. The time resolution used in this study was the same as that used by Magleby and Pallotta (1983).
In addition to the normal mode of gating, four kinetic modes have been observed for BK channels in rat skeletal muscle (McManus and Magelby, 1988; Rothberg et al., 1996). All of them are characterized by a lower channel open probability compared with the normal mode, but together only account for <10% of channel openings at Ca2+ concentrations below 10 μM. Three of the lower open probability modes, termed the intermediate open, brief open, and buzz mode, may result from excluded entry into certain states of the scheme used to describe normal mode gating (McManus and Magelby, 1988). In contrast, the SK channels in this study entered a low open probability mode that appeared to have the same number of open and closed states as the high open probability mode. The frequency and duration of sojourns to the low activity mode of BK channels increased with increasing Ca2+ concentration (Rothberg et al., 1996), while the low open probability mode of recombinant SK channels was entered more frequently in low Ca2+ concentrations.
In contrast to the mode shifting in native BK channels, which occurred rapidly and was followed by periods of stable activity (McManus and Magelby, 1988), cloned Drosophila BK channels expressed in oocytes displayed large slow fluctuations between changing levels of open probability (Silberberg et al., 1996). This behavior was termed wanderlust kinetics. Except for the very slow time course of the fluctuations, wanderlust kinetics appears similar to the changes in open probability reported here for cloned SK channels. During low activity periods, recombinant BK and SK channels show bursts of activity with kinetics similar to those seen during high activity. These bursts are separated by long closures not seen during periods of high activity. For both channels, the main difference between time constants describing high and low activity behavior was in the longest closed-time component(s). Silberberg et al. (1996) suggested that wanderlust kinetics can be described by a single gating scheme if one assumes one or more multiplicative factors modifying the Ca2+-dependent rate constants.
Low activity modes have been observed for a number of other ion channels. These include glutamate-activated channels from locust muscle (Patlak et al., 1979), Aplysia voltage-gated cation channels (Wilson and Kaczmarek, 1993), cardiac calcium channels (Hess et al., 1984), frog skeletal muscle sodium channels (Patlak et al., 1986), acetylcholine receptors in frog muscle (Auerbach and Lingle, 1986), M-channels in bullfrog sympathetic neurons (Marrion, 1993), and N-methyl-d-aspartate receptors (Donelly and Pallotta, 1995). The gating modes observed for the Aplysia voltage-gated cation channel appeared most similar to those of cloned SK channels in that the two modes differ mainly by the presence or absence of long closures, whereas the open and the shorter closed times are similar for the two modes.
SK Channel Kinetics May Account for the Time Course of Apamin-sensitive AHPs
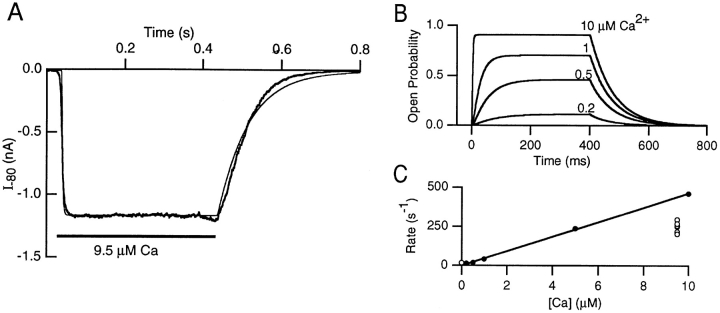
The gating scheme and rate constants presented in Fig. 10 could be used to predict the activation time constant of a macroscopic SK current elicited by a fast jump in Ca2+ concentration. A current trace evoked by a jump from 0 to 9.5 μM Ca2+ is shown in Fig. 13 A, superimposed with a simulation of the gating scheme in Fig. 10. The current activated with a time constant of 4.9 ms and, upon removal of free Ca2+, deactivated with a time constant of 58 ms. Averages from six Ca2+ jumps (two patches) were 4.1 ± 0.6 ms for the activation and 57.3 ± 11.1 ms for the deactivation time constant. Simulations of the model (Fig. 10) are shown in Fig. 13 B for jumps to 0.2, 0.5, 1, 5, and 10 μM Ca2+. Since macroscopic currents would be dominated by channels displaying high open probability behavior, only this type of channel behavior was considered here. Fitting of the simulated traces to single exponentials yielded activation time constants of ∼5 ms in 5 μM and 50 ms in 0.5 μM free Ca2+. Fig. 13 C shows a plot of the activation rate (τ−1) versus Ca2+ concentration. Over the range of 0.2 to 10 μM Ca2+, the model predicted an approximately linear relationship between the activation rate of the macroscopic current and the Ca2+ concentration with a forward rate constant of 47 μM−1 s−1. This rate was somewhat slower than the slowest Ca2+-dependent rate (80 μM−1 s−1) of the gating scheme in Fig. 10, possibly reflecting the requirement for several Ca2+-dependent transitions before channel opening. An apparent Ca2+ binding rate of 26 μM−1 s−1 was estimated from the macroscopic current activation (Fig. 13 C, ○). A rate of 21 μM−1 s−1 was seen in rat sympathetic neurons using flash photolysis of photosensitive Ca2+ chelators (Gurney et al., 1987). Both rates are fast and, considering the uncertainty associated with access of Ca2+ to the patch (this study) or with determinations of the amount of released Ca2+ (Gurney et al., 1987), are in reasonable agreement with our model. In the study of Gurney et al. (1987), a lower limit of 25 s−1 for channel closure upon Ca2+ removal was estimated by extrapolation of the data to 0 Ca2+. This rate was somewhat faster than, but not markedly different from, the 17 s−1 measured during rapid Ca2+ removal (τ = 58 ms, Fig. 13 A) and the 13 s−1 (τ = 76 ms, Fig. 13 B) predicted by our model. In comparison, the apamin-sensitive component of the AHP in bullfrog sympathetic ganglion cells decayed with a time constant of 150 ms, corresponding to a rate of 7 s−1 (Lancaster and Pennefather, 1987).
Figure 13.
Time dependence of the macroscopic current activation. (A) An inside-out macropatch excised from an oocyte expressing SK2 was positioned near a solution interface formed by a continuous flow through a θ tube of 0 and 9.5 μM Ca2+. At a holding potential of −80 mV, Ca2+ was pulsed on and off by rapidly moving the solution interface across the patch pipette tip using a bimorph translator (Morgan Matroc Inc., Bedford, OH) attached to the θ tube. The rising and falling phase of activation and deactivation, respectively, were well described by single exponentials, yielding time constants of 4.9 and 58 ms. Overlaid on the data is a simulation of the model in Fig. 10. (B) Computer simulations of the gating scheme in Fig. 10 for 400 ms Ca2+-jumps from 0 to the Ca2+ concentration indicated above each trace. For each trace, the rising and falling phase of the activation and deactivation time course, respectively, were fit to single exponential functions with the fitted lines coinciding with the traces. The deactivation time course was independent of the Ca2+ concentration during the jump and gave a time constant of 76 ms. (C) Ca2+ dependence of the activation time course. Activation time-constants obtained from fitting the macroscopic current activation (○) and the simulated traces in B (•) were plotted as a function of Ca2+concentration. Over the range of 0.2 to 10 μM Ca2+, the Ca2+ dependence of the simulated data appeared linear and regression analysis yielded an apparent Ca2+-binding rate of 47 μM−1 s−1.
SK channels underlie the AHP in many neurons. The apamin-sensitive component of the AHP in vagal motoneurons (Sah, 1992) and bullfrog sympathetic ganglion (Pennefather et al., 1985) activates rapidly and is maximal <5 ms after the voltage step used to evoke an action potential. This time course suggests that SK channels in these cells are located near voltage-dependent calcium channels. In contrast, the apamin-insensitive component of the AHP has a slower time course activating with a time constant of 550 ms in guinea pig vagal neurons (Sah, 1993). The apamin-insensitive member (SK1) of the cloned SK channel subtypes is highly homologous to apamin-sensitive members (SK2 and SK3) and shares the same Ca2+ sensitivity (Köhler et al., 1996). As expected, preliminary experiments show that hSK1 and rSK2 have similar open and closed times. Stationary and nonstationary fluctuation analysis of the current at the peak of the apamin-insensitive slow AHP yielded open probabilities of 0.4 in hippocampal pyramidal neurons (Sah and Isaacson, 1995), 0.6 in dentate granule neurons of the hippocampus (Valiante et al., 1997), and 0.7 in vagal motoneurons (Sah, 1995). Assuming that apamin-sensitive and -insensitive SK channels possess similar single channel kinetics, this suggests that the effective Ca2+ concentration at the channel was in the range of 0.7–1.2 μM. In this concentration of Ca2+, the model for the high open probability behavior predicts an activation time constant of 20–30 ms, >10-fold faster than the time constant of the apamin-insensitive slow AHP in vagal neurons (Sah, 1993). This suggests that SK channel kinetics alone are insufficient to explain the time course of the apamin-insensitive AHP, in agreement with data from hippocampal pyramidal neurons using flash photolysis of caged Ca2+ (Lancaster and Zucker, 1994).
Acknowledgments
The authors thank Dr. Joseph Patlak, Dr. Steven Tavalin, and Ken Tovar for helpful discussions. In addition, the authors express their appreciation to the reviewers for their insightful comments that helped to improve the quality of the manuscript.
This work was supported by a National Institutes of Health (NIH) Cardiology Training Grant and a National Research Service Award to B. Hirschberg and by NIH grants to J.P. Adelman, J. Maylie, and N.V. Marrion.
Footnotes
Abbreviations used in this paper: AHP, afterhyperpolarization; BK (and SK) channels, large (and small) conductance Ca-activated K+ channels.
References
- Adelman JP, Shen K-Z, Kavanaugh MP, Warren RA, Wu Y-N, Lagrutta A, Bond CT, North RA. Calcium-activated potassium channels expressed from cloned complementary DNAs. Neuron. 1992;9:209–216. doi: 10.1016/0896-6273(92)90160-f. [DOI] [PubMed] [Google Scholar]
- Auerbach A, Lingle CJ. Heterogeneous kinetic properties of acetylcholine receptor channels in Xenopusmyocytes. J Physiol (Camb) 1986;378:119–140. doi: 10.1113/jphysiol.1986.sp016211. [DOI] [PMC free article] [PubMed] [Google Scholar]
- Blatz AL, Magleby KL. Single apamin-blocked Ca-activated K+channels of small conductance in cultured rat skeletal muscle. Nature. 1986;323:718–720. doi: 10.1038/323718a0. [DOI] [PubMed] [Google Scholar]
- Blatz AL, Magleby KL. Calcium-activated potassium channels. Trends Neurosci. 1987;10:463–467. [Google Scholar]
- Colquhoun, D., and F.J. Sigworth. 1983. Fitting and statistical analysis of single-channel records. In Single-Channel Recording. B. Sakman and E. Neher, editors. Plenum Publishing Corp., New York. 191–263.
- Dawson, R.M.C., D.C. Elliot, W.H. Elliot, and K.M. Jones. 1969. Data for Biochemical Research. Oxford University Press, New York. 654 pp.
- Di Chiara TJ, Reinhart PH. Distinct effects of Ca2+ and voltage on the activation and deactivation of cloned Ca2+-activated K+channels. J Physiol (Camb) 1995;489:403–418. doi: 10.1113/jphysiol.1995.sp021061. [DOI] [PMC free article] [PubMed] [Google Scholar]
- Donnelly JL, Pallotta BS. Single-channel currents from diethylpyrocarbonate-modified NMDA receptors in cultured rat brain cortical neurons. J Gen Physiol. 1995;105:837–959. doi: 10.1085/jgp.105.6.837. [DOI] [PMC free article] [PubMed] [Google Scholar]
- Goh JW, Pennefather PS. Pharmacological and physiological properties of the after-hyperpolarization current of bullfrog ganglion neurons. J Physiol (Camb) 1987;394:315–330. doi: 10.1113/jphysiol.1987.sp016872. [DOI] [PMC free article] [PubMed] [Google Scholar]
- Grissmer S, Lewis RS, Cahalan MD. Ca2+-activated K+channels in human leukemic T cells. J Gen Physiol. 1992;99:63–84. doi: 10.1085/jgp.99.1.63. [DOI] [PMC free article] [PubMed] [Google Scholar]
- Gurney AM, Tsien RY, Lester HA. Activation of a potassium current by rapid photochemically generated step increases of intracellular calcium in rat sympathetic neurons. Proc Natl Acad Sci USA. 1987;84:3496–3500. doi: 10.1073/pnas.84.10.3496. [DOI] [PMC free article] [PubMed] [Google Scholar]
- Hamill O, Marty A, Neher E, Sakmann B, Sigworth FJ. Improved patch-clamp techniques for high resolution current recordings from cells and cell-free membrane patches. Pflügers Arch. 1981;391:85–100. doi: 10.1007/BF00656997. [DOI] [PubMed] [Google Scholar]
- Hess P, Lansman JB, Tsien RW. Different modes of Ca channel gating behaviour favoured by dihydropyridine Ca agonists and antagonists. Nature. 1984;311:538–544. doi: 10.1038/311538a0. [DOI] [PubMed] [Google Scholar]
- Horn R, Lange K. Estimating kinetic constants from single channels data. Biophys J. 1983;43:207–223. doi: 10.1016/S0006-3495(83)84341-0. [DOI] [PMC free article] [PubMed] [Google Scholar]
- Ishii TM, Silvia C, Hirschberg B, Bond CT, Adelman JP, Maylie J. A human intermediate conductance calcium-activated potassium channel. Proc Natl Acad Sci USA. 1997;94:11651–11656. doi: 10.1073/pnas.94.21.11651. [DOI] [PMC free article] [PubMed] [Google Scholar]
- Köhler M, Hirschberg B, Bond CT, Kinzie JM, Marrion NV, Maylie J, Adelman JP. Small-conductance, calcium-activated potassium channels from mammalian brain. Science. 1996;273:1709–1714. doi: 10.1126/science.273.5282.1709. [DOI] [PubMed] [Google Scholar]
- Lancaster B, Adams PR. Calcium-dependent current generating the afterhyperpolarization of hippocampal neurons. J Neurophysiol. 1986;55:1268–1282. doi: 10.1152/jn.1986.55.6.1268. [DOI] [PubMed] [Google Scholar]
- Lancaster B, Nicoll RA, Perkel DJ. Calcium activates two types of potassium channels in rat hippocampal neurons in culture. J Neurosci. 1991;11:23–30. doi: 10.1523/JNEUROSCI.11-01-00023.1991. [DOI] [PMC free article] [PubMed] [Google Scholar]
- Lancaster B, Pennefather P. Potassium currents evoked by brief depolarizations in bull-frog sympathetic ganglion cells. J Physiol (Camb) 1987;387:519–548. doi: 10.1113/jphysiol.1987.sp016587. [DOI] [PMC free article] [PubMed] [Google Scholar]
- Lancaster B, Zucker RS. Photolytic manipulations of Ca2+ and the time course of slow, Ca2+-activated K+current in rat hippocampal neurones. J Physiol (Camb) 1994;475:229–239. doi: 10.1113/jphysiol.1994.sp020064. [DOI] [PMC free article] [PubMed] [Google Scholar]
- Lang DG, Ritchie AK. Large and small conductance calcium-activated potassium channels in the GH3anterior pituitary cell line. Pflügers Arch. 1987;410:614–622. doi: 10.1007/BF00581321. [DOI] [PubMed] [Google Scholar]
- Lang DG, Ritchie AK. Tetraethylammonium blockade of apamin-sensitive and insensitive Ca2+-activated K+channels in a pituitary cell line. J Physiol (Camb) 1990;425:117–132. doi: 10.1113/jphysiol.1990.sp018095. [DOI] [PMC free article] [PubMed] [Google Scholar]
- Latorre R, Oberhauser A, Labarca P, Alvarez O. Varieties of calcium-activated potassium channels. Annu Rev Phys. 1989;51:385–399. doi: 10.1146/annurev.ph.51.030189.002125. [DOI] [PubMed] [Google Scholar]
- Madison DV, Nicoll RA. Control of the repetitive discharge of rat CA1 pyramidal neurons in vitro. J Physiol (Camb) 1984;354:319–331. doi: 10.1113/jphysiol.1984.sp015378. [DOI] [PMC free article] [PubMed] [Google Scholar]
- Magleby KL, Pallotta BS. Calcium-dependence of open and shut interval distributions from calcium-activated potassium channels in cultured rat muscle. J Physiol (Camb) 1983;344:585–604. doi: 10.1113/jphysiol.1983.sp014957. [DOI] [PMC free article] [PubMed] [Google Scholar]
- Marrion NV. Selective reduction of one mode of M-channel gating by muscarine in sympathetic neurons. Neuron. 1993;10:1–20. doi: 10.1016/0896-6273(93)90272-s. [DOI] [PubMed] [Google Scholar]
- Martell, A.E., and R.M. Smith. 1974. Critical Stability Constants. Vol 1. Plenum Publishing Corp., New York. 469 pp.
- McManus OB, Magleby KL. Kinetic states and modes of single large-conductance calcium-activated potassium channels in cultured rat skeletal muscle. J Physiol (Camb) 1988;402:79–120. doi: 10.1113/jphysiol.1988.sp017195. [DOI] [PMC free article] [PubMed] [Google Scholar]
- McManus OB, Magleby KL. Accounting for the Ca2+-dependent kinetics of single large-conductance Ca2+-activated K+channels in rat skeletal muscle. J Physiol (Camb) 1991;443:739–777. doi: 10.1113/jphysiol.1991.sp018861. [DOI] [PMC free article] [PubMed] [Google Scholar]
- Moczydlowski E, Latorre R. Gating kinetics of Ca2+-activated K+channels from rat muscle incorporated into planar lipid bilayers. J Gen Physiol. 1983;82:511–542. doi: 10.1085/jgp.82.4.511. [DOI] [PMC free article] [PubMed] [Google Scholar]
- Neely A, Lingle CJ. Two components of calcium-activated potassium current in rat adrenal chromaffin cells. J Physiol (Camb) 1992;453:97–131. doi: 10.1113/jphysiol.1992.sp019220. [DOI] [PMC free article] [PubMed] [Google Scholar]
- Park YB. Ion selectivity and gating of small conductance Ca2+-activated K+channels in cultured rat adrenal chromaffin cells. J Physiol (Camb) 1994;481:555–570. doi: 10.1113/jphysiol.1994.sp020463. [DOI] [PMC free article] [PubMed] [Google Scholar]
- Patlak JB, Gration KAF, Usherwood PNR. Single glutamate-activated channels in locust muscle. Nature. 1979;278:643–645. doi: 10.1038/278643a0. [DOI] [PubMed] [Google Scholar]
- Patlak JB, Ortiz M, Horn R. Opentime heterogeneity during bursting of sodium channels in frog skeletal muscle. Biophys J. 1986;49:773–777. doi: 10.1016/S0006-3495(86)83704-3. [DOI] [PMC free article] [PubMed] [Google Scholar]
- Pennefather P, Lancaster B, Adams PR, Nicoll RA. Two distinct Ca-dependent K currents in bullfrog sympathetic ganglion cells. Proc Natl Acad Sci USA. 1985;82:3040–3044. doi: 10.1073/pnas.82.9.3040. [DOI] [PMC free article] [PubMed] [Google Scholar]
- Rothberg BS, Bello RA, Song L, Magleby KL. High Ca2+ concentrations induce a low activity mode and reveal Ca2+-independent long shut intervals in BK channels from rat muscle. J Physiol (Camb) 1996;493:673–689. doi: 10.1113/jphysiol.1996.sp021414. [DOI] [PMC free article] [PubMed] [Google Scholar]
- Sah P. Kinetic properties of a slow apamin-insensitive Ca2+-activated K+current in guinea pig vagal neurons. J Neurophysiol. 1993;69:361–366. doi: 10.1152/jn.1993.69.2.361. [DOI] [PubMed] [Google Scholar]
- Sah P. Properties of channels mediating the apamin-insensitive afterhyperpolarization in vagal motoneurons. J Neurophysiol. 1995;74:1772–1776. doi: 10.1152/jn.1995.74.4.1772. [DOI] [PubMed] [Google Scholar]
- Sah P. Ca2+-activated K+currents in neurones: types, physiological roles and modulation. Trends Neurosci. 1996;19:150–154. doi: 10.1016/s0166-2236(96)80026-9. [DOI] [PubMed] [Google Scholar]
- Sah P, Isaacson JS. Channels underlying the slow after-hyperpolarization in hippocampal pyramidal neurons: neurotransmitters modulate the open probability. Neuron. 1995;15:435–441. doi: 10.1016/0896-6273(95)90047-0. [DOI] [PubMed] [Google Scholar]
- Sah P, McLachlan EM. Ca2+-activated K+ currents underlying the afterhyperpolarization in guinea pig vagal neurons: a role for Ca2+-activated Ca2+release. Neuron. 1991;7:257–264. doi: 10.1016/0896-6273(91)90264-z. [DOI] [PubMed] [Google Scholar]
- Schwindt PC, Spain WJ, Crill WE. Calcium-dependent potassium currents in neurons from cat sensorimotor cortex. J Neurophysiol. 1992;67:216–226. doi: 10.1152/jn.1992.67.1.216. [DOI] [PubMed] [Google Scholar]
- Silberberg SD, Lagrutta A, Adelman JP, Magleby KL. Wanderlust kinetics and variable Ca2+-sensitivity of dSlo, a large conductance Ca2+-activated K+channel, expressed in oocytes. Biophys J. 1996;70:2640–2651. doi: 10.1016/S0006-3495(96)79833-8. [DOI] [PMC free article] [PubMed] [Google Scholar]
- Storm JF. Action potential repolarization and a fast after-hyperpolarization in rat hippocampal pyramidal cells. J Physiol (Camb) 1987;385:733–759. doi: 10.1113/jphysiol.1987.sp016517. [DOI] [PMC free article] [PubMed] [Google Scholar]
- Valiante TA, Abdul-Ghani MA, Carlen PL, Pennefather P. Analysis of current fluctuations during afterhyperpolarization current in dentate granule neurones of the rat hippocampus. J Physiol (Camb) 1997;499:121–134. doi: 10.1113/jphysiol.1997.sp021915. [DOI] [PMC free article] [PubMed] [Google Scholar]
- Wilson GF, Kaczmarek LK. Mode-switching of a voltage-gated cation channel is mediated by a protein kinase A-regulated tyrosine phosphatase. Nature. 1993;366:433–438. doi: 10.1038/366433a0. [DOI] [PubMed] [Google Scholar]
- Yarom Y, Sugimori M, Llinas R. Ionic currents and firing patterns of mammalian vagal motoneurons in vitro. . Neuroscience. 1985;16:719–737. doi: 10.1016/0306-4522(85)90090-9. [DOI] [PubMed] [Google Scholar]


