Abstract
Fast inactivating Shaker H4 potassium channels and nonconducting pore mutant Shaker H4 W434F channels have been used to correlate the installation and recovery of the fast inactivation of ionic current with changes in the kinetics of gating current known as “charge immobilization” (Armstrong, C.M., and F. Bezanilla. 1977. J. Gen. Physiol. 70:567–590.). Shaker H4 W434F gating currents are very similar to those of the conducting clone recorded in potassium-free solutions. This mutant channel allows the recording of the total gating charge return, even when returning from potentials that would largely inactivate conducting channels. As the depolarizing potential increased, the OFF gating currents decay phase at −90 mV return potential changed from a single fast component to at least two components, the slower requiring ∼200 ms for a full charge return. The charge immobilization onset and the ionic current decay have an identical time course. The recoveries of gating current (Shaker H4 W434F) and ionic current (Shaker H4) in 2 mM external potassium have at least two components. Both recoveries are similar at −120 and −90 mV. In contrast, at higher potentials (−70 and −50 mV), the gating charge recovers significantly more slowly than the ionic current. A model with a single inactivated state cannot account for all our data, which strongly support the existence of “parallel” inactivated states. In this model, a fraction of the charge can be recovered upon repolarization while the channel pore is occupied by the NH2-terminus region.
Keywords: gating currents, K+ channels, fast inactivation, charge immobilization
introduction
Voltage-activated potassium channels play a key role in the control of membrane excitability. As potassium has a negative reversal potential, the opening of these channels draws the membrane potential toward negative values and far from the excitability threshold. Different activation and inactivation kinetics allow them to control the repolarization after an action potential (delayed rectifiers, slow inactivation) or both the potential duration and firing frequency (A-type channels, fast and slow inactivation). In fast-inactivating Shaker K+ channels, the gating charge return after a depolarizing pulse is very slow (Bezanilla et al., 1991). This slow return of charge, referred to as “charge immobilization,” was first seen in the squid axon Na+ channels and correlated with the fast inactivation process by Armstrong and Bezanilla (1977). They proposed a “ball and chain” model, where an inactivation particle binds to the inner mouth of the pore and slows down the gating charge return. Through the suppression of fast inactivation by the amino terminus deletion mutant and its restoration by application of the synthetic NH2 terminus (ball peptide) on the cytoplasmic side of the channels, the ball and chain theory was established for Shaker K+ channels. The cytoplasmic NH2 terminus of each of the four subunits is responsible for the fast inactivation process (Hoshi et al., 1990; Zagotta et al., 1990; MacKinnon, 1991; MacKinnon et al., 1993).
Shaker K+ channels are good candidates to study fast inactivation and gating current kinetics due to their high level of expression (Tempel et al., 1987; Iverson et al., 1988; Kamb et al., 1988; Bezanilla et al., 1991; Stefani et al., 1994a ). The amino deletion mutation Δ6-46 (Hoshi et al., 1990) removes fast inactivation without visible effects on activation, so the channel behavior can be compared in the presence and absence of the fast inactivation process. Moreover, the introduction of the W434F pore mutation in the Δ6-46 Shaker K+ channel results in a nonconducting channel with gating currents very similar to those of the conducting clone. It allows the study of gating currents without significant contamination by ionic current (Perozo et al., 1993; Starkus et al., 1997; Yang et al., 1997). In this study, we expanded the initial results of Bezanilla et al. (1991) that showed charge immobilization in Shaker H4 (ShH4) channels. We correlated the installation and recovery of the fast inactivation process with changes in the kinetics of gating currents. The experiments were performed in the conducting and nonconducting (W434F) clones, since the W434F mutation in the wild-type Shaker K+ channel leads to a channel with gating currents very similar to the conducting one, as previously reported for Shaker H4 Δ6-46 (ShH4 Δ6-46) and ShH4 Δ6-46 W434F channels (Perozo et al., 1993). We were able to monitor the full gating charge return over a wide range of potentials (from −120 to 6 mV). To correlate fast inactivation and charge movement kinetics, we compared the time course of fast inactivation with those of the components of the OFF gating currents. Demo and Yellen (1991) proved in single channel experiments that, in high external potassium, most if not all the recovery of the ionic current takes place through the inactivated (I)1 to open (O) state transition, and proposed that a similar situation may occur at low external K+ concentrations. However, ionic and gating current measurements of Shaker K+ channels could be explained by the existence of a “parallel” pathway of inactivated states (Zagotta and Aldrich, 1990; Bezanilla et al., 1991). We report here that a sequential model with a single inactivated state cannot fully explain our data, which are consistent with the existence of a set of parallel inactivated states.
materials and methods
Molecular Biology, Oocyte Preparation, and Injection of cRNAs
Four different clones of Shaker K+ channels were used: Shaker H4 (ShH4) (Kamb et al., 1988; Tempel et al., 1987), the noninactivating Δ6-46 deletion mutant Shaker H4 Δ6-46 (ShH4 Δ6-46) (Hoshi et al., 1990) and the two nonconducting versions with the W434F pore mutation (ShH4 W434F and ShH4 Δ6-46 W434F). RNA was synthesized from each cDNA construct by linearization of the pBluescript plasmids (Stratagene Inc., La Jolla, CA) with EcoRI and transcription with T7 RNA polymerase (Promega, Madison, WI) using the mMESSAGE mMACHINE kit (Ambion Inc., Austin, TX).
Xenopus laevis (Nasco, Modesto, CA) oocytes (stage V–VI) were used. 1 d before injection of the cRNA, the oocytes were collected and treated with collagenase (200 U/ml; GIBCO BRL, Grand Island, NY) in a Ca2+-free solution to remove the follicular layer. They were injected with 50 nl of cRNA at 0.05–1 μg/μl using a “nano-injector” (Drummond Scientific Co., Broomall, PA). They were maintained at 19°C in an amphibian saline solution supplemented with 50 mg/ml gentamicin (GIBCO BRL) for 2–7 d before experiments.
Solutions and Electrophysiological Recordings
Electrical measurements were performed with the cut-open oocyte vaseline gap (COVG) technique (Stefani et al., 1994a ; Bezanilla and Stefani, 1998; Stefani and Bezanilla, 1998). The intracellular electrode was filled with 2.7 M Na-methanesulfonic acid (MES), 10 mM NaCl, 10 mM EGTA, and 10 mM HEPES. Internal and external solutions were made by mixing stock isotonic (240 mOsm) solutions of the main cation buffered at pH 7.0 with 10 mM HEPES. A typical external solution was 105 mM NaMES, 2 mM Ca(MES)2, 2 mM KMES, 0.1 mM ouabain, and 10 mM HEPES; it is abbreviated as NaMES Ca2 K2. NaMES Ca2, KMES Ca2, or N-methyl-d-glucamine (NMDG)-MES Ca2 were also used. The electrical access to the cytoplasm of the oocyte was achieved by applying in the bottom chamber a K-Glu (110 mM K-glutamate, 10 mM HEPES), NMDG-Glu (110 mM NMDG-glutamate, 10 mM HEPES) or NMDG-MES (106 mM NMDG-MES, 10 mM HEPES, 2 mM MgCl2, 0.1 mM EGTA) solution supplemented with 0.1% saponin. The bottom chamber was then filled with K-Glu, NMDG-Glu, or NMDG-MES. Two different methods were used to deplete internal K+ in the oocytes: (a) they could be internally perfused (0.4–1 ml/h) with NMDG-MES or NMDG-Glu with a glass pipette (20–50-μM diameter at the tip), inserted into the bottom of the oocyte and connected to a syringe pump; and (b) they were given repetitive long depolarizing pulses with frequent washes of the top and guard chambers with NMDG-MES Ca2. Experiments were performed at room temperature.
Data were acquired with an IBM compatible personal computer, using a DMA interface and PCLAMP software (Axon Instruments, Foster City, CA). Analog signals were filtered at one-fifth the sampling frequency. Linear capacity and resistive components were digitally subtracted using a P/−4 (subtracting holding potential [SHP] = −120 or −90 mV) or a P/4 (SHP = 20 mV) protocol. The adequacy of the subtraction protocol was tested by using different SHP and comparing unsubtracted records and records subtracted on and off line. Unsubtracted charge movement could be recorded after analog compensation of the linear capacity and resistive components at either −120 or 20 mV, potentials at which the gating charge has practically moved entirely in one direction or the other.
Simulation
The model predictions were obtained using the SCOP 3.5 simulation package (Simulation Resources, Inc., Berrien Springs, MI). The source code was compiled with the DJGPP C/C++ compiler (Delorie Software, Rochester, NH) on an IBM PC compatible computer. The activation pathway corresponds to the model previously proposed to account for ShH4 Δ6-46 W434F gating currents (Bezanilla et al., 1994), with slightly different parameters as shown in Table I. The generated data were filtered at the same cut-off frequency as the experimental data using a Gaussian filter (Colquhoun and Sigworth, 1983). The voltage-dependent rates are assumed to be of the form α = α0exp(zα eV/kT) for the forward rates α and β = β0exp(−zβ eV/kT) for the backward rates β, where α0 and β0 are the rates at 0 mV, and zα and zβ are the equivalent charges moving up to the transition state.
Table I.
Values of the Parameters of the Model Activation Pathway
| Transition | zα | zβ | α0(ms−1) | β0(ms−1) | ||||
|---|---|---|---|---|---|---|---|---|
| 0–1 | 0.35 | 0.94 | 1.57 | 0.19 | ||||
| 1–2, 2–3, 3–4 | 0.53 | 0.44 | 9 | 1.26 | ||||
| 4–5 | 0.5 | 0.38 | 1.14 | 2.18 | ||||
| 5–6, Model 1A | 2.81 | 1.69 | 50.3 | 0.023 | ||||
| 5–6, Models 2, 3 | 2.81 | 1.69 | 74.6 | 0.058 | ||||
| 6–7, Model 1A | 0.3 | 0.38 | 1.7 | 1.1 | ||||
| 6–7, Models 2, 3 | 0.3 | 0.38 | 1.7 | 0.88 | ||||
| O↔ Cf | 0 | 0.17 | 0.6 | 3.8 | ||||
| O↔ IN, Model 1A | 0.035 | 0.2 | 1.13 | 0.021 | ||||
| O↔ IN, Model 2 | 0.01 | 0.2 | 1.14 | 0.04 | ||||
| O↔ IN, Model 3 | 0.01 | 0.2 | 1.02 | 0.052 | ||||
| IN↔ IC, Model 2 | 0 | 0 | 0.012 | 0.024 | ||||
| IN↔ IC, Model 3 | 0 | 0 | 0.024 | 0.022 |
Additional parameters for Model 3 were: W4 = 0.1, W5 = 2.85, and W6 = 1.93.
results
Ionic and Gating Currents in ShH4 and ShH4 Δ6-46 Channels
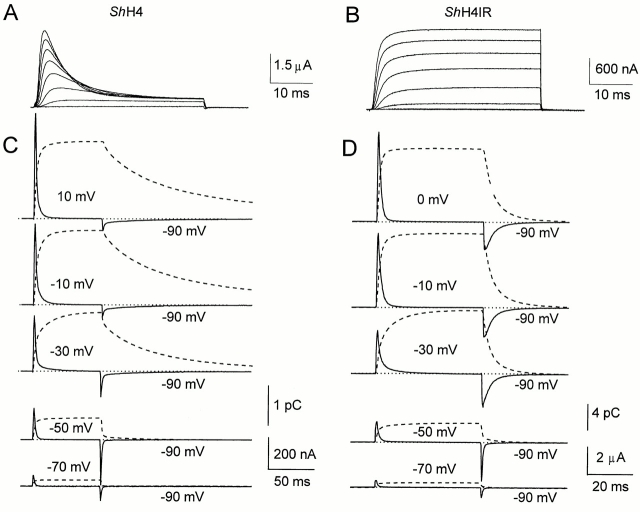
The general properties of ionic and gating currents of ShH4 channels are illustrated in Fig. 1. During the depolarizing pulses, ShH4 channels have fast inactivating ionic currents (Fig. 1 A), while ShH4 Δ6-46 have sustained currents (Fig. 1 B). The fast inactivation in ShH4 is due to the NH2 terminus of the subunits of the homotetramer, as shown by Hoshi et al. (1990) by deletions in this domain.
Figure 1.
Ionic currents in inactivating ShH4 (A) and noninactivating ShH4 Δ6-46 (B) channels. On this time scale, no inactivation can be detected in ShH4 Δ6-46 currents, but ShH4 currents are quickly inactivated with a single exponential time course (3–10 ms, depending on pulse potential and variations from oocyte to oocyte). 40-ms pulses from −40 to 30 mV in 10-mV increments from HP = −90 mV. Records were subtracted (P/−4) with SHP = −120 mV (A) or −90 mV (B). All the recordings were made in NaMES Ca2 K2; data were sampled at 20 kHz and filtered at 4 kHz; one sweep per trace; 10 s between sweeps for A to allow a full recovery from inactivation. (C and D) Gating currents are shown from the inactivating (ShH4) and noninactivating (ShH4 Δ6-46) K+ channels, respectively, recorded in potassium-free solutions (continuous lines). The external solution was NMDG-MES Ca2 while the oocyte was internally perfused with NMDG-MES. HP = −90 mV, the pulse potential is indicated next to the traces. The dashed lines correspond to the time integrals. The records are unsubtracted. (B) Data were sampled at 5 kHz and filtered at 1 kHz. The duration of the ON pulse was 50 ms, 0.5 s between sweeps. (C) Data were sampled at 25 kHz and filtered at 5 kHz. ON pulse duration was 60 ms.
To record gating currents, ionic currents must be eliminated. To this end, in the conducting clones, we internally perfused the oocytes with NMDG-MES or NMDG-Glu. Fig. 1 shows unsubtracted gating currents (solid lines) and the corresponding time integral (dashed lines) for ShH4 and ShH4 Δ6-46 (Fig. 1, C and D, respectively) from −90 mV holding potential (HP) to various depolarizing potentials.
In the range of potential studied (−120 to 50 mV), ON gating currents are indistinguishable between the two clones. From the holding potential (−90 mV), small depolarizations or hyperpolarizations generate fast rising gating currents with a single exponential decay. For depolarizations more positive than −50 mV, where the open state becomes populated, the ON develops a pronounced rising phase (not seen at this sampling frequency) and a slow second component appears in the decay phase. With increasing depolarizations, the slow ON component becomes faster and progressively merges with the initial fast component in such a way that the two components become indistinguishable at potentials more positive than −10 mV (Stefani et al., 1994a ). At −90-mV return potential, the OFF gating currents of the two clones are indistinguishable for potentials more negative than −50 mV in which the open state is not reached. They have an instantaneous rising phase followed by a single exponential decay. For potentials more negative than −50 mV, gating currents can be recorded in K+-containing solution without significant contamination from the ionic current as the channel open probability is very low. They are indistinguishable from those recorded in the absence of K+ in NMDG-MES–perfused oocytes (data not shown).
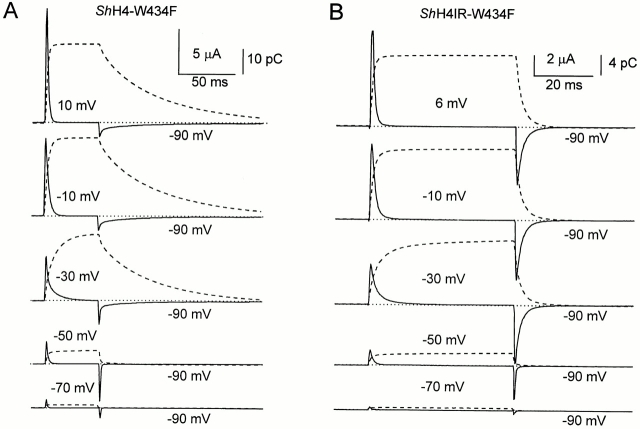
A salient difference between both clones appears in the OFF gating currents for pulse potentials more positive than −50 mV. In both cases, they show a rising phase followed by a slower decay phase, which is much slower for ShH4 channels than for ShH4 Δ6-46 channels (compare Fig. 1, C and D). In the noninactivating clone, the gating charge has recovered in 10–20 ms, while in the fast-inactivating clone, it has not completely recovered after 100 ms, as noted from the time integral. This slow charge return referred to as charge immobilization makes it difficult to study the OFF gating currents, since they can be easily contaminated by residual tail or leakage currents. For this reason, we used the pore mutation W434F, which prevents ionic conduction without apparently affecting the gating currents in ShH4 Δ6-46 channels (Perozo et al., 1993). Fig. 2 shows gating currents (solid lines) and the corresponding time integral (dashed lines) for both clones with the W434F pore mutation (ShH4 W434F [A] and ShH4 Δ6-46 W434F [B]). The gating currents in the corresponding conducting and nonconducting clones have similar properties. As in the conducting clones, the main difference between the inactivating and noninactivating clones is that, after depolarizations that populate the open state, the OFF gating currents show a fast and slow phase of decay that is more pronounced in the inactivating clone. We will hereafter refer to the fast returning charge as Qf and to the slow returning charge as Qs.
Figure 2.
Gating currents of ShH4 W434F (A) and ShH4 Δ6-46 W434F (B) (continuous lines) with the corresponding time integral (dashed lines). ON gating currents are identical at all potentials tested (here from −70 to 10 mV by 20-mV increments) between the two clones. For depolarizations below the opening threshold (−50 mV), the OFF gating currents are identical too, but for depolarizations leading to channel opening, ShH4 W434F OFF gating currents have a markedly slower decay than those of ShH4 Δ6-46 W434F. HP = −90 mV, the pulse potential is indicated next to the traces. The external solution (top and guard) was NaMES Ca2; the internal solution (bottom) was K-Glu. The records are unsubtracted. (A) Data were sampled at 5 kHz and filtered at 1 kHz. The ON pulse duration was 50 ms. (B) Data were sampled at 2.5 kHz and filtered at 500 Hz. The ON pulse duration was 48 ms. A long OFF pulse (165 ms) allows recording of most of the charge return. Sweeps were made every 5 s to allow full recovery between traces.
Recording of the Total Charge Return in ShH4 W434F
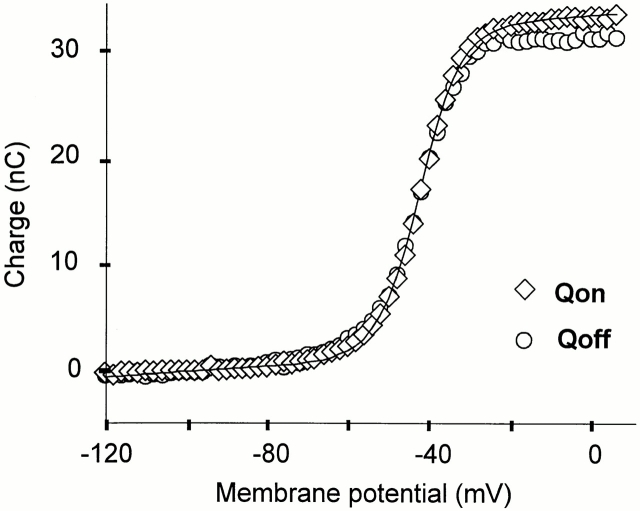
Gating currents are capacitive currents; therefore, the ON and OFF gating charges (QON and QOFF, respectively) must be equal (Figs. 1 and 2). The ON and OFF equality can be easily verified for the noninactivating Shaker clones since the gating charge fully returns in <20 ms at −90 mV, as shown by the time integral. Longer OFF pulse durations are necessary to observe the full charge return in the inactivating clone due to the charge immobilization. Previously reported fractions of the total charge that was recovered at −90 mV were ∼0.5 for 30 ms after repolarizations to −90 mV (Bezanilla et al., 1991; Stefani et al., 1994b ). In this work, we recorded unsubtracted gating currents on a longer time scale for which the complete return of the OFF charge could be monitored (Fig. 2 A). QON and QOFF measured every 2 mV from −120 to 6 mV are plotted in Fig. 3 versus the membrane potential. For potentials higher than −35 mV, there is a small difference between QON and QOFF that can be accounted for by a limited integration interval.
Figure 3.
Charge–voltage relationship in ShH4 W434F channels. QON (⋄) and QOFF (○)measured from −120 to 6 mV in 2-mV increments. QON was best fitted to the sum of two Boltzmann distributions (Q1 = 5 nC, z 1 = 2.9, V1(1/2) = −51.6 mV and Q 2 = 27.3 nC, z 2 = 5.6, V2(1/2) = −41.3 mV, where Q1 and Q 2 are the amplitudes, V1(1/2) and V2(1/2) the half-activation potentials, and z 1 and z 2 the effective valences of the two distributions) and a straight line (slope 13.7 × 10⁻³ nC · mV−1) to account for the linear capacity of the oocyte, which was compensated analogically as much as possible before recording, at a holding potential of −120 mV. The external solution was NaMES Ca2 and the bottom solution was K-Glu.
Components of Gating Charge Returning from Closed, Open, and Inactivated States
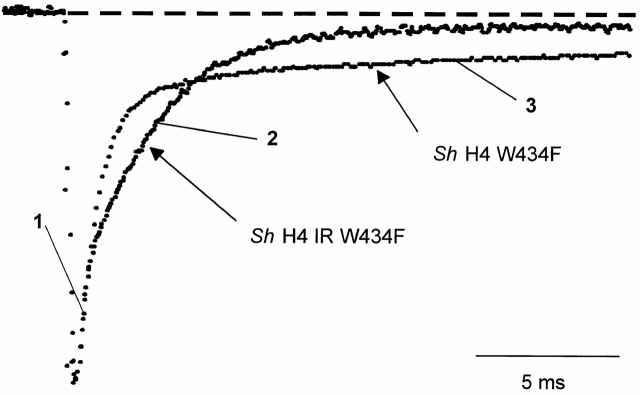
At potentials around −30 mV, the difference between the two nonconducting clones ShH4 W434F and ShH4 Δ6-46 W434F is evident when superimposing both OFF gating currents at −90 mV return potential (Fig. 4). The initial time course of decay is identical in both clones (Fig. 4 1). This initial phase is probably due to the gating charge returning from channels that were still in a closed state. In fact, for more negative pulse potentials in which the channels remained closed, OFF gating currents in both clones have a similar time course to this initial phase. Fig. 4 shows that, after this initial component (1), there is a slow component that is much slower in ShH4 W434F (3) than in ShH4 Δ6-46 W434F (2). The slow component in ShH4 W434F (Fig. 4 3) should correspond to charge returning from both open and inactivated channels, while in ShH4 Δ6-46 W434F (2) it should correspond to charge returning mainly from open channels.
Figure 4.
OFF gating currents stepping back to −90 mV after a depolarization to −30 mV, for ShH4 W434F and ShH4 Δ6-46 W434F. The traces are scaled to the peak. The initial time course (1) is identical for the two clones, but the second component has a much slower time course in the case of ShH4 W434F (3) than for ShH4 Δ6-46 W434F (2), as one corresponds to a charge return from an inactivated state and the other from the open state.
Separation of Two Components in the ShH4 W434F OFF Charge
To quantify Qf and Qs, which corresponds to the fraction of “immobilized” charge, we fitted the decay phase of OFF gating currents at −90-mV return potential with two time constants. The fit was adequate, maintaining the same time constant for the slow component for different pulse depolarizations ranging from −50 to 2 mV (Fig. 5 A), indicating that the rate of the slow component does not depend on the preceding depolarizing potential. For pulse potentials more negative than −50 mV, we considered that Qf was the only component of the gating charge.
Figure 5.
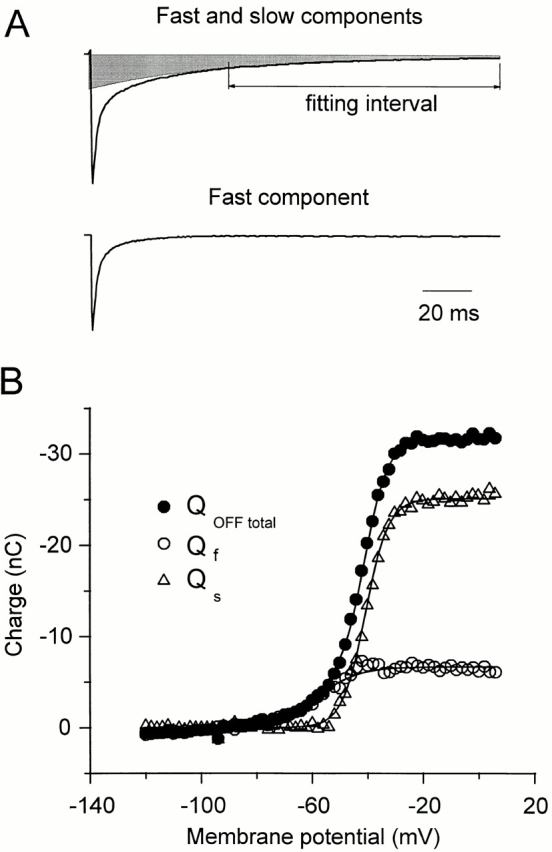
Quantification of two components in the OFF charge in ShH4 W434F. (A, top) OFF gating current returning to −90 mV after a 75-ms pulse to −30 mV. The slow component Qs was estimated by fitting the late part of the trace (36–165 ms after repolarization) starting from the cursor and extrapolated to time 0 of repolarization (shaded area). The fit was adequate for depolarizing pulses between −50 and 2 mV maintaining the same time constant for the slow component. The fast component Qf (bottom) was calculated by subtraction of this slow component (57 ms) from the total OFF gating current. For potentials more negative than −50 mV, we fitted only the fast component. (B) Qf, Qs, and QOFF total plot against the membrane potential. The superimposed lines are simultaneous fit of Qf and Qs to a single Boltzmann distribution (Qf max = −7 nC, Vf(1/2) = −59 mV, z f = 3.2, Qs max = −25.1 nC, Vs(1/2) = −40.7 mV, z s = 6, where Qf max and Qs max are the maximal amplitudes, Vf(1/2) and Vs(1/2) the half-activation potentials, and z f and z s the effective valences of the fast and slow components, respectively), and of QOFF total to the sum of these two Boltzmann distributions.
The separation of the two components Qs and Qf is illustrated in Fig. 5 A for the OFF gating currents at −90 mV after a pulse to −30 mV. The two components Qf and Qs and the total QOFF as functions of the membrane potential are plotted on Fig. 5 B. We simultaneously fitted Qf and Qs to a single Boltzmann distribution and QOFF to the sum of these distributions. The fitted values were Vf = −59 mV, z f = 3.2; Vs = −40.7 mV, z s = 6, where Vf and Vs are the half activation potentials and z f and z s are the effective valences for the fast and slow components, respectively. Qf represents 15–20% of the total charge. This proportion of Qf, which may correspond to charge movement return from open and closed channels, is too large for a strictly sequential model in which the last inactivated state becomes maximally populated.
The Proportion of the Fast Returning Charge Depends on the Repolarization Potential
To test a sequential model with only one inactivated state (···↔ C ↔ O ↔ I), we investigated whether the ratio between Qf and Qs depends on the return potential from a constant depolarizing pulse. The sequential model predicts that the speed of the return of the charge, but not the proportion between Qf and Qs, should depend on the repolarization potential. Fig. 6 A shows the voltage dependence on the return potential after a 100-ms test pulse to 0 mV for the total QOFF, Qf and Qs. The graph in Fig. 6 B shows that the fraction of Qf is larger at more negative repolarization potentials, thus making a linear sequential model for inactivation unlikely.
Figure 6.
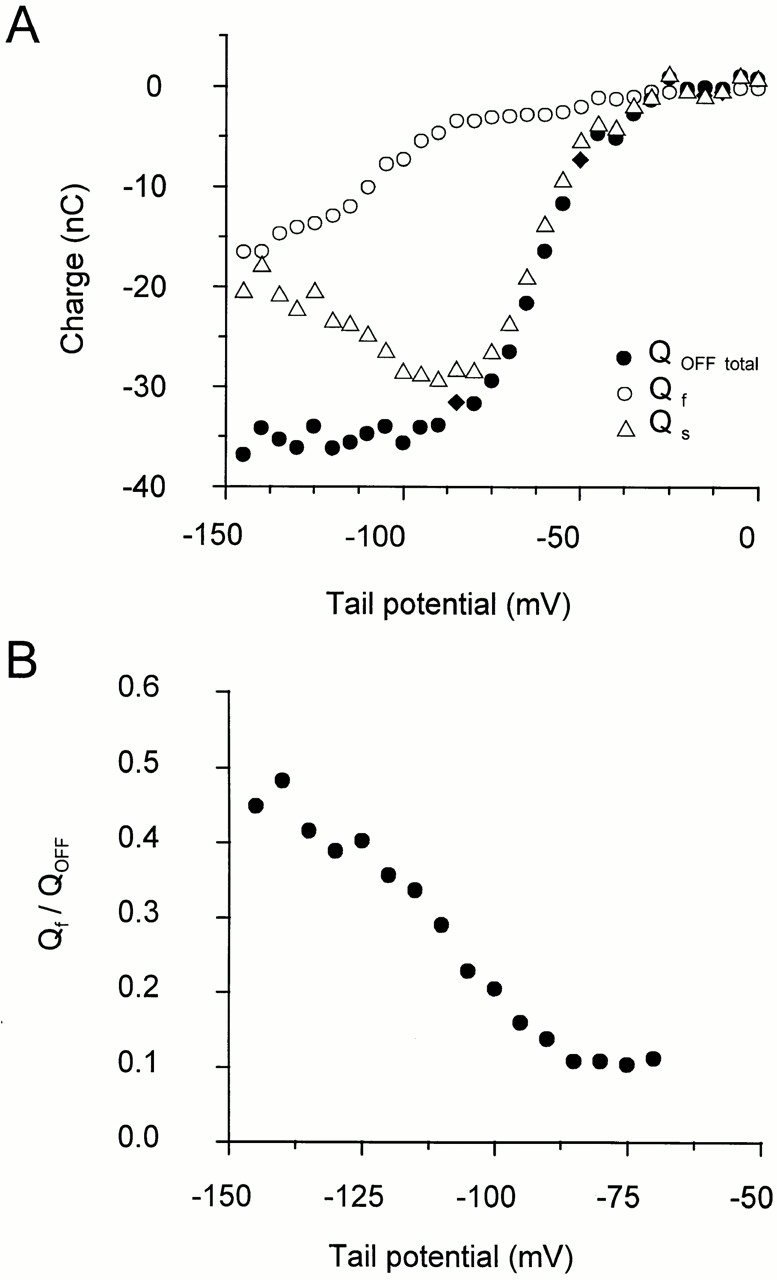
Voltage dependence of the proportion of Qs and Qf in ShH4 W434F. (A) After a 100-ms pulse to 0 mV, the two components of the OFF gating currents were quantified for repolarizing potentials from −145 to −25 mV in 20-mV increments, as in Fig. 5. The total QOFF, as well as the slow (Qs) and fast (Qf) components amplitudes are plotted as a function of the repolarizing potential. (B) The ratio of Qf over the total charge QOFF as a function of the repolarizing potential has a maximum of ∼45% at −145 mV and a minimum of ∼12% at −80 mV.
Voltage Dependence of Charge Return at Different Times
It has been shown in Figs. 1 and 2 that large depolarizing pulses (e.g., 0 mV) that populate the inactivated state greatly slow down charge return. On the other hand, smaller depolarizing pulses that do not fully inactivate the channels, and populate open and closed states, have a much faster return of the charge. As illustrated in Fig. 7 A, the consequence is that a larger amount of charge returns in the initial milliseconds of repolarization after a small depolarization (pulse to −40 mV) compared with large depolarizing pulse to 0 mV, though the total charge moved is smaller at −40 mV than at 0 mV. Note that the time integrals crossed ∼8 ms after repolarization. This behavior is illustrated in Fig. 7 B, in which we measured QOFF at different times of integration after the repolarization. For integration times shorter than 8 ms, the charge–voltage curve peaks at ∼−45 mV, and then decays for larger depolarizing potentials, as expected from slowdown of the OFF gating as the inactivated state becomes populated.
Figure 7.
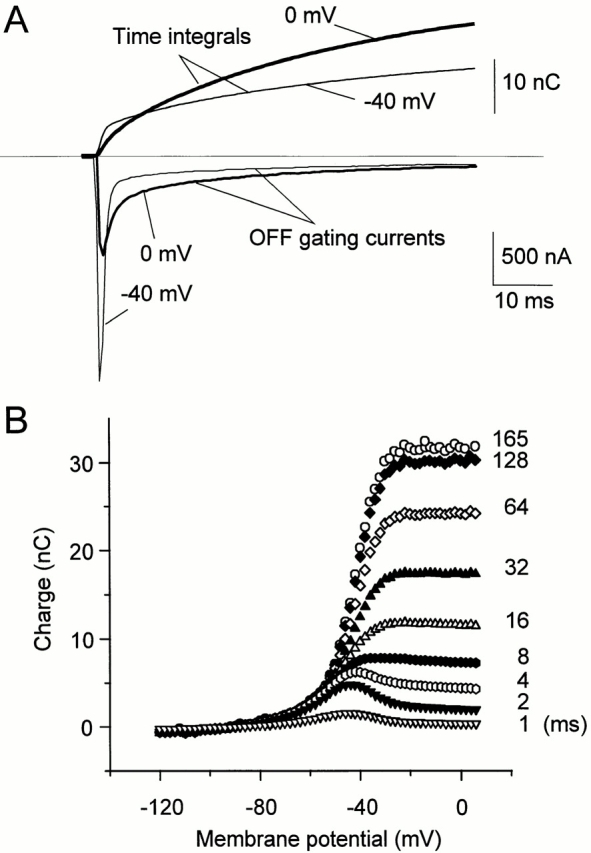
Absolute values of QOFF at different times after repolarization. (A) Unsubtracted records of OFF gating currents for 75-ms depolarizations to −40 (thin trace) and 0 mV (thick trace) from HP = −90 mV, shown along with the corresponding inverse of the time integrals (dotted lines). Though the charge moved at −40 mV is smaller than at 0 mV, the fraction of charge coming back in the first milliseconds is larger, as illustrated by the crossing of the charge integrals ∼8 ms after repolarization. (B) Absolute values of QOFF measured at different times after repolarization (as shown next to the data points). For very short times after repolarization, the charge–potential relationship has a bell shape rather than the usual Boltzmann distribution because the channels have to reach the open state (and inactivate) for the charge to be immobilized.
Charge Immobilization and Ionic Currents Inactivation Have the Same Time Course
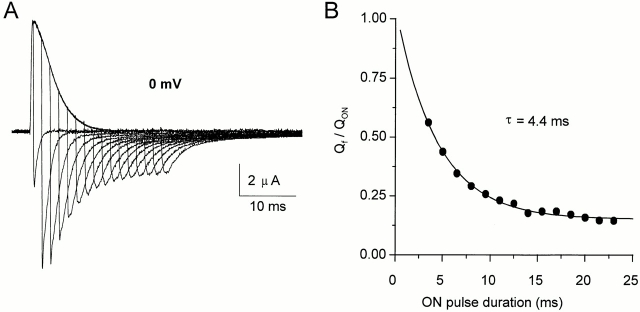
Charge immobilization has been interpreted as a consequence of the binding of the inactivation particle to its docking site in the internal mouth of the channel, preventing the channel from undergoing the deactivation transitions (Bezanilla et al., 1991). The evolution of the OFF gating currents after a depolarization of increasing duration supports this hypothesis. This is illustrated in Fig. 8 A: we fitted the decay phase of the OFF gating currents after pulses to 0 mV of different duration with a two-exponential function. Fig. 8 B shows the plot of the Qf/QON ratio as a function of the ON pulse duration. The plot shows a single exponential decay with a time constant of 3–5 ms, which correlates with the inactivation time constant of the ionic current of ShH4 at 0 mV (Fig. 9 shows ionic currents for a pulse to 20 mV with a similar time constant). This result supports the link between ionic current inactivation and the slowdown of charge movement.
Figure 8.
Time course of charge immobilization. (A) Unsubtracted gating currents recordings for a depolarization to 0 mV of increasing duration (0.5– 23 ms in 1.5-ms increments), followed by a repolarization to −90 mV (HP = −90 mV). Data were sampled at 20 kHz and filtered at 4 kHz. (B) Evolution of the ratio of the fast returning charge over the total OFF charge as a function of the depolarizing pulse duration, fitted to a single exponential of time constant τ = 4.4 ms for this cell. The time constant varies from 3 to 5 ms at 0 mV, as the one of ShH4 ionic currents inactivation at the same potential.
Figure 9.
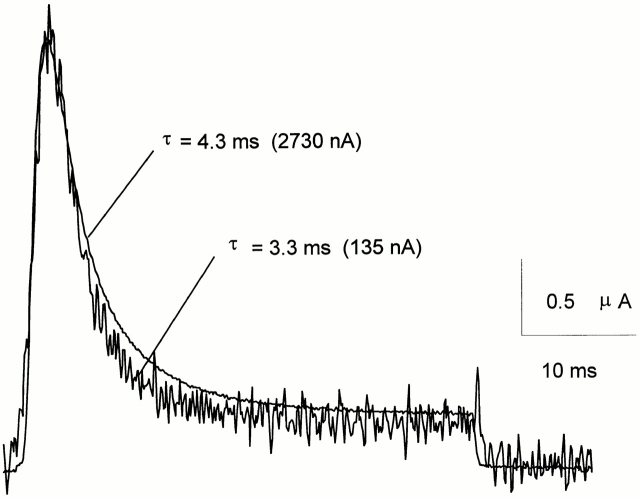
ShH4 ionic current evoked by a 40-ms depolarizing pulse to 20 mV, just before and after 24 min of internal perfusion of an oocyte with NMDG-Glu (400 μl/h). The traces are scaled to the peak current, with amplitudes indicated next to the corresponding trace. In this cell, ionic current decayed with a time constant of 4.3 ms at the beginning of the experiment, and of 3.3 ms 24 min later, as the peak current was only 5% of the initial one. The perfusion pipette was placed close to the cytoplasmic face of the dome membrane. The current was monitored every 5 s, from a HP = −90 mV. The top and guard solution was NaMES Ca2, the bottom and perfusion pipette solution was NMDG-Glu. The data were sampled at 10 kHz and filtered at 2 kHz. A P/−4 protocol from SHP = −90 mV was used for leak subtraction.
Internal Potassium Does Not Affect Inactivation Kinetics
External K+ is known to lower the apparent affinity of the inactivation particle for its binding site by a “knock-off” mechanism (Demo and Yellen, 1991). Internal K+ may also have some influence on fast inactivation; for instance, as the W434F mutation disrupts conduction, it may influence the occupancy of an internal K+ binding site(s) and thus modify the kinetics of ball binding. To assess this possibility, we monitored the ionic currents of conducting ShH4 channels while internally perfusing the oocytes with NMDG-Glu, giving a pulse to 20 mV every 5 s. The inactivation time constant was practically unaffected by lowering internal K+ (Fig. 9).
Recovery from Inactivation of Ionic and Gating Currents in Low External K+
The comparison of the recovery time courses of the ionic and gating currents gives us more insight on the inactivation mechanism and the underlying kinetic scheme, through the voltage dependency of the transition(s) involved and the number of components. ShH4 W434F channels have identical gating currents in low (0 or 2 mM) and isotonic external potassium. In a consistent way, their recovery from inactivation is not affected, though the recovery of the ionic currents is faster in isotonic potassium than in low external potassium (Demo and Yellen, 1991). This supports the view that external K+ destabilizes the binding of the “ball peptide” to the inner mouth of the channel. This effect was not observed in ShH4 W434F mutant, possibly due to lack of conduction that prevents the accessibility of external K+ to the inner mouth. Thus, the time course of recovery of charge movement in ShH4 W434F may correspond to a recovery in low external K+ for the conducting clone, and the recovery experiments were performed accordingly in 2 mM external K+.
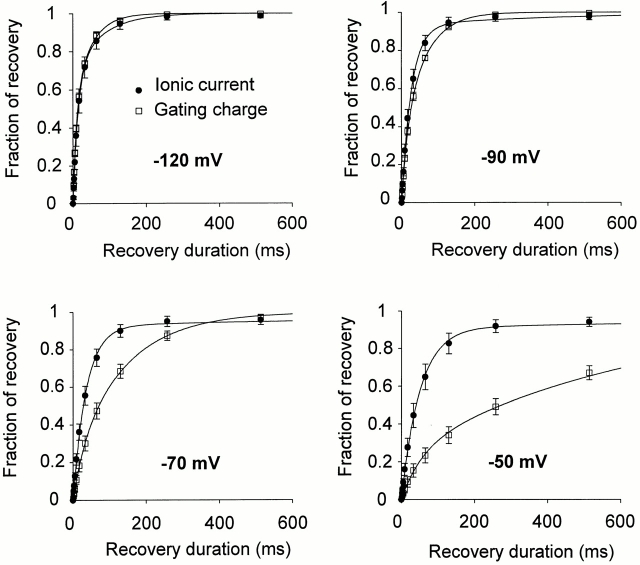
Fig. 10 A shows the protocol to obtain the time course of recovery of the ionic (ShH4) and gating (ShH4 W434F) current after a 50-ms prepulse to 20 mV. Fig. 11 shows the different time course of recovery of the ionic and gating currents for different recovery potentials. For negative recovery potentials (−120 and −90 mV), there is a good correlation in the recovery time course of ionic and gating currents. On the other hand, at more positive recovery potentials, the gating currents recover at a much slower rate than ionic currents.
Figure 10.
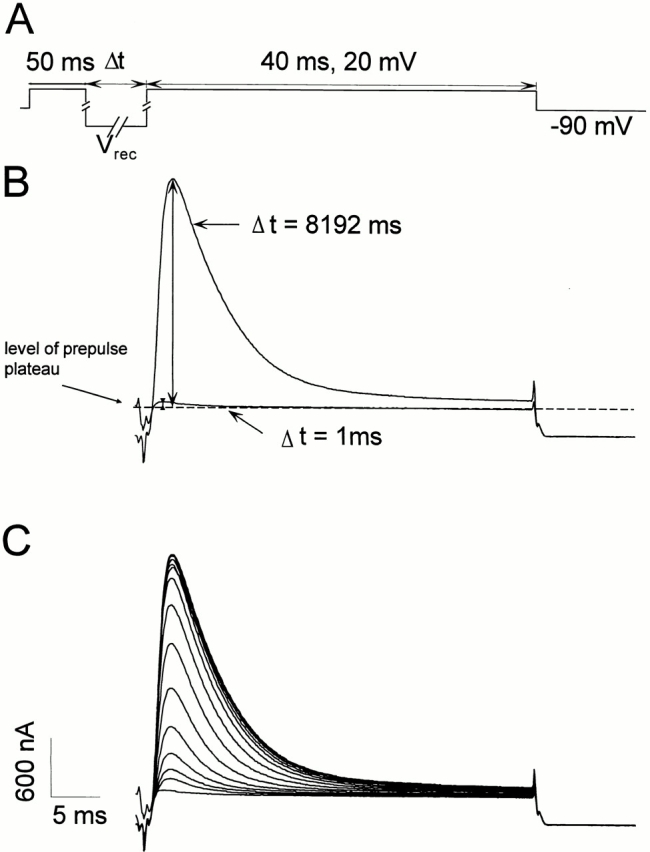
(A) Protocol used to evaluate the ionic and gating currents. A 50-ms prepulse to 20 mV was followed by a recovery pulse of variable duration (1–8,193 ms) and amplitude (−120, −90, −70, and −50 mV), and then by a 40-ms test pulse to 20 mV (HP = −90 mV). The records were made allowing 10 s between sweeps to avoid inactivation accumulation. The traces are unsubtracted. (B) The traces corresponding to recovery pulses of 1 and 8,193 ms are shown. The amount of recovery is estimated by the difference between the level of the prepulse plateau and the peak current during the test pulse. (C) Ionic currents after a recovery pulse to −120 mV of duration 1, 2, 3, 5, 9, 17, 33, 65, 129, 257, 513, 1,025, 2,049, 4,097, and 8,193 ms. The data were sampled at 10 kHz and filtered at 2 kHz.
Figure 11.
Comparison of the recovery of ionic current and gating charge at different potentials. Ionic currents and gating charge– normalized recoveries are superimposed for recovery potentials of −120, −90, −70, and −50 mV (n = 10 for ionic currents and 3 for gating currents; error bars = ±SEM). The overall time courses are close to the two types of currents for recovery at −120 or −90 mV. However, at more depolarized recovery potentials, the ShH4 ionic currents recover faster than ShH4 W434F gating currents.
The ionic current recovery has a two-exponential time course with a predominant fast component (Demo and Yellen, 1991). The fast component is exponentially dependent on voltage (effective valence zδ = 0.39, n = 13–15, Fig. 12 A, •).
Figure 12.
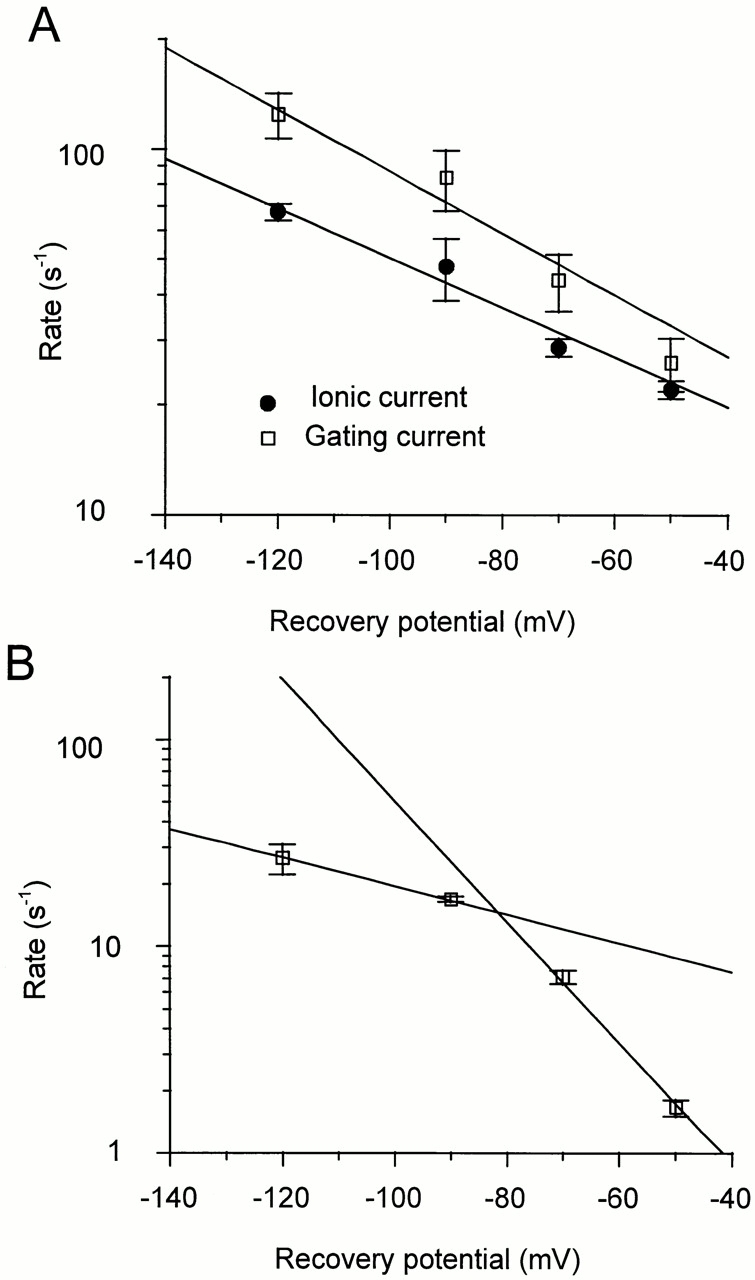
Voltage dependence of the recovery rates. (A) The rate of fast recovery of the ionic current (n = 13–15; ±SEM) and of the gating current (n = 4; ±SEM) are plotted as a function of the recovery potential. Each component was fitted to a rate that is an exponential function of the potential. The fitted zδ of ionic and gating current fast components are similar (0.39 and 0.49, respectively). The values of the rates are (s−1): 67.4 ± 3.5, 47.7 ± 9.2, 28.6 ± 1.6, and 22.0 ± 1.2 for the ionic currents, and 124 ± 7.5, 83.7 ± 15.6, 43.9 ± 7.8, and 26.0 ± 4.28 for the gating currents (mean ± SEM). (B) The rate of slow recovery of the gating currents (n = 4, ±SEM) is plotted as a function of the recovery potential. The values of the rates are (s−1): 26.6 ± 4.4, 16.9 ± 0.6, 7.11 ± 0.54, and 1.65 ± 0.15 (mean ± SEM). The data points cannot be fitted to a single exponential function of the potential. The two lines on the graph correspond to rates with zδ's of 0.4 and 1.7.
Two exponential components are needed to account for the recovery of the charge. The faster one corresponds to values from 20% (at −50 mV) to 50% (at −120 mV) of the total charge. The voltage dependence of this component corresponds to a zδ of 0.49, n = 4 (Fig. 12 A, □), which is slightly higher than the one measured from the ionic currents recovery.
The voltage dependence of the slow rate could not be fitted to a single exponential, indicating that it may correspond to several rates that make up a composite pathway of recovery (Fig. 12 B). The data points could be described by two exponential rates with zδ values of 1.7 and 0.4. zδ = 1.7 corresponds to the zδ of the gating charge recovery in the noninactivating mutant ShH4 Δ6-46 W434F channel, in equivalent experiments (data not shown).
Recovery of Ionic Currents in Isotonic K+
Demo and Yellen (1991) reported that high external K+ speeds the recovery from inactivation of the ionic current of ShH4 channels, which follows a mostly single-exponential time course close to the fast component of the recovery in low potassium. They showed that this recovery occurs mainly through the open state by studying the single-channel tail currents. In our experiments, the recovery was well described by a single exponential function, though a two-exponential function gave a better result. Both the rate from the single exponential fit and the rate of the fast component from the two-exponential fit are faster than the rate of the fast component of recovery in 2 mM external K+. The voltage dependency of both rates was similar but somewhat smaller than the one measured in low potassium (zδ = 0.3 vs. 0.39).
discussion
The pore mutation W434F is a powerful tool to study the gating currents of Shaker K+ channels in K+-containing solutions. Perozo et al. (1993) reported that ShH4 Δ6-46 W434F channels have gating currents similar to those of ShH4 Δ6-46 channels as recorded in potassium-free solutions using NMDG as the main cation (Bezanilla et al., 1991; Perozo et al., 1992), and that these mutant channels still undergo a close-to-open transition as shown by the charge immobilization induced by internal TEA (tetraethyl ammonium). We report here that similar results are true for the fast-inactivating ShH4 channel. The charge immobilization induced by the NH2-terminal inactivation ball is seemingly unaffected by the mutation, and its time course matches the time course of the ionic current inactivation. The absence of contamination by ionic current allowed us to monitor the full charge return using long OFF pulses of 165 ms. This increased resolution helped us to assess how often the recovery from inactivation must take place through the open state.
Modeling the Inactivated States
Model 1.
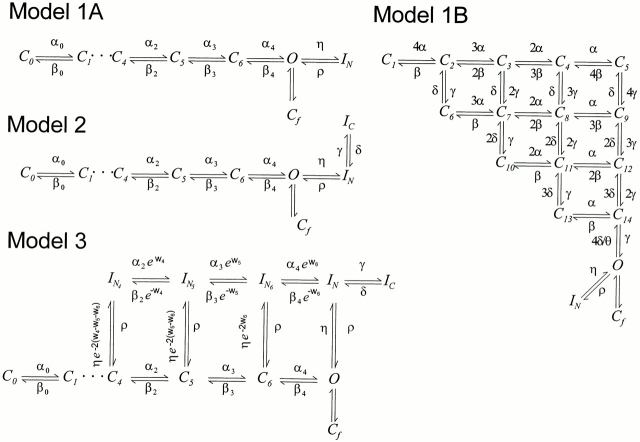
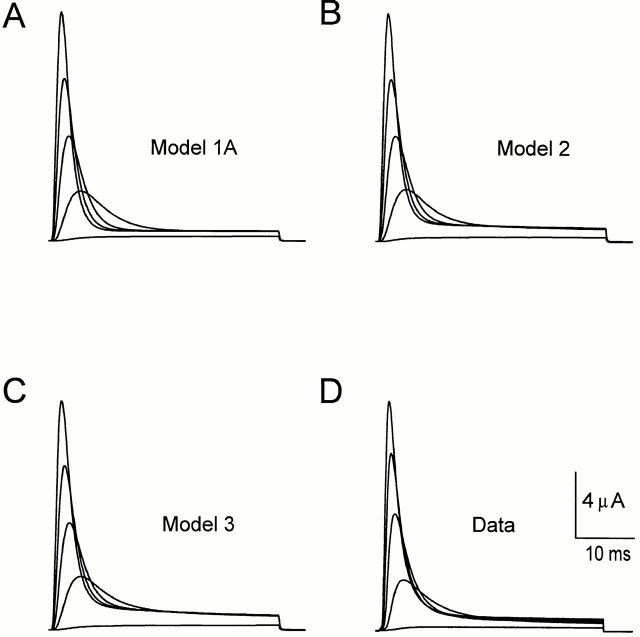
Many aspects of the data are inconsistent with the predictions of a model with only one inactivated state in sequence with the open state: ··· C ↔ O ↔ I N. For example, although Model 1A (Fig. 13) predicts ionic current similar to the data (compare Fig. 14, A and D), it does not predict the two components of the ionic current recovery after inactivation (Fig. 15 A). We tested two versions of Model 1 differing in their activation pathway. The first was a sequential linear model (Fig. 13, Model 1A, and Table I) derived from Bezanilla et al. (1994). The second model (Fig. 13, Model 1B) considers four subunits, each with three states (Zagotta et al., 1994). Both types of models predict very similar ionic currents. However, they failed to predict the components of the OFF charge movement.
Figure 13.
Different kinetic schemes used to simulate ShH4 fast inactivation properties. Models 1A, 2, and 3 are derived from a sequential model developed for ShH4 Δ6-46 and ShH4 Δ6-46 W434F channels (Bezanilla et al., 1994; Roux et al., 1995). A flicker state Cf has been added, as described in Zagotta et al. (1994). The values of the parameters controlling the transitions involving inactivated states were determined through a visual fit to the experimental data. See Table I for the values of the parameters. Model 1B is the model proposed to account for ShB Δ6-46 ionic current by Zagotta et al. (1994), with the addition of one fast inactivated state IN. The value of the θ parameter was set to 1, because our deactivation rate (ShH4 Δ6-46 and ShH4) was much faster than the rates reported by Zagotta et al. (1994). The inactivation parameters values used were the same as for Model 1A (see Table I).
Figure 14.
(A–C) Ionic current traces predicted by Models 1A, 2, and 3, respectively, shown in Fig. 13. Traces are obtained from −90 mV holding potential; depolarizations are from −40 to 40 mV in 20-mV increments. (D) Ionic current traces recorded in the same conditions as simulated data shown in A–C (2 mM external K+, 120 mM internal K+, sampled at 10 kHz and filtered at 2 kHz). The traces were scaled to the peak current value at 40 mV.
Figure 15.
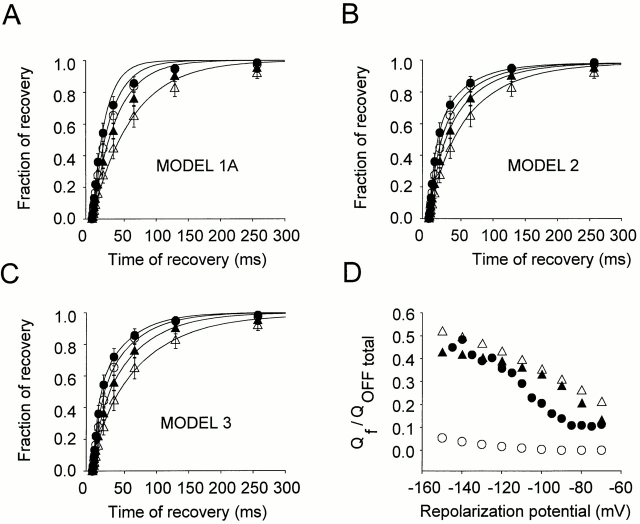
(A–C) Ionic current recovery predicted by Models 1A (A), 2 (B), and 3 (C) (solid lines), respectively, superimposed to the same data set of ionic current recovery (mean ± SEM) for recovery potentials of −120 (•), −90 (○), −70 (▴), and −50 (▵) mV. Both simulation and experimental data correspond to recovery after a conditioning pulse of 50 ms to 20 mV. (D) The ratio of Qf over the total charge QOFF is plotted as a function of the repolarizing potential. After a 100-ms pulse to 0 mV, the membrane was repolarized to potentials between −150 and −70 mV, and the fast and slow component of charge return were quantified for the experimental data (•), for the linear sequential model (Model 1A) (○), for the two inactivated states model (Model 2) (▵), and for the five inactivated states model (Model 3) (▴). Model 1A does not fit the experimental data, while Models 2 and 3 show a similar tendency as the experimental data.
As shown in Fig. 6, we quantified two components in the OFF gating currents as a function of the repolarization potential, after a depolarization of 100 ms to 0 mV. The evolution of the ratio Qf/QOFF is shown in Fig. 15 D for Model 1A (○). In this model, the ratio is very close to zero because the OFF gating current has one major slow component with nearly no detectable fast component. The discrepancy is even larger in Model 1B (not shown). It is then not surprising that the kinetics of OFF gating currents (Fig. 16 D) are not predicted by Models 1A and 1B (Fig. 16 A).
Figure 16.
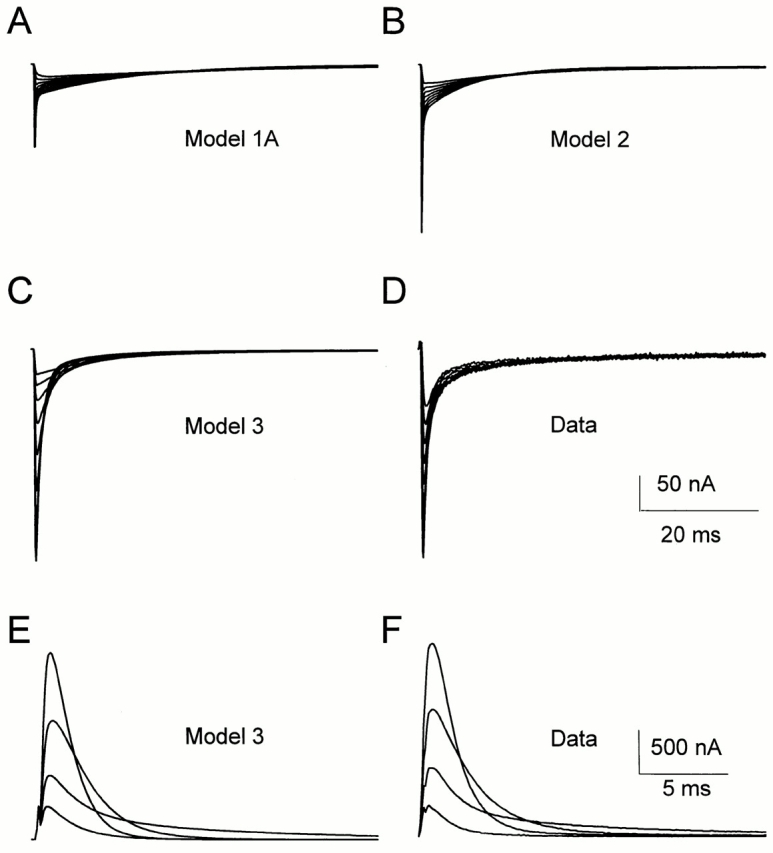
(A–D) OFF gating current evoked by repolarization to potentials from −150 to −70 mV in 10-mV increments, after a 20-ms depolarizing pulse to 20 mV from a holding potential of −90 mV, as predicted by Models 1A (A), 2 (B), and 3 (C), or as recorded experimentally (D). Predicted data and experimental data were generated/sampled at 10 kHz and filtered at 2 kHz. The data were normalized according to the amount of gating charge moving during the depolarizing pulse. (E and F) ON gating current evoked by depolarizations to potentials from −50 to 10 mV in 20-mV increments from a holding potential of −90 mV, as predicted by Model 3 (E) or as recorded (F). Data were generated/ sampled at 10 kHz, filtered at 2 kHz, and normalized to the peak gating current at 10 mV.
Model 2.
Baukrowitz and Yellen (1995) demonstrated that closed-state (C) inactivation is not negligible in ShH4 even during short depolarizations: pore occlusion by the inactivation ball favors the unbinding of potassium ions from an external binding site whose occupancy influences the stability of the C-inactivated state. Therefore, a linear model must be extended to consider at least one other inactivated state in series with the first one: ··· C ↔ O ↔ I N ↔ I C (Fig. 13, Model 2). As with the two previously described models (1A and 1B), Model 2 also makes a good prediction of ionic currents in the −40 to +40 mV range (Fig. 14 B). In addition, it predicts fairly well the ionic current recovery for the four studied potentials (−120, −90, −70, and −50 mV), as shown in Fig. 15 B. This model predicts a voltage dependence of the Qf/QOFF ratio closer to the data than Model 1A (Fig. 15 D); however, it still shows less voltage dependence than the data. Finally, the OFF gating current kinetics and recovery characteristics shown in Fig. 16 B are poorly predicted by this model.
One possible explanation for these discrepancies could be that gating current data were recorded from the W434F mutant channel while ionic currents were recorded from the wild-type ShH4 channel. Yang et al. (1997) reported that tandem tetrameric constructs containing one or two Shaker subunits with the W434F mutation showed rapid inactivation with C-type inactivation characteristics and proposed that W434F mutant channels are predominantly found in an inactivated state. However, our data shows a high level of similarity between the gating current of ShH4 channels recorded in potassium-free solutions and those of ShH4 W434F channels, indicating that the wild-type and mutant channels should have similar inactivation properties in low external potassium.
Model 3.
It is quite possible that inactivation recovery takes a different route. This can be accounted for by the addition to Model 2 of a parallel pathway for inactivation recovery, similar to what has been proposed for the sodium channel inactivation (Armstrong and Bezanilla, 1977; Vandenberg and Bezanilla, 1991) or for Shaker fast inactivation (Bezanilla et al., 1991; Bezanilla and Stefani, 1996). The existence of deeper N-inactivated states is supported by the influence of the L382I mutation on the activation and inactivation kinetics of Shaker channels, interpreted as enhanced closed-state inactivation (Ayek and Sigworth, 1997), as well as the influence of hyperpolarization on the proportions of fast and slow components of ionic current recovery (Kuo, 1997).
To decrease the number of free parameters in Model 3 (see Fig. 13), the voltage dependencies were conserved between parallel transitions. In addition, slow inactivated states were simplified into a single state (Ic). The ON and OFF rates of a given transition between two IN states were destabilized or stabilized by an energy factor that represents the affinity of the inactivation particle for the consecutive state of activation, similar to the model proposed by Olcese et al. (1997).
Model 3 predicts the ionic current kinetics for short depolarizations as well as their recovery in the −120 to −50 mV range (Figs. 14 C and 15 C). It predicts the voltage dependence of the Qf/QOFF ratio at potentials more negative than −110 mV (Fig. 15 D, ▴). The modeled ON gating current kinetics match the data (compare Fig. 16 E, prediction, and 16 F, data), while the OFF gating current kinetics show small discrepancies (compare Fig. 16 C, prediction, and 16 D, data).
The voltage dependence of the ρ rate in our model (zδ = 0.2) is lower than the observed voltage dependence of the fast rate of ionic current as well as gating current recovery measured in low external potassium (zδ of 0.39 and 0.49, respectively). A zδ of 0.4, though high, could be compatible with the ball unbinding, the rate limiting step being the O ← I N transition and/or any of the C i ← I Ni transitions. It may be noted that the C ← O transition has a zδ ≅ 0.4 (Roux et al., 1995). It is highly unlikely that this transition is rate limiting for the recovery of ShH4 channels, but the equivalent transition between I N6 and I N could be a limiting step in the fast recovery at all potentials as well as in the slow charge recovery at very negative potentials (−120 and −90 mV). At potentials closer to the opening threshold of the channels, another transition becomes rate limiting. A zδ of 1.7 points toward the C5 ← C6 transition (and/or the corresponding parallel IN5 ← IN6 transition), which is the most voltage-dependent step in the deactivation pathway (Bezanilla et al., 1994; Sigg et al., 1994).
In high external K+, the I N → O transition is accelerated by the K+ knock-off effect on the inactivation ball (Demo and Yellen, 1991), the I N → I C transition is slowed down (Baukrowitz and Yellen, 1995); therefore, Models 2 and 3 can be simplified into Model 1. In this case, the recovery from inactivation proceeds mainly through the open state.
Since the W434F mutation prevents ionic conduction, one may expect some differences on the kinetics of recovery compared with the wild-type channel, because the population of a C-inactivated state should be favored. As expected, no speeding up of the charge return was observed in isotonic potassium: a nonconducting channel should not exhibit knock off. In contrast, the recovery of the ionic currents observed in the wild-type channel is faster in high external potassium (120 mM) than in low external potassium (0 or 2 mM) (Demo and Yellen, 1991).
In summary, Models 2 and 3 can adequately describe the installation and the recovery of ionic current inactivation. Model 3 gives a better prediction of the OFF gating current and the ratio Qf/QOFF total for return potentials more negative than −110 mV, favoring the presence of a set of parallel N-inactivated states. An implication for this model is that a fraction of this charge can be recovered upon repolarization while the cytoplasmic mouth of the channel is still occupied by the ball peptide. In this regard, the validity of Model 3 is also supported by the experimental findings of Demo and Yellen (1991) that observed some recovery via a silent pathway (particularly at hyperpolarized potentials) that allows channels to close while inactivated. The good correlation in the time course of recovery of ionic and gating current at negative potential suggests that ShH4 and ShH4 W434F may undergo similar conformational changes during recovery at hyperpolarized potentials.
Acknowledgments
We are grateful to Drs. R.S. Hurst and D. Sigg for helpful discussions during the course of this work. We also thank Yuguang Jin for preparing and injecting the oocytes and Zharong Jiang for mRNA synthesis.
This work was supported by National Institutes of Health grants GM-52203 to E. Stefani and L. Toro, GM-30376 to F. Bezanilla, and by an American Heart Association Grant in Aid to R. Olcese. L. Toro is an Established Investigator of the American Heart Association.
Abbreviations used in this paper
- C
closed state
- HP
holding potential
- I
inactivated state
- MES
methanesulfonic acid
- NMDG
N-methyl- d-glucamine
- O
open state
- SHP
subtracting holding potential
Footnotes
Dr. Roux's present address is Laboratoire de Neurobiologie, Ecole Normale Supérieure, 75005 Paris, France.
references
- Armstrong CM, Bezanilla F. Inactivation of the sodium channel. II. Gating current experiments. J Gen Physiol. 1977;70:567–590. doi: 10.1085/jgp.70.5.567. [DOI] [PMC free article] [PubMed] [Google Scholar]
- Ayek RK, Jr, Sigworth FJ. Enhanced closed state inactivation in a mutant Shaker K+channel. J Membr Biol. 1997;157:215–230. doi: 10.1007/s002329900230. [DOI] [PubMed] [Google Scholar]
- Baukrowitz T, Yellen G. Modulation of K+ current by frequency and external [K+]: a tale of two inactivation mechanisms. Neuron. 1995;15:951–960. doi: 10.1016/0896-6273(95)90185-x. [DOI] [PubMed] [Google Scholar]
- Bezanilla, F., and E. Stefani. 1996. Gating of the Shaker B potassium channel. In Basic Neuroscience in Invertebrates. H. Koike, Y. Kidokoro, K. Takahashi and T. Kanaseki, editors. Japan Scientific Societies Press. Tokyo, Japan. 3–18.
- Bezanilla, F., and E. Stefani. 1998. Gating currents. Methods Enzymol. In press. [DOI] [PubMed]
- Bezanilla F, Perozo E, Papazian DM, Stefani E. Molecular basis of gating charge immobilization in Shaker potassium channels. Science. 1991;254:679–683. doi: 10.1126/science.1948047. [DOI] [PubMed] [Google Scholar]
- Bezanilla F, Perozo E, Stefani E. Gating of Shaker K+channels: II. The components of gating currents and a model of channel activation. Biophys J. 1994;66:1011–1027. doi: 10.1016/S0006-3495(94)80882-3. [DOI] [PMC free article] [PubMed] [Google Scholar]
- Colquhoun, D., and F.J. Sigworth. 1983. Fitting and statistical analysis of single-channel records. In Single Channel Recording. B. Sakmann and E. Neher, editors. Plenum Publishing Corp., New York. 191–263.
- Demo SD, Yellen G. The inactivation gate of the Shaker K+channel behaves like an open-channel blocker. Neuron. 1991;7:743–753. doi: 10.1016/0896-6273(91)90277-7. [DOI] [PubMed] [Google Scholar]
- Hoshi T, Zagotta WN, Aldrich RW. Biophysical and molecular mechanisms of Shakerpotassium channel inactivation. Science. 1990;250:533–538. doi: 10.1126/science.2122519. [DOI] [PubMed] [Google Scholar]
- Iverson LE, Tanouye MA, Lester HA, Davidson N, Rudy B. A-type potassium channels expressed from Shaker locus cDNA. Proc Natl Acad Sci USA. 1988;85:5723–5727. doi: 10.1073/pnas.85.15.5723. [DOI] [PMC free article] [PubMed] [Google Scholar]
- Kamb A, Tweng-Drank J, Tanouye MA. Multiple products of the Drosophila Shakergene may contribute to potassium channel diversity. Neuron. 1988;1:421–430. doi: 10.1016/0896-6273(88)90192-4. [DOI] [PubMed] [Google Scholar]
- Kuo CC. Deactivation retards recovery from inactivation in Shaker K+channels. J Neurosci. 1997;17:3436–3444. doi: 10.1523/JNEUROSCI.17-10-03436.1997. [DOI] [PMC free article] [PubMed] [Google Scholar]
- MacKinnon R. Determination of the subunit stoichiometry of a voltage-activated potassium channel. Nature. 1991;350:232–235. doi: 10.1038/350232a0. [DOI] [PubMed] [Google Scholar]
- MacKinnon R, Aldrich RW, Lee AW. Functional stoichiometry of Shaker potassium channel inactivation. Science. 1993;262:757–759. doi: 10.1126/science.7694359. [DOI] [PubMed] [Google Scholar]
- Olcese R, Latorre R, Toro L, Bezanilla F, Stefani E. Correlation between charge movement and ionic current during slow inactivation in Shaker K+channels. J Gen Physiol. 1997;110:579–589. doi: 10.1085/jgp.110.5.579. [DOI] [PMC free article] [PubMed] [Google Scholar]
- Perozo E, MacKinnon R, Bezanilla F, Stefani E. Gating currents from a non-conducting mutant reveal open-closed conformations in Shaker K+channels. Neuron. 1993;11:353–358. doi: 10.1016/0896-6273(93)90190-3. [DOI] [PubMed] [Google Scholar]
- Perozo E, Papazian DM, Stefani E, Bezanilla F. Gating currents in Shaker K+channels. Implications for activation and inactivation models. Biophys J. 1992;62:160–171. doi: 10.1016/S0006-3495(92)81802-7. [DOI] [PMC free article] [PubMed] [Google Scholar]
- Roux MJ, Sigg D, Hurst RS, Bezanilla F, Stefani E. Modeling of ShakerH4Δ6-46 ionic and gating currents. Biophys J. 1995;68:33a. . (Abstr.) [Google Scholar]
- Sigg D, Stefani E, Bezanilla F. Gating current noise produced by elementary transitions in Shakerpotassium channels. Science. 1994;264:578–582. doi: 10.1126/science.8160016. [DOI] [PubMed] [Google Scholar]
- Starkus JG, Rayner MD, Heinemann SH. Anomalous conduction in the “non-conducting” Shaker K+channel mutant W434F. Biophys J. 1997;72:232a.. (Abstr.) [Google Scholar]
- Stefani, E., and F. Bezanilla. 1998. The cut-open oocyte voltage clamp technique. Methods Enzymol. In press. [DOI] [PubMed]
- Stefani E, Toro L, Perozo E, Bezanilla F. Gating of Shaker K+channels: I. Ionic and gating currents. Biophys J. 1994a;66:996–1010. doi: 10.1016/S0006-3495(94)80881-1. [DOI] [PMC free article] [PubMed] [Google Scholar]
- Stefani, E., L. Toro, E. Perozo, and F. Bezanilla. 1994b Gating currents of cloned Shaker K+ channels. In Handbook of Membrane Channels. Academic Press, Inc., Orlando, FL. 29–40.
- Tempel BL, Papazian DM, Schwarz TL, Jan YL, Jan LY. Sequence of a probable potassium channel component encoded at Shaker locus of Drosophila. . Science. 1987;237:770–775. doi: 10.1126/science.2441471. [DOI] [PubMed] [Google Scholar]
- Vandenberg, C.A., and F. Bezanilla. 1991. A sodium channel gating model based on single channel, macroscopic ionic, and gating currents in the squid giant axon. Biophys. J. 60:1511–1533. [DOI] [PMC free article] [PubMed]
- Yang Y, Yan Y, Sigworth FJ. How does the W434F mutation block current in Shaker potassium channels? . J Gen Physiol. 1997;109:779–789. doi: 10.1085/jgp.109.6.779. [DOI] [PMC free article] [PubMed] [Google Scholar]
- Zagotta WN, Aldrich RW. Voltage-dependent gating of Shaker A-type potassium channels in Drosophilamuscle. J Gen Physiol. 1990;95:29–60. doi: 10.1085/jgp.95.1.29. [DOI] [PMC free article] [PubMed] [Google Scholar]
- Zagotta WN, Hoshi T, Aldrich RW. Restoration of inactivation in mutants of Shaker potassium channels by a peptide derived from ShB. Science. 1990;250:568–571. doi: 10.1126/science.2122520. [DOI] [PubMed] [Google Scholar]
- Zagotta WN, Hoshi T, Aldrich RW. Shakerpotassium channel gating. III: Evaluation of kinetics models for activation. J Gen Physiol. 1994;103:321–362. doi: 10.1085/jgp.103.2.321. [DOI] [PMC free article] [PubMed] [Google Scholar]


