

Abstract
We have cloned the squid neuronal Na+–Ca2+ exchanger, NCX-SQ1, expressed it in Xenopus oocytes, and characterized its regulatory and ion transport properties in giant excised membrane patches. The squid exchanger shows 58% identity with the canine Na+–Ca2+ exchanger (NCX1.1). Regions determined to be of functional importance in NCX1 are well conserved. Unique among exchanger sequences to date, NCX-SQ1 has a potential protein kinase C phosphorylation site (threonine 184) between transmembrane segments 3 and 4 and a tyrosine kinase site in the Ca2+ binding region (tyrosine 462). There is a deletion of 47 amino acids in the large intracellular loop of NCX-SQ1 in comparison with NCX1. Similar to NCX1, expression of NCX-SQ1 in Xenopus oocytes induced cytoplasmic Na+-dependent 45Ca2+ uptake; the uptake was inhibited by injection of Ca2+ chelators. In giant excised membrane patches, the NCX-SQ1 outward exchange current showed Na+-dependent inactivation, secondary activation by cytoplasmic Ca2+, and activation by chymotrypsin. The NCX-SQ1 exchange current was strongly stimulated by both ATP and the ATP-thioester, ATPγS, in the presence of F− (0.2 mM) and vanadate (50 μM), and both effects reversed on application of a phosphatidylinositol-4′,5′-bisphosphate antibody. NCX1 current was stimulated by ATP, but not by ATPγS. Like NCX1 current, NCX-SQ1 current was strongly stimulated by phosphatidylinositol-4′,5′-bisphosphate liposomes. In contrast to results in squid axon, NCX-SQ1 was not stimulated by phosphoarginine (5–10 mM). After chymotrypsin treatment, both the outward and inward NCX-SQ1 exchange currents were more strongly voltage dependent than NCX1 currents. Ion concentration jump experiments were performed to estimate the relative electrogenicity of Na+ and Ca2+ transport reactions. Outward current transients associated with Na+ extrusion were much smaller for NCX-SQ1 than NCX1, and inward current transients associated with Ca2+ extrusion were much larger. For NCX-SQ1, charge movements of Ca2+ transport could be defined in voltage jump experiments with a low cytoplasmic Ca2+ (2 μM) in the presence of high extracellular Ca2+ (4 mM). The rates of charge movements showed “U”-shaped dependence on voltage, and the slopes of both charge–voltage and rate–voltage relations (1,600 s−1 at 0 mV) indicated an apparent valency of −0.6 charges for the underlying reaction. Evidently, more negative charge moves into the membrane field in NCX-SQ1 than in NCX1 when ions are occluded into binding sites.
Keywords: sodium–calcium exchange, charge movements, Xenopus oocytes, patch clamp, phosphatidylinositols
introduction
Na+–Ca2+ exchangers mediate large Ca2+ fluxes across the plasma membranes of many cell types and thereby modulate diverse cell functions (for overview, see Hilgemann et al., 1996). Their major physiological role is to extrude Ca2+ in exchange for extracellular Na+, which is subsequently extruded by the ATP-dependent Na+-K+ pump.
Historically, two experimental models were used to characterize Na+–Ca2+ exchange function: cardiac sarcolemmal vesicles (for review, see Philipson and Reeves, 1989) and perfused squid giant axons (for review, see DiPolo, 1989; DiPolo and Beaugé, 1991). Molecular studies of the cardiac Na+–Ca2+ exchanger (NCX1) were made possible by its cloning (Nicoll et al., 1990). This was followed by the cloning and functional characterization of two other mammalian exchangers (NCX2 and NCX3; Li et al., 1994; Nicoll et al., 1996a , 1996b ) and an NCX-type exchanger from Drosophila (Ruknudin et al., 1997; Schwarz and Benzer, 1997). Mutational studies of NCX1 have identified functional domains involved in both regulation and transport (Matsuoka et al., 1993, 1995, 1997; Levitsky et al., 1994; Nicoll et al., 1996a ). Given the extensive nature of Na+–Ca2+ exchange studies in squid giant axons, cloning and molecular characterization of the squid exchanger could provide many unique insights.
Basic properties of the cardiac and squid exchangers are clearly similar. These include a 3 Na+ to 1 Ca2+ stoichiometry, regulatory activation of exchanger-mediated Ca2+ influx by cytoplasmic Ca2+ (DiPolo, 1979; Kimura et al., 1986), and stimulation by ATP-dependent mechanisms (DiPolo, 1974; Baker and McNaughton, 1976; Hilgemann, 1990). Nevertheless, recent results suggest that there are important differences in the function and regulation of the different exchangers. (a) The ATP dependence of the squid exchanger appears to reflect its phosphorylation by a protein kinase (DiPolo and Beaugé, 1994; DiPolo et al., 1997), while the ATP-dependent activation of the cardiac exchanger appears to reflect the generation of phosphatidylinositol 4′-,5′-bisphosphate (PIP2)1 from phosphatidylinositol (Hilgemann and Ball, 1997). ATPγS activates the squid exchanger but not the cardiac exchanger. Cationic agents that bind anionic lipids inhibit the cardiac exchanger (Hilgemann and Collins, 1992), but agents such as pentalysine do not inhibit the squid exchanger (R. DiPolo and L. Beaugé, 1993). (b) The squid exchanger is regulated by a phosphoarginine-dependent process that may involve protein kinases unique to invertebrates (DiPolo and Beaugé, 1995); phosphoarginine is without effect on the cardiac exchanger (D.W. Hilgemann, unpublished observations). (c) The Ca2+–Ca2+ exchange operation of the squid exchanger (DiPolo et al., 1985; DiPolo and Beaugé, 1990) and of barnacle muscle (Rasgado-Flores et al., 1996) appears to be strongly voltage dependent, while Na+–Na+ exchange shows almost no voltage dependence in isotope flux studies. For the cardiac exchanger, on the other hand, Na+ transport has been shown to be strongly electrogenic (Hilgemann et al., 1991; Matsuoka and Hilgemann, 1992; Powell et al., 1993), while Ca2+–Ca2+ exchange is only weakly voltage dependent (Hilgemann et al., 1991; Matsuoka and Hilgemann, 1992; Powell et al., 1993; Niggli and Lederer, 1991; Kappl and Hartung, 1996).
To better compare the function and structure of the exchangers, we have now cloned the squid neuronal Na+–Ca2+ exchanger, successfully expressed it in Xenopus oocytes, and studied its function in giant membrane patches. We describe here functional similarities and differences of the two exchangers, which should facilitate the development of structure/function models and the elucidation of exchanger regulatory mechanisms.
materials and methods
The squid optic lobe cDNA library was kindly provided by Dr. F. Bezanilla (UCLA) and the stellate ganglion cDNA library and squid tissues were a gift from Drs. W. Gilly and J. Rosenthal (Stanford University, Stanford, CA). Vesicles from squid optical lobe were obtained from Dr. L. Beaugé (Cordoba, Argentina).
Cloning Procedures
PCR with degenerate primers was used to amplify a fragment of NCX-SQ1 from squid optic lobe cDNA. Primers were synthesized and reverse-phase purified by Retrogen (San Diego, CA). The primer pairs were designed from conserved amino acid sequences of putative transmembrane segments 6 and 9 of NCX1 and NCX2. The forward primer was a 29-mer with 32-fold degeneracy (5′-TTAAGAATTCTGGAA(A/G)GT(C/T) CT(C/G) TT (C/T) GC(A/C)T-3′) and the reverse primer was a 33-mer with 64-fold degeneracy (5′-TTAAGAATTCCCAG(A/G)AA(C/G)AC(A/G)TT (C/G)AC(A/C)GC(A/G) TTG-3′). The PCR reaction was carried out for 30 cycles (94°C, 30 s; 42°C, 60 s; 72°C, 120 s). The PCR product was cloned into the pCRII vector using the TA Cloning Kit (Invitrogen Corp., San Diego, CA). Two identical clones were identified as squid exchanger based on their sequence similarity to NCX1 and NCX2 and were used as probes to screen a squid optic lobe λZAPII cDNA library. A partial clone of 1.5 kb was isolated with a nucleotide sequence ∼60% identical to the 3′ end of NCX1, but no clones extending further into the missing 5′ end sequence were isolated. An EcoRI fragment (0.5 kb) from the 5′ end of the 1.5-kb clone was then used to screen a squid stellate ganglion λZAPII cDNA library. Two clones (SG12 and SG14), each containing the complete coding sequence of the squid exchanger, were isolated.
Expression of NCX-SQ1 in Xenopus Oocytes
Initially, expression level of SG12 was relatively low in Xenopus oocytes. Therefore, we used the same strategy that improved expression of NCX1 by replacing the 3′ untranslated region of SG12 with that of the Na+-glucose cotransporter clone, which possesses a poly(A)+ tail (Matsuoka et al., 1993). Expression of NCX-SQ1 was improved only moderately after modification. Expression was optimized when SG12 was subcloned from pBluescript SK+ into the pBST4 vector (provided by Dr. Bezanilla's laboratory) at the BglII site. The vector contains the 5′ and 3′ untranslated regions of Xenopus β globin, which flank the NCX-SQ1 coding region in the final construct. The pBluescript SK+ or pBST4 vector containing the NCX-SQ1 full-length cDNA was linearized with XhoI or SacII, and cRNA was synthesized using the T3 or T7 mMessage mMachine Kit (Ambion Inc., Austin, TX), respectively. Unincorporated nucleotides were removed with Chromaspin-100 columns (Clontech, Palo Alto, CA). Oocytes were prepared as described by Longoni et al. (1988). Oocytes were injected with 46 nl of cRNA or water, and exchange activity was measured 4 d after injection as Na+ gradient-dependent 45Ca2+ uptake (Longoni et al., 1988; Nicoll et al., 1990) or as exchange current across giant excised patches (see below).
Northern Blot Analysis
Total RNA from squid optic lobe and stellate ganglion were prepared using the protocol of Chomczynski and Sacchi (1987) as modified by Quednau et al. (1997). Poly (A)+ RNA was isolated from 100 μg of total RNA using the Poly (A)Tract mRNA Isolation System (Promega Corp., Madison, WI). 1 μg poly (A)+ RNA from each tissue was fractionated on a 1% agarose/6% formaldehyde gel, transferred to Hybond-N membrane (Amersham Corp., Arlington Heights, IL), hybridized with an antisense probe (see below), and washed as described previously (Nicoll et al., 1996). Final washing was at 0.2× SSC at 42°C.
A 32P-labeled antisense probe was generated by asymmetric PCR as described by Sturzl and Roth (1990). A plasmid containing the ApaI to SacI cDNA fragment of NCX-SQ1 (nucleotides [nts] 1987–2592) was linearized by ApaI restriction enzyme digestion downstream from the primer annealing site. Phenol-purified template (200 ng) was used together with 200 pmol primer in a 100-μl reaction mix containing 50 μCi of [α-32P]dCTP, 5 U Taq DNA Polymerase (GIBCO BRL, Gaithersburg, MD). The primer for PCR was a 20-mer (5′-ATACGCACTT CCACTTCACC-3′; nts 2574–2554). PCR was carried out for 35 cycles (94°C, 45 s; 55°C, 1 min; 72°C, 2 min). Unincorporated nucleotides were removed by two consecutive steps of ammonium acetate precipitation.
Preparation of NCX-SQ1 Fusion Protein and Antibody Production
An expression construct containing the cDNA coding for the large intracellular loop of NCX-SQ1 was constructed by PCR. The 5′ end of the forward primer (5′-AAGCATGCGGTGTGATTGTCCAATGT-3′; nts 1767–1785) included an introduced SphI restriction site and the reverse primer (5′-TTCTGCAGAATGGCCTCAATAAACTG-3′; nts 3007–2989) contained an introduced PstI restriction site at the 3′ end. pBluescript SK+ vector containing the NCX-SQ1 full-length cDNA (10 ng) was amplified using 0.2 mM each of dATP, dCTP, dGTP, and dTTP, 1 mM MgCl2, 5% DMSO, 50 pmol of forward and reverse primer, and 2.5 U of Taq DNA polymerase to produce a 1,240-bp fragment (nts 1767– 3007; amino acids 259–665). PCR was carried out over 35 cycles (94°C, 30 s; 55°C, 1 min; 72°C, 2 min). The PCR product was cloned into the pCR II vector using the TA Cloning Kit, and the identity of the clone was confirmed by sequencing. The PCR construct was digested with SphI and PstI and the resulting fragment cloned into the expression vector pQE (QIAGEN Inc., Chatsworth, CA). The loop fusion protein was expressed and purified as described by He et al. (1997) and used as antigen for generation of polyclonal antisera in rabbits (HRP Inc.; Denver, PA).
Western Blot
Samples from oocytes expressing NCX-SQ1 protein were prepared as follows: 10 oocytes were sonicated in 100 μl of homogenization buffer (0.1 M NaCl, 1% Triton X-100, 20 mM Tris-HCl, pH 7.6) and centrifuged at 12,000 rpm for 10 min. The supernatant was filtered twice through Spin-X filters to remove lipids and yolk protein. Supernatant (5 μl) or squid optic lobe vesicles (20 μg total protein) were electrophoresed on a 7% SDS-polyacrylamide gel. Proteins were transferred onto nitrocellulose membrane and the filter was blocked with 5% (wt/vol) milk in MTBST buffer (140 mM NaCl, 20 mM MOPS/Tris, pH 7.4, 0.05% TWEEN 20). The membrane was incubated with the antiserum raised against the loop fusion protein of NCX-SQ1 or preimmune serum at a dilution of 1:5,000, followed by incubation with goat anti–rabbit IgG conjugated with horseradish peroxidase (1:3,000; Bio-Rad Laboratories, Richmond, CA) in MTBST. The antigen–antibody complexes on the membrane were visualized using 3,3′-diaminobenzidine.
Electrophysiological Analyses: Endogenous Oocyte Conductances
Na+–Ca2+ exchange currents were isolated and studied in giant excised membrane patches from Xenopus oocytes, as described previously, using solutions that minimize endogenous currents in the oocyte membrane (Matsuoka et al., 1993, 1995). The extracellular solution contained 4 mM Ca-sulfamic acid, 1 mM Mg- sulfamic acid, 40 mM Na-2-(morpholino)ethanesulfonic acid (MES), 20 mM Cs-MES, 20 mM tetraethyl ammonium (TEA)- MES, 40 mM N-methyl-d-glucamine (NMG)-MES, and 20 mM HEPES, adjusted to pH 7.0 with NMG. The cytoplasmic solution contained (mM): 10 EGTA, 6 Ca-sulfamic acid, 0.5 Mg-sulfamic acid, 60 Cs-MES, 20 TEA-MES, and either 40 additional Cs-MES or 40 Na-MES to activate outward exchange current, at pH 7.0 with NMG (pCa 6.5). Gigaohm seals were made in a solution containing (mM): 80 K+-aspartate, 40 KCl, 4 MgCl2, 5 EGTA, and 10 HEPES, at pH 7.0 with NMG. Experiments were performed at 32°C. Concentrated stock solutions of nucleotides were prepared as Mg2+/TRIS salts, with the Mg2+ concentration adjusted to 75% of the total nucleotide concentration. In this way, the free Mg2+ concentration (0.3 mM) is not changed on addition of nucleotide. Free Ca2+ and Mg2+ concentrations were calculated with the binding constants given by Fabiato (1988), and for ANP-PNP (adenosine 5′-(β,γ-imido)triphosphate) we assumed the same Mg binding constant as for ATP. Unless indicated otherwise, the membrane potential was 0 mV. PIP2 liposomes were prepared by sonicating 1 mM PIP2 (Boehringer Mannheim, Mannheim, Germany) in distilled water. Reconstituted monoclonal PIP2 antibody (PerSeptive Biosystems, Framingham, MA) was diluted 40-fold into the experimental solution.
Endogenous conductances of the oocyte membrane were found to be activated by ATP and anionic lipids, so more extensive control experiments were needed to test for the influence of contaminating currents. Most importantly, we established conditions such that current changes in patches from uninjected (or water-injected) oocytes amounted to at most a few picoamperes using the same conditions and protocols employed in results (i.e., at 0 mV).
Since our efforts to understand and minimize endogenous conductances are relevant to many expression studies with Xenopus oocytes, we describe here the two major oocyte currents activated by ATP and PIP2; Ca2+-activated Cl− and voltage-activated Na+ currents. Activation of Ca2+-activated Cl− current by ATP (Hilgemann, 1997) and anionic lipids in oocyte patches (Hilgemann, 1995) has been described previously. As shown in Fig. 1, Ca2+-activated Cl− current is stimulated by many polyvalent anions (0.1–2 mM) and by F− when cytoplasmic free Ca2+ is submaximal. Fig. 1 A shows results for phosphate. Activation by polyvalent anions typically takes ∼1 min, but the effect decays on removal of anions in only a few seconds. Possibly, these effects reflect chelation of trace polyvalent cations in solutions (or from the pipette) by these anions (Hilgemann, 1997). Since the pipette tip can become contaminated with Cl− during seal formation, there is a danger that outward Cl− current can occur during exchange current measurements. Inclusion of Cl− current blockers in the pipette solution (0.3 mM niflumic acid + 0.3 mM flufenamic acid) effectively blocked the residual Cl− currents, while results with PIP2 and nucleotides in exchanger-expressing patches were not changed.
Figure 1.

Stimulation of Ca2+-activated Cl− current by polyvalent anions in an oocyte membrane patch. The pipette contains 80 mM and the cytoplasmic solution contains 10 mM Cl− with NMG as the predominant cation. The free Ca2+ is buffered with 10 mM EGTA and membrane potential is 0 mV. (A) Application of a solution with 1 μM free Ca2+ activates outward Cl− current, and additional application of 4 mM potassium phosphate (with 3 mM Mg2+, pH 7.0) enhances current by approximately fourfold over 1 min. The stimulatory effect reverses in just a few seconds on removal of phosphate. (B) Normalized stimulatory effects of other anions in the same protocol. “Basal” current corresponds to the current activated with 1 mM free Ca2+. From left to right, results are shown for 2 mM Mg-ATP, 2 mM Mg-AMPPNP, 2 mM ATP in the absence of Mg2+ from all solutions, 2 mM Mg-GTP, 1 mM Mg-GTPγS, 0.5 mM pyrophosphate (PP) in the absence of Mg2+ from all solutions, 4 mM p-nitrophenylphosphate (PnPP), 4 mM Mg-phosphoarginine (P-Arg), 4 mM F− in the absence of Mg2+ from all solutions, and 2 mM EDTA in the absence of Mg2+ from all solutions.
As shown in Fig. 2 A, a Na+ current can be activated in oocyte patches by depolarization for a few seconds beyond 0 mV. As described in previous two-electrode voltage clamp studies (Baud and Kado, 1984), this current activates and deactivates rapidly in response to voltage steps after it has first been primed by a long depolarization. Fig. 2 B shows the steady state current–voltage relation of an oocyte patch with symmetrical Na+-containing solutions (40 mM). We stress that the Na+ conductance was always negligible at potentials more negative than ∼−20 mV. In the absence of ATP and PIP2, the magnitude of the Na+ conductance was variable and depended on the oocyte batch. Na+ conductance could be induced in the majority of patches by ATP or anionic lipids. Fig. 2 C shows the activation by ATP, reversal after ATP removal, and suppression by 40 mM aluminum in the presence of 10 mM EGTA (50 ms cumulative voltage pulses). To avoid contamination of exchange currents with Na+ current, we made our recordings with 40 mM Na+ on both sides at 0 mV (i.e., at the reversal potential of the Na+ current). Also, we monitored current–voltage relations using 2-ms voltage steps and verified that the current activated by ATP and PIP2 remained outward in direction at potentials as negative as −70 mV with 40 mM extracellular and cytoplasmic Na+ concentrations. Thus, the underlying mechanism could not involve Na+ channels.
Figure 2.

Voltage-activated Na+ current in giant oocyte membrane patches. The pipette and the cytoplasmic solutions contain 40 mM Na+. (A) Depolarization from −40 to +40 mV activates an outward current over the course of 10 s, and the current deactivates without generating a significant tail current with signal filtering at 20 Hz. (B) Steady state current–voltage relation illustrating the steep voltage dependence of current activation. (C) Current–voltage relations under the same conditions, using 50-ms voltage steps as described in the text. After application of ATP (+ATP), the current is roughly doubled, runs down to less than control (after removal of ATP), and can be inhibited further with 20 μM Al3+ in the presence of 10 mM EGTA. The cytoplasmic solutions contained 0.1 mM F− and 50 μM vanadate.
results
Cloning the cDNA Coding for the Squid Na+–Ca2+ Exchanger
A fragment of the squid exchanger cDNA was obtained by PCR amplification of cDNA derived from a squid optic lobe library. Degenerate primers were designed based on conserved amino acid sequences of proposed transmembrane segments 6 and 9 of the mammalian exchangers NCX1 and NCX2. An appropriately sized PCR product (∼320 bp) was subcloned. Sequence analysis indicated that the DNA coded for a protein homologous to NCX1. The PCR product was used to screen a squid optic lobe library and a partial clone of 1.5 kb was isolated with ∼60% identity to NCX1 at the amino acid level. Longer clones were not found in the optic lobe library. A fragment of the partial 1.5-kb clone was then used to screen a squid stellate ganglion cDNA library. Two clones containing the complete coding sequence of the squid exchanger were isolated. These clones were identical at the 3′ end. The complete nucleotide and amino acid sequences of the longest clone, SG14, are shown in Fig. 3. SG14 is 4,096 bp long with an open reading frame of 2,676 nucleotides encoding for a protein of 892 amino acids, which we refer to as NCX-SQ1. The most 5′ ATG, in the proper reading frame, begins at nucleotide 994 with some features of a Kozak (1989) consensus initiation site. The 3′ end of the cDNA terminates with 16 adenosines preceded by multiple consensus polyadenylation sites.
Figure 3.

Nucleotide and deduced amino acid sequences of the squid Na+–Ca2+ exchanger clone, NCX-SQ1. Sequences have been submitted to GenBank under accession number U93214.
The amino acid sequence of the squid stellate ganglion Na+–Ca2+ exchanger, aligned with the sequence of the canine cardiac Na+–Ca2+ exchanger (NCX1.1 in the terminology of Quednau et al., 1997) is shown in Fig. 4. Like NCX1, NCX-SQ1 has 12 hydrophobic segments that could form transmembrane segments. In NCX1, the first hydrophobic segment at the NH2 terminus is a cleaved leader peptide and is removed from the protein during biosynthesis in the endoplasmic reticulum (Durkin et al., 1991; Hryshko et al., 1993). NCX-SQ1 has a potential signal peptidase-recognition site (Von Heijne, 1983) after alanine 26, and we predict that a signal peptide is removed from this protein as well. Thus, the mature protein is modeled to have 11 transmembrane segments with a large intracellular loop separating transmembrane segments 5 and 6. The NH2 terminus would be extracellular and the COOH terminus would be intracellular. NCX-SQ1 has nine potential sites for N-linked glycosylation. If the glycosylation pattern is similar to that of NCX1 (Hryshko et al., 1993), only the first site (asparagine 31) would be glycosylated. Overall, the mature NCX-SQ1 and NCX1 proteins are 58% identical, ignoring the gap in NCX-SQ1 in the intracellular loop region. More sequence analysis will be presented below.
Figure 4.
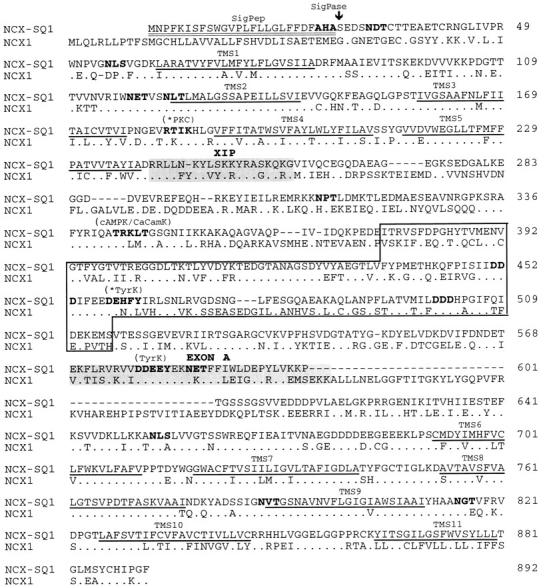
Amino acid comparison of the squid NCX-SQ1 and the canine NCX1 exchanger. Putative transmembrane segments, predicted by hydropathy analysis, are underlined and numbered. Highlighted in bold lettering are a potential signal peptidase site (SigPase), potential N-linked glycosylation sites (NXS/T), and potential phosphorylation sites (RTIK, protein kinase C; TRKLT, cAMP-dependent kinase and Ca2+/calmodulin-dependent kinase; DEHFY and DDEEEY, tyrosine kinase). The two potential phosphorylation sites marked with an asterisk are unique to NCX-SQ1. The endogenous exchanger inhibitory peptide (XIP) region and Exon A are shaded, and the binding domain for regulatory Ca2+ is boxed. The triple aspartate motifs involved in Ca2+ binding are in bold. Dots in the NCX1 sequence indicate amino acids identical to those of NCX-SQ1.
The transcript size of NCX-SQ1 was determined by Northern blot analysis. Poly (A)+ RNA from squid optical lobe and stellate ganglion hybridized with an NCX-SQ1 probe at 9.6 kb (Fig. 5 A). The signal was substantially stronger in stellate ganglion than in optical lobe. The NCX-SQ1 mRNA is larger than that for NCX1 (7 kb), NCX2 (5 kb), or NCX3 (6 kb) (Nicoll et al., 1996). The NCX-SQ1 transcript apparently has a long 5′ untranslated region since the clone ends with a poly (A)+ tail. Extensive untranslated regions also occur for the squid Na+ channel that has a transcript >12 kb (Rosenthal et al., 1993), which is larger than that of the mammalian Na+ channels.
Figure 5.

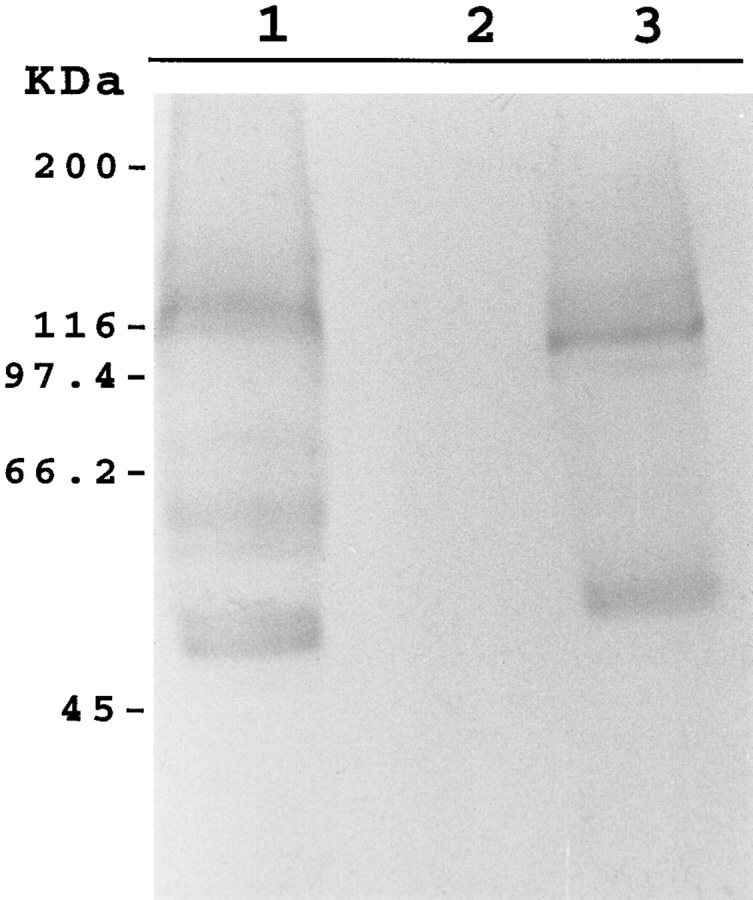
(left) Northern blot analysis of NCX-SQ1 RNA. mRNA (1 μg) from squid optical lobe (lane 1) and stellate ganglia (lane 2) was probed with a fragment of the NCX-SQ1 cDNA. (right) Western blot analysis of NCX-SQ1 protein. Protein from squid optical lobe vesicles (lane 1) and oocytes injected with water (lane 2) or cRNA for NCX-SQ1 (lane 3) was probed with an antibody raised against a histidine-tagged fusion protein fragment of NCX-SQ1.
A His-tagged fusion protein encompassing amino acids 259–665 of NCX-SQ1 was expressed in Escherichia coli. After affinity purification, the fusion protein was used for polyclonal antibody production in rabbit. Expression of NCX-SQ1 in membrane vesicles from squid optic lobe was detected by immunoblot (Fig. 5 B, lane 1). The antibody recognizes a major band at ∼120 kD and two bands at lower molecular weights. NCX1 produces a similar pattern on immunoblots (Nicoll et al., 1990). Preimmune serum from the same rabbit failed to produce any signal (not shown). Expression of exchanger protein in Xenopus oocytes injected with NCX-SQ1 cRNA was also examined. A protein band of ∼100 kD was detected in a membrane fraction from cRNA- injected oocytes, whereas no signal was detected in control water-injected oocytes (Fig. 5 B, lanes 2 and 3). The small difference in apparent molecular weight between the native squid exchanger and NCX-SQ1 expressed in oocytes is possibly due to a difference in glycosylation.
Functional Expression of NCX-SQ1 in Xenopus Oocytes
cRNA encoding NCX-SQ1 was synthesized from linearized plasmids and injected into Xenopus oocytes. Expression was optimized when the 5′- and 3′-untranslated regions of Xenopus β globin flanked the NCX-SQ1 coding region. Expression of Na+–Ca2+ exchange activity was assessed by measuring 45Ca2+ fluxes into intact oocytes and by measuring exchanger currents using the giant excised patch technique. An example of Na+ gradient-dependent 45Ca2+ uptake into Na+-loaded Xenopus oocytes is shown in Fig. 6. The first columns show that NCX-SQ1 RNA induces a substantial uptake of 45Ca2+ in the presence of an outwardly directed Na+ gradient (K+ 0). This uptake is abolished in the absence of the Na+ gradient (Na+ 0). We have validated the use of this approach to measure Na+–Ca2+ exchange activity in previous studies (Longoni et al., 1988; Nicoll et al., 1990). No Ca2+ uptake was observed in control water- injected oocytes.
Figure 6.

Functional expression of NCX-SQ1 in Xenopus oocytes. Oocytes injected with cRNA for NCX-SQ1 (A) or control (C), water-injected oocytes were assayed for Na+–Ca2+ exchanger activity. 45Ca2+ uptake into Na+ (90 mM)-loaded oocytes was measured in cells diluted into 45Ca2+-containing medium in the presence (extracellular K+) or absence of an outwardly directed Na+ gradient (extracellular Na+). In the middle pair of columns (B), 46 nl of a 100 mM EGTA solution was injected into the oocytes before loading the cells with Na+ to deplete intracellular Ca2+.
We used the 45Ca2+ uptake assay to determine whether NCX-SQ1 exhibited secondary Ca2+ regulation by intracellular Ca2+. The presence of micromolar levels of [Ca2+]i is required in squid giant axons to activate Na+ i-dependent Ca2+ uptake (Baker and McNaughton, 1976; DiPolo and Beaugé, 1986). Oocytes expressing NCX1-SQ1 were injected with EGTA before the Ca2+ uptake assay. Chelation of internal Ca2+ blocked most Ca2+ uptake (Fig. 6), which is consistent with previous studies of squid axons and NCX1 (Baker and McNaughton, 1976; DiPolo and Beaugé, 1986; Kimura et al., 1986; Hilgemann et al., 1992a , 1992b).
Outward Exchange Current of the Squid (NCX-SQ1) Na+–Ca2+ Exchanger
Fig. 7 shows basic properties of outward Na+–Ca2+ exchange current in patches from oocytes expressing the NCX-SQ1 exchanger. In brief, no obvious property of the current is different from NCX1 exchange current. On application of cytoplasmic Na+, the current activates in the solution switch time and then shows partial inactivation over several seconds (see Fig. 7, first record, in the presence of 1 μM cytoplasmic free Ca2+). When cytoplasmic Ca2+ is removed, the current magnitude decreases, and inactivation on application of Na+ is subsequently faster. Exchange current remains substantial (second record). With 5 μM free cytoplasmic Ca2+ (third record), or higher concentrations (not shown), the current did not increase further and ran down with time. Current run-down prevented us from determining Ca2+–current relations in more detail. Application of α-chymotrypsin (1 mg/ml) activated the exchange current over 1 min. The final current magnitude was typically more than twice the peak current magnitude obtained on applying Na+. After chymotrypsin, the exchange current was insensitive to changes of cytoplasmic free Ca2+ from 0 to 5 μM.
Figure 7.

Outward Na+–Ca2+ exchange current of NCX-SQ1 in an excised oocyte membrane patch. Cytoplasmic solution with Na+ (40 mM) was applied and removed as indicated, first with 1.0 μM free cytoplasmic Ca2+, then with no cytoplasmic Ca2+, and finally with 5 μM free cytoplasmic Ca2+. The outward current, activated by application of Na+, inactivates partially over 10–50 s. The current is reduced by ∼50% in Ca2+-free solution. In the final sequence, α-chymotrypsin (1 mg/ml) was applied in the absence of cytoplasmic Ca2+. After complete activation by chymotrypsin, the current is insensitive to changes of cytoplasmic free Ca2+ in the micromolar range, and inactivation is abolished.
Stimulation of NCX1 Exchange Current by ATP and Reversal of Stimulation by Anti–PIP2 Antibody
ATP strongly activates exchange current in excised cardiac membrane patches and vanadate is without effect on the stimulatory effect or its reversal after removal of ATP (Collins et al., 1992). However, in our initial studies of the cardiac exchanger (NCX1) in oocyte patches, no effects of ATP were observed (Matsuoka et al., 1993). We now report that ATP indeed can be effective when the phosphatase inhibitors, F− and vanadate, are included in the cytoplasmic solution. The concentrations of F−and vanadate are selected to maintain free Mg2+ in the range of 0.1–0.3 mM, and vanadate alone was usually effective. Fig. 8 describes typical results with 0.1 mM F− and 50 μM vanadate (0.5 mM total Mg2+ in nucleotide-free solution). The outward current activated by Na+ shows the usual inactivation when 40 mM cytoplasmic Na+ is applied. As shown in Fig. 8 A, 2 mM of the nonhydrolyzable ATP analogue, AMP-PNP, was without effect, while 2 mM ATP increased the current to a magnitude somewhat greater than the peak current on initial application of Na+. On removal of ATP, the current returned partially toward baseline over 2 min. The thio-analogue of ATP, ATPγS (2 mM), typically had no effect, or only a small stimulatory effect (Fig. 8 B). After removal of ATPγS, application of ATP stimulated the exchange current, as usual. As mentioned in the introduction, the stimulatory effect of ATP in cardiac membrane appears to reflect the generation of PIP2 from phosphatidylinositol. PIP2 also activates some potassium channels (Hilgemann and Ball, 1997) and, with inward rectifier potassium channels, application of an antibody to PIP2 reverses the ATP effects within 1 min (Huang et al., 1998). As shown in the latter part of the record in Fig. 8 B, the same antibody to PIP2 (AB) reverses the stimulatory effect of ATP on the NCX1 exchanger; the antibody was without effect when exchange currents were stimulated by other anionic lipids (e.g., cardiolipin).
Figure 8.

Stimulation of NCX1 outward exchange current in an oocyte patch by Mg-ATP. Cytoplasmic Na+-containing solution (40 mM) was applied and removed as indicated in the presence of 0.5 μM free cytoplasmic Ca2+. The solutions contain 0.2 mM F− and 50 μM vanadate. (A) Application of 2 mM Mg-AMP-PNP is without effect, whereas 2 mM Mg-ATP stimulates the current to a magnitude somewhat greater than the initial peak current on application of cytoplasmic Na+. The stimulatory effect reverses partially over 2 min. (B) Application of 2 mM Mg-ATPγS has only a small stimulatory effect compared with 2 mM Mg-ATP, applied subsequently. The stimulatory effect reverses by ∼20% over 2 min, and it reverses almost completely in 1 min on application of PIP2 antibody (AB).
Stimulation of Squid (NCX-SQ1) Na+–Ca2+ Exchange by ATP and Its Reversal by Anti–PIP2 Antibody
Fig. 9 shows typical effects of ATP on the outward NCX-SQ1 exchange currents. In Fig. 9 A, the current was first activated by cytoplasmic Na+, and it then inactivated by ∼85%. With application of 2 mM ATP, the current increased to a magnitude higher than the peak current on initial application of Na+. Notably, this result was often obtained in the absence of F− and vanadate; stimulation by ATP was observed only rarely with NCX1 in this condition. After removal of ATP, the current declines about half-way toward baseline over 1 min before it declines more slowly. After allowing current to return nearly to the control level (not shown), Na+ was removed and reapplied in the presence of 0.2 mM F− and 50 μM vanadate. The current increased to the same extent as previously upon addition of ATP, but on removal of ATP the current remained stable; presumably, the maximal currents in these records reflect a “ceiling” for simulatory effects. Reversal rates are ∼10× slower than without the phosphatase inhibitors. Fig. 9 B demonstrates that the PIP2 antibody is also effective in reversing the stimulatory effects of ATP on the squid exchanger. F− and vanadate are present throughout the experiment. After application of the antibody, current returned nearly to baseline in ∼2 min in the presence of antibody.
Figure 9.

Stimulation of NCX-SQ1 outward exchange current in oocyte patches by Mg-ATP. Cytoplasmic solution with Na+ (40 mM) was applied and removed as indicated in the presence of 0.5 μM free cytoplasmic Ca2+. (A) Stabilization of stimulatory effect of ATP by F− and vanadate. First, ATP was applied and removed in the absence of F− and vanadate; the stimulatory effect of 2 mM Mg-ATP decays by ∼60% over 1 min after removal of ATP. Next, ATP was applied and removed in the presence of F− and vanadate; after removal of ATP, the stimulatory effect is nearly stable for >1 min. (B) Reversal of the ATP effect by PIP2 antibody (PIP2-AB) in the presence of F− and vanadate. Exchange current was activated by applying Na+, Mg-ATP was applied for 1 min, ATP was removed for 1 min, and finally PIP2-AB was applied. The stimulatory effect of ATP is stable after removal of ATP, but decays by ∼80% 90 s after application of antibody.
Stimulation of the Squid (NCX-SQ1) Na+–Ca2+ Exchange Current by ATPγS and Its Reversal by PIP2 Antibody
The NCX-SQ1 Na+–Ca2+ exchange current, in contrast to NCX1 current, was usually strongly stimulated by applying ATPγS (four of six results). Typical results are shown in Fig. 10. In the presence of F− and vanadate, application of a nonhydrolyzable ATP derivative, AMP-PNP (2 mM) was nearly without effect (Fig. 10 A); the small inhibition of exchange current may be due to a small increase of free Mg2+. Thereafter, application of 2 mM ATPγS stimulates the exchange current roughly to the extent observed with ATP in NCX-SQ1-expressing patches. The stimulatory effect reverses within a few minutes on removal of the ATPγS. As shown in Fig. 10 B, PIP2 antibody can reverse the effect of ATPγS over the course of 90 s, suggesting a possible involvement of PIP2 in the effects of ATPγS as well as those of ATP.
Figure 10.

Stimulation of outward NCX-SQ1 Na+–Ca2+ exchange current by Mg-ATP-γ-S. (A) After activation of exchange current by applying Na+-containing solution, 2 mM Mg-AMP-PNP was applied for 1 min, resulting in no stimulatory effect. Then, 2 mM Mg-ATP-γ-S was applied, resulting in stimulation of the exchange current to above the initial peak obtained on applying Na+. The effect reversed on removal of nucleotide over ∼3 min. (B) After activating exchange current by applying 40 mM Na+-containing solution, the current was stimulated by applying 2 mM Mg-ATP-γ-S. On removal of the nucleotide, current is stable for 30 s. The stimulatory effect reverses in ∼1 min on application of PIP2 antibody (AB).
Stimulation of the Squid (NCX-SQ1) Na+–Ca2+ Exchange Current by PIP2
Fig. 11 A shows the typical stimulatory effect of PIP2 liposomes on NCX-SQ1 exchange current. Exchange current was activated by application of cytoplasmic Na+, and it was allowed to run-down for 3 min to a very small magnitude. Then, 50 μM PIP2 was applied and current increased over several minutes, comparable to the effect of chymotrypsin (see Fig. 7). To check for conflicting ionic currents, current–voltage relations were acquired at several times. The records 1, 2, and 3, indicated in Fig. 1 A, were subtracted so as to define the current activated by PIP2 (±PIP2; Fig. 11 B, 2-1) and the current switched off by removing Na+ at the end of the recording period (±Na+; Fig. 11 B, 2-3). The two current–voltage relations are very similar, indicating that PIP2-activated outward current is also activated by cytoplasmic Na+, and the shapes of current–voltage relations are typical for outward exchange current. We note also that similar results were obtained in patches from HEK cells in which NCX-SQ1 was expressed by transient transfection, although the maximum exchange currents were only ∼15 pA (not shown).
Figure 11.

Stimulation of outward NCX-SQ1 Na+–Ca2+ exchange current by PIP2. (A) Current was activated by cytoplasmic Na+ and was then allowed to run down to <5 pA. PIP2 was applied and the outward current increased over 5 min to a magnitude more than twofold greater than the peak current on application of Na+. Current–voltage relations were taken just after application of PIP2 (1), after the maximum stimulatory effect was obtained (2), and after exchange current was turned off by removing cytoplasmic Na+ (3). (B) Current–voltage relation of the exchange current. The exchange current is defined by subtracting records before PIP2 application from those with PIP2 (2-1, •) and those after removing Na+ from those with Na+ plus PIP2 (2-3, ○). (C) Comparison of current transients obtained on activating exchange current before (control) and after (+PIP2) applying PIP2. The time constant (t) of inactivation increases from 3.9 to 8.2 s. Results are from a different patch.
Fig. 11 C shows the inactivation time courses observed on application of cytoplasmic Na+, before and after applying PIP2 in another NCX-SQ1-expressing patch. Single exponential functions were fitted to the inactivation phases, and they are plotted as dotted lines. The time constant of inactivation increases from 3.9 s in control records to 8.2 s after application of PIP2. This is similar to the slowing of inactivation observed with cardiac exchange current when ATP is applied (Hilgemann et al., 1992b ), indicating that similar molecular mechanisms might be involved.
Lack of Effect of Phosphoarginine on Outward Squid (NCX-SQ1) Na+–Ca2+ Exchange Current in Oocyte Patches
As noted in the introduction, the high-energy compound phosphoarginine stimulates the Na+–Ca2+ exchange process in squid axons, probably by a mechanism that involves phosphorylation (DiPolo and Beaugé, 1995). As shown in Fig. 12, phosphoarginine (5 mM) was without effect on the outward exchange current in oocyte patches (four observations, applying phosphoarginine with Mg2+). In the same patch, 50 μM PIP2 was highly effective. As with all nucleotides, other phosphates, and citrate, large stimulatory effects were observed in patches when phosphoarginine was applied without added Mg2+ (not shown). The probable explanation for our results in patches is that all of these anions chelate Mg2+ and thereby relieve an inhibition of exchange current by cytoplasmic Mg2+.
Figure 12.

Lack of effect of phosphoarginine (p-ARG) on NCX-SQ1 exchange current in an excised oocyte patch. After activation of the exchange current by applying Na+-containing solution, 5 mM phosphoarginine was applied with 3 mM Mg2+ (pH 7.0). There is no stimulatory effect, whereas application of 50 μM PIP2 strongly stimulates the exchange current to a magnitude more than twofold greater than the peak obtained on applying Na+ initially.
Voltage Dependence of Chymotrypsin-deregulated Outward NCX-SQ1 Exchange Currents
To compare the voltage dependencies of NCX-SQ1 exchange current with those of cardiac exchange current, we examined both the outward and inward exchange currents under “zero trans” conditions (i.e., with Na+ and no Ca2+ on one membrane side, and Ca2+ but no Na+ on the other side). This was carried out in chymotrypsin-treated patches, so that regulatory mechanisms were absent. We allowed chloride and sodium currents to “run down” for a few minutes in Mg2+-containing solution before application of α-chymotrypsin (1 mg/ml for 30 s). Current changes were negligible in patches from uninjected oocytes, using the same conditions and protocols.
Fig. 13 A shows current–voltage relations for outward NCX-SQ1 exchange current with 4 mM extracellular Ca2+ and no extracellular Na+. With the Ca2+-free/10 mM EGTA cytoplasmic solution employed in these experiments, Ca2+-activated Cl− conductance is zero, and the same solutions (with 20 mM Cl−) could be used as in previous measurements with cardiac membrane patches (Hilgemann et al., 1992a ). Cytoplasmic Na+ was varied from 5 to 90 mM, substituting it for Cs+, and baseline current–voltage relations in the absence of Na+ were subtracted. The current–voltage relations are similar in shape and they can be scaled well to each other (not illustrated). Fig. 13 B shows the Na+ dependence of current at −60 and +60 mV; the K50 (half-maximal concentration) for Na+ is 27 mM at +60 mV and 24 mM at −60 mV, and the Hill slopes are 1.2 and 1.7, respectively. For the cardiac exchanger, by contrast, current–voltage relations become less steep with high cytoplasmic Na+, and the K50 for Na+ decreases somewhat at positive potentials (Matsuoka and Hilgemann, 1992).
Figure 13.

Outward NCX-SQ1 Na+–Ca2+ exchange current in a chymotrypsin-treated patch. The pipette solution contains 4 mM Ca2+ and no Na+; the cytoplasmic solution contains 10 mM EGTA and no Ca2+. (A) Current–voltage relations at the given Na+ concentrations from 5 to 90 mM. Data points for descending and ascending voltage steps show no hysteresis. (B) Cytoplasmic Na+ dependence of outward exchange current at +60 and −60 mV. The data points are fit to a Hill equation; the slope is 1.2 at +60 and 1.7 at −60 mV; the K50 is 27 mM at +60 mV and 24 mM at −60 mV.
Fig. 14 compares inward exchange current–voltage relations for NCX-SQ1 and NCX1, expressed in the same batch of oocytes and using the same Cl−-free solutions. The cytoplasmic solution was the same as described in materials and methods without Na+. The pipette solution contained 120 mM Na+ (see Fig. 14, legend, for complete composition). Fig. 14, A and B, shows results for NCX1 and NCX-SQ1, respectively, with 0.2, 2, 10, and 300 μM free cytoplasmic Ca2+. The current–voltage relations of the NCX-SQ1 exchanger are substantially steeper than those for the NCX1 exchanger and have a more “exponential” form. Those for NCX1 are nearly linear over the entire voltage range. For NCX-SQ1, current doubles in ∼30 mV in the steepest region of the current–voltage relations. This is close to the slope expected for a single charge movement across the entire electrical field. Fig. 14, C and D, shows the Ca2+ dependencies of the inward current at −150 and −30 mV. Both data sets are well- described by Hill equations with slopes of 1, and there are small shifts of the K50's to higher concentrations at more negative potentials; 2.5–4.2 μM for NCX1, and 3.5–7.2 μM for NCX-SQ1.
Figure 14.

Comparison of inward NCX1 and NCX-SQ1 Na+– Ca2+ exchange currents in chymotrypsin-treated patches. The pipette solution contains (mM): 120 Na+, 10 EGTA, 20 Cs+, 20 HEPES, 4 Mg2+, and no Ca2+ (pH 7.0 with NMG); the cytoplasmic solution contains 10 mM EGTA and no Na+. The inward current– voltage relations are defined by subtracting records with Ca2+ from records without Ca2+. In descending order, the current–voltage relations are with 0.2, 2, 10, and 300 μM Ca2+. (A) Current–voltage relations for NCX1. (B) Current–voltage relations for NCX-SQ1. Same batch of oocytes as in A. (C) Cytoplasmic Ca2+ dependence of the inward NCX1 exchange current at −150 and −30 mV. The K50, indicated by an arrow, is 2.5 μM at −30 mV and 4.2 μM at −150 mV. (D) Cytoplasmic Ca2+ dependence of the inward NCX-SQ1 exchange current at −150 and −30 mV. The K50 is 3.5 μM at −30 mV and 7.2 μM at −150 mV.
Na+ and Ca2+ Concentration Jump-induced Charge Movements of the NCX-SQ1 Exchanger
As mentioned in the introduction, Ca2+ flux studies in squid axons suggest that Ca2+ translocation is substantially more voltage dependent than Na+ translocation (DiPolo et al., 1989; DiPolo and Beaugé, 1990) and similar results are described for the barnacle Na+– Ca2+ exchanger (Rasgado-Flores et al., 1996). To test directly whether Ca2+ translocation is electrogenic in NCX-SQ1, ion concentration jump experiments were designed to isolate the possible charge movements of outward Ca2+ and Na+ translocation. To do so, the outward translocation of ions is initiated by moving the patch pipette tip through the interface between two solution streams in 1 ms, whereby one stream contains no substrate and the other contains a high substrate concentration. A computer-controlled Piezzo-type manipulator is used to move the patch clamp head stage together with the patch pipette (Hilgemann and Lu, 1998). The speed of the substrate concentration change occurring at the membrane surface in these experiments (∼150-ms time constant) is determined by diffusion from the pipette orifice to the membrane surface (20–70 μm). We point out, however, that the speed of current activation, observed upon applying a substrate, can be much faster. That is because binding sites can be saturated quickly, compared with average diffusion times, if substrate concentrations are high with respect to binding site affinity. This is the case for experiments with Na+ jumps, but it appears not to be the case for Ca2+ jumps.
Fig. 15 illustrates the major experimental results. All patches were chymotrypsin treated and it is noted that experiments were successful only in oocyte batches with high exchanger expression (approximately one batch out of six). The protocols, based on the predicted function of an alternating-access exchange model, were the same as used previously to monitor “half-cycles” of ion transport (Hilgemann et al., 1991): in the presence of substrate on the extracellular side and no substrate on the cytoplasmic side, the exchanger binding sites will orient to the cytoplasmic side and will be free of substrate. When a high concentration of substrate is applied to the cytoplasmic side, substrate will bind and the binding sites will reorient and open to the extracellular side. Substrate will be released, and binding sites will remain in the extracellular orientation, on average, if the extracellular substrate concentration is relatively low. Thus, charge movement observed during this protocol should reflect the electrogenicity of ion transport for the substrate added.
Figure 15.

Identification of electrogenic reactions of NCX1 and NCX-SQ1 using concentration jumps. (A) Current transients recorded from NCX1-expressing patch when 40 mM cytoplasmic Na+ is applied and removed in the presence of 20 mM extracellular Na+. (B) Typical lack of current transients recorded from NCX-SQ1-expressing patch when 40 mM cytoplasmic Na+ is applied and removed in the presence of 20 mM extracellular Na+. (C) Inward NCX1 current activated when a solution with 5 μM free Ca2+ is applied as in A. (D) Inward NCX-SQ1 current activated when a solution with 5 μM free Ca2+ is applied as in B. (E) Typical lack of current transients for a Ca2+ jump to 5 μM free Ca2+ in NCX1- expressing patch; 50 μM extracellular Ca2+. (F) Current transients recorded from NCX-SQ1-expressing patch when a solution with 5 μM free Ca2+ is applied and removed in the presence of 50 μM extracellular Ca2+. (G) Outward current activated by applying 40 mM Na+ to an NCX1 patch with 50 μM extracellular Ca2+. (H) Outward current activated by applying 40 mM Na+ to an NCX1 patch with 50 μM extracellular Ca2+. See text for details.
Fig. 15, A and B, shows results for jumping cytoplasmic Na+ from 0 to 40 mM in the presence of 20 mM extracellular Na+ (no Ca2+ on either membrane side). Results for NCX1 are the same as described previously (Hilgemann et al., 1991). An outward current transient, ∼150 ms in duration with a peak of ∼3 pA, is observed on application of Na+, and a slower inward current transient with a peak of ∼1 pA is observed on removing Na+. The areas defined by the current transients correspond to ∼300,000 elementary charges, which in turn corresponds to ∼300 charges/μm2 with a 10-pF patch. Using the same protocols in patches expressing the squid exchanger, current transients were either absent or very small (five observations; Fig. 15 B). That these results reflect a real difference in exchanger function is supported by the observation that inward currents activated by applying cytoplasmic Ca2+ were of similar magnitude in the NCX1 and NCX-SQ1 patches (Fig. 15, C and D). We point out that the current activated by 5 μM Ca2+ corresponds to ∼10% of the current activated in patches from the same oocyte batches when 150 mM Na+ was included in the pipette.
Fig. 15, E and F, shows the equivalent results for jumps of cytoplasmic Ca2+ from 0 to 5 μM in the presence of 50 μM extracellular Ca2+. As described previously (Hilgemann et al., 1991), charge movements are small or absent for this protocol with NCX1. For NCX-SQ1, however, inward current transients are obtained on applying Ca2+ and outward current transients on removing Ca2+. These charge movements may correspond to a movement of negative charge when Ca2+ is moved by the exchanger. The magnitudes of charge movements in these experiments were roughly similar to those for Na+ jumps with NCX1 (Fig. 15 A). Fig. 15, G and H, shows the time courses with which outward exchange current was turned on and off with cytoplasmic Na+ jumps.
Voltage Jump-induced Charge Movements of Ca2+ Transport of the NCX-SQ1 Exchanger
For the cardiac exchanger (NCX1), charge movements of Ca2+ transport have been isolated in voltage-jump experiments (Hilgemann, 1996). The charge movements were of small magnitude and showed weak voltage dependence with rates of ∼5,000 s−1 at 0 mV. Results for NCX-SQ1, after chymotrypsin treatment, are shown in Fig. 16. The rationale of the experiment is that most of the voltage dependence of Ca2+ transport comes about during occlusion of Ca2+ from the cytoplasmic side. Therefore, a high concentration of Ca2+, 4 mM, is included on the extracellular side. Without cytoplasmic Ca2+, all exchangers should orient to the cytoplasmic side with empty binding sites. Voltage pulses are applied first in the absence of cytoplasmic Ca2+, and then in the presence of 2 μM cytoplasmic Ca2+ to activate the ion occlusion reaction. Charge rather than current was recorded, and the holding potential was −40 mV. Records presented in Fig. 16 A are a subtraction of records with cytoplasmic Ca2+ from records without Ca2+, whereby 16 records were acquired in alternating order with and without cytoplasmic Ca2+, and results were averaged. The charge movements show small fast components that appear as charge jumps on changing voltage, and they show slower components that saturate progressively as larger voltage pulses are applied to +160 and −200 mV. Fig. 16 B shows the voltage dependence of the charge movements, fitted to a Boltzmann relation {1/[1 + expq *(Em+E50)/26.5]}, which gives an equivalent charge (q) of 0.46 underlying the charge movement. This is twice the value obtained for NCX1 (Hilgemann, 1996). Fig. 16 C shows the voltage dependence of the rates of the charge movements, obtained by fitting the slow components of Fig. 16 A to single exponential functions. The rates have a “U-shaped” dependence on voltage, as expected for a simple reaction with voltage dependence of both the forward and reverse rates. The rates can be well-described by the sum of two exponentials, K f · eq *Em/55 + K b · e−q*Em/55, where K f and K b are the forward and backward rates at 0 mV. The fit gives an equivalent charge of 0.59. The overall rate at 0 mV is ∼1,600 s−1, which is about threefold lower than rates obtained in equivalent experiments with NCX1 (Hilgemann, 1996).
Figure 16.

Charge movements related to Ca2+ transport by NCX-SQ1 Na+–Ca2+ exchanger. (A) In the presence of 4 mM extracellular Ca2+, charge records were taken with and without 2 μM cytoplasmic free Ca2+. The holding potential was −40 mV, and potential was stepped for 1 ms to different values in 40-mV steps. Membrane current is the first derivative of these records. Signals were essentially flat at the same amplification in control oocyte patches. (B) Voltage dependence of the Ca2+-dependent charge movements recorded in A. The Boltzmann slope (q) of the fitted Boltzmann function was 0.46. (C) Voltage dependence of rates of the charge movements, determined by fitting the charge transients to single exponential functions. The Boltzmann slope (q) of the fitted sum of two exponentials is 0.59. See text for details.
discussion
The Squid Na+–Ca2+ Exchanger, NCX-SQ1
We have cloned and expressed the squid neuronal Na+–Ca2+ exchanger, NCX-SQ1. The squid exchanger is a member of the family of NCX-type exchangers, including three mammalian exchangers, NCX1 (Nicoll et al., 1990), NCX2 (Li et al., 1994), and NCX3 (Nicoll et al., 1996), as well as the Drosophila Na+–Ca2+ exchanger (Schwarz and Benzer, 1997; Ruknudin et al., 1997). NCX-SQ1 is 58% identical at the amino acid level to the canine cardiac Na+–Ca2+ exchanger, NCX1, and has similar identities (51–64%) to the other NCXs. There are several features of note. Regions determined to be of functional importance in previous studies of NCX1 are well conserved. For example, we have identified specific acidic residues within the binding site for regulatory Ca2+ (Fig. 4, boxed area) that are important for Ca2+ binding (Levitsky et al., 1994; Matsuoka et al., 1995). These triple aspartate (DDD) motifs (Fig. 4, bold) are perfectly conserved in all NCX exchangers. Likewise, we have described the endogenous XIP region of NCX1 and have proposed that the XIP region is involved in Na+-dependent inactivation (Li et al., 1991; Matsuoka et al., 1997). A homologous region (Fig. 4, shaded area) is also present in NCX-SQ1 and is conserved among the exchangers.
The predicted topology of NCX-SQ1 is similar to that of the other exchangers with 11 transmembrane segments and a large intracellular loop. Sequence conservation among the exchangers is highest in the proposed transmembrane segments consistent with a catalytic role of the hydrophobic domains in ion translocation. We have described that exchanger function is especially sensitive to mutations within portions of transmembrane segments 2, 3, 8, and 9 (Nicoll et al., 1996). These regions are known as the α repeats (α-1 and α-2). Significantly, the α repeats are highly conserved in species as divergent as squid and dog, consistent with a proposed role in ion transport. Proposed transmembrane segment 11 is the least well conserved transmembrane domain among the NCX exchangers. Perhaps the COOH terminus of the protein has a lesser role in exchange function. As noted previously (Tsuruya et al., 1994), the NH2 terminus of the exchanger, which represents a signal peptide region, is poorly conserved among NCX proteins.
The squid Na+–Ca2+ exchanger has previously been reported to be stimulated by phosphorylation reactions and by phosphoarginine (DiPolo and Beaugé, 1994; DiPolo et al., 1997) and we analyzed the NCX-SQ1 sequence for potential phosphorylation sites. Potential sites for phosphorylation by protein kinases A and C, Ca2+/ calmodulin-dependent kinase, and tyrosine kinases are shown in Fig. 4. The PKC site (threonine 184) between transmembrane segments 3 and 4 and the tyrosine kinase site in the Ca2+ binding region (tyrosine 462) are unique among the exchangers. Phosphorylation at either site might be expected to have functional effects.
As shown in Fig. 4, there is a deletion of 47 amino acids in the large intracellular loop of NCX-SQ1 in comparison with NCX1. This region of NCX1 displays extensive alternative splicing (Nakasaki et al., 1993; Kofuji et al., 1994; Lee et al., 1994; Quednau et al., 1997). Six small exons are used in different combinations in a tissue-specific manner. The first two of these exons (exons A and B) are mutually exclusive. The NCX1 splice variant in Fig. 4 is NCX1.1 (Quednau et al., 1997) using exons A and C–F. Of the six small exons, NCX-SQ1 apparently uses only exon A. The homologous exons A of NCX-SQ1 and NCX1 are shaded in Fig. 4. We performed reverse transcriptase–PCR using optic lobe and stellate ganglion RNA to detect other splice variants of NCX-SQ1. Nine clones were sequenced, but no other splicing isoforms were detected.
Regulation of Na+–Ca2+ exchange by intracellular Ca2+ was first described in the squid axon (Baker and McNaughton, 1976; DiPolo, 1979). Micromolar levels of free intracellular Ca2+ are required to activate function. That is, in addition to transporting Ca2+, the exchanger is separately regulated by Ca2+. This secondary effect of intracellular Ca2+ has been analyzed at the molecular level for the cloned cardiac exchanger NCX1 (Levitsky et al., 1994; Matsuoka et al., 1995). Using 45Ca2+ fluxes, we find that Ca2+ regulation is apparently intrinsic to the NCX-SQ1 exchanger protein. Chelation of intracellular Ca2+ with EGTA prevents Na+ i-dependent Ca2+ uptake (Fig. 6). This is not surprising since, as noted above, the regulatory Ca2+ binding site of NCX1 is conserved in the sequence of NCX-SQ1.
Regulatory Mechanisms Acting on NCX-SQ1 in Oocyte Giant Patches
Given the sequence similarities to NCX1, it is not surprising that many of the regulatory properties of NCX-SQ1 are similar to those of NCX1. This includes the properties of Na+-dependent inactivation, secondary activation by cytoplasmic Ca2+, and deregulation by chymotrypsin (Fig. 7). Furthermore, similarities include stimulation by ATP and PIP2, and reversal of the stimulatory effects of ATP by a PIP2 antibody (Figs. 8 and 9). However, there are also evident differences between NCX-SQ1 and NCX1. In the absence of phosphatase inhibitors, NCX-SQ1 exchange current is usually stimulated by ATP, which is not the case with NCX1. Either the squid exchanger has higher affinity for PIP2 or it is modulated by an additional ATP-dependent reaction. Consistent with this possibility, the thioester of ATP, ATPγS, stimulates NCX-SQ1 in oocyte patches but not NCX1 current (Figs. 8 and 10). An attractive speculation is that we are observing phosphorylation of NCX-SQ1 at one of its consensus phosphorylation sites. We cannot, however, completely eliminate a possibility that effects of the ATPγS preparations employed reflect contaminating ATP and an increased sensitivity of the squid to PIP2.
The reversal of ATP effects on Na+–Ca2+ exchange current by a PIP2 antibody is reported here for the first time. The fact that the PIP2 antibody can reverse stimulatory effects of ATPγS on the squid exchanger indicates that PIP2 is involved. Perhaps phosphorylation increases the affinity of NCX-SQ1 for PIP2. Precedents for such a mechanism come from recent work with inward rectifier potassium channels. With GIRK-type channels, activation by G-protein βγ subunits is accompanied by an increase of affinity for PIP2 (Huang et al., 1998), and, with ROMK-type channels, activation by cAMP- dependent protein kinase is accompanied by an increase of the apparent affinity for PIP2 (Dr. C.L. Huang, personal communication). Since ATP increases the apparent affinity for Ca2+ at exchanger regulatory sites (DiPolo and Beaugé, 1987; Collins et al., 1992), a primary effect of phosphorylation on Ca2+ affinity is also a possibility. In contrast to our results, it is reported that the PIP2 antibody is without effect on Na+–Ca2+ exchange in squid giant axons, either with or without ATP (DiPolo and Beaugé, 1998). Either the antibody does not reach the membrane in axons or the exchanger is regulated in a fundamentally different way in the squid axon environment. The fact that phosphoarginine does not stimulate the cloned squid exchanger presumably reflects the absence of appropriate phosphoarginine- dependent kinases in oocyte giant membrane patches.
Voltage Dependence of NCX-SQ1 in Oocyte Giant Patches
The ion dependencies of the NCX-SQ1 exchange currents, determined here for the cytoplasmic side (Figs. 13 and 14), are consistent with those determined in dialyzed squid axons (DiPolo, 1989) and are only slightly different from results for the NCX1 exchanger. As described in Figs. 13 and 14, the voltage dependencies of outward and inward exchange currents of NCX-SQ1 are stronger than for NCX1, and the isolation of charge movements of Ca2+ transport for the squid exchanger (Figs. 15 and 16) verifies that electrogenic reactions are indeed different in the squid exchanger. Na+ transport is relatively less electrogenic, while Ca2+ transport is more electrogenic (Figs. 15 and 16). An important observation, which allows interpretation of the current–voltage relations of the squid exchanger, is that Na+–Na+ exchange by the squid exchanger is substantially greater than Na+–Ca+ or Ca2+–Ca2+ exchange (DiPolo et al., 1989; DiPolo and Beaugé, 1990; Dr. L. Beaugé, personal communication). Thus, Ca2+ transport may in general be rate limiting and the voltage dependence of Ca2+ transport will determine the overall voltage dependence of transport current. Consistent with this interpretation, the rates of Ca2+-dependent charge movements determined for the squid exchanger at 0 mV and 33°C are substantially less (1,700 s−1) than those determined for the NCX1 exchanger (5,000 s−1; Hilgemann et al., 1991; Hilgemann, 1996).
Our interpretation is tempered to some extent because an alternating access model, or “consecutive” exchange mechanism, has not been rigorously verified for the squid exchanger. In a consecutive mechanism, the apparent affinity of one transported ion should increase as the concentration of the countertransported ion is decreased. For the squid exchanger, it has been reported that the Na+ dependence of Ca2+ efflux does not change as the cytoplasmic Ca2+ concentration is reduced (DiPolo, 1989). Thus, further work is required on transport properties of the squid exchanger; the application of techniques to photo-release Ca2+ in giant patches within microseconds (Kappl and Hartung, 1996), rather than 100 ms, will allow much better resolution of these issues.
The differences in the charge-moving reactions of NCX1 and NCX-SQ1 may provide an important key to elucidating the physical basis of exchanger electrogenicity. Ion occlusion reactions may result from the movement of charged residues anywhere in the exchanger protein, but only residues that enter or leave the membrane electrical field together with ions will generate charge movements. Evidently, more than two negative charges must move into the membrane electrical field when Ca2+ is occluded by the squid exchanger from the cytoplasmic side. Studies of chimeras of the two exchangers, and ultimately point mutation studies, should be able to define the involvement of specific groups and provide an understanding of the conformational changes underlying ion transport.
In summary, the squid Na+–Ca2+ exchanger, NCX-SQ1, has been cloned and expressed in Xenopus oocytes, and its function has been characterized electrophysiologically in giant membrane patches. The differences between the sequence and functional properties of NCX-SQ1 and the mammalian NCX1 now provide a new basis to elucidate both regulatory and transport properties of Na+–Ca2+ exchange. NCX-SQ1 is strongly activated by the anionic phospholipid, PIP2, and the presence of phosphorylation sites, not present in NCX1, may correlate with stimulation of the squid exchanger by thioester derivatives of ATP. The molecular basis of differences in the voltage dependence of cardiac and squid exchangers can now be pursued by the combined methods of molecular biology and electrophysiology.
Acknowledgments
We thank Siyi Feng and Chin-Chih Lu for expert technical help.
This work was supported by the National Institutes of Health (HL-5132302 to D.W. Hilgemann and HL-48509 and HL-49101 to K.D. Philipson).
Abbreviations used in this paper
- MES
2-(morpholino)ethanesulfonic acid
- NMG
N-methyl-d-glucamine
- nts
nucleotides
- PIP2
phosphatidylinositol-4′,-5′-bisphosphate
Footnotes
Z. He's current address is Clinical Research Department, DuPont Hospital for Children, Wilmington, DE 19899.
references
- Baker PF, McNaughton PA. Kinetics and energetics of calcium efflux from intact squid axons. J Physiol (Camb) 1976;259:104–114. doi: 10.1113/jphysiol.1976.sp011457. [DOI] [PMC free article] [PubMed] [Google Scholar]
- Baud C, Kado RT. Induction and disappearance of excitability in the oocyte of Xenopus laevis: a voltage-clamp study. J Physiol (Camb) 1984;356:275–289. doi: 10.1113/jphysiol.1984.sp015464. [DOI] [PMC free article] [PubMed] [Google Scholar]
- Chomczynski P, Sacchi N. Single-step method of RNA isolation by acid guanidinium thiocyanate-phenol-chloroform extraction. Anal Biochem. 1987;162:156–159. doi: 10.1006/abio.1987.9999. [DOI] [PubMed] [Google Scholar]
- Collins A, Somlyo A, Hilgemann DW. The giant cardiac membrane patch method: stimulation of outward Na/Ca exchange current by MgATP. J Physiol (Camb) 1992;454:37–57. doi: 10.1113/jphysiol.1992.sp019253. [DOI] [PMC free article] [PubMed] [Google Scholar]
- DiPolo R. The effect of ATP on Ca2+efflux in dialyzed squid giant axons. J Gen Physiol. 1974;64:503–517. doi: 10.1085/jgp.64.4.503. [DOI] [PMC free article] [PubMed] [Google Scholar]
- DiPolo R. Calcium influx in internally dialyzed squid giant axons. J Gen Physiol. 1979;73:91–113. doi: 10.1085/jgp.73.1.91. [DOI] [PMC free article] [PubMed] [Google Scholar]
- DiPolo, R. 1989. The sodium-calcium exchange in intact cells. In Sodium–Calcium Exchange. H. Reuter, T.J.A. Allen, and D. Noble, editors. Oxford University Press, Oxford, UK. 5–26.
- DiPolo R, Beaugé L. In dialyzed squid axons a Mg- dependent dephosphorylation controls the activity of the Na/Ca exchanger which seems independent of the PIP2membrane levels. Biophys J. 1998;74:A195. [Google Scholar]
- DiPolo R, Beaugé L. In squid axons reverse Na+/Ca2+ exchange requires internal Ca2+and/or ATP. Biochim Biophys Acta. 1986;854:298–306. [Google Scholar]
- DiPolo R, Beaugé L. In squid axons ATP modulates Na+/Ca2+ exchange by a Ca2+-dependent phosphorylation. Biochim Biophys Acta. 1987;897:347–354. doi: 10.1016/0005-2736(87)90432-9. [DOI] [PubMed] [Google Scholar]
- DiPolo R, Beaugé L. Asymmetrical properties of the Na+-Ca2+exchange in voltage-clamped, internally dialyzed squid axons under symmetrical ionic conditions. J Gen Physiol. 1990;95:819–835. doi: 10.1085/jgp.95.5.819. [DOI] [PMC free article] [PubMed] [Google Scholar]
- DiPolo R, Beaugé L. Regulation of Na+-Ca2+exchange: an overview. Ann NY Acad Sci. 1991;639:100–111. doi: 10.1111/j.1749-6632.1991.tb17294.x. [DOI] [PubMed] [Google Scholar]
- DiPolo R, Beaugé L. Effects of some metal-ATP complexes on Na+-Ca2+exchange in internally dialyzed squid axons. J Physiol (Camb) 1993;462:71–86. doi: 10.1113/jphysiol.1993.sp019544. [DOI] [PMC free article] [PubMed] [Google Scholar]
- DiPolo R, Beaugé L. Effects of vanadate on MgATP stimulation of Na+-Ca2+exchange support kinase-phosphatase modulation in squid axon. Am J Physiol. 1994;266:1382–1391. doi: 10.1152/ajpcell.1994.266.5.C1382. [DOI] [PubMed] [Google Scholar]
- DiPolo R, Beaugé L. Phosphoarginine stimulation of Na+-Ca2+ exchange in squid axons—a new pathway for metabolic regulation? . J Physiol (Camb) 1995;487:57–66. doi: 10.1113/jphysiol.1995.sp020861. [DOI] [PMC free article] [PubMed] [Google Scholar]
- DiPolo R, Beaugé L, Rojas H. In dialyzed squid axons Ca2+ i activates Ca2+ o–Na+ i and Na+ o–Na+ iexchanges in the absence of Ca chelating agents. Biochim Biophys Acta. 1989;978:328–332. doi: 10.1016/0005-2736(89)90132-6. [DOI] [PubMed] [Google Scholar]
- DiPolo R, Berberian G, Delgado D, Rojas H, Beaugé L. A novel 13 kDa cytoplasmic soluble protein is required for the nucleotide (MgATP) modulation of the Na+-Ca2+exchange in squid nerve fibers. FEBS Lett. 1997;401:6–10. doi: 10.1016/s0014-5793(96)01416-0. [DOI] [PubMed] [Google Scholar]
- DiPolo R, Bezanilla F, Caputo C, Rojas H. Voltage dependence of the Na+–calcium exchange in voltage-clamped, dialyzed squid axons. J Gen Physiol. 1985;86:457–478. doi: 10.1085/jgp.86.4.457. [DOI] [PMC free article] [PubMed] [Google Scholar]
- Durkin JT, Ahrens DC, Pan YC, Reeves JP. Purification and amino-terminal sequence of the bovine cardiac sodium-calcium exchanger: evidence for the presence of a signal sequence. Arch Biochem Biophys. 1991;290:369–375. doi: 10.1016/0003-9861(91)90553-u. [DOI] [PubMed] [Google Scholar]
- Fabiato A. Computer programs for calculating total from specified free or free from specified total ionic concentrations in aqueous solutions containing multiple metals and ligands. Methods Enzymol. 1988;157:378–417. doi: 10.1016/0076-6879(88)57093-3. [DOI] [PubMed] [Google Scholar]
- He Z, Petesch N, Voges K-P, Roben W, Philipson KD. Identification of important amino acid residues of the Na+-Ca2+exchanger inhibitory peptide, XIP. J Membr Biol. 1997;156:149–156. doi: 10.1007/s002329900197. [DOI] [PubMed] [Google Scholar]
- Hilgemann DW. Regulation and deregulation of cardiac Na+-Ca2+exchange in giant excised sarcolemmal membrane patches. Nature. 1990;344:242–245. doi: 10.1038/344242a0. [DOI] [PubMed] [Google Scholar]
- Hilgemann, D.W. 1995. The giant membrane patch. In Single Channel Recording. B. Sakmann and E. Neher, editors. Plenum Publishing Corp., New York. 307–327.
- Hilgemann DW. Unitary cardiac Na+, Ca2+exchange current magnitudes determined from channel-like noise and charge movements of ion transport. Biophys J. 1996;71:759–768. doi: 10.1016/S0006-3495(96)79275-5. [DOI] [PMC free article] [PubMed] [Google Scholar]
- Hilgemann DW. Cytoplasmic ATP-dependent regulation of ion transporters and channels: mechanisms and messengers. Annu Rev Physiol. 1997;59:193–220. doi: 10.1146/annurev.physiol.59.1.193. [DOI] [PubMed] [Google Scholar]
- Hilgemann DW, Ball R. Regulation of cardiac Na+-Ca2+ exchange and KATP potassium channels by PIP2 . Science. 1997;273:956–959. doi: 10.1126/science.273.5277.956. [DOI] [PubMed] [Google Scholar]
- Hilgemann DW, Collins A. The mechanism of sodium–calcium exchange stimulation by ATP in giant cardiac membrane patches: possible role of aminophospholipid translocase. J Physiol (Camb) 1992;454:59–82. doi: 10.1113/jphysiol.1992.sp019254. [DOI] [PMC free article] [PubMed] [Google Scholar]
- Hilgemann DW, Collins A, Matsuoka S. Steady state and dynamic properties of cardiac sodium–calcium exchange: calcium- and ATP-dependent activation. J Gen Physiol. 1992b;100:933–961. doi: 10.1085/jgp.100.6.933. [DOI] [PMC free article] [PubMed] [Google Scholar]
- Hilgemann, D.W., and C.-C. Lu. 1998. Giant membrane patches: recent developments and improvements. Methods Enzymol. In press. [DOI] [PubMed]
- Hilgemann DW, Matsuoka S, Nagel GA, Collins A. Steady-state and dynamic properties of cardiac sodium–calcium exchange: sodium-dependent inactivation. J Gen Physiol. 1992a;100:905–932. doi: 10.1085/jgp.100.6.905. [DOI] [PMC free article] [PubMed] [Google Scholar]
- Hilgemann DW, Nicoll DA, Philipson KD. Charge movement during sodium translocation by native and cloned cardiac Na/Ca exchanger in giant excised membrane patches. Nature. 1991;352:715–719. doi: 10.1038/352715a0. [DOI] [PubMed] [Google Scholar]
- Hilgemann, D.W., K.D. Philipson, and G. Vassort, eds. 1996. Sodium–calcium exchange: proceedings of the third international conference. Vol. 779. Ann. NY Acad. Sci. 593 pp.
- Hryshko LV, Nicoll DA, Weiss JN, Philipson KD. Biosynthesis and initial processing of the cardiac sarcolemmal Na+-Ca2+exchanger. Biochim Biophys Acta. 1993;1151:35–42. doi: 10.1016/0005-2736(93)90068-b. [DOI] [PubMed] [Google Scholar]
- Huang CL, Feng S, Hilgemann DW. Direct interaction of PIP2with inward rectifier potassium channels and its modification by G-protein beta-gamma subunits. Nature. 1998;391:803–806. doi: 10.1038/35882. [DOI] [PubMed] [Google Scholar]
- Kappl M, Hartung K. Rapid charge translocation by the cardiac Na+-Ca2+ exchanger after a Ca2+concentration jump. Biophys J. 1996;71:2473–2485. doi: 10.1016/S0006-3495(96)79441-9. [DOI] [PMC free article] [PubMed] [Google Scholar]
- Kimura J, Noma A, Irisawa H. Na+-Ca2+exchange current in mammalian heart cells. Nature. 1986;319:596–597. doi: 10.1038/319596a0. [DOI] [PubMed] [Google Scholar]
- Kofuji P, Lederer WJ, Schulze DH. Mutually exclusive and cassette exons underlie alternatively spliced isoforms of Na+-Ca2+exchanger. J Biol Chem. 1994;269:5145–5149. [PubMed] [Google Scholar]
- Kozak M. Structural features in eukaryotic mRNA that modulate the initiation of translation. J Cell Biol. 1989;108:229–241. [PubMed] [Google Scholar]
- Lee S-L, Yu ASL, Lytton J. Tissue-specific expression of Na+-Ca2+exchanger isoforms. J Biol Chem. 1994;269:14849–14852. [PubMed] [Google Scholar]
- Levitsky DO, Nicoll DA, Philipson KD. Identification of the high affinity Ca2+-binding domain of the cardiac Na+-Ca2+exchanger. J Biol Chem. 1994;269:22847–22852. [PubMed] [Google Scholar]
- Li Z, Matsuoka S, Hryshko LV, Nicoll DA, Bersohn MM, Burke EP, Lifton RP, Philipson KD. Cloning of the NCX2 isoform of the plasma membrane Na+-Ca2+exchanger. J Biol Chem. 1994;269:17434–17439. [PubMed] [Google Scholar]
- Li Z, Nicoll DA, Collins A, Hilgemann DW, Filoteo AG, Penniston JT, Weiss JN, Tomich JM, Philipson KD. Identification of a peptide inhibitor of the cardiac sarcolemmal Na+-Ca2+exchanger. J Biol Chem. 1991;266:1014–1020. [PubMed] [Google Scholar]
- Longoni S, Coady MJ, Ikeda T, Philipson KD. Expression of cardiac sarcolemmal Na+-Ca2+ exchange activity in Xenopus laevisoocytes. Am J Physiol. 1988;255:C870–C873. doi: 10.1152/ajpcell.1988.255.6.C870. [DOI] [PubMed] [Google Scholar]
- Matsuoka S, Hilgemann DW. Steady-state and dynamic properties of cardiac sodium-calcium exchange: ion and voltage dependencies of the transport cycle. J Gen Physiol. 1992;100:963–1001. doi: 10.1085/jgp.100.6.963. [DOI] [PMC free article] [PubMed] [Google Scholar]
- Matsuoka S, Nicoll DA, He Z, Philipson KD. Regulation of the cardiac Na+-Ca2+exchanger by the endogenous XIP region. J Gen Physiol. 1997;109:273–286. doi: 10.1085/jgp.109.2.273. [DOI] [PMC free article] [PubMed] [Google Scholar]
- Matsuoka S, Nicoll DA, Hryshko LV, Levitsky DO, Weiss JN, Philipson KD. Regulation of the cardiac Na+-Ca2+ exchanger by Ca2+ . J Gen Physiol. 1995;105:403–420. doi: 10.1085/jgp.105.3.403. [DOI] [PMC free article] [PubMed] [Google Scholar]
- Matsuoka S, Nicoll DA, Reilly RF, Hilgemann DW, Philipson KD. Initial localization of regulatory regions of the cardiac sarcolemmal Na+-Ca2+exchanger. Proc Natl Acad Sci USA. 1993;90:3870–3874. doi: 10.1073/pnas.90.9.3870. [DOI] [PMC free article] [PubMed] [Google Scholar]
- Nakasaki Y, Iwamoto T, Hanada H, Imagawa T, Shigekawa M. Cloning of the rat aortic smooth muscle Na+-Ca2+exchange and tissue-specific expression of isoforms. J Biochem. 1993;114:528–534. doi: 10.1093/oxfordjournals.jbchem.a124211. [DOI] [PubMed] [Google Scholar]
- Nicoll DA, Hryshko LV, Matsuoka S, Frank JS, Philipson KD. Mutation of amino acid residues in the putative transmembrane segments of the cardiac sarcolemmal Na+-Ca2+exchanger. J Biol Chem. 1996b;271:13385–13391. doi: 10.1074/jbc.271.23.13385. [DOI] [PubMed] [Google Scholar]
- Nicoll DA, Longoni S, Philipson KD. Molecular cloning and functional expression of the cardiac sarcolemmal Na+-Ca2+exchanger. Science. 1990;250:562–565. doi: 10.1126/science.1700476. [DOI] [PubMed] [Google Scholar]
- Nicoll DA, Quednau BD, Qui Z, Xia Y-R, Lusis AJ, Philipson KD. Cloning of a third mammalian Na+-Ca2+exchanger, NCX3. J Biol Chem. 1996a;271:24914–24921. doi: 10.1074/jbc.271.40.24914. [DOI] [PubMed] [Google Scholar]
- Niggli E, Lederer WJ. Molecular operations of the sodium-calcium exchanger revealed by conformation currents. Nature. 1991;349:621–624. doi: 10.1038/349621a0. [DOI] [PubMed] [Google Scholar]
- Philipson, K.D., and J.R. Reeves. 1989. Sodium-calcium exchange activity in plasma membrane vesicles. In Sodium-Calcium Exchange. H. Reuter, T.J.A. Allen, and D. Noble, editors. Oxford University Press, Oxford, UK. 27–53.
- Powell T, Noma A, Shioya T, Kozlowski RZ. Turnover rate of the cardiac Na+–Ca2+exchanger in guinea-pig ventricular myocytes. J Physiol (Camb) 1993;472:45–53. doi: 10.1113/jphysiol.1993.sp019935. [DOI] [PMC free article] [PubMed] [Google Scholar]
- Quednau BD, Nicoll DA, Philipson KD. Tissue specificity and alternative splicing of the Na+-Ca2+exchanger isoforms NCX1, NCX2, and NCX3 in rat. Am J Physiol. 1997;272:C1250–C1261. doi: 10.1152/ajpcell.1997.272.4.C1250. [DOI] [PubMed] [Google Scholar]
- Rosenthal JJ, Gilly WF. Amino acid sequence of a putative sodium channel expressed in the giant axon of the squid loligo opalescens. Proc Natl Acad Sci USA. 1993;90:10026–10030. doi: 10.1073/pnas.90.21.10026. [DOI] [PMC free article] [PubMed] [Google Scholar]
- Rasgado-Flores H, Espinosa-Tanguma R, Tie J, DeSantiago J. Voltage dependence of Na–Ca exchange in barnacle muscle cells. I. Na–Na exchange activated by alpha-chymotrypsin. Ann NY Acad Sci. 1996;779:236–248. doi: 10.1111/j.1749-6632.1996.tb44790.x. [DOI] [PubMed] [Google Scholar]
- Ruknudin A, Valdivia C, Kofuji P, Lederer WJ, Schulze DH. Na+-Ca2+exchanger in Drosophila: cloning, expression and transport differences. Am J Physiol. 1997;273:C257–C265. doi: 10.1152/ajpcell.1997.273.1.C257. [DOI] [PubMed] [Google Scholar]
- Schwarz EM, Benzer S. Calx, a sodium–calcium exchanger gene of Drosophila melanogaster. Proc Natl Acad Sci USA. 1997;94:10249–10254. doi: 10.1073/pnas.94.19.10249. [DOI] [PMC free article] [PubMed] [Google Scholar]
- Sturzl M, Roth WK. “Run-off” synthesis and application of defined single-stranded DNA hybridization probes. Anal Biochem. 1990;185:164–169. doi: 10.1016/0003-2697(90)90274-d. [DOI] [PubMed] [Google Scholar]
- Tsuruya T, Bersohn MM, Li Z, Nicoll DA, Philipson KD. Molecular cloning and functional expression of the guinea pig cardiac Na+-Ca2+exchanger. Biochim Biophys Acta. 1994;1196:97–99. doi: 10.1016/0005-2736(94)90301-8. [DOI] [PubMed] [Google Scholar]
- Von Heijne G. Patterns of amino acids near signal-sequence cleavage sites. Eur J Biochem. 1983;133:17–21. doi: 10.1111/j.1432-1033.1983.tb07424.x. [DOI] [PubMed] [Google Scholar]