

Abstract
The biophysical characteristics and α subunits underlying calcium-independent transient outward potassium current (Ito) phenotypes expressed in ferret left ventricular epicardial (LV epi) and endocardial (LV endo) myocytes were analyzed using patch clamp, fluorescent in situ hybridization (FISH), and immunofluorescent (IF) techniques. Two distinct Ito phenotypes were measured (21–22°C) in the majority of LV epi and LV endo myocytes studied. The two Ito phenotypes displayed marked differences in peak current densities, activation thresholds, inactivation characteristics, and recovery kinetics. Ito,epi recovered rapidly [τrec, −70 mV = 51 ± 3 ms] with minimal cumulative inactivation, while Ito,endo recovered slowly [τrec, −70 mV = 3,002 ± 447 ms] with marked cumulative inactivation. Heteropoda toxin 2 (150 nM) blocked Ito,epi in a voltage-dependent manner, but had no effect on Ito,endo. Parallel FISH and IF measurements conducted on isolated LV epi and LV endo myocytes demonstrated that Kv1.4, Kv4.2, and Kv4.3 α subunit expression in LV myocyte types was quite heterogenous: (a) Kv4.2 and Kv4.3 were more predominantly expressed in LV epi than LV endo myocytes, and (b) Kv1.4 was expressed in the majority of LV endo myocytes but was essentially absent in LV epi myocytes. In combination with previous measurements on recovery kinetics (Kv1.4, slow; Kv4.2/4.3, relatively rapid) and Heteropoda toxin block (Kv1.4, insensitive; Kv4.2, sensitive), our results strongly support the hypothesis that, in ferret heart, Kv4.2/Kv4.3 and Kv1.4 α subunits, respectively, are the molecular substrates underlying the Ito,epi and Ito,endo phenotypes. FISH and IF measurements were also conducted on ferret ventricular tissue sections. The three Ito α subunits again showed distinct patterns of distribution: (a) Kv1.4 was localized primarily to the apical portion of the LV septum, LV endocardium, and approximate inner 75% of the LV free wall; (b) Kv4.2 was localized primarily to the right ventricular free wall, epicardial layers of the LV, and base of the heart; and (c) Kv4.3 was localized primarily to epicardial layers of the LV apex and diffusely distributed in the LV free wall and septum. Therefore, in intact ventricular tissue, a heterogeneous distribution of candidate Ito α subunits not only exists from LV epicardium to endocardium but also from apex to base.
Keywords: cardiac repolarization, patch clamp, Kv1.4, Kv4.2, Kv4.3
introduction
Due to their primary importance in both initiating and modulating repolarization of the cardiac action potential, extensive experimental effort has been devoted to analysis of potassium channels as potential targets for antiarrhythmic agents (Rasmusson et al., 1994; Tseng, 1995; Tamkun et al., 1995; Barry and Nerbonne, 1996; Sanguinetti and Spector, 1997). In particular, the calcium-independent transient outward potassium current Ito (also referred to as Ito,1; Antzelevitch et al., 1995; Campbell et al., 1995) has recently received much experimental attention. Ito is present in nearly all mammalian working cardiac myocyte types, including both human atrial (Escande et al., 1987; Shibata et al., 1988) and ventricular myocytes (Näbauer et al., 1993, 1996; Beuckelmann et al., 1993; Wettwer et al., 1993, 1994; Amos et al., 1996). Due to its rapid activation kinetics, Ito is the major current responsible for the early “notch” or phase 1 repolarization characteristic of the mammalian ventricular action potential. In addition, due to its slower inactivation kinetics, Ito can also significantly modulate the plateau and early phase 3 repolarization (Campbell et al., 1993a,b, 1995).
Despite the nearly universal presence of Ito in mammalian working myocardium, it appears to be less widely appreciated that there may be multiple and functionally distinct Ito phenotypes. In particular, significant differences in specific gating characteristics of Ito phenotypes have been reported both among different species and within different cardiac tissue and myocyte types from the same species. Three major differences can be summarized as follows: (a) marked differences in activation thresholds exist (Campbell et al., 1995), (b) the kinetics of macroscopic inactivation are either clearly single exponential (e.g., ferret right ventricle [Campbell et al., 1993a] and human ventricle [Näbauer et al., 1996]) or markedly biexponential (e.g., rabbit atrium and ventricle [Clark et al., 1988; Giles and Imaizumi, 1988]), and (c) the kinetics of recovery from inactivation are either rapid (time constants on the order of 10–100 ms; e.g., ferret, rat, and human ventricle [Josephson et al., 1984; Campbell et al., 1993a; Näbauer et al., 1996]) or slow to very slow (time constants on the order of hundreds of milliseconds to seconds; e.g., rabbit atrium and rabbit and dog ventricle [Liu et al., 1993; Antzelevitch et al., 1995; Clark et al., 1998]). Hence, there is a 1–2-order-of-magnitude difference in the time constants of recovery reported for different cardiac Ito phenotypes. Due to these marked differences in recovery kinetics, very slowly recovering cardiac Ito phenotypes display cumulative inactivation (Aldrich, 1981) during rapid and repetitive voltage clamp protocols (e.g., Clark et al., 1988), while rapidly recovering phenotypes generally do not (e.g., Campbell et al., 1993a).
In addition to significant kinetic differences among Ito phenotypes, within any one given species there may also exist heterogeneous expression of multiple Ito phenotypes and/or Ito current densities among distinct anatomical regions of the heart (Näbauer et al., 1993, 1996; Wettwer et al., 1993, 1994; Campbell et al., 1995; Antzelevitch et al., 1995). For example, recent studies on human left ventricular epicardial and endocardial myocytes have indicated a marked difference in both Ito current density and kinetics of recovery from inactivation between the two myocyte types (epicardial: higher Ito density, fast recovery; endocardial: lower Ito density, very slow recovery; Näbauer et al., 1993, 1996). Thus, depending on both species and specific anatomical region, there appear to be at least two major Ito phenotypes in mammalian heart capable of exerting functionally distinct frequency-dependent modulatory effects on repolarization.
The presence of at least two functional Ito phenotypes suggests the existence of at least two distinct potassium channel α subunits underlying each of the currents. To date, two main approaches have been used to address the issue of which α subunit underlies cardiac Ito: (a) detection of α subunit mRNA levels (generally of whole cardiac tissue samples), and (b) comparisons of kinetic characteristics of heterologously expressed potassium channel α subunit clones to native myocyte Ito phenotypes measured in one particular species. Based on these approaches, Kv1.4, Kv4.2, and Kv4.3 (long and short isoforms) α subunits have all been recently proposed to underlie “cardiac Ito” (e.g., Po et al., 1993; Comer et al., 1994; Dixon and McKinnon, 1994; Barry et al., 1995; Dixon et al., 1996; Barry and Nerbonne, 1996; Xu et al., 1996; Yeola and Snyders, 1997; Takimoto et al., 1997; Ohya et al., 1997). However, previous studies have not adequately examined the spatial distribution of both multiple Ito phenotypes and/or heterogeneity of Kv α subunit transcript and protein expression (Dixon and McKinnon, 1994; Barry et al., 1995; Dixon et al., 1996; Brahmajothi et al., 1996, 1997). Given these limitations, it is important to correlate levels of expressed Ito channel α subunit proteins in specific anatomical regions of the heart to patterns of functional Ito current phenotypes measured from individual myocytes isolated from the same anatomical regions.
To begin to address these issues, in this study we first demonstrate, using whole cell patch clamp, that at least two kinetically and pharmacologically distinct Ito phenotypes exist in ferret isolated left ventricular epicardial (LV epi)1 and endocardial (LV endo) myocytes. We designate these two major Ito phenotypes as Ito,epi and Ito,endo. We then demonstrate, using a combination of fluorescent in situ hybridization (FISH) and immunofluorescence (IF) techniques, that Kv1.4, Kv4.2, and Kv4.3 α subunit proteins are all expressed in ferret isolated LV myocytes. However, we show that the specific distribution patterns of these three candidate Ito α subunits are quite heterogeneous among LV epi versus LV endo myocytes: (a) both Kv4.2 and Kv4.3 are each more predominantly expressed in LV epi than LV endo myocytes, and (b) Kv1.4 is expressed in the majority of LV endo myocytes but is essentially absent in LV epi myocytes. These combined patch clamp and FISH/IF results on isolated myocytes therefore strongly suggest that in ferret heart Kv4.2/Kv4.3 and Kv1.4 α subunits, respectively, are the underlying molecular substrates for the Ito,epi and Ito,endo phenotypes. We then extend the FISH and IF measurements to sagittal ventricular tissue sections so as to gain initial insights into overall distribution patterns of Kv1.4, Kv4.2, and Kv4.3 Ito α subunits in the whole ventricle. We demonstrate that (a) Kv4.2 is predominantly expressed in LV apical epicardium, (b) Kv1.4 is predominantly expressed in LV apical endocardium, and (c) Kv4.3 is relatively more uniformly expressed throughout the LV wall. Hence, in the intact left ventricle, Kv1.4 and Kv4.2 expression levels vary significantly in the LV wall both transversely (i.e., epicardium-to-endocardium) and sagittally (i.e., apex-to-base). In contrast, in right ventricular (RV) tissue, we demonstrate that Kv4.2 is uniformly expressed across the entire free wall, while Kv1.4 and Kv4.3 are relatively sparse to absent. This latter result may imply that Kv4.2 α subunits underlie the much more uniformly expressed Ito phenotype in ferret right ventricular myocytes (Campbell et al., 1993a,b).
methods
Myocyte Isolation
Hearts were obtained from 16–30-wk-old male ferrets. Depending on photo period and other environmental factors, ferrets can reach sexual maturity at ∼16–32 wk (Bernard et al., 1984); hence, potential developmental changes in potassium channel expression occurring during puberty among some of the ferrets used cannot be definitively ruled out. Myocytes were enzymatically isolated (collagenase, protease, elastase) from the left ventricular free wall via a Langendorff perfusion apparatus exactly as described (Campbell et al., 1993a,b, 1996), except for the following slight modification. After 5–10 min of initial enzyme perfusion, the heart was removed from the Langendorff apparatus and the free wall of the left ventricle was dissected from the adjacent apical, septal, and basal regions, resulting in a tissue sample corresponding approximately to the middle one- to two-thirds of the left ventricular wall. Small thin strips (∼1 mm thick × 0.5–1 cm long) were then dissected in a sagittal orientation from both the partially digested epicardial and endocardial surfaces. These epicardial and endocardial tissue strips were then separately reincubated in fresh enzyme solution, gently shaken at 37°C, and myocytes were harvested at 10–20-min intervals as previously described (Campbell et al., 1993a,b, 1996). Once isolated, myocytes were directly stored in normal control Na+- and Ca2+-containing saline (see below) at room temperature (21–22°C). All voltage clamp experiments were conducted on myocytes within 6–12 h of isolation.
Electrophysiology, Analysis, and Solutions
All patch clamp recordings were conducted at room temperature (21–22°C) using the whole cell ruptured patch configuration (Marty and Neher, 1995). Exactly the same equipment, perfusion system, glass tubing for patch pipettes, etc., as previously described in detail (Campbell et al., 1993a,b, 1996) were used in the present study. Data were recorded (filtered at 1–2 kHz) on video tape, and then subsequently digitized (5–10 kHz) off-line and analyzed using pClamp and FigP software (Campbell et al., 1993a,b, 1996). Data are summarized as mean ± SEM.
After attainment of the whole cell configuration in normal control saline (mM: 144 NaCl, 5.4 KCl, 1 MgSO4, 1.8 CaCl2, 10 HEPES, pH 7.40), Ito was isolated from other overlapping currents by perfusing the myocytes with Na+- and Ca2+-free extracellular “Ito saline” (mM: 144 N-methyl-d-glucamine, 5.4 KCl, 2.3 MgSO4, 0.5 CdCl2, 10 HEPES, pH 7.40). Patch pipettes (3–4.5 MΩ) contained (mM): 140 KCl, 1 MgSO4, 5 Mg-ATP, 5 Tris-creatine phosphate, 0.2 GTP, 5 EGTA, 10 HEPES, pH 7.40. We opted for 500 μM Cd2+ in the extracellular Ito solution to block the L-type calcium current, ICa,L, for two reasons: (a) many commonly used organic ICa,L blockers can exert significant nonspecific blocking effects on cardiac Ito phenotypes (e.g., Gotoh et al., 1991; Lefevre et al., 1991; Y. Qu and D.L. Campbell, unpublished observations), thereby potentially complicating analysis (e.g., use-dependent effects); and (b) for comparative purposes to previous Ito studies that also used Cd2+ to block ICa,L (e.g., ferret right ventricular myocytes [Campbell et al., 1993] and human left ventricular myocytes [Näbauer et al., 1993, 1996]). Cd2+ can exert effects on various potassium currents, including shifts in both activation and inactivation, and such presently uncharacterized effects may not be identical among the two major Ito phenotypes (Ito,epi, Ito,endo) that we describe. The standard holding potential under all conditions was −70 mV. 5–15 min were routinely allowed to pass after initial attainment of the whole-cell configuration to allow for stabilization of currents and gating parameters (Campbell et al., 1993a; Marty and Neher, 1995). “Leakage correction” was not applied. All chemicals used for making solutions were obtained from Sigma Chemical Co. Heteropoda toxin 2 (stored at −20°C; directly added to room temperature Ito saline at a final concentration of 150 nM immediately before experimental application) was a kind gift of NPS Pharmaceuticals.
Antibody Generation
Kv1.4 (monoclonal), Kv4.2 (COOH-terminal polyclonal), and Kv4.3 (COOH-terminal polyclonal) antibodies were prepared as follows. The anti–Kv1.4 monoclonal antibody K13/31 (Bekele-Arcuri et al., 1996) was raised against a synthetic peptide (NSHMPYGYAAQARARERERLAHSR; Quality Controlled Biochemical) corresponding to amino acids 13–37 of rat Kv1.4. This sequence is 100% identical to the corresponding sequence of ferret Kv1.4 (Comer et al., 1994). The anti–Kv4.2 polyclonal antibody Kv4.2C (Nakahira et al., 1996) was raised against a synthetic peptide (CLEKTTNHEFVDEQVFEES; Quality Controlled Biochemical) corresponding to amino acids 484–502 of rat Kv4.2. The sequence of the corresponding region of ferret Kv4.2 was identical to that of rat Kv4.2 (M.J. Morales, unpublished observations). The anti–Kv4.3 polyclonal antibody Kv4.3C was raised against a synthetic peptide (SPGPNTNIPSITSN; Protein Chemistry Laboratory, Washington University Medical Center, St. Louis, MO) that matches a unique sequence in the COOH terminus of Kv4.3 that corresponds to amino acids 616–629 of rat Kv4.3 short form and 635–648 of rat Kv4.3 long form. This amino acid sequence is down stream from the 19 amino acid insert in the COOH terminus in the long form of Kv4.3 (Takimoto et al., 1997). This suggests that the Kv4.3 antibody detects both the short and long forms of the Kv4.3α subunits. A cysteine residue was added to the NH2 terminus of each peptide to allow coupling to the keyhole limpet hemocyanin carrier protein, and the coupled peptides were sent to Caltag Laboratories for injection into rabbits. Sera were screened using ELISA assays and the antibody was affinity purified using the Immunopure Antigen/Antibody Immobilization Kit #2 (Pierce Chemical Co.).
Antibody Characterization: Transfected Cells and Immunohistochemistry
The specificity of the Kv1.4 antibody was established in a previous report (Bekele-Arcuri et al., 1996). The specificity of the Kv4.2 and Kv4.3 antibodies was examined in immunohistochemical experiments on Xenopus oocytes expressing Kv4.2 and Kv4.3 channels. The Kv4.2 and Kv4.3 (short form) cDNAs were obtained from Lily Jan (University of California, San Francisco, San Francisco, CA) and Jane Dixon and David McKinnon (SUNY, Stony Brook), respectively. Messenger RNA (Kv4.2, Kv4.3) or distilled H2O was injected into Xenopus oocytes and incubated for 72 h at 22°C in antibiotic containing Barth's solution as previously described (Comer et al., 1994). Two electrode voltage-clamp analysis (Comer et al., 1994) was performed to document the presence of expressed Kv4.2 and Kv4.3 channels. Oocytes expressing Kv4.2 channels were tested with Kv4.2 and Kv4.3 antibodies, and cross-reactivity was assessed by preabsorbing the potential epitopes with Kv4.3 antibody and subsequently incubating with fluorescently labeled anti–Kv4.2 antibody. Similarly, oocytes expressing Kv4.3 channels were tested with Kv4.3 and Kv4.2 antibodies, and cross-reactivity was assessed by preabsorbing the potential epitopes with Kv4.2 antibody and subsequently incubating with fluorescently labeled anti–Kv4.3 antibody. Immunofluorescence on oocytes was performed as follows: oocytes were incubated in blocking buffer containing 5% BSA in TBSN (Tris buffered saline with NP40; 155 mM NaCl, 10mM Tris-Cl, pH 7.4, and 0.1% NP40) for 10–16 h at 4°C, and then washed 3 × 5 min in TBSN at room temperature. Oocytes expressing Kv4.2 and Kv4.3 were incubated with Kv4.2- and Kv4.3-specific primary antibodies (1:100), respectively, diluted in blocking buffer (indirect IF assay); another set of Kv4.2- and Kv4.3-expressing oocytes were separately incubated with anti–Kv4.2 and –Kv4.3 antibodies (1:100) diluted in blocking buffer as a preabsorption step. Both of these incubations were carried out at 4°C for 10–16 h. The oocytes were washed 5 × 5 min in TBSN. The first set of oocytes incubated with the respective primary antibodies were subsequently incubated with the secondary antibody, anti–rabbit IgG (1:200) conjugated with FITC at room temperature for 6 h. A second set of oocytes preabsorbed with anti–Kv4.2 or –Kv4.3 antibody were incubated with FITC-labeled anti–Kv4.2 antibody (Kv4.2-expressing oocytes) or FITC-labeled anti–Kv4.3 antibody (Kv4.3-expressing oocytes) for 10–16 h in the dark at 4°C (direct IF assay). The oocytes were then washed 5 × 10 min in TBSN, dehydrated in 100% methanol, and subsequently treated with BA:BB (one part benzyl alcohol to two parts benzyl benzoate) cleaning solution, mounted, and scanned using a confocal microscope (see below).
Western Blot Analysis
Cardiac membrane proteins were prepared using a slight modification of the protocol previously described by Barry et al. (1995). In brief, protein preparations were obtained from strips of tissue dissected from ferret LV epicardial and endocardial regions (exactly as described above for myocyte isolation). All procedures were conducted at 4°C and all solutions contained the following protease inhibitors: iodoacetamide (0.6 mM), 1,10 phenanthroline (0.5 mM), benzamidine (0.5 mM), leupeptin (0.15 μM), pefebloc (0.5 mM), aprotinin (2 μg/ml), and pepstatin (1 μM). The tissue strips were homogenized using a polytron (Brinkmann Instruments, Inc.) in 10 vol of 0.25 M sucrose buffer (whole tissue homogenate), followed by centrifugation at 1,075 g for 10 min (to remove nuclei and cellular debris). The pellet was used to prepare cytosolic- and particulate-enriched fractions as described by Storrie and Madden (1990) and Dignam (1990). The supernatant was centrifuged at 105,000 g for 1 h at 4°C. The crude membrane pellet was suspended in Tris-EDTA (TE) buffer, and then centrifuged at 60,000 g for 30 min. The pellets were suspended in TE buffer containing 0.6 M KI, incubated on ice for 15 min, and then centrifuged again at 60,000 g for 30 min, washed once with TE buffer and centrifuged at 60,000 g. The pellets were resuspended in TE buffer containing 2% deoxycholate and incubated on ice for 1 h. Insoluble materials were removed by centrifugation at 13,175 g for 20 min and the supernatant was aliquoted and used for immunoblot analysis.
Protein concentration was measured using a standard BCA method (Pierce Chemical Co.) and 50 μg of membrane protein with appropriate protein markers were run on SDS PAGE gel (10%), followed by transfer to Hybond-P PVDF membrane (Amersham Corp.). After incubation with PBS-T (0.1% Tween20 in PBS) buffer containing 10% nonfat dry milk powder, the membranes were washed once in PBS-T for 5 min and incubated with appropriate primary antibodies (anti–Kv1.4, 4.2, and 4.3 antibodies). After incubation, the membranes were washed 3 × 5 min and incubated in horseradish peroxidase–conjugated secondary antibody (anti–mouse or –rabbit IgG). Then, the membranes were washed 5 × 10 min, incubated in ECL solution (Amersham Corp.), exposed to film and developed.
Fluorescent In Situ Hybridization
Techniques for FISH were performed essentially as previously described by Brahmajothi et al. (1996). Ferret hearts were perfused (Langendorff apparatus) with 4% paraformaldehyde in PBS. Regions of interest were postfixed, incubated in 40% sucrose in PBS, and subsequently embedded in ornithine carbamyl transferase medium and frozen. Blocks were sectioned using a cryotome (2800E; Leica-Jung Frigocut) at a thickness of 6–7 μm and laid out on gelatin-coated slides. The sections were then postfixed in paraformaldehyde and incubated in prehybridization and hybridization buffer with specific sense and antisense oligonucleotide probes labeled with biotin or digoxigenin. The sections were incubated at 42°C for 16–24 h. After hybridization washes, detection of transcript was carried out using streptavidin–phycoerythrin or antidigoxigenin antibody conjugated with FITC. Hybridization signals from troponin I cardiac (TnIC) antisense probe was used as positive control and TnIC, Kv1.4, Kv4.2, and Kv4.3 sense probes were used as negative controls. The fluorescent signals were scanned using an inverted confocal microscope (LSM 410; Carl Zeiss, Inc.) as detailed below.
Immunofluorescence
Techniques for IF were performed essentially as described by Brahmajothi et al. (1997). Postfixed cryosections were initially blocked with 10% goat serum, washed once with PBS, and incubated with anti–Kv1.4 (1:1,500), anti–Kv4.2 (1:100), and anti– Kv4.3 (1:50) antibodies for 1 h, and then washed with PBS. For indirect IF, the sections were incubated with anti–mouse or –rabbit IgG conjugated with fluorescein isothiocyanate, tetramethyl rhodamine thiocarbamoyl, or sulfonated 7-amino-4-methyl coumarin-3 acetic acid. Colocalization studies were preformed by direct IF; anti–Kv1.4, 4.2, and 4.3 antibodies were directly conjugated with the above fluorochromes. Antimyosin antibody was used as a positive control. Sections incubated (a) without primary antibodies or (b) preabsorbed primary antibodies (anti– Kv1.4, 4.2, and 4.3 antibodies previously incubated with myocytes) were used as negative controls. To demonstrate the localization patterns within isolated myocytes, cells were stained with DiIC18 (dioctadecyl 3,3,3′,3′ tetramethyl indocarbo cyanine) and propidium iodide markers that label the sarcolemma and nucleus, respectively. The antibody binding and staining patterns in isolated myocytes were analyzed by taking 1 μm optical Z sections through the cells. Fluorescence was detected using an inverted confocal microscope equipped with ArKr, HeNe, and HeCd laser beams under appropriate excitation and emission wavelengths for each fluorochrome.
Interpretive Limitations of IF Results
Fluorescence intensities.
For numerous reasons (i.e., monoclonal [Kv1.4] versus polyclonal [Kv4.2, Kv4.3] antibodies employed, possible differences in number, accessibility, and affinity of targeted epitopes, etc.), a direct quantitative comparison of fluorescence intensities between each of the individual antibodies employed (to estimate and/or compare absolute Kv1.4, Kv4.2, and Kv4.3 α subunit protein expression levels) was precluded. We therefore wish to emphasize that the specific immunoreactivities/fluorescent intensities that were obtained for any one specific α subunit cannot be quantitatively compared with those obtained for another α subunit type; only qualitative and/or relative comparisons of individual α subunit protein levels are valid. IF profiles for individual proteins within transverse sections across the ventricular wall (see Fig. 7) were analyzed by confocal microscopy, and for comparative purposes the relative fluorescent intensity values of each α subunit protein were normalized to the maximum fluorescence obtained for that α subunit (i.e., maximum relative intensity = 100%).
Figure 7.
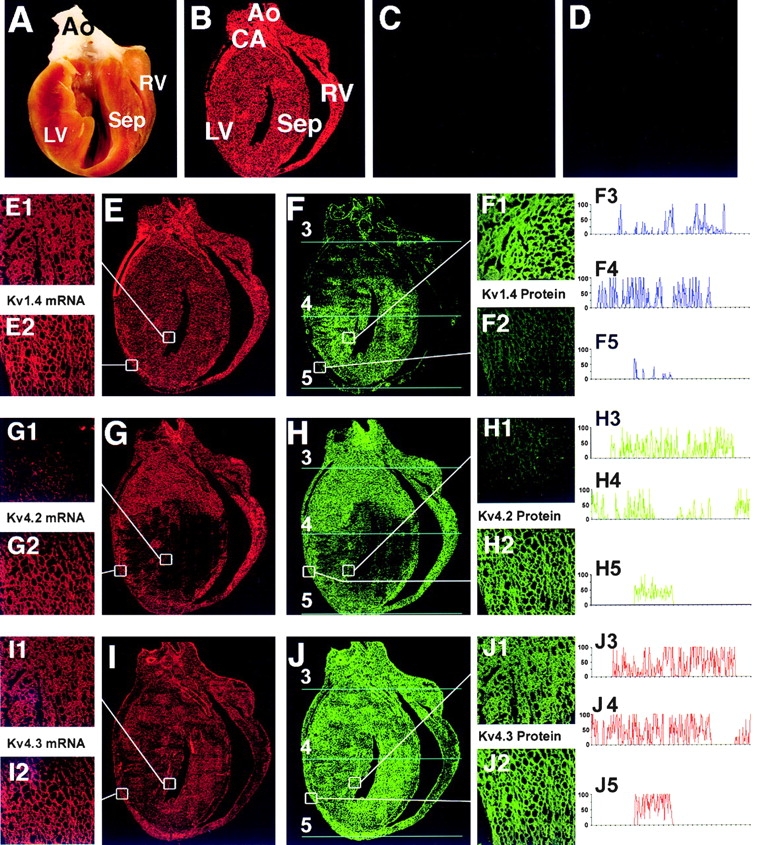
Ferret ventricular sagittal section analysis: comparison of Kv1.4, Kv4.2, and Kv4.3 α subunit mRNA transcript (FISH; red fluorescence) and protein (indirect IF; green fluorescence) expression levels. Results obtained from adjacent sagittal sections (7-μm thickness). (A) Photographic view of a sagittal cut made through the ferret heart. Note that in all subsequent panels of whole sagittal sections that the atria have been removed for illustrative purposes. AO, aorta; CA, coronary artery; Sep, septum; LV, left ventricle; RV, right ventricle. (B and C) FISH: (B) positive control signal to TnIc (Brahmajothi et al., 1997) antisense probe and (C) negative control signal to TnIc sense probe. (D) Indirect IF: negative control signal for Kv4.2/4.3 in response to application of secondary antibody (fluorochrome-conjugated anti–rabbit IgG) in the absence of primary antibodies. Similar results (not shown) were obtained for Kv1.4 after application of fluorochrome-conjugated anti–mouse IgG in the absence of primary antibody. E, G, and I are FISH results and F, H, and J are IF results. Smaller numbered panels correspond to enlarged sections (60×) taken from selected LV epi and LV endo regions indicated by the white boxes. (E, G, and I) FISH: mRNA transcript expression patterns. (E, E1, and E2) Kv1.4 mRNA, (G, G1, and G2) Kv4.2 mRNA, and (I, I1, and I2) Kv4.3 mRNA. (F, H, and J) Indirect IF: α subunit protein expression patterns. (F, F1, and F2) Kv1.4 protein, (H, H1, and H2) Kv4.2 protein, and (J, J1, and J2) Kv4.3 protein. Note that, while there is a general correspondence between both Kv4.2 and Kv4.3 mRNA and protein expression levels, Kv1.4 mRNA and protein levels do not correlate; i.e., Kv1.4 mRNA is nearly uniformly expressed (E, E1, and E2), but Kv1.4 protein is mainly expressed in apical LV endo and septum and is essentially absent from LV epi and RV. (F3–F5, H3–H5, and J3– J5) Relative fluorescent intensity profiles of Kv1.4 antibody (F3–F5), Kv4.2 antibody (H3–H5), and Kv4.3 antibody (J3–J5) measured transversely from the indicated basal, midventricular, and apical regions (cyan lines 3–5, respectively, in F, H, and J). For comparative purposes, the relative fluorescent intensity values for each α subunit protein were normalized to the relative maximum fluorescence obtained for that given α subunit (i.e., maximum relative intensity, 100%; minimum; 0%; see methods). Please note the marked variations in relative intensity profiles measured from each transverse section.
Ito α subunit protein localization to specific cardiac cell types.
The IF results presented on enzymatically isolated LV epi versus LV endo myocyte preparations (see Fig. 6 and Table II) measure Kv1.4, Kv4.2, and Kv4.3 α subunit protein expression levels within specific myocyte types. As will be described, these measurements indicate marked heterogeneous expression levels of these three α subunits between LV epi versus LV endo myocytes. These heterogeneous myocyte α subunit expression levels will contribute to net IF patterns obtained from intact ventricular tissue sections. However, in ventricular tissue Kv1.4, Kv4.2, and/or Kv4.3 α subunits may be expressed not only in myocytes but also in numerous nonmyocyte cell types, including fibroblasts, endothelial cells, smooth muscle cells, and neurons. To date, we have not analyzed the distribution of candidate Ito α subunit expression levels in these various nonmyocyte cell types. We therefore wish to emphasize that the IF patterns obtained from sagittal sections of ventricular tissue (see Figs. 7 and 8) cannot at present be attributed exclusively to Kv1.4, Kv4.2, and/or Kv4.3 α subunit protein expression within myocytes.
Figure 6.

Representative selected examples of IF of Kv4.2 (C1–C6), Kv4.3 (D1–D6), and Kv1.4 (E1–E6) α subunit protein expression in successive optical z sections of myocytes isolated from ferret LV epi (C and D; green, FITC) and LV endo (E; red, tetramethyl rhodamine thiocarbamoyl) regions. For controls, dioctadecyl 3,3,3′,3′ tetramethyl indocarbo cyanine (DiIC18; A1–A6; orange) and propidium iodide (B1–B6, red) were used as markers to label the sarcolemmal membrane and nucleus, respectively. Digitized fluorescent images were obtained using confocal microscopy of 1-μm thick optical z sections successively taken through the width of each myocyte; every third section is shown. Note (a) the localization of fluorescence to the sarcolemmal regions for DiIC18 and the three antibodies, and (b) the absence of fluorescence in the nuclei for all three antibodies. See text and Table II for further details.
Table II.
Kv1.4, Kv4.2, and Kv4.3 K+ Channel α Subunit mRNA Transcript and Protein Expression in Myocytes Enzymatically Isolated from Specific Epicardial and Endocardial Regions of the Ferret Left Ventricle
| Expression | α subunit(s) | Left Ventricular Myocytes | ||||
|---|---|---|---|---|---|---|
| Percent epicardial | Percent endocardial | |||||
| Transcript by FISH | Kv 1.4 | 88.1 ± 1.7 | 94.3 ± 0.5 | |||
| Kv 4.2 | 69.6 ± 1.4 | 38.6 ± 2.1 | ||||
| Kv 4.3 | 66.7 ± 1.6 | 48.3 ± 1.9 | ||||
| Protein by IF | Kv 1.4 | 3.9 ± 1.1 | 57.9 ± 2.8 | |||
| Kv 4.2 | 56.8 ± 1.7 | 21.2 ± 2.4 | ||||
| Kv 4.3 | 45.3 ± 1.8 | 34.6 ± 1.3 | ||||
| Protein colocalization by IF | Kv 1.4 + Kv 4.2 | 1.8 ± 1.1 | 10.3 ± 1.7 | |||
| Kv 1.4 + Kv 4.3 | 1.2 ± 1.0 | 6.4 ± 2.3 | ||||
| Kv 4.2 + Kv 4.3 | 23.6 ± 0.6 | 12.1 ± 1.2 | ||||
No. of ferrets tested, 7; No. of cells counted, 500/region. Data summarized as mean percentage of myocytes displaying a detectable fluorescence signal.
Figure 8.
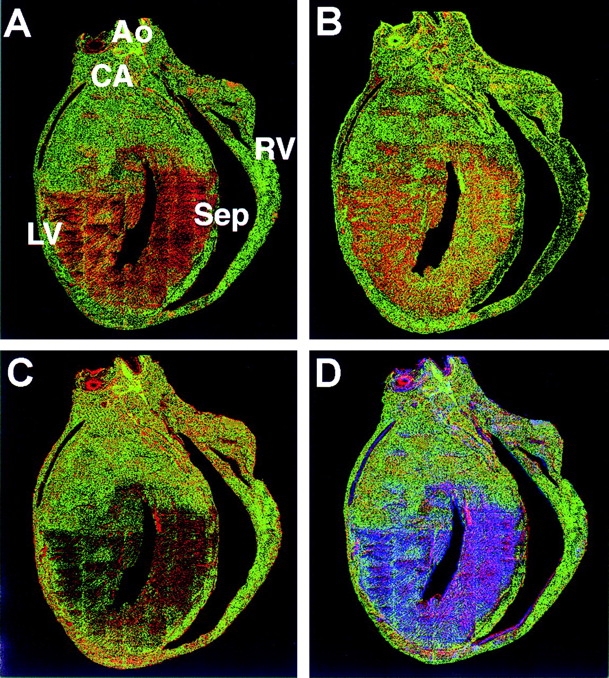
Ferret ventricular sagittal section analysis: colocalization and distribution of Kv1.4, Kv4.2, and Kv4.3 α subunit proteins determined using direct IF. Representative colocalization data obtained from adjacent (7-μm thick) sections. AO, aorta; CA, coronary artery; Sep, septum. (A) Kv1.4 (red) + Kv4.2 (green) colocalized (yellow to orange) mainly in the apical LV endo and septum. (B) Kv1.4 (red) + Kv4.3 (green) also colocalized (yellow to orange) mainly in the apical LV epi and septum; however, there were also relatively more dispersed regions of colocalization in the basal LV and septal regions. (C) Kv4.2 (green) + Kv4.3 (red) displayed relatively marked colocalization (yellow to red) in the apex, LV endo, and the basal region of the LV, while there was relatively little colocalization in the apical region of the RV. (D) Overall distribution patterns of Kv1.4 (blue), Kv4.2 (green), and Kv4.3 (red) α subunit proteins. Colocalization of Kv4.2 + Kv4.3, yellow to orange; Kv1.4 + Kv4.3, purple to pink.
results
Basic Observations: Calcium-independent Ito Phenotypes Are Present in both Left Ventricular Epicardial and Endocardial Myocytes
Under our recording conditions (Na+- and Ca2+-free saline, 500 μM CdCl2; see methods) in both ferret LV epi and LV endo myocytes, calcium-independent transient outward potassium currents could be routinely recorded in response to depolarizing voltage clamp steps. Representative examples of these transient outward currents in both LV epi and LV endo myocytes in response to either 500- (LV epi) or 1,000-ms (LV endo) depolarizing clamp pulses applied from a holding potential (HP) of −70 mV are illustrated in Fig. 1, A and B. On initial inspection, the transient outward currents in both myocyte types displayed somewhat similar basic macroscopic gating characteristics: both activated very rapidly (within milliseconds, with activation of the peak LV endo current being generally faster, resulting in its peak being frequently obscured due to overlap with the capacitive transient), and then displayed a slower phase of macroscopic inactivation to a final steady state level (i.e., a noninactivated sustained component). Additional measurements (data not shown) wherein the [K+]o was varied (1–100 mM) indicated that the amplitude of the transient components of these two currents was indeed a function of [K+]o, verifying that they were K+ currents. Following the convention established in previous studies (e.g., Antzelevitch et al., 1995; Campbell et al., 1995), we defined the inactivating transient component (i.e., Ipeak − Isustained) of these currents as “Ito.” We will refer to these two calcium-independent Ito phenotypes in ferret LV epi and LV endo myocytes as Ito,epi and Ito,endo, respectively.
Figure 1.

Representative examples of Ito phenotypes in ferret LV epi (A) and LV endo (B) myocytes. Currents elicited in response to either (A) 500- or (B) 1,000-ms voltage-clamp step pulses applied from a HP of −70 mV to the indicated potentials (10-mV increments). Pulse frequency: (A) LV epi, 0.167 Hz; (B) LV endo, 0.05 Hz. (C1) Comparison of mean current density–voltage (I–V) relationships for both Ito phenotypes (−60 to +70 mV) and the inwardly rectifying K+ current, IK1 (−80 to −120 mV), in ferret LV epi (○) and LV endo (♦) myocytes. Currents elicited in response to either 500- (LV epi) or 1,000-ms (LV endo) depolarizing voltage-clamp steps applied from a HP of −70 mV. Pulse frequency: LV endo, 0.167 Hz; LV epi, 0.05 Hz. Ito was defined as: Ito,epi = Ipeak − I500 ms; Ito,endo = Ipeak − I1000 ms. Data points for IK1 correspond to the peak inward current in response to 500-ms hyperpolarizing voltage clamp pulses applied from −80 to −120 mV. Data points mean values of: LV epi Ito and IK1, seven myocytes; LV endo Ito (−60 to +70 mV), seven myocytes; and LV endo IK1 (−80 to −120 mV), six myocytes. (C2) Mean LV endo I–V relationship plotted on an expanded scale.
Electrophysiological Characterization of Left Ventricular Myocyte Ito,epi and Ito,endo Phenotypes
Current density and current–voltage relationships.
There were no significant differences between LV epi versus LV endo myocytes in either (a) resting membrane potential (measured in control solution before establishing voltage clamp; LV epi, Vm = −72.5 ± 0.7 mV, n = 9; LV endo, −72.6 ± 0.6 mV, n = 10) or (b) density of the inwardly rectifying K+ current, IK1 (measured in response to 500-ms hyperpolarizing voltage clamp pulses applied to −80 to −120 mV). However, as illustrated in Fig. 1, C1 and C2, there were significant differences in both activation thresholds and mean peak current–voltage relationships between Ito,epi (defined as Ipeak − I500 ms, n = 7) and Ito,endo (defined as Ipeak − I1000 ms, n = 6). Ito,epi activated at −10 to 0 mV and had a peak density at +20 mV of +4.03 ± 0.52 pA/pF. In contrast, Ito,endo activated at −30 to −20 mV and had a much lower peak current density at +20 mV of +0.77 ± 0.16 pA/pF.
To further quantify activation characteristics, attempts were made to measure steady state activation relationships using a conventional saturating tail current protocol (see Campbell et al., 1993a). This protocol could be successfully applied to LV Ito,epi, giving a mean activation curve that could be well described as a single Boltzmann relationship (V1/2 = +22.5 mV, slope factor [k] = 7.95 mV, n = 5; data not shown). Unfortunately, the deactivation kinetics of Ito,endo tail currents were too rapid and the tails too small (i.e., obscured by the capacitive transient) to allow for resolution and construction of an activation relationship.
Inactivation.
The mean steady state inactivation relationships for Ito,epi (n = 7) and Ito,endo (n = 8) are illustrated in Fig. 2 A (protocols illustrated in inset). Steady state inactivation relationships for both Ito phenotypes could be well described as single Boltzmann relationships. However, there were significant differences among the two inactivation relationships in both V1/2 and k values (Ito,epi: V1/2 = −9 mV, k = 5.45 mV; Ito,endo: V1/2 = −34 mV, k = 8.05 mV).
Figure 2.

(A) Mean steady state inactivation relationships for Ito phenotypes in ferret LV epi and LV endo myocytes. Voltage-clamp protocol illustrated in inset: HP of −70 mV; P1, indicated potentials for either 500 (LV epi, ▴) or 1,000 ms (LV epi, ○; LV endo, •); P2, +50 mV for either 500 or 1,000 ms. Pulse protocol frequency: LV epi, 0.167 Hz; LV endo, 0.05 Hz. Inactivation curves were constructed by normalizing the control P2 Ito amplitude (i.e., peak Ito at +50 mV with no P1 prepulse) with respect to each P2 Ito after a P1 prepulse to the indicated potentials (−100 to +50 mV). Mean data points (LV epi, seven myocytes for P1 = 500 ms; nine myocytes for P1 = 1,000 ms; LV endo, eight myocytes) have been fit with single Boltzmann relationships with the following parameters: LV epi (for P1 = 500 and 1,000 ms), V1/2 = −9 mV, k = 5.45 mV; LV endo, V1/2 = −34 mV, k = 8.05 mV. (B) Representative examples of fully activated Ito macroscopic inactivation kinetics at +50 mV. Representative Ito waveforms from an LV epi and LV endo myocyte have been overlaid and their relative peaks normalized for ease of comparison. Ito,epi fit with a single exponential with τ = 70.3 ms; Ito,endo fit with two exponentials, with τ1 = 101.1 ms, τ2 = 552.8 ms, ratio of initial amplitudes A1/(A1 + A2) = 0.535. (Inset) The mean (nine myocytes) time constants of Ito,epi macroscopic inactivation are essentially independent of voltage over the potential range where the current is fully activated; i.e., depolarized above approximately +20 mV.
To determine the kinetics of macroscopic inactivation, the declining phases of the two LV Ito phenotypes were analyzed. Inactivation of Ito,epi was well described as a single exponential (Fig. 2 B), with a mean time constant at +50 mV of 75.7 ± 4.8 ms (n = 9). Inactivation time constants became essentially independent of membrane potential depolarized above +20 mV (Fig. 2 B, inset). In contrast, the kinetics of inactivation of Ito,endo at potentials depolarized above +30 mV required two exponentials for an adequate fit (Fig. 2 B), with mean time constants at +50 mV of τ1 = 80.3 ± 9.7 ms and τ2 = 466.4 ± 128.5 ms (ratio of relative initial amplitudes A1/[A1 + A2] = 0.653 ± 0.075). However, in the less depolarized range of potentials (−10 to +30 mV), it was difficult or impossible to obtain reliable double exponential fits (see Clark et al., 1988), thereby precluding a more quantitative analysis.
Kinetics of recovery.
The kinetics of recovery from inactivation of the two LV Ito phenotypes were determined at a HP of −70 mV using a conventional double pulse protocol (Fig. 3 A2, inset). In the majority of LV epi myocytes (n = 7/9, 78%), recovery was rapid (Fig. 3 A1) and could be well described as a single exponential with a mean τrec = 51.2 ± 2.8 ms (n = 7; Fig. 3 A2). In two additional LV epi myocytes, there was a major fast component of recovery (accounting for 90 and 95% recovery within 200–250 ms), followed by a slower phase (on the order of hundreds of milliseconds), with recovery being complete within 2–3 s (data not illustrated). In contrast, in the majority of LV endo myocytes (n = 8/11, 73%), recovery was quite slow (Fig. 3 B1) and could be reasonably described as a single exponential with a mean τrec = 3,001.8 ± 447.1 ms (Fig. 3 B2). However, in three LV endo myocytes, recovery was rapid (single exponential, τrec = 66.7 ± 3.4 ms; data not shown); i.e., comparable to Ito,epi. In summary, while in the majority of LV epi and LV endo myocytes studied there was a clear distinction between “pure” rapid recovery (Ito,epi) versus “very slow” recovery (Ito,endo), this kinetic differentiation was not absolute. However, in no instance was an exclusively “very slow recovery” pattern ever observed in an LV epi myocyte.
Figure 3.

Representative Ito phenotype recovery waveforms recorded from a ferret LV epi (A1) and LV endo (B1) myocyte. Double pulse recovery protocol (A2, inset): HP of −70 mV, P1 = P2 = +50 mV, 500 ms for LV epi, 500 or 1,000 ms for LV endo). Please note the difference in time scales. Pulse protocol frequency: LV epi, 0.125 Hz; LV endo, 0.05 Hz. Individual recovery waveforms fit with single exponentials with indicated time constants. Summarized mean kinetics of recovery from inactivation at a HP of −70 mV for LV epi myocytes (A2, n = 7) and LV endo myocytes (A2, n = 8; data points at any given interpulse interval Δt correspond to mean values from three to eight myocytes). Recovery curves were constructed by taking the ratio of (P2 Ito)/(P1 Ito) as a function of interpulse interval Δt. For comparative purposes, and to account for variability in degree of incomplete inactivation of LV endo Ito at the end of the P1 pulse, the pooled LV endo (P2 Ito/P1 Ito) current ratios were renormalized with respect to initial and final Δt values (Rasmusson et al., 1995a). Mean recovery curves fit as single exponentials: LV epi, τ = 48 ms; LV endo, τ = 2,441 ms. (C1 and C2) Representative examples of frequency-dependent LV Ito,epi versus Ito,endo gating behavior to 50- (C1) and 100-ms (C2) depolarizing pulse trains applied to +50 mV at a frequency of 5 Hz from a HP of −70 mV. Peak currents have been normalized for illustrative purposes. Note that cumulative inactivation is pronounced in Ito,endo but is absent (50 ms pulse, C1) to minimal (100 ms pulse, C2) in Ito,epi. Similar results were observed in four LV epi and four LV endo myocytes.
Due to these marked differences in recovery kinetics, it would be predicted that cumulative inactivation (e.g., Aldrich, 1981; Clark et al., 1988) would be a prominent characteristic of Ito,endo but not Ito,epi. As predicted, during rapid and repetitive voltage-clamp pulse trains applied to +50 mV (Fig. 3, C1 and C2; protocol details given in inset and legend) the slowly recovering Ito,endo phenotype displayed marked cumulative inactivation while the Ito,epi phenotype did not.
Effects of Heteropoda toxin 2.
Heteropoda toxins (HPTXs) are peptides (30–33 amino acids) isolated from the venom of the spider Heteropoda venatoria. HPTXs block both native Ito channels in rat ventricular myocytes and Kv4.2 channels expressed in Xenopus oocytes; in contrast, HPTXs have no significant effects on expressed Kv1.4 channels (Sanguinetti et al., 1997). To determine whether we could pharmacologically distinguish between ferret LV Ito,epi and Ito,endo, we conducted a preliminary analysis of the effects of HPTX2 (30 amino acid peptide; sequence given in Fig. 2 of Sanguinetti et al., 1997). 150 nM HPTX2 rapidly and reversibly blocked Ito,epi without any significant effects on the sustained current remaining at 500 ms (Fig. 4 A). However, the degree of block was potential dependent, with block being relieved with progressive depolarization. Block decreased from 75.6 ± 5.3% at +10 mV to 21.2 ± 4.8% at +70 mV (n = 3; Fig. 4 B). Assuming a simple single site binding model, the estimated apparent K d for HPTX2 block ranged from 105 nM at +20 mV to 559 nM at +70 mV (Fig. 4 B, inset). In contrast, 150 nM HPTX2, when perfused over a period of 5–7 min, failed to produce any significant block of the major slowly recovering Ito,endo phenotype elicited at +50 mV (Fig. 4 C, n = 2).
Figure 4.


Blocking effects of HPTX2. (A) Voltage dependence of block of ferret LV Ito,epi by 150 nM HPTX2. Mean data from three LV epi myocytes. For illustrative purposes, peak Ito,epi amplitudes have been normalized to their control peak value at +70 mV. HPTX2 reversibly blocked Ito,epi without any significant effects on the sustained noninactivating current remaining at 500 ms. (Inset) Ito,epi waveforms before (solid lines) and after (dashed lines) 150 nM HPTX2 (+10, +30, +50, and +70 mV; HP, −70 mV; frequency, 0.125 Hz). (B) Potential dependence of HPTX2 block of peak LV Ito,epi. Mean data over the potential range +10 to +70 mV obtained from the same three myocytes in A. Data fit: percent block peak Ito,epi = 92.4911 exp(−0.02096[mV])%. (Inset) Points: derived apparent K ds calculated from mean data points in B assuming a saturable simple single binding site model. Fit: K d,V = 54.944 exp(0.03382[mV]) nM. (C) 150 nM HPTX2 does not produce any significant block of the major slowly recovering Ito phenotype in ferret LV endo myocytes. Representative recording from a ferret LV endo myocyte. Each data point corresponds to the peak Ito,endo elicited during a 1,000-ms voltage clamp pulse to +50 mV (HP, −70 mV; frequency, 0.05 Hz). Numbered data points correspond to representative currents illustrated in inset. Calibration bars: 150 pA, 200 ms. In contrast to its rapid blocking effects on Ito,epi, 150 nM HPTX2 failed to produce any significant block of Ito,endo during a perfusion period of ∼7 min.
A comparative summary of the gating characteristics of the two major Ito phenotypes in ferret LV epi and LV endo myocytes is presented in Table I. This table also summarizes the characteristics of the rapidly recovering Ito phenotype in ferret RV myocytes (Campbell et al., 1993a). While there are quantitative differences in specific gating characteristics among RV and LV epi Ito phenotypes (e.g., τs of inactivation, recovery), overall these two current systems are very similar.
Table I.
Summarized Kinetic Characteristics of the Two Major Ito Phenotypes in Ferret Left Ventricular Endocardial and Epicardial Myocytes and the Rapidly Recovering Ito Phenotype in Ferret Right Ventricular Myocytes* ‡
| LV Endo | LV Epi | RV | ||||
|---|---|---|---|---|---|---|
| Density | ||||||
| (pA/pF; +20 mV) | +0.77 ± 0.16 | +4.03 ± 0.52 | ∼+4.0 | |||
| Activation | ||||||
| Threshold (mV) | −30 to −20 | −10 to 0 | −10 to 0 | |||
| V1/2 (mV) | — | +22.5 | +22.5 | |||
| k (mV) | — | 7.95 | — | |||
| Inactivation | Double exponential | Single exponential | Single exponential | |||
| V1/2 | −34 | −9 | −13.5 | |||
| k (mV) | 8.05 | 5.45 | 5.6 | |||
| τ1,+50 mV (ms) | 80.3 ± 9.7 | 75.7 ± 4.8 | 47 ± 10 | |||
| τ2,+50 mV (ms) | 466.4 ± 128.5 | — | — | |||
| A1/(A1 + A2) | 0.653 ± 0.075 | — | — | |||
| Cumulative inactivation | Pronounced | Minimal | Minimal | |||
| Recovery | ||||||
| τrec (−70 mV) (ms) | 3002 ± 447 | 51.2 ± 2.6 | ∼30 | |||
| HPTX2 block | Insensitive | Sensitive | — |
RV myocyte data from Campbell et al. (1993a). RV myocytes were isolated from 10–16-wk-old male ferrets and from the entire free wall of the RV.
Total divalent cation concentrations: LV epi and LV endo myocytes, 2.8 mm (2.3 Mg2+, 0.5 Cd2+); RV myocytes, 4 mm (1 Mg2+, 2.5 Ca2+, 0.5 Cd2+).
Distribution of Candidate Ito α Subunits in Isolated Left Ventricular Epicardial and Endocardial Myocytes
The rapidly inactivating Kv1.4, Kv4.2, and Kv4.3 clones have all been recently proposed to form the molecular basis of the cardiac myocyte calcium-independent Ito (e.g., Po et al., 1993; Comer et al., 1994; Barry et al., 1995; Barry and Nerbonne, 1996; Dixon et al., 1996; Xu et al., 1996; Fiset et al., 1997; Yeola and Snyders, 1997). Therefore, the FISH and IF measurements to be described in the next section were designed to determine whether there was a differential distribution of Kv1.4, Kv4.2, and/or Kv4.3 α subunits between ferret LV epi and LV endo myocytes, and whether such a differential distribution correlated with the two major functional Ito phenotypes described in the preceding sections.
Characterization of Kv1.4, Kv4.2, and Kv4.3 antibodies.
To determine the specificity of the antibodies employed, IF and immunoblot analyses were first performed. IF experiments were performed on Xenopus oocytes injected with K+ channel mRNA or sham-injected with water (Fig. 5, A–I). Oocytes injected with Kv4.2 mRNA (n = 7) only reacted with the Kv4.2 antibody (Fig. 5, D–F), while oocytes injected with the short form of Kv4.3 mRNA (n = 10) only reacted with the Kv4.3 antibody (G–I). Neither antibody stained the sham-injected oocytes (Fig. 5, B and C). Immunoblot analyses for each antibody were then performed on four different protein preparations obtained from ferret LV epicardial and endocardial regions: (a) sarcolemmal membrane enriched fractions (Fig. 5, J–L, lanes 2 and 3), (b) cytosolic-enriched fractions (lanes 4 and 5), (c) particulate-enriched fractions (lanes 6 and 7), and (d) whole-tissue homogenates (lanes 8 and 9). Among the sarcolemmal membrane–enriched fractions, prominent and specific antibody binding patterns were obtained. The Kv1.4 antibody recognized a single specific band at ∼95–100 kD in the LV endo fraction (Fig. 5 J, lane 3); in contrast, there was virtually no reactivity of the Kv1.4 antibody in the LV epi fraction (lane 2). The Kv4.2 antibody specifically recognized a single prominent band at ∼75 kD in the LV epi fraction (Fig. 5 K, lane 2) and a similar but weaker band in the LV endo fraction (lane 3). Finally, the Kv4.3 antibody recognized a single band at ∼75 kD in both LV epi and LV endo fractions (Fig. 5 L, lanes 2 and 3). In combination with earlier results (Bekele-Arcuri et al., 1996; Takimoto et al., 1997), our IF and immunoblot data strongly suggest that the three antibodies employed detect and specifically bind to Kv1.4, Kv4.2, and Kv4.3 α subunits expressed in ferret LV epi and LV endo tissues. These results also suggest that the majority of α subunit proteins detected by the antibodies are located at cell surfaces.
Figure 5.

Antibody specificity. (A–I) Specificity of the anti– Kv4.2 and –Kv4.3 antibodies determined by immunofluorescent measurements on transfected Xenopus oocytes. (A) Bright field micrograph of a bisected oocyte. (B and C) Sham-transfected oocytes tested with Kv4.2 (B) and Kv4.3 (C) antibodies. (D–F) Specificity of Kv4.2 antibody. Oocytes injected with Kv4.2 mRNA and subsequently tested with Kv4.2 (D), Kv4.3 (E), and Kv4.2 (F) antibody after preabsorption of the oocytes with Kv4.3 antibody. (G–I) Specificity of Kv4.3 antibody. Oocytes injected with Kv4.3 mRNA and subsequently tested with Kv4.3 (G), Kv4.2 (H), and Kv4.3 (I) antibody after preabsorption with Kv4.2 antibody. (J–L) Expression patterns of Kv1.4 (J), Kv4.2 (K), and Kv4.3 (L) determined by immunoblot analysis of proteins isolated from the whole tissue homogenate plus cytosolic, particulate, and sarcolemma membrane-enriched fractions prepared from ferret LV epi and LV endo regions. Fractionated proteins on PVDF membranes were immunoblotted using antibodies for Kv1.4 (1:2,000), Kv4.2 (1:500), and Kv4.3 (1:200). The bound antibodies were then detected using chemiluminescence as described by the manufacturer (Amersham Corp.). Markers are shown in J, lane 1, and immunoblot analysis results using Kv1.4, Kv4.2, and Kv4.3 antibodies on LV epi (J–L, lane 2) and LV endo (J–L, lane 3) sarcolemmal membrane–enriched fractions, LV epi (J–L, lane 4) and LV endo (J–L, lane 5) cytosolic-enriched fractions, LV epi (J–L, lane 6) and LV endo (J–L, lane 7) particulate-enriched fractions, and LV epi (J–L, lane 8) and LV endo (J–L, lane 9) whole-tissue homogenates are shown. In particular, in the sarcolemmal membrane–enriched fractions (J–L, lanes 2 and 3), please note the following antibody-binding patterns: (a) Kv1.4 antibody: a single band at 95–100 kD was obtained from protein prepared from the LV endo region (J, lane 3), but was absent from the LV epi region preparation (J, lane 2); (b) Kv4.2 antibody: a single band at ∼70–75 kD was obtained from protein prepared from both the LV epi (K, lane 2) and LV endo (K, lane 3) regions, but was more prominent in the LV epi preparation; and (c) Kv4.3 antibody: an intense single band at ∼75 kD was obtained from protein prepared from both LV epi (L, lane 2) and LV endo (L, lane 3) regions and was of similar intensity in both preparations.
Isolated myocyte analysis.
To determine specific antibody binding patterns to isolated LV epi and LV endo myocytes, confocal microscopy was employed. Binding patterns for each of the three antibodies were determined by measuring fluorescence intensity profiles in successive optical z sections (1-μm thickness) taken through the entire width of each myocyte type. Fig. 6 illustrates a representative series of such optical z sections (every third section is illustrated) measured from isolated LV epi (anti–Kv4.2, C1–C6; anti–Kv4.3, D1– D6) and LV endo (anti–Kv1.4, E1–E6) myocytes. For controls, standard membrane markers for the sarcolemma (DiIC18; Fig. 6, A1–A6) and nucleus (propidium iodide; B1–B6) were used. The fluorescence patterns obtained in the successive optical z sections indicated that binding of all three antibodies was localized to the outer regions of myocytes, thereby suggesting localization to sarcolemmal proteins. In combination with our immunoblot data (Fig. 5), these z section results strongly suggest that sarcolemmally associated Kv1.4, Kv4.2, and/or Kv4.3 α subunits could function as the molecular substrates underlying the two different functional Ito phenotypes in ferret LV epi and LV endo myocytes.
To gain further insights into the distribution and identification of the specific α subunits underlying the Ito,epi and Ito,endo phenotypes, measurements of both (a) mRNA transcripts (FISH; Brahmajothi et al., 1996) and (b) expressed protein (IF; Brahmajothi et al., 1997) using the Kv1.4, 4.2, and 4.3 α subunit–specific antibodies were conducted in parallel on samples of enzymatically isolated LV epi and LV endo myocytes. The results of these measurements are summarized in Table II (mean results from isolated myocyte samples obtained from a total of seven ferret left ventricles; number of myocytes analyzed per sample per anatomical region, 500).
Messenger RNA (FISH) for Kv1.4 was found in the majority of LV epi and LV endo myocytes at a comparable percentage, while mRNA transcript for both Kv4.2 and 4.3 was more abundantly expressed in LV epi than LV endo myocytes. When the percentage of myocytes exhibiting Kv α subunit proteins was analyzed using IF, a different pattern emerged: (a) Kv1.4 protein was expressed in the majority of LV endo myocytes (57.9 ± 2.8%), but was essentially absent in LV epi myocytes; and (b) Kv4.2 and 4.3 were each more predominantly expressed in LV epi (56.8 ± 1.7% and 45.3 ± 1.8%, respectively) than LV endo (21.2 ± 2.4% and 34.6 ± 1.3%, respectively) myocytes. Similarly, when α subunit protein colocalization was analyzed: (a) Kv1.4 + Kv4.2 colocalized more in LV endo (10.3 ± 1.7%) versus LV epi (1.8 ± 1.1%) myocytes, (b) Kv1.4 + Kv4.3 colocalization was small to virtually absent in both myocyte types, and (c) Kv4.2 + Kv4.3 colocalized mainly in LV epi (23.6 ± 0.6%) versus LV endo (12.1 ± 1.2%) myocytes.
In summary, our results indicate that both Kv4.2 and Kv4.3 α subunits are expressed in ferret LV epi and LV endo myocytes, with expression of both being relatively more abundant in LV epi myocytes. In contrast, the Kv1.4 α subunit is abundantly expressed only in LV endo myocytes. Furthermore, while the mRNA transcript levels of both Kv4.2 and Kv4.3 in isolated myocytes correlated in general with the levels of expressed α subunit protein, such a correlation did not exist for Kv1.4.
Distribution of Candidate Ito α Subunits in Intact Ventricular Tissue
In this final section, we extend the parallel FISH and IF measurements described above for isolated LV myocytes to sagittal sections of whole intact ventricular tissue. These measurements were conducted so as to gain initial insights into overall ventricular tissue distribution patterns of Kv1.4, Kv4.2, and Kv4.3 mRNA transcript and expressed α subunit proteins.
Representative parallel FISH and IF results obtained from such ventricular tissue sections are illustrated in Fig. 7. As controls, sagittal sections taken from the ferret ventricle (orientation in Fig. 7, A) were subjected to hybridization with TnIC antisense or sense probes (Fig. 7, B and C). These data demonstrated that the entire sections were competent for FISH assays, and that these assays produced very low background when using the sense probe for TnIC. Similar results were obtained with sense probes derived from Kv1.4, Kv4.2, and Kv4.3 (data not shown). IF obtained using antimyosin antibody also gave results similar to those illustrated in Fig. 7 B (data not shown), demonstrating that these sections were also competent for IF assays. From these measurements, it was concluded that the observed localization patterns were not artifacts of the tissue preparation. Finally, as controls for the indirect IF results, assays conducted with secondary antibodies (fluorochrome conjugated anti–mouse or –rabbit IgG) alone demonstrated that our indirect fluorescent signals were due to specific binding to the primary antibodies (e.g., Fig. 7, D).
Using FISH, Kv1.4 mRNA was abundantly and uniformly expressed throughout all regions of the ferret ventricle (Fig. 7, E, E1, and E2). In contrast, Kv4.2 mRNA was heterogeneously expressed, being prominent in apex, RV, LV epi (from both apex to base), and both basal LV endo and septum, while it was markedly reduced to absent in both apical LV endo and septum (Fig. 7, G, G1, and G2). Kv4.3 mRNA was more uniformly expressed, although it was relatively more abundant in the apex and apical LV epi and was reduced in the RV (Fig. 7, I, I1, and I2). Similar mRNA distribution results for all three α subunits were observed in sagittal sections obtained from a total of seven ferret hearts.
In contrast to the FISH results, indirect IF analysis indicated that Kv1.4 α subunit protein was essentially absent from the RV, the LV epi, and the basal region of the LV, but was uniformly expressed in the apical LV endo and midmyocardium (free wall and septum) (Fig. 7, F, F1, and F2). Kv4.2 α subunit protein was expressed abundantly in the apex, RV, and LV epi (apex and base) and the basal LV endo and septum, but was markedly reduced to absent in the apical LV endo (Fig. 7, H, H1, and H2). Finally, Kv4.3 α subunit protein was more uniformly expressed, although it was relatively low to absent in RV and relatively more abundant in the apex and LV epi compared with LV endo (Fig. 7, J, J1, and J2). Therefore, similar to the isolated myocyte studies, results from the ventricular sections indicate that there was a general correspondence between differential Kv4.2 and 4.3 mRNA transcript levels and expressed α subunit proteins, while such a correspondence did not hold for Kv1.4. A further demonstration of the heterogeneity of the three α subunits across the ventricular wall is shown by the relative fluorescence intensity profiles measured transversely (Fig. 7, cyan lines 3–5) at the indicated basal (F–J, 3), mid-ventricular (F–J, 4) and apical (F–J, 5) regions.
Representative sagittal section colocalization data for Kv1.4, Kv4.2, and Kv4.3 α subunits obtained using direct IF are illustrated in Fig. 8 for Kv1.4 + Kv4.2 (A: Kv1.4, red; Kv4.2, green), Kv1.4 + Kv4.3 (B: Kv1.4, red; Kv4.3 green), and Kv4.2 + Kv4.3 (C: Kv4.2, green; Kv4.3, red; note that in these panels colocalization is represented by a yellow to orange color; refer to legend for details). Fig. 8 D illustrates the colocalization pattern of all three α subunit proteins (Kv1.4, blue; Kv4.2, green; Kv4.3, red). From Fig. 8 D it can be seen that there was a relative abundance of Kv4.2 (green) and Kv4.3 (red) in the epicardial regions and Kv1.4 (blue) in the apical endocardial region of the LV, clearly establishing a regional localization. There was also some colocalization of Kv4.2 + Kv4.3 (yellow to orange) in the epicardial regions and Kv1.4 + Kv4.3 (purple to pink) in the endocardial region of the LV and the septum.
In summary, α subunit protein expression distribution patterns similar to those illustrated in Figs. 7 and 8 were obtained from at least three ferret hearts (Kv4.3, n = 3; Kv1.4 and Kv4.2, n = 6). The general distribution patterns of the three α subunits were as follows: (a) Kv1.4 was localized primarily to the apical portion of the LV septum, LV endo, and approximate inner 75% of the LV free wall; (b) Kv4.2 was localized primarily to RV free wall, epicardial layers of the LV, and the base of the heart; and (c) Kv4.3 was localized primarily to epicardial layers of the LV and base of the heart. Therefore, in the intact ventricle, there is a substantial heterogeneous distribution of Ito α subunits not only from epicardium to endocardium but also from apex to base.
discussion
Single LV Epi and LV Endo Myocyte Electrophysiology
Two distinct Ito phenotypes, which we have designated Ito,epi and Ito,endo, are differentially expressed in ferret left ventricular epicardial (LV epi) and endocardial (LV endo) myocytes. Under our recording conditions (Na+- and Ca2+-free saline, 500 μM Cd2+) Ito,epi and Ito,endo display significant differences in activation, inactivation, and recovery characteristics and sensitivity to block by HPTX2. In combination, these results strongly suggest that Ito,epi and Ito,endo are produced by (at least) two distinct potassium channel α subunits that have different molecular mechanisms governing inactivation and recovery characteristics (e.g., Hoshi et al., 1990, 1991; Choi et al., 1991; Campbell et al., 1995; Rasmusson et al., 1995a). In addition to different underlying α subunits, other (presently uncharacterized) factors may also be contributing to these kinetic differences, including differences in associated β subunits (Rettig et al., 1994; Morales et al., 1995) and homomeric versus heteromeric α subunit assembly (Po et al., 1993; Sheng et al., 1993; Wang et al., 1993; see colocalization IF data summarized in Table II).
Possibly the most functionally significant difference between Ito,epi and Ito,endo resides in their kinetics of recovery from inactivation. In the majority of LV epi and LV endo myocytes studied recovery at a HP of −70 mV was well-described as a single exponential process; however, the mean τrec of Ito,endo was ∼60× slower than Ito,epi. As a result, Ito,endo displays marked cumulative inactivation, while Ito,epi does not. These two major Ito phenotypes will therefore exert significantly different frequency-dependent modulatory effects on action potential morphology and repolarization characteristics. For example: (a) in LV epi myocytes, the predicted effects of reducing Ito,epi should only become prominent at high heart rates; and (b) in LV endo myocytes, the modulatory effects of Ito,endo should be minimal at normal heart rates (due to cumulative inactivation) but could become significant at low rates. In addition, if metabolic factors (e.g., myocyte redox status, second messengers, phosphorylation) are capable of modulating Ito,endo inactivation/recovery characteristics (e.g., Ruppersberg et al., 1991; Roeper et al., 1997), then under certain conditions Ito,endo could become a significant repolarizing current at normal heart rates.
In preliminary action potential (AP) measurements, we have obtained results consistent with these general functional predictions in some ferret LV epi and LV endo myocytes. However, as would be predicted by our IF results, we have also observed significant variability in both AP morphologies and frequency-dependent characteristics (0.2–1 Hz), particularly among LV endo myocytes (D.L. Campbell, unpublished observations). It is therefore important to note that our previous FISH and IF measurements (Brahmajothi et al., 1996, 1997) demonstrated marked heterogeneous expression patterns of multiple potassium channel α subunit mRNA transcripts and proteins within different anatomical regions and myocytes of the ferret heart. In combination with this previous data, our preliminary AP recordings suggest that, in addition to Ito,epi and Ito,endo, other repolarizing currents are also heterogeneously expressed. In conjunction with future current clamp studies on AP morphologies, the kinetic properties of each of these different repolarizing currents need to be quantitatively analyzed before a more realistic understanding of LV epi versus LV endo myocyte repolarization can be achieved.
Isolated Myocyte Immunolocalization Results: Potential Molecular Substrates of Ito,epi and Ito,endo
Our immunolocalization data on isolated LV epi and LV endo myocytes (Fig. 6 and Table II) clearly indicate a correlation between the expression patterns of Kv1.4, 4.2, and 4.3 α subunits and the two major functional LV myocyte Ito phenotypes. Specifically, our data strongly suggest that Kv4.2/4.3 α subunits largely underlie Ito,epi, and Kv1.4 α subunits largely underlie Ito,endo. This hypothesis is further strengthened by the fact that both Ito,epi and expressed Kv4.2/4.3 α subunits (e.g., Tseng et al., 1996; Yeola and Snyders, 1997) display rapid (although not identical) recovery kinetics, while both Ito,endo and expressed Kv1.4 α subunits (e.g., Comer et al., 1994; Rasmusson et al., 1995a) display very slow (although not identical) recovery kinetics with marked cumulative inactivation.
While exclusively rapid versus exclusively slow recovery patterns are the dominant phenotypes in ferret LV epi versus LV endo myocytes, there was a subpopulation of both (a) LV endo myocytes (27%; n = 3/11) that displayed rapid single exponential recovery kinetics and (b) LV epi myocytes (22%; n = 2/9) that displayed an additional slower phase of recovery (on the order of hundreds of milliseconds). The percentage of LV endo myocytes displaying rapid recovery was therefore similar to the sum of the percentage of isolated LV endo myocytes displaying colocalization of Kv1.4 + Kv4.2 (10.3 ± 1.7%) and Kv1.4 + Kv4.3 (6.4 ± 2.3%) α subunits. In contrast, the percentage of LV epi myocytes displaying a slower component of recovery was not comparable to the percentage of isolated LV epi myocytes displaying colocalization of Kv1.4 + Kv 4.2 and Kv1.4 + Kv4.3 α subunits. Although caution must be exercised in directly comparing these two sets of data, the similarity does allow for speculation that the coexpression of Kv1.4 and Kv4.2 and/or Kv4.3 α subunits within the same LV endo myocyte may underlie the subpopulation of rapidly recovering Ito,endo phenotypes. At present, our data cannot account for the subpopulation of LV epi myocytes that displayed an additional slow component of recovery. However, in no instance was a “purely slowly recovering” Ito phenotype observed in an LV epi myocyte. This correlates very well with the fact that Kv1.4 protein was virtually absent in isolated LV epi myocytes.
Finally, while to date we have not specifically analyzed Ito α subunit expression in ferret isolated RV myocytes, our IF results on intact ventricular sections (see Interpretive Limitations in methods) have implications for our previous study of the Ito phenotype in ferret isolated RV myocytes (Campbell et al., 1993a,b; see Table I). Ferret RV myocytes almost exclusively express a uniform Ito phenotype with rapid recovery kinetics. The RV Ito phenotype would therefore appear to correlate with the virtual absence of Kv1.4 and the uniformly abundant expression of Kv4.2 α subunits in ferret intact RV tissue. Furthermore, the RV Ito phenotype displays marked closed state reverse-use–dependent block by 4-aminopyridine (Campbell et al., 1993b), a property shared by expressed Kv4.2 channels (e.g., Tseng et al., 1996; Yeola and Snyders, 1997) but not by Kv1.4 channels (e.g., Rasmusson et al., 1995b).
Heteropoda Toxin
Sanguinetti et al. (1997) have reported differential block of expressed Kv1.4 and Kv4.2 channels by HPTXs (Kv1.4, insensitive; Kv4.2, sensitive). These investigators observed that HPTX block of Kv4.2 was relieved with progressive depolarization, while at a fixed potential the dose–response curve could be well-described using a Hill equation formulation with voltage-dependent coefficients ranging from one to two. The effects of HPTXs on Kv4.3 were not determined in this study. However, given the extensive sequence homology in the core region between Kv4.2 and Kv4.3, it is likely that HPTXs would have similar effects on these two α subunits. The results of Sanguinetti et al. (1997), in combination with our HPTX2 results (Ito,epi, sensitive; Ito,endo, insensitive), further strengthens the hypothesis that in ferret LV endo and LV epi myocytes Kv1.4 and Kv4.2/4.3 α subunits, respectively, are the major substrates underlying Ito,endo and Ito,epi.
Ferret Ito,epi and Ito,endo: Comparison with Previous Studies of Native Myocyte Ito Phenotypes in Other Species
The characteristics of the two major Ito phenotypes that we measured in ferret LV epi and LV endo myocytes are very similar to those recently reported for the two major Ito phenotypes in human left ventricular epicardial (Amos et al., 1996; Näbauer et al., 1993, 1996) and endocardial myocytes (Näbauer et al., 1993, 1996), although there are quantitative differences. In both ferret and human LV, the major Ito,epi phenotype is expressed at relatively high current densities, activates and inactivates at relatively depolarized potentials, and recovers rapidly (and hence displays little to no cumulative inactivation). Similarly, in both ferret and human LV, the major Ito,endo phenotype is expressed at relatively low current densities, activates and inactivates at more hyperpolarized potentials, and recovers slowly (and hence displays cumulative inactivation). This raises the possibility that there may be a differential distribution of Kv1.4, 4.2, and/or 4.3 α subunits in human LV epi and LV endo myocytes similar to that which we observe in ferret.
In contrast, Ito phenotypes of both ferret and human LV myocytes appear to differ from those of rabbit and canine ventricular myocytes. In rabbit ventricle, only one major slowly recovering Ito phenotype appears to be dominant but expressed at different densities in epicardial versus endocardial myocytes (Fedida and Giles, 1991). Hence, in rabbit, Kv1.4 may be the dominant α subunit expressed in both epicardium and endocardium. In canine LV, there also appears to be one major expressed Ito phenotype displaying relatively slow recovery kinetics but different levels of expression in LV epi, LV midmyocardial, and LV endo myocytes (e.g., Liu et al., 1993; Antzelevitch et al., 1995). However, it has recently been proposed that Kv4.3 α subunits underlie the canine LV Ito (Dixon et al., 1996). Our results would therefore suggest, at least with regard to the role(s) of multiple and distinct Ito phenotypes in modulation of LV repolarization, that the ferret may provide a better comparative cellular model for the human heart (e.g., Näbauer et al., 1993, 1996) than other more commonly studied species.
FISH and Immunolocalization Results: New Insights, Implications, and Limitations
To conclude, we wish to point out that our parallel FISH and IF results on both isolated LV myocytes (Fig. 5 and Table II) and intact ventricular tissue sections (Figs. 7 and 8) yield additional important insights into presently unrecognized but potentially serious limitations of these techniques as they are now commonly employed. Three potentially very important, and interrelated, implications of our results follow.
Transcript mRNA (FISH) versus expressed protein (IF).
For both Kv4.2 and 4.3, there was a general concordance between the distribution of transcript and α subunit protein in the ferret ventricle. In contrast, for Kv1.4, there was a marked disparity between the distribution of transcript and α subunit protein expression, possibly suggesting the presence of some factor that affects translation of the α subunit; e.g., an ancillary β subunit may be needed for protein assembly and insertion into the sarcolemma (Shi et al., 1996). These very interesting results suggest differences in transcriptional regulation of the different Ito α subunit proteins throughout the heart. However, they also clearly indicate that conclusions on the presence of candidate ion channels and/or α subunits within specific individual myocyte types cannot always be reliably made based solely on measurements of transcript mRNA levels obtained from whole tissue and/or whole heart preparations. Our results suggest that application of specific IF techniques allow for a more accurate analysis of expressed α subunit proteins within specific anatomical regions, important data that can then be directly correlated with functional patch clamp measurements on myocytes isolated from the same specific regions.
Heterogeneous α subunit expression in different LV myocyte types and tissue regions.
Our present data corroborates our previous in situ hybridization results on Kv1.4, 4.2, and 4.3 in isolated myocytes prepared from different anatomical regions of the ferret heart (Brahmajothi et al., 1996). Our new data extend these previous observations by examining, in adjacent sagittal sections, the distribution of several corresponding expressed α subunit proteins. Our present results indicate that, due to significant heterogeneous expression of Ito phenotypes and corresponding α subunits throughout distinct regions of the ventricle (i.e., not only epicardial-to-endocardial but also apical-to-basal; Figs. 7 and 8), very careful attention must be paid to the exact anatomical region from which tissue and/or isolated myocyte samples are taken for analysis.
Intact ventricular tissue results: myocyte versus nonmyocyte Ito α subunit expression.
While analysis of protein distribution within individual myocyte types is important for the ultimate identification of the molecular substrates underlying currents within that particular myocyte type, analysis of the distribution of Kv α subunit proteins in tissue sections provides important information concerning the distribution of the different Kv α subunits throughout the ventricular wall. Such information is important since in the intact heart the net process of repolarization results from the overall distribution patterns of multiple potassium channel α subunit proteins expressed throughout the entire ventricular myocardium. However, as discussed (see Interpretive Limitations in methods), whole-tissue IF analysis suffers from the complications of potential α subunit protein expression in various nonmyocyte cell types. For this reason, we can not at present attribute the fluorescence signals obtained from the intact ventricular sagittal sections (Figs. 7 and 8) exclusively to Ito α subunit protein expression in myocytes. Nonetheless, our IF results on isolated LV epi versus LV endo myocytes (Fig. 6 and Table II) clearly demonstrate heterogeneous expression gradients of Kv1.4, 4.2, and 4.3 α subunits that essentially parallel those observed across the intact LV wall. These results indicate that heterogeneous myocyte α subunit expression gradients are significantly contributing to the net LV epicardial-to-endocardial fluorescence signals measured in the sagittal tissue sections. Our sagittal section IF results would therefore suggest that the distribution of multiple Ito phenotypes in the mammalian heart, and their potential effects upon net repolarization characteristics, may be significantly more complicated than presently suspected.
Conclusions
In conclusion, our results demonstrate (a) the presence of (at least) two major functionally distinct Ito phenotypes in ferret LV epi and LV endo myocytes, (b) distinct heterogeneous expression patterns (both epicardial-to-endocardial and apical-to-basal) of Kv1.4, 4.2, and 4.3 α subunits in ferret intact LV tissue, and (c) a parallel α subunit expression gradient at the level of isolated LV epi and LV endo myocytes, thereby strongly suggesting that Kv4.2/4.3 α subunits largely underlie Ito,epi, and Kv1.4 α subunits largely underlie Ito,endo.
Acknowledgments
The authors thank Janice Del Mar and Michael Sanguinetti for providing us with HPTX2, J.O. McNamara, Sr., for use of equipment, and R.A. Caldwell for evaluating Kv4.2 and Kv4.3 expression in Xenopus oocytes.
This work was supported in part by National Heart, Lung, and Blood Institute grants 54314, 52874, and 19216 and National Institutes of Health equipment grant BIR-9318118.
Abbreviations used in this paper
- AP
action potential
- FISH
fluorescent in situ hybridization
- HP
holding potential
- HPTX
Heteropoda toxin
- IF
immunofluorescent
- LV endo
left ventricular endocardial
- LV epi
left ventricular epicardial
- RV
right ventricular
- TnIC
troponin I cardiac
Footnotes
R.L. Rasmusson's present address is Department of Medicine, Allegheny University of the Health Sciences, Pittsburgh, PA 15212. D.L. Campbell's, M.V. Brahmajothi's, M. Morales's, and H.C. Strauss's present address is Department of Physiology and Biophysics, School of Medicine and Biomedical Sciences, University at Buffalo, SUNY, Buffalo, NY 14214.
references
- Aldrich RW. Inactivation of voltage-gated delayed potassium current in molluscan neurons. A kinetic model. Biophys J. 1981;36:519–532. doi: 10.1016/S0006-3495(81)84750-9. [DOI] [PMC free article] [PubMed] [Google Scholar]
- Amos GJ, Wettwer E, Metzger F, Li Q, Himmel HM, Ravens U. Differences between outward currents of human atrial and subepicardial ventricular myocytes. J Physiol (Camb) 1996;491:31–50. doi: 10.1113/jphysiol.1996.sp021194. [DOI] [PMC free article] [PubMed] [Google Scholar]
- Antzelevitch, C., S. Sicouri, A. Lukas, V.V. Nesterenko, D.-W. Liu, and J. Di Diego. 1995. Regional differences in the electrophysiology of ventricular cells: physiological and clinical implications. In Cardiac Electrophysiology. From Cell to Bedside. 2nd ed. D. Zipes and J. Jalife, editors. W.B. Saunders Co., Philadelphia. 228–245.
- Barry DM, Nerbonne JM. Myocardial potassium channels: electrophysiological and molecular diversity. Annu Rev Physiol. 1996;58:363–394. doi: 10.1146/annurev.ph.58.030196.002051. [DOI] [PubMed] [Google Scholar]
- Barry DM, Trimmer JS, Merlie JP, Nerbonne JM. Differential expression of voltage-gated K+ channel subunits in adult rat heart: relationship to functional K+ channels? . Circ Res. 1995;77:361–369. doi: 10.1161/01.res.77.2.361. [DOI] [PubMed] [Google Scholar]
- Bekele-Arcuri Z, Matos MF, Manganas L, Strassle BW, Monaghan MM, Rhodes KJ, Trimmer JS. Generation and characterization of subtype-specific monoclonal antibodies to K+channel alpha- and beta-subunit polypeptides. Neuropharmacology. 1996;35:851–865. doi: 10.1016/0028-3908(96)00128-1. [DOI] [PubMed] [Google Scholar]
- Bernard, S.L., J.R. Gorham, and L.M. Ryland. 1984. Biology and diseases of ferrets. In Laboratory Animal Medicine. J.G. Fox, B.J. Cohen, and F.M. Loew, editors. Academic Press, Inc., San Diego, CA. 386–397.
- Beuckelmann DJ, Näbauer M, Erdmann E. Alterations of potassium currents in isolated human ventricular myocytes from patients with terminal heart failure. Circ Res. 1993;73:379–385. doi: 10.1161/01.res.73.2.379. [DOI] [PubMed] [Google Scholar]
- Brahmajothi MV, Morales MJ, Liu S, Rasmusson RL, Campbell DL, Strauss HC. In situ hybridization reveals extensive diversity of K+channel mRNA in isolated ferret cardiac myocytes. Circ Res. 1996;78:1083–1089. doi: 10.1161/01.res.78.6.1083. [DOI] [PubMed] [Google Scholar]
- Brahmajothi MV, Morales MJ, Reimer KA, Strauss HC. Regional localization of ERG, the channel protein responsible for the rapid component of the delayed rectifier K+current in the ferret heart. Circ Res. 1997;81:128–135. doi: 10.1161/01.res.81.1.128. [DOI] [PubMed] [Google Scholar]
- Campbell DL, Rasmusson RL, Qu Y, Strauss HC. The calcium-independent transient outward potassium current in isolated ferret right ventricular myocytes. I. Basic characterization and kinetic analysis. J Gen Physiol. 1993a;101:571–601. doi: 10.1085/jgp.101.4.571. [DOI] [PMC free article] [PubMed] [Google Scholar]
- Campbell DL, Qu Y, Rasmusson RL, Strauss HC. The calcium-independent transient outward potassium current in isolated ferret right ventricular myocytes. II. Closed state reverse use–dependent block by 4-aminopyridine. J Gen Physiol. 1993b;101:603–626. doi: 10.1085/jgp.101.4.603. [DOI] [PMC free article] [PubMed] [Google Scholar]
- Campbell, D.L., R.L. Rasmusson, M.B. Comer, and H.C. Strauss. 1995. The cardiac calcium-independent transient outward potassium current: kinetics, molecular properties, and role in ventricular repolarization. In Cardiac Electrophysiology. From Cell to Bedside. 2nd ed. D. Zipes and J. Jalife, editors. W.B. Saunders Co., Philadelphia. 83–96.
- Campbell DL, Stamler JS, Strauss HC. Redox modulation of L-type calcium channels in ferret ventricular myocytes. Dual mechanism regulation by nitric oxide and S-nitrosothiols. J Gen Physiol. 1996;108:277–293. doi: 10.1085/jgp.108.4.277. [DOI] [PMC free article] [PubMed] [Google Scholar]
- Choi KL, Aldrich RW, Yellen G. Tetraethylammonium blockade distinguishes two inactivation mechanisms in voltage-activated K+channels. Proc Natl Acad Sci USA. 1991;88:5092–5095. doi: 10.1073/pnas.88.12.5092. [DOI] [PMC free article] [PubMed] [Google Scholar]
- Clark RB, Giles WR, Imaizumi Y. Properties of the transient outward current in rabbit atrial cells. J Physiol (Camb) 1988;405:147–168. doi: 10.1113/jphysiol.1988.sp017326. [DOI] [PMC free article] [PubMed] [Google Scholar]
- Comer MB, Campbell DL, Rasmusson RL, Lamson DR, Morales MJ, Zhang Y, Strauss HC. Cloning and characterization of an Ito-like potassium channel from ferret ventricle. Am J Physiol. 1994;267:H1383–H1395. doi: 10.1152/ajpheart.1994.267.4.H1383. [DOI] [PubMed] [Google Scholar]
- Dignam, J.D. 1990. Preparation of extracts from higher eukaryotes. In Methods in Enzymology: Guide to Protein Purification. M.P. Deutscher, editor. Academic Press, Inc., San Diego, CA. 194–203. [DOI] [PubMed]
- Dixon JE, McKinnon D. Quantitative analysis of potassium channel mRNA expression in atrial and ventricular muscle of rats. Circ Res. 1994;75:252–260. doi: 10.1161/01.res.75.2.252. [DOI] [PubMed] [Google Scholar]
- Dixon JE, Shi W, Wang HS, McDonald C, Yu H, Wymore RS, Cohen IS, McKinnon D. Role of the Kv4.3 channel in ventricular muscle. A molecular correlate for the transient outward current. Circ Res. 1996;79:659–668. doi: 10.1161/01.res.79.4.659. [DOI] [PubMed] [Google Scholar]
- Escande D, Coulombe A, Favre JF, Deroubaix E, Coraboeuf F. Two types of transient outward currents in adult human atrial cells. Am J Physiol. 1987;252:H142–H148. doi: 10.1152/ajpheart.1987.252.1.H142. [DOI] [PubMed] [Google Scholar]
- Fedida D, Giles WR. Regional variations in action potentials and transient outward current in myocytes isolated from rabbit left ventricle. J Physiol (Camb) 1991;442:191–209. doi: 10.1113/jphysiol.1991.sp018789. [DOI] [PMC free article] [PubMed] [Google Scholar]
- Fiset C, Clark RB, Shimoni Y, Giles WR. Shal-type channels contribute to the Ca2+-independent transient outward K+current in rat ventricle. J Physiol (Camb) 1997;500:51–65. doi: 10.1113/jphysiol.1997.sp021998. [DOI] [PMC free article] [PubMed] [Google Scholar]
- Giles WR, Imaizumi Y. Comparisons of potassium currents in rabbit atrial and ventricular cells. J Physiol (Camb) 1988;405:123–145. doi: 10.1113/jphysiol.1988.sp017325. [DOI] [PMC free article] [PubMed] [Google Scholar]
- Gotoh Y, Imaizumi Y, Watanabe M, Shibata EF, Clark RB, Giles WR. Inhibition of transient outward K+ current by DHP Ca2+antagonists and agonists in rabbit cardiac myocytes. Am J Physiol. 1991;260:H1737–H1742. doi: 10.1152/ajpheart.1991.260.5.H1737. [DOI] [PubMed] [Google Scholar]
- Hoshi T, Zagotta WN, Aldrich RW. Biophysical and molecular mechanisms of Shakerpotassium channel inactivation. Science. 1990;250:533–538. doi: 10.1126/science.2122519. [DOI] [PubMed] [Google Scholar]
- Hoshi T, Zagotta WN, Aldrich RW. Two types of inactivation in Shakerpotassium channels: effects of alterations in the carboxy-terminal region. Neuron. 1991;7:547–556. doi: 10.1016/0896-6273(91)90367-9. [DOI] [PubMed] [Google Scholar]
- Josephson IR, Sanchez-Chapula J, Brown AM. Early outward current in rat ventricular cells. Circ Res. 1984;54:157–162. doi: 10.1161/01.res.54.2.157. [DOI] [PubMed] [Google Scholar]
- Lefevre I, Coulombe A, Coraboeuf E. The calcium antagonist D600 inhibits calcium-independent transient outward current in isolated rat ventricular myocytes. J Physiol (Camb) 1991;432:65–80. doi: 10.1113/jphysiol.1991.sp018376. [DOI] [PMC free article] [PubMed] [Google Scholar]
- Liu D-W, Gintant GA, Antzelevitch C. Ionic bases for electrophysiological distinctions among epicardial, midmyocardial and endocardial myocytes from the free wall of the canine left ventricle. Circ Res. 1993;72:671–687. doi: 10.1161/01.res.72.3.671. [DOI] [PubMed] [Google Scholar]
- Marty, A., and E. Neher. 1995. Tight-seal whole-cell recording. In Single-Channel Recording. 2nd ed. B. Sakmann and E. Neher, editors. Plenum Publishing Corp., New York. 31–52.
- Morales MJ, Castellino RC, Crews AL, Rasmusson RL, Strauss HC. A novel β subunit increases rate of inactivation of specific voltage-gated potassium channel α subunits. J Biol Chem. 1995;270:6272–6277. doi: 10.1074/jbc.270.11.6272. [DOI] [PubMed] [Google Scholar]
- Näbauer M, Beuckelmann D, Erdmann E. Characteristics of transient outward current in human ventricular myocytes from patients with terminal heart failure. Circ Res. 1993;73:386–394. doi: 10.1161/01.res.73.2.386. [DOI] [PubMed] [Google Scholar]
- Näbauer M, Beuckelmann DJ, Überfuhr P, Steinbeck G. Regional differences in current density and rate-dependent properties of the transient outward current in subepicardial and subendocardial myocytes of human left ventricle. Circulation. 1996;93:168–177. doi: 10.1161/01.cir.93.1.168. [DOI] [PubMed] [Google Scholar]
- Nakahira K, Shi G, Rhodes KJ, Trimmer JS. Selective interaction of voltage-gated K+channel beta-subunits with alpha-subunits. J Biol Chem. 1996;271:7084–7089. doi: 10.1074/jbc.271.12.7084. [DOI] [PubMed] [Google Scholar]
- Ohya S, Tanaka M, Oku T, Asai Y, Watanabe M, Giles WR, Imaizumi Y. Molecular cloning and tissue distribution of an alternatively spliced variant of an A-type K+channel alpha-subunit, Kv4.3 in the rat. FEBS Lett. 1997;420:47–53. doi: 10.1016/s0014-5793(97)01483-x. [DOI] [PubMed] [Google Scholar]
- Po S, Roberds S, Snyders DJ, Tamkun M, Bennett PB. Heteromultimeric assembly of human potassium channels. Molecular basis of a transient outward current? . Circ Res. 1993;72:1326–1336. doi: 10.1161/01.res.72.6.1326. [DOI] [PubMed] [Google Scholar]
- Rasmusson, R.L., D.L. Campbell, Y. Qu, and H.C. Strauss. 1994. Conformation-dependent drug binding to cardiac potassium channels. In Ion Channels in the Cardiovascular System. Function and Dysfunction. P.M. Spooner, A.M. Brown, W.A. Catterall, G.J. Kaczorowski, and H.C. Strauss, editors. Futura Publishing Company, Inc., Armonk, New York. 387–414.
- Rasmusson RL, Morales MJ, Castellino RC, Zhang Y, Campbell DL, Strauss HC. C-type inactivation controls recovery in a fast inactivating cardiac K+ channel (Kv1.4) expressed in Xenopusoocytes. J Physiol (Camb) 1995a;489:709–721. doi: 10.1113/jphysiol.1995.sp021085. [DOI] [PMC free article] [PubMed] [Google Scholar]
- Rasmusson RL, Zhang Y, Campbell DL, Comer MB, Castellino RC, Liu S, Strauss HC. Bi-stable block by 4-aminopyridine of a transient K+ channel (Kv1.4) cloned from ferret ventricle and expressed in Xenopusoocytes. J Physiol (Camb) 1995b;485:59–71. doi: 10.1113/jphysiol.1995.sp020712. [DOI] [PMC free article] [PubMed] [Google Scholar]
- Rettig J, Heinemann SH, Wunder F, Lorra C, Parcej DN, Dolly JO, Pongs O. Inactivation properties of voltage-gated K+channels altered by presence of beta-subunit. Nature. 1994;369:289–294. doi: 10.1038/369289a0. [DOI] [PubMed] [Google Scholar]
- Roeper J, Lorra C, Pongs O. Frequency-dependent inactivation of mammalian A-type K+ channel Kv1.4 regulated by Ca2+/calmodulin-dependent protein kinase. J Neurosci. 1997;17:3379–3391. doi: 10.1523/JNEUROSCI.17-10-03379.1997. [DOI] [PMC free article] [PubMed] [Google Scholar]
- Ruppersberg JP, Stocker M, Pongs O, Heinemann SH, Frank R, Koenen M. Regulation of fast inactivation of cloned mammalian IK(A) channels by cysteine oxidation. Nature. 1991;352:711–714. doi: 10.1038/352711a0. [DOI] [PubMed] [Google Scholar]
- Sanguinetti MC, Johnson JH, Hammerland LG, Kelbaugh PR, Volkmann RA, Saccomano NA, Mueller AL. Heteropodatoxins: peptides isolated from spider venom that block Kv4.2 potassium channels. Mol Pharmacol. 1997;51:491–498. [PubMed] [Google Scholar]
- Sanguinetti MC, Spector PS. Potassium channelopathies. Neuropharmacology. 1997;36:755–762. doi: 10.1016/s0028-3908(97)00029-4. [DOI] [PubMed] [Google Scholar]
- Sheng M, Liao YJ, Jan YN, Jan LY. Presynaptic A-current based on heteromultimeric K+ channels detected in vivo. . Nature. 1993;365:72–75. doi: 10.1038/365072a0. [DOI] [PubMed] [Google Scholar]
- Shi G, Nakahira K, Hammond S, Rhodes KJ, Schecter LE, Trimmer JS. β Subunits promote K+channel surface expression through effects early in biosynthesis. Neuron. 1996;16:843–852. doi: 10.1016/s0896-6273(00)80104-x. [DOI] [PubMed] [Google Scholar]
- Shibata EF, Drury T, Refsum H, Aldrete V, Giles W. Contributions of a transient outward current to repolarization in human atrium. Am J Physiol. 1988;257:H1773–H1781. doi: 10.1152/ajpheart.1989.257.6.H1773. [DOI] [PubMed] [Google Scholar]
- Storrie, B., and E.A. Madden. 1990. Isolation of subcellular organelles. In Methods in Enzymology—Guide to Protein Purification. M.P. Deutscher, editor. Academic Press, Inc., San Diego, CA. 203–224. [DOI] [PubMed]
- Takimoto K, Li D, Hershman KM, Li P, Jackson EK, Levitan ES. Decreased expression of Kv4.2 and novel Kv4.3 K+channel subunit mRNAs in ventricle of renovascular hypertensive rats. Circ Res. 1997;81:533–539. doi: 10.1161/01.res.81.4.533. [DOI] [PubMed] [Google Scholar]
- Tamkun, M., P.B. Bennet, and D.J. Snyders. 1995. Cloning and expression of human cardiac potassium channels. In Cardiac Electrophysiology. From Cell to Bedside. 2nd ed. D. Zipes and J. Jalife, editors. W.B. Saunders Co., Philadelphia. 21–31.
- Tseng, G.-N. 1995. Potassium channels: their modulation by drugs. In Cardiac Electrophysiology. From Cell to Bedside. 2nd ed. D. Zipes and J. Jalife, editors. W.B. Saunders Co., Philadelphia. 260–269.
- Tseng G-N, Jiang M, Yao JA. Reverse use-dependence of Kv4.2 blockade by 4-aminopyridine. J Pharmacol Exp Ther. 1996;279:865–876. [PubMed] [Google Scholar]
- Wang H, Kunkel DD, Martin TM, Schwartzkroin PA, Temple BL. Heteromultimeric K+channels in terminal and juxtaparanodal regions of neurons. Nature. 1993;365:75–79. doi: 10.1038/365075a0. [DOI] [PubMed] [Google Scholar]
- Wettwer E, Amos G, Gath J, Zerkowski H-R, Reidemeister J-C, Ravens U. Transient outward current in human and rat ventricular myocytes. Cardiovasc Res. 1993;27:1662–1669. doi: 10.1093/cvr/27.9.1662. [DOI] [PubMed] [Google Scholar]
- Wettwer E, Amos GJ, Posival H, Ravens U. Transient outward current in human ventricular myocytes of subepicardial and subendocardial origin. Circ Res. 1994;75:473–482. doi: 10.1161/01.res.75.3.473. [DOI] [PubMed] [Google Scholar]
- Xu H, Dixon JE, Barry DM, Trimmer JS, Merlie JP, McKinnon D, Nerbonne JM. Developmental analysis reveals mismatches in the expression of K+ channel α subunits and voltage-gated K+channel currents in rat ventricular myocytes. J Gen Physiol. 1996;108:405–419. doi: 10.1085/jgp.108.5.405. [DOI] [PMC free article] [PubMed] [Google Scholar]
- Yeola SW, Snyders DJ. Electrophysiological and pharmacological correspondence between Kv4.2 current and rat cardiac transient outward current. Cardiovasc Res. 1997;33:540–547. doi: 10.1016/s0008-6363(96)00221-0. [DOI] [PubMed] [Google Scholar]