

Abstract
When attached outside the voltage-sensing S4 segment of the Shaker potassium channel, the fluorescent probe tetramethylrhodamine (TMRM) undergoes voltage-dependent fluorescence changes (ΔF) due to differential interaction with a pH-titratable external protein-lined vestibule (Cha, A., and F. Bezanilla. 1998. J. Gen. Physiol. 112:391–408.). We attached TMRM at the same sites [corresponding to M356C and A359C in the wild-type (wt) channel] in a deletion mutant of Shaker where all but the five amino acids closest to S4 had been removed from the S3–S4 linker. In the deletion mutant, the maximal ΔF/F seen was diminished 10-fold, and the ΔF at M356C became pH independent, suggesting that the protein-lined vestibule is made up in large part by the S3–S4 linker. The residual ΔF showed that the probe still interacted with two putative quenching groups near the S4 segment. One group was detected by M356C-TMRM (located outside of S3 in the deletion mutant) and reported on deactivation gating charge movement when applying hyperpolarizing voltage steps from a holding potential of 0 mV. During activating voltage steps from a holding potential of −90 mV, the fluorescence lagged considerably behind the movement of gating charge over a range of potentials. Another putative quenching group was seen by probes attached closer to the S4 and caused a ΔF at extreme hyperpolarizations (more negative than −90 mV) only. A signal from the interaction with this group in the wt S3–S4 linker channel (at L361C) correlated with gating charge moving in the hyperpolarized part of the Q-V curve. Probe attached at A359C in the deletion mutant and at L361C in wt channel showed a biphasic ΔF as the probe oscillated between the two groups, revealing that there is a transient state of the voltage sensor in between, where the probe has maximal fluorescence. We conclude that the voltage sensor undergoes two distinct conformational changes as seen from probes attached outside the S4 segment.
Keywords: Shaker K+ channel, S3–S4 linker, S4 displacement, fluorescence quenching, gating currents
INTRODUCTION
The development of the technique of site-directed fluorescent labeling has made it possible to track movements in specific regions of the protein whether or not these rearrangements carry gating charge (Mannuzzu et al. 1996; Cha and Bezanilla 1997), providing a time-resolved measurement of conformational changes of the channel. Using this technique to place fluorophores outside the S4 (in the S3–S4 linker), it was directly demonstrated that structural rearrangements around the S4 are associated with gating charge movement (Mannuzzu et al. 1996; Cha and Bezanilla 1997). Placing probes in the pore of the channel, or P-region, elucidated rearrangements associated with slow inactivation of the ionic current (Cha and Bezanilla 1997; Loots and Isacoff 1998).
Initially, the mechanism of fluorescence quenching near the S4 segment was hypothesized to result from changes in the hydrophobicity of the probe's environment in response to voltage (Mannuzzu et al. 1996). However, spectral analysis determined that the fluorophores remained in an aqueous environment at all potentials (Cha and Bezanilla 1997). Other studies pointed to the existence of a protein vestibule surrounding the extracellular portion of the S4 segment (Yang et al. 1997; Cha and Bezanilla 1998). Using a combination of spectroscopic techniques, Cha and Bezanilla 1998 elucidated some properties of this aqueous vestibule, which was likely responsible for the voltage-dependent quenching of fluorophores attached near the S4 segment. This vestibule constrained the anisotropy and accessibility of fluorophores in the S4 segment in a voltage-dependent manner, as determined by anisotropy and quenching studies. The S4 fluorescence was also titrated by changes in external pH, but not by extracellular calcium, suggesting that the quenching groups in the vestibule contained pH-titratable residues.
From the sequence of Shaker channel protein, a likely candidate for the putative protein vestibule is the ∼31 amino acid extracellular S3–S4 linker. We tested this hypothesis by examining properties of fluorescence quenching near the S4 segment in a deletion mutant where 26 amino acids in the linker had been removed (Gonzalez et al., 2000). Here we report that tetramethylrhodamine (TMRM) attached outside the S4 in the deletion mutant displayed much reduced quenching with voltage and different pH sensitivity compared with the wild-type linker channel. The residual fluorescence signal at one position (corresponding to M356C in the native linker channel) displayed a slower fluorescence change than expected from the movement of activation gating charge (at 0 mV), and demonstrated that the voltage sensor became trapped at hyperpolarized potentials. At another position (A359C), the fluorescence signal revealed an intermediate state of the voltage sensor between two quenching groups. We demonstrate that the same signal is present in the native linker channel and correlates with the hyperpolarized part of the Q-V curve, identifying an intermediate state of the voltage sensor.
MATERIALS AND METHODS
Electrophysiology and Fluorescence Measurements
The modified cut-open oocyte epifluorescence setup used for simultaneous measurement of gating currents and fluorescence signals has been presented before (Cha and Bezanilla 1998). In brief, the oocyte was voltage clamped, and gating currents measured in a cut-open setup for spatial voltage homogeneity and fast temporal resolution (Stefani et al. 1994). Placement of the cut-open setup on the stage of an upright microscope (BX50WI; Olympus Optical) allowed focusing of a LUMPlanFl 40× water-immersion objective with numerical aperture of 0.8 onto the surface of the voltage-clamped dark side of the oocyte. The tetramethylrhodamine probe was excited with light from a tungsten lamp (Carl Zeiss, Inc.), filtered by a 535DF35 excitation filter, a 570DRLP dichroic mirror separated emitted and excitatory light, and the emitted light was filtered by a 565EFLP filter (filters from Chroma Technology and Omega Optical) before being focused onto a PIN-020A photodiode (UDT Technologies) by a microscope condenser lens at the microscope's epifluorescence port. The photodiode was connected to the headstage of an integrating Axopatch 1B patch clamp amplifier (Axon Instruments). The current from the photodiode was offset before being fed into the patch-clamp amplifier by a circuit of a 45-volt battery (Eveready Battery Co., Inc.) and a 10-GΩ resistor to minimize integration resetting spikes from the traces. The excitation light from the lamp was interrupted with a TTL-triggered VS25 shutter (Vincent Associates) between measurements.
Gating and fluorescence currents were digitized by two analogue-to-digital converters at a resolution of 16 bits and transferred onto two different channels of a PC44 board (Innovative Technologies) interfacing with a computer via an AT-slot. The acquisition program running the PC44 board was developed in our laboratory and runs under MS-DOS. When data were sampled at intervals longer than 5 μs (all traces presented in this paper), the program acquired the data at 5 μs per point, digitally filtered them to the new Nyquist frequency, and decimated them to the new sampling frequency. The data analysis program was also developed in our research group and runs in Windows 95. The fluorescence signal, F, is displayed as −F; i.e., positive deflections indicate a decrease in fluorescence or an increase in fluorescence quenching.
Molecular Biology, Expression, and Labeling
A noninactivating version of the Shaker H4 channel [H4Δ(6-46)] with pore mutation W434F in a pBSTA vector background was used for measurements of gating currents with maximal expression (Starace et al. 1997). For site-directed mutagenesis of all constructs, a two-step PCR protocol (Moore 1994) was used to introduce mutations between the XbaI and BglII sites into the vector containing Shaker with amino acids 330–355 in the S3–S4 linker removed (Gonzalez et al. 2000). After subsequent subcloning of the PCR-generated fragment into the Shaker H4Δ(6-46) W434F vector, the PCR insert was sequenced to exclude the possibility of unwanted mutations. The constructs are designated by the original amino acid, residue number, and substituted amino acid (i.e., M356C designates the construct where cysteine was substituted for methionine at residue 356). The cRNA was transcribed in vitro with the T7 mMessage machine kit (Ambion Inc.), and 50 nl cRNA at a concentration of 100 ng/ml were injected into each Xenopus oocyte. Experiments were performed from 2–7 d after injection. The sterile oocyte incubation solution consisted of 100 mM NaCl, 2 mM KCl, 1.8 mM CaCl2, 1 mM MgCl2, 5 mM HEPES, 10 μM EDTA, and 100 μM DTT. The oocytes were stained in depolarizing solution containing 5 μM tetramethylrhodamine-5-maleimide (Mannuzzu et al. 1996) at 18°C for 40 min.
RESULTS
The technique of site-directed fluorescent labeling involves attaching an extrinsic fluorescent probe (i.e., TMRM) to specific regions in the protein. TMRM attached to cysteines in the S3–S4 linker just outside of S4 (at M356C or A359C) demonstrated a voltage-dependent fluorescence signal displaying features of gating charge movement (Mannuzzu et al. 1996; Cha and Bezanilla 1997). Cha and Bezanilla 1998 proposed a model in which the fluorescence signal results from a movement of the S4 segment, while the probe interacts with specific quenching groups located in a protein-lined vestibule outside S4. Since the ∼31 amino acid linker between S3 and S4 is the best candidate for this vestibule and likely contains the quenching groups, its deletion should modify the signal and possibly allow detection of novel groups modifying the environment of the probe. We evaluated the fluorescence signals of TMRM attached to the same residues (M356C, A359C) in a mutant channel where the 26 amino acids closest to S3 had been deleted (referred to as the 5-aa linker mutant; Gonzalez et al. 2000).
A Rearrangement Outside the S3 and S4 Segments Tracked by a Fluorophore in the Deletion Mutant
Even with the linker deleted, TMRM attached to the inserted cysteine M356C in the 5 amino acid (5-aa) residual S3–S4 linker exhibited fluorescence changes with voltage (Fig. 1 A). The changes in the M356C 5-aa linker were in the same direction (i.e., an increase in quenching with depolarization), but about one order of magnitude smaller (∼1.5% of background in Fig. 1 A) than those reported by Cha and Bezanilla 1998 for the M356C W434F construct with normal linker (∼15–25% of background). This is consistent with the removal of a group responsible for most of the quenching seen in the wild-type (wt) channel, but could also be caused by a relocation of probe with respect to the quenching group.
Figure 1.

Fluorescence changes and gating currents for the M356C 5-aa linker mutant. (A) Fluorescence changes (upward deflections indicate a decrease in fluorescence) in response to 400-ms depolarizations from HP = −90 mV. (B) Integrated gating currents (smooth trace) and normalized fluorescence traces (jagged trace) during step hyperpolarizations to the membrane potentials indicated from HP = 0 mV. Hyperpolarizations occurred at the arrow. (C) Normalized deactivation charge displacement (Q) as a function of activation voltage for the M356C 5-aa linker mutation, normalized to the total charge measured from HP = 0 mV. The Q-Vs are marked with HP and duration of pulse. The gating currents were measured during the voltage steps for HP = 0 mV (on-gating charge), and after the return of the voltage to the resting potentials for HP = −90 mV (off-gating charge), so that in both cases deactivation gating charge is measured. (D) Time constants for the fluorescence changes in response to step depolarizations from HP = −90 mV (▪), and approximate time constants for activation gating charge movement obtained by fitting a single exponential to the fractional gating charge movements during voltage steps of variable durations (Fig. 1 C) as a function of voltage.
By making the cysteine substitutions in the W434F background, we should be able to simultaneously measure gating currents and fluorescence and compare the two. In our case, the situation is complicated by the fact that the 5-aa linker mutant presents an activation kinetic more than 200-fold slower than the wt channel (at 0 mV), whereas deactivation is slowed down only threefold (Gonzalez et al. 2000). In agreement with this observation in the conducting Shaker, we found for the M356C W434F 5-aa mutant that activation gating charge moved so slowly as to be unmeasurable. However, all the gating charge induced during a depolarizing pulse can be measured at the end of that pulse by applying a large hyperpolarizing voltage since the gating charge kinetics are much faster at those voltages. Accordingly, only when holding at 0 mV and applying hyperpolarizing pulses were we able to directly compare gating currents and fluorescence. Fig. 1 B shows the superposition of fluorescence traces with gating charge movement (obtained as the time integral of the gating current) for pulses ranging from −50 to −170 mV from a holding potential (HP) of 0 mV. It is clear that in this deletion mutant, fluorescence at M356C follows gating charge movement. It is interesting to note that this is the case even though in the 5-aa linker mutant the position M356C is closer to the outside of the S3 than the S4 segment (see figure 1 of Gonzalez et al. 2000).
We then estimated the activation kinetics of the charge by measuring gating currents at negative potentials, taking advantage of the fact that at those potentials the kinetics are fast enough to detect gating currents reliably, as shown in Fig. 1 B. The Q-V curves for the M356C mutant are given in Fig. 1 C, for HP = 0 and −90 mV. For the case of the HP = −90 mV, the charge was estimated at −90 mV after a test pulse of duration of 40, 150, and 400 ms. In this situation, since gating charge movement is being measured during the return to −90 mV after the activation pulse (OFF gating charge), more and more total gating charge is being recruited with longer pulse durations. By comparing with the total gating charge measured from HP = 0 mV, it is clear that activation pulses of 400-ms duration are required to move ∼90% of the total gating charge at 50 mV membrane potential. By using the fraction of the total gating charge moving with pulses of different length, the approximate time constant of activation gating charge movement can be determined as a function of voltage (Fig. 1 D). The result verifies the extremely slow movement of the voltage sensor during activating voltage pulses; e.g., at 0 mV, the time constant for activation gating charge movement was ∼570 ms, which is even slower than the extrapolated time constant of activation of the ionic current at 0 mV (∼218 ms) in the 5-aa linker mutant without the cysteine and without the TMRM dye attached (Gonzalez et al. 2000).
The time constants of fluorescence changes during activating voltage steps (Fig. 1 A) were likewise measured and displayed in Fig. 1 D. At lower activation potentials, fluorescence moved even slower than gating charge movement, whereas at higher potentials the opposite appears to be true. Reinspecting Fig. 1 B, the same holds true when deactivation gating charge movement is being compared with fluorescence: for larger voltage steps (−170 mV) the fluorescence (jagged traces) is faster than gating charge movement (smooth traces), whereas the opposite is true for smaller voltage steps (−80 mV). This contrasts to the situation for the M356C position in the wt channel, where the fluorescence was always found to lag behind the movement of the gating charge (Cha and Bezanilla 1997).
A more detailed comparison of activation gating charge movement and fluorescence changes in the M356C 5-aa linker mutant is shown in Fig. 2. In this case, activation gating charge movement was estimated by applying a pulse to 0 mV for variable durations (Δt), followed by a step to −180 mV to measure (deactivation) gating charge. Fig. 2 A shows gating current and fluorescence during the −180-mV step. By integrating the current traces at −180 mV, the total gating charge moving at −180 mV is measured. For short durations at 0 mV, this represents the gating charge moved between −90 and 0 mV during the voltage step to 0 mV, since little gating charge moves between −180 and −90 mV, when holding at −90 mV (Fig. 1 C). However, for longer durations at 0 mV, the channel becomes progressively C-type inactivated, resulting in a leftward shift of the Q-V, with a significant part of the gating charge now being moved between −90 and −180 mV (Fig. 1 C; Olcese et al. 1997). Fig. 2 B verifies that with increasing (pre)pulse duration at 0 mV, the total gating charge moving at −180 mV increases, following a biexponential time course, with a “fast” time constant of 315 ms (mean = 300 ± 37 ms, n = 6) and a slow time constant of 1.87 s (mean = 1.5 ± 0.2 s, n = 6). The fluorescence during a prolonged step to 0 mV was compared with the gating charge recruitment at 0 mV. The fluorescence trace was monoexponential with a time constant of 1.92 s (mean = 1.6 ± 0.1 s, n = 6), showing correlation with the slower time constant of gating charge movement at 0 mV (Fig. 2 B). This verifies the impression from Fig. 1 D, that fluorescence seems to lag behind the movement of activation gating charge. The correlation with the slower time constant of gating charge movement could mean that fluorescence in this case tracks entry into C-type inactivation, or that fluorescence follows gating much more readily during steps to −170 or −180 mV in the C-type inactivated channel.
Figure 2.
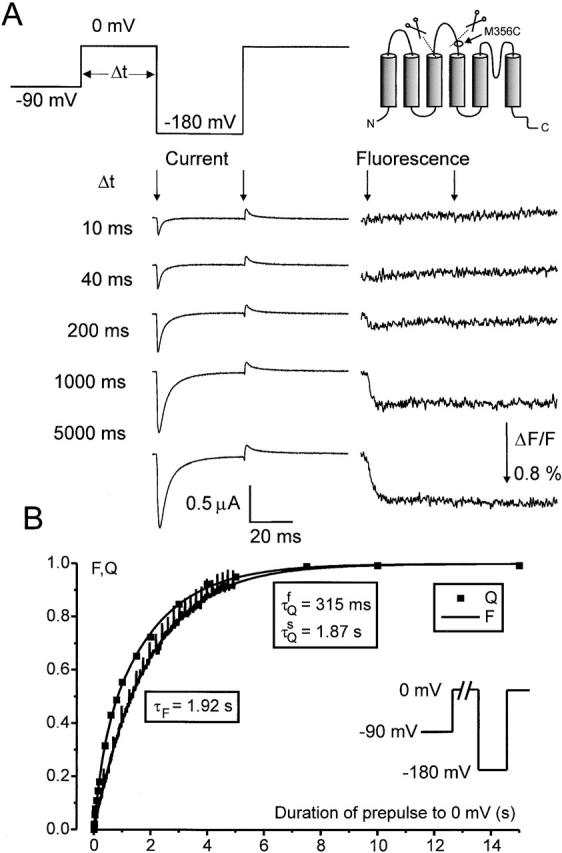
Correlation of activation charge displacement and fluorescence in the M356C W434F 5-aa linker mutation (A) Gating currents (left) and fluorescence traces (right) during the test pulse to −180 mV as a function of prepulse duration at 0 mV. The start and end of the pulse to −180 mV are indicated by arrows. (B) Fractional gating charge displacement (Q) as a function of prepulse duration, and normalized fluorescence decrease (F) when stepping the voltage from −90 to 0 mV. The charge displacement was measured at −180 mV for variable durations at 0 mV (see A). The gating charge displacement was fitted with a double exponential decay function with the time constants indicated. The fluorescence signal was fitted with a single exponential and was normalized to the amplitude of the exponential fit.
The special feature of the 5-aa linker channel is the slow activation and relatively fast deactivation kinetics (Gonzalez et al. 2000). However, as the movement of the voltage sensor is quite different in channels that are in the slow-inactivated states, we studied the gating currents as well as the fluorescence signals in the noninactivated as well as the C-inactivated channels. In the experiments in Fig. 3, we illustrate the movement of the voltage sensor during variable dwelling at negative potentials by applying prepulses of variable duration from HP = 0 to −90 mV, followed by a testpulse to +50 mV. For relatively short prepulses (10 or 40 ms) to −90 mV (channels in the C-inactivated state), it is clear that the gating charge moves readily between −90 and +50 mV (Fig. 3, left), accompanied by a rapid change in fluorescence (Fig. 3, right). However, when the pulse at −90 mV is extended (and consequently removing C-type inactivation), the gating charge movement at 50 mV decreases. The fluorescence trace (Fig. 3, right) shows that the voltage sensor is slowed down to the point where gating charge movement becomes very small in the gating current traces. This indicates that the voltage sensor (and hence the fluorophore) is becoming “trapped” at −90 mV, resulting in very slow activation kinetics, seen in both gating current and fluorescence traces.
Figure 3.
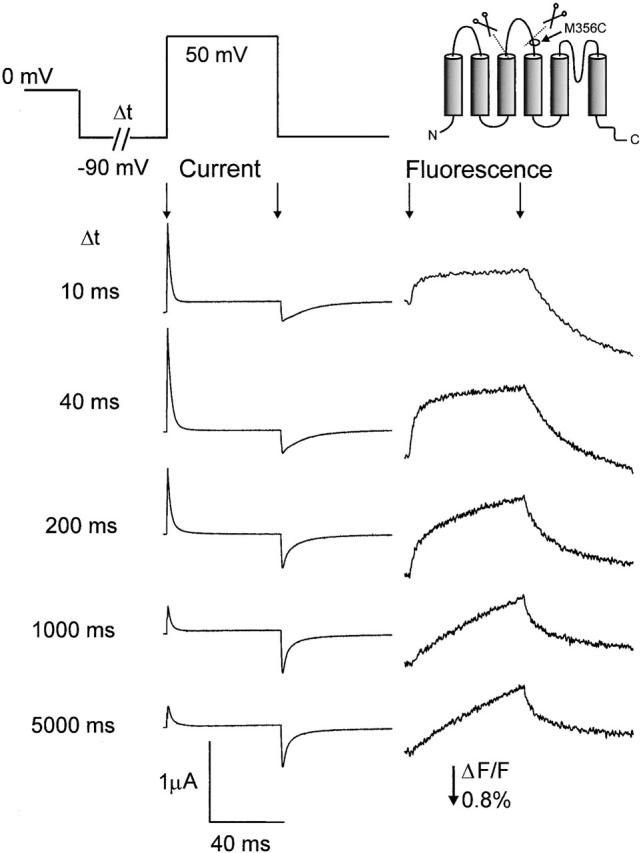
Slow down of the fluorescence signal during prolonged dwelling at −90 mV in the M356C W434F 5-aa linker mutation. From HP = 0 mV, the potential was prepulsed to −90 mV for variable durations (Δt), followed by a test pulse to 50 mV. Shown are the current traces (left) and fluorescence traces (right) during the test pulse. Start and end of the test pulse are indicated by arrows.
The deactivation Q-Vs obtained for the M356C W434F 5-aa linker mutation show that there is a rightward shift in the Q-V (Table ), with the second Boltzmann distribution shifting from −44 (W434F wt linker) to +5 mV, when holding at −90 mV. On the other hand, when holding at 0 mV (C-type inactivated channel), the Q-V gets shifted to the left by deletion of the linker, indicating that the interaction that stabilizes the voltage sensor at 0 mV is stronger in the deletion mutant.
Table 1.
Parameters of the Q-V Curves Before and After Labeling with TMRM
| Construct | HP | A1 | V1 | Z1 | A2 | V2 | Z2 |
|---|---|---|---|---|---|---|---|
| mV | mV | eu | mV | eu | |||
| W434F | −90 | 0.26 ± 0.06 | −62 ± 7 | 1.00 ± 0.07 | 0.73 ± 0.06 | −44 ± 2 | 5.1 ± 0.2 |
| 0 | 0.19 ± 0.01 | −92 ± 5 | 1.4 ± 0.1 | 0.81 ± 0.01 | −58 ± 2 | 3.43 ± 0.07 | |
| L361C + TMRM | −90 | 0.35 ± 0.07 | −129 ± 8 | 1.4 ± 0.3 | 0.65 ± 0.07 | −40 ± 5 | 1.4 ± 0.3 |
| 0 | 0.64 ± 0.05 | −148 ± 6 | 1.4 ± 0.1 | 0.36 ± 0.05 | −69 ± 3 | 1.6 ± 0.1 | |
| L361C | −90 | 0.49 ± 0.04 | −76 ± 2 | 1.29 ± 0.02 | 0.51 ± 0.04 | −45 ± 2 | 2.4 ± 0.08 |
| 0 | 0.33 ± 0.01 | −114 ± 2 | 1.37 ± 0.05 | 0.67 ± 0.01 | −64 ± 1 | 2.09 ± 0.02 | |
| A359C 5 aa + TMRM | −90 | 0.41 ± 0.04 | −107 ± 8 | 1.2 ± 0.1 | 0.59 ± 0.04 | −14 ± 6 | 1.6 ± 0.1 |
| 0 | 0.53 ± 0.07 | −134 ± 4 | 1.6 ± 0.1 | 0.47 ± 0.07 | −96 ± 3 | 2.6 ± 0.3 | |
| A359C 5 aa | −90 | 0.57 ± 0.04 | −140 ± 3 | 1.2 ± 0.1 | 0.43 ± 0.04 | −44 ± 2 | 1.3 ± 0. |
| 0 | 0.64 ± 0.03 | −124 ± 3 | 1.2 ± 0.1 | 0.36 ± 0.03 | −83.3 ± 0.4 | 2.4 ± 0.1 | |
| M356C 5 aa + TMRM | −90 | — | — | — | — | — | — |
| 0 | 0.48 ± 0.02 | −131 ± 3 | 2.1 ± 0.1 | 0.52 ± 0.02 | −76 ± 3 | 2.1 ± 0.1 | |
| M356C5 5 aa | −90 | 0.29 ± 0.05 | −54.4 ± 5 | 1.6 ± 0.2 | 0.71 ± 0.05 | +5 ± 5 | 1.7 ± 0.1 |
| 0 | 0.55 ± 0.06 | −130 ± 5 | 1.9 ± 0.1 | 0.45 ± 0.06 | −75 ± 4 | 2.0 ± 0.1 |
Parameters are given as mean ± SEM L361C unstained (off gating charge, n = 9), L361C stained with TMRM (off, n = 4), A359C 5-aa linker unstained (on, n = 3) and stained with TMRM (on, n = 7), M356C 5-aa linker unstained (HP = 0 mV: on gating charge; HP = −90 mV: off gating charge, n = 6) and stained with TMRM (HP = 0 mV, on gating charge, n = 4). The Q-V in stained M356C 5 aa could not be measured from HP = −90 mV due to leak in this situation.
A359C: Two Quenching Groups and a Transient State of the Voltage Sensor in the 5-aa Linker Mutant
From the above results and those of Gonzalez et al. 2000 it appears that the voltage sensor gets “trapped” at negative potentials in the 5-aa linker construct, resulting in slower activation and a larger Cole-Moore shift. We pursued this by placing fluorophores closer to the S4 segment, at A359C, looking for a fluorescence signal associated with the trapping of the voltage sensor. The fluorescence signal from the A359-TMRM probe in the 5-aa linker showed very different features than the signal from the probe placed only three residues away (M356C-TMRM, above): holding at −110 mV, the effect of a depolarization was now a decrease in quenching (Fig. 4, bottom), rather than an increase as seen in the A359C or M356C mutants with wt linker (Mannuzzu et al. 1996; Cha and Bezanilla 1997, Cha and Bezanilla 1998). The deletion of the S3–S4 linker therefore apparently removed the quenching of signal at depolarized potentials from the A359C-TMRM probe. A biphasic signal was seen after the end of the test pulse when applying depolarizing voltage steps from HP = −110 mV: the decrease in quenching during the test pulse was followed by yet another decrease after the pulse, which then slowly settled back to the initial value (Fig. 4, bottom). Holding at 0 mV and applying pulses to less than −90 mV also revealed a biphasic fluorescence signal: a first fast decrease in quenching was followed by a slower increase, which left the fluorescence intensity close to the starting value (Fig. 4, top).
Figure 4.
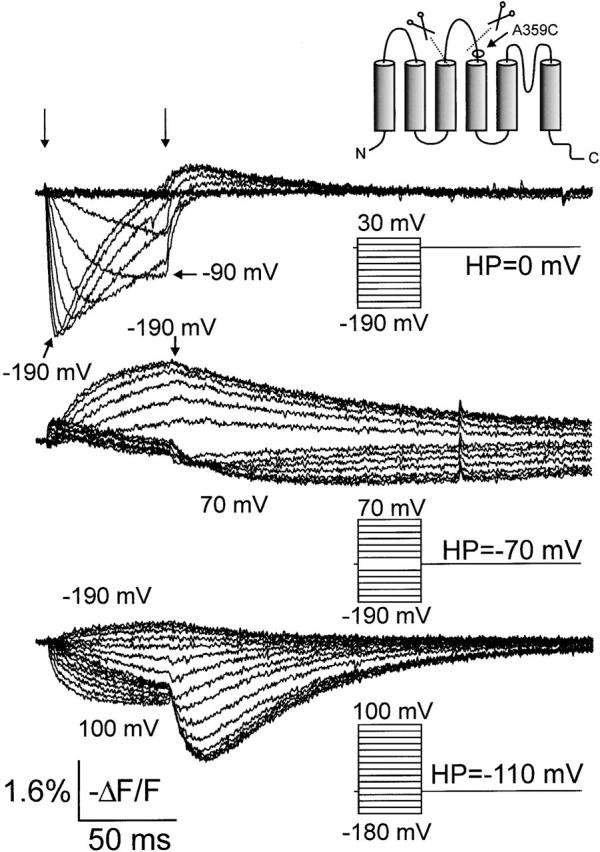
Fluorescence changes for TMRM-stained A359C 5-aa linker mutation. Families of fluorescence traces are shown during voltage steps from the HPs to the test potentials indicated in the insets. Start and end of the voltage steps are shown by arrows (top).
We first asked whether the biphasic fluorescence signal was affected by C-type inactivation, since it was primarily observed from potentials where the channel is likely to be in the C-type inactivated state(s). We therefore prepulsed the potential from HP = −90 mV (where the channel is noninactivated) to −40 mV (where this mutation is C-type inactivated, data not shown) for variable durations and looked at the signal during a subsequent test pulse to −180 mV (Fig. 5). The result showed that the biphasic fluorescence signal persisted even for quite small dwell times at −40 mV, where the channel would be noninactivated. The biphasic fluorescence signal is therefore an obligatory feature of the gating process for this mutant and is not exclusive of the channels being in the inactivated state(s).
Figure 5.

Prepulse experiments for TMRM-stained A359C 5-aa linker mutation. The potential was prepulsed from HP = −90 to −40 mV for variable durations, followed by a test pulse to −180 mV. Given are the current traces (left) and the fluorescence traces (right) during the test pulse. Arrows indicate start and end of the voltage step to −180 mV.
The biphasic nature of the fluorescence signal suggests that the TMRM probe oscillates between two quenching groups with an intermediate nonquenched state (see Fig. 9). In this view, when holding at 0 mV, the probe is close to one quenching group (e.g., QG1). Stepping to potentials less than −90 mV, the probe moves through an intermediate state of minimum quenching (maximum fluorescence) before reaching another state where it is being quenched by the other group (QG2). Thus, QG1 would interact with the probe at depolarized and QG2 at hyperpolarized potentials. Adopting the model of the S4 movement as a rotation (Bezanilla 2000; Gonzalez et al. 2000), the QG1 group would therefore be outside of the external crevice, whereas QG2 would be closer to the internal crevice.
Figure 9.

Proposed model to explain the observed fluorescence changes for the M356C 5-aa linker, A359C 5-aa linker mutants, and the L361C wt linker. This is a visualization of the kinetic model in Fig. 10 with states A, B, and C, corresponding to the states S1, S2, and S3, respectively. It is proposed that the biphasic nature of the fluorescence signal for the A359C 5-aa linker and the L361C wt linker mutations is explained based on quenching by one group (QG1) at depolarized potentials (C) and another group (QG2) at hyperpolarized potentials. The middle state (B) has minimum quenching (maximum fluorescence) because the TMRM probes at A359C 5-aa linker and L361C wt linker reside in a relatively unquenched environment between QG1 and QG2. The M356C 5-aa linker probe does not interact noticeably with QG2, but interacts with QG1 at depolarized potentials The movement of the voltage sensor is displayed as a rotation, following the proposed model in Bezanilla 2000.
L361C: A Transient State of the Voltage Sensor in Shaker with wt S3–S4 Linker
The proposed location of the putative quenching group QG2, and the fact that such a group was not detected when placing probes further out into the S3–S4 linker (M356C, see above) suggests that QG2 might be located deep in the inner crevice. If so, it should be detectable using probes placed further towards the S4 segment in the wt linker channel. We therefore tested the L361C W434F (wt S3–S4 linker) mutation.
The first interesting feature of the signal at L361C (Fig. 6 A) is the absence of substantial quenching at depolarized potentials in this mutant even though the S3–S4 linker is intact. Thus, the linker is not quenching the signal at this position, which agrees with the demonstration that the protein vestibule becomes more constrained further away from S4 (Cha and Bezanilla 1998). The dominating fluorescence change in the L361C-TMRM was a slow quenching at potentials less than −90 mV. When inspecting the fluorescence changes in detail (Fig. 6 A, inset), it is evident that when holding at 0 mV there is a small transient decrease in the fluorescence trace upon hyperpolarization, which is then overwhelmed by the slower process. Thus, the fluorescence signal is also biphasic at this site, and it would seem that the A359C 5-aa linker (Fig. 6 C) and the L361C with normal S3–S4 linker track the same two processes in the channel, but that the relative amplitude of the two differ between them. This difference could be interpreted as a difference in distance of the fluorophore to the two groups (QG1 and QG2) involved in modifying the fluorescence signal.
Figure 6.

Biphasic fluorescence signals and gating charge movement. (A) Fluorescence signal for the TMRM-stained L361C W434F stepped from HP = 0 mV to membrane potentials indicated (bottom inset). Top inset shows the voltage step to −180 mV with biphasic signal indicated by the arrow. (B) Time constant for gating charge movement and time constants for decreasing (τ1) and increasing (τ2) part of the fluorescence trace for the L361C W434F, HP = 0 mV. (B) Fluorescence signal for the TMRM-stained A359C W434F 5-aa linker from HP = 0 mV to membrane potentials indicated (bottom inset). This panel is from the same oocyte as in Fig. 5, but with a fluorescence trace for every 10 mV, for comparison with L361C W434F. Top inset shows the voltage step to −180 mV with biphasic signal indicated by the arrow. (D) Time constants for fast (τ1) and slow (τ2) part of gating charge movement and time constants for decreasing (τ1) and increasing (τ2) part of the fluorescence trace for the A359C W434F 5-aa linker, HP = 0 mV.
To test the hypothesis that the two components of the fluorescence are associated with separate movements of the voltage sensor, we tested whether they would kinetically follow the movement of different components of gating charge. The time constants of each of the two different phases of fluorescence were measured and compared with the two time constants present in the gating charge movement in the A359C 5-aa linker mutation (Fig. 6 D). The result showed that the fast part of the gating charge movement correlated with the fast, decreasing part of the fluorescence signal. However, the second and slower part of the gating charge movement seemed to be considerably faster than the slow part of the fluorescence signal. In the L361C wt linker mutation, the fast, decreasing part of the fluorescence signal also followed the time constant of the gating charge movement (Fig. 6 B), but in this case no part of the gating charge movement kinetics was found to be as slow as the slow part of the fluorescence trace.
Thus, when recasting our data into the model of two interconversions between three states (see Fig. 9), we found only evidence that the interconversion that brings the fluorophore into the vicinity of QG1 carries gating charge. However, a small component of gating charge moving with the slow time constant of fluorescence could be unmeasurable under these conditions. We therefore explored the origin of the slow fluorescence component further. The L361C wt linker mutant was better suited for this than the A359C 5-aa linker, firstly because the slow component of fluorescence was the dominant signal and secondly because the faster kinetics of gating charge movement in wt S3–S4 linker channels facilitated the kinetic correlation of fluorescence and gating charge movement. Fig. 7 A shows Q-V and F-V for an oocyte expressing L361C-TMRM held at 0 or −90 mV. The gating charge in this mutant revealed a shallow voltage dependence (Fig. 7 A, and Table ), even in the absence of staining. Thus, the second Boltzmann (denoted Q2 L361C) had an estimated charge movement of only 2.1 e o in the unstained and ∼1.5 e o in the TMRM-stained L361C, significantly different from the value of 4.4 estimated for wt W434F (Olcese et al. 1997). In the presence of TMRM-staining, the Q1 L361C but not the Q2 L361C was displaced far to the left, even when holding at −90 mV, with the midpoint of the two Boltzmann distributions being shifted 67 and 4 mV to more hyperpolarized potentials with respect to the wt channel (Table ), respectively. Fig. 7 A shows that even though the time constants could not be matched (Fig. 6 D), the steady state F-V (dominated by the slow component, Fig. 6 A) coincided with the Q1 L361C part of the steady state Q-V.
Figure 7.
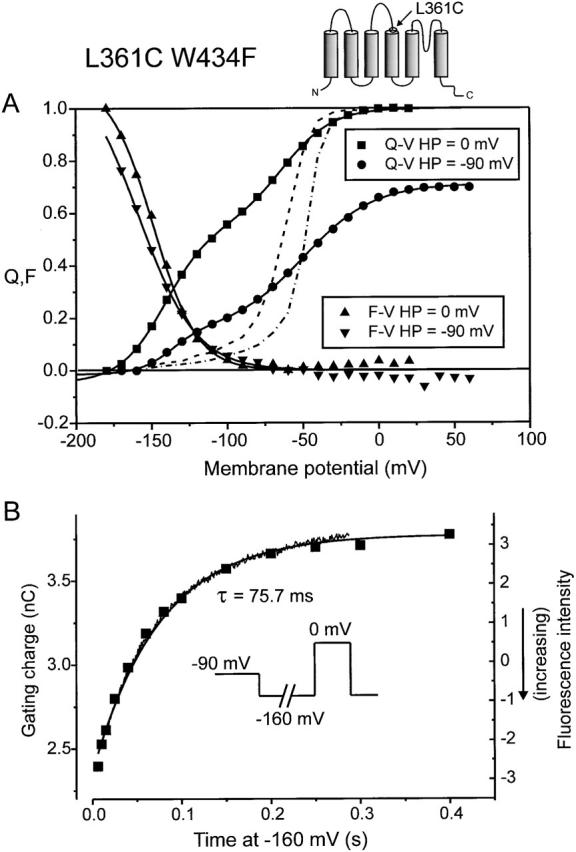
(A) Normalized gating charge movement (Q) and fluorescence (F) for the TMRM-stained L361C W434F from HP = 0 and −90 mV, respectively. Each Q-V was fitted with a sum of two Boltzmann distributions and each F-V with a single Boltzmann distribution. The broken lines show the Q-V for the wt W434F channel from HP = 0 mV (left) or −90 mV (right). (B) Prepulse experiment for the L361C W434F WT linker channel. The potential was prepulsed to −160 mV for variable durations from HP = −90 mV and gating charge measured during a subsequent test pulse to 0 mV (inset). Shown is the total gating charge (▪, left ordinate) measured at 0 mV as a function of prepulse duration and the scaled fluorescence trace taken during a pulse from HP = −90 to −160 mV (jagged trace, right ordinate). The smooth line is a single exponential decay function fitted to the gating charge with the time constant constrained to that obtained by fitting to the fluorescence trace (75.7 ms).
To match the fluorescence signal kinetically with the gating charge movement, we designed a prepulse experiment to evaluate at extreme hyperpolarizations gating charge that moves slowly. In L361 stained with TMRM, the charge movement is faster at 0 than at −160 mV. Therefore, we evaluated the time course of the charge movement at −160 mV by measuring gating currents at 0 mV after a variable interval at −160 mV (Fig. 7 B, inset). The result showed that a slow component of gating charge movement was recruited as the prepulse duration was extended (Fig. 7 B). The fit through the points (solid line) is a single exponential fitted by varying the amplitude, but with a fixed time constant of 75.7 ms (mean = 71 ± 2 ms, n = 4), which was the value obtained by fitting a single exponential to the fluorescence trace measured during a 400-ms pulse to −160 mV. Thus, gating charge is being recruited with the same time constant as the fluorescence changes at −160 mV, meaning that the slow fluorescence signal indeed tracks gating charge movement at very hyperpolarized potentials. Therefore, in our scheme (see Fig. 9), both interconversions carry gating charge and correspond to separate movements of the voltage sensor.
In the normal W434F channel, a very small fraction of gating charge movement has been reported between −90 and −160 mV when holding at −90 mV (Olcese et al. 1997). We verified this finding with the protocol in Fig. 7 B and found no gating charge recruitment nor a slow down of the gating current in the wt W434F channel (n = 4, data not shown). In the L361C channel without TMRM attached, the prepulse experiments did recruit gating charge; however, only 3.6 ± 0.5% (n = 9, compared with 47 ± 7%, n = 4, for the TMRM-stained L361C) of the total gating charge moving at 0 mV was recovered this way, with a time constant of 18 ± 4 ms (n = 9). Thus, the substitution of a cysteine for a leucine at position 361 removes much of the steepness of the Q-V, whereas attachment of TMRM appears to shift Q1 L361C to such hyperpolarized potentials that it can no longer be accurately measured electrically due to leak currents at extremely negative potentials. The fluorescence signal, which corresponds to Q1 L361C in this case, reveals that a true saturation of the Q-V has not been reached even at −200 mV.
The biphasic fluorescence signal present in the A359C 5-aa linker and L361C wt mutation illustrates an interaction with a quenching group at extremely negative potentials. This interaction results in a fluorescence signal, as well as a displacement of the Q-V, so that part of the gating charge moves at extremely hyperpolarized potentials (Fig. 7 B), creating a very large Cole-Moore shift (see Gonzalez et al. 2000). For the L361C wt linker, attachment of the TMRM probe is apparently necessary for this interaction to take place; however, in the 5-aa linker channels, the observed delay in activation and increased Cole-Moore shift is caused by a persistent interaction at these hyperpolarized potentials.
Properties of the Remaining Protein Vestibule: pH Titration
Since the quantum yield of TMRM is insensitive to pH, pH titration may be used as a tool to investigate properties of the protein residues interacting with the fluorophore. Thus, if pH titration changes the fluorescence intensity, this indicates a change in interaction between protein and fluorophore, rather than an effect of pH on the fluorophore itself. Accordingly, properties of the external protein vestibule in Shaker have been described in terms of pH titration, which revealed that at positions M356C and A359C in the wt linker W434F channel, acidic pH caused a larger total ΔF (Cha and Bezanilla 1998), indicating interaction at hyperpolarized potentials with a group having a pK a < 5.
In the TMRM-stained M356C 5-aa linker mutant, a monophasic fluorescence signal was detected, pointing to the interaction with a group outside the S4. The ability of this group to interact with the fluorophore was hardly affected by pH changes between 5 and 9 (Fig. 8). The absence of titration in the deletion mutant suggests that the group responsible for modulating the fluorescence in the M356C W434F wt linker is no longer interacting with the fluorophore. Furthermore, it was found that there was only a very small rightward displacement of the F-V at low pH, in contrast to the marked displacement seen in the wt linker channel (Cha and Bezanilla 1998). The rightward displacement normally seen correlates with a displacement of the Q-V caused by surface charge screening at low pH (Starace et al. 1997). The absence of modulation by pH of the fluorescence amplitude and voltage dependence makes it likely that the group described by Cha and Bezanilla 1998 is no longer present in the 5-aa linker channel and that this group or another also present in the S3–S4 linker may be partly responsible for the surface charge effect.
Figure 8.

pH-dependent modulation of TMRM fluorescence. Mean ± SEM for five oocytes of fluorescence intensity for M356C 5-aa linker taken at the end of 100-ms pulses from HP = −90 mV. The fluorescence intensities were normalized to the amplitude obtained at 160 mV for pH 7.4.
DISCUSSION
Origin of the Protein Vestibule at the Outside of S4
A pH-titratable protein vestibule outside the S4 has been held responsible for voltage-dependent quenching of TMRM attached near the S4 (Cha and Bezanilla 1998). With the deletion of 26 amino acids in the S3–S4 linker, the fluorescence signal at one position (M356C) was diminished by an order of magnitude, whereas the signal at another position (A359C) reversed so that a decrease in quenching was observed upon depolarization. This suggests that the majority of the quenching groups were deleted with the S3–S4 linker, or that the movement of the probes has become smaller or relocalized with respect to the quenching groups. Since the 5-aa linker channel functions as a voltage-gated K+ channel and has the normal translocated charge per channel of ∼12 e 0, it is therefore indicated that the voltage sensor is capable of making the full transition from deactivated to activated state, albeit with slower kinetics (Gonzalez et al. 2000). At position M356C, it was shown that the residual fluorescence signal in the deletion mutant did not titrate notably with pH, in contrast to the wt linker channel (Cha and Bezanilla 1998). Thus, with respect to magnitude (M356C), polarity (A359C), and pH dependence, the properties of groups interacting with the TMRM probe have become markedly different upon deletion of the S3–S4 linker. We therefore suggest that the majority of the protein vestibule and the group(s) involved in quenching of fluorescence signals outside the S4 segment in the wild-type channel resides in the S3–S4 linker.
With pH-titration, Cha and Bezanilla 1998 showed that both M356C-TMRM and A359C-TMRM interact with residues with pKa < 5 at hyperpolarized potentials. The lack of pH effect seen in the 5-aa linker mutant could be due to the shortening of the linker that may have moved M356C away from other titratable groups. However, since the S3–S4 linker contains a streak of three glutamic acids followed by an aspartic acid (E333-5, D336) near the S3, it is tempting to propose that these residues are the pH-titratable part of the protein that were removed in the 5-aa linker mutant. Since these groups would interact with the probes at hyperpolarized potentials, this would place them near the NH2-terminal region of the retracted (deactivated) S4 segment, in agreement with the proposal that the outside of the S3 is in close proximity to the outside of S4 (Papazian and Bezanilla 1997). Consequently, the rest of the 31-aa linker would be draped around the S4 segment, forming a significant part of the protein vestibule outside of S4. The localization of E333-5 and D336 close to the outside of the S4 segment would indicate that they could also be responsible for part of the surface charge shielding effect at low pH or high Ca2+ (Starace et al. 1997). This is in agreement with the observation that this effect was diminished in the deletion mutant (Fig. 8).
Two Quenching Groups and an Intermediate State of the Voltage Sensor
With the A359C-TMRM probe, it became clear that not one, but two groups were available for quenching the signal near the outside S4 segment in the deletion mutant. Furthermore, on oscillating between these two groups, the population of A359C-TMRM probes traversed a state of minimal quenching when moving in the hyperpolarizing direction, but apparently not when moving in the depolarizing direction (but see below). The first, fast downward deflection in signal (increase in fluorescence) was present when holding at positive potentials and applying hyperpolarizing voltage steps, and may arise from the probe moving away from a group (QG1) placed at the outside of the S4 segment, close to the activated state of the voltage sensor (Fig. 9 C). The second, slower upward deflection in signal (decrease in fluorescence) was present when going to extreme hyperpolarizations, and the other quenching group (QG2) must therefore reside close to the fully retracted state of the S4 segment (Fig. 9 A).
The interaction of the A359C-TMRM probe with a quenching group (QG2) at hyperpolarized potentials is also present at this position (A359C) in the wt linker W434F channel, giving rise to a slight increase in signal at hyperpolarized potentials, as described previously (see Fig. 3B and Fig. E, in Cha and Bezanilla 1997), and which is absent from the M356C-TMRM signal. However, due to the large quenching seen at depolarized potentials when the S3–S4 linker is present, this was not easy to study in further detail. We therefore proceeded to study the L361C mutant in the wt W434F channel since this mutant had the cysteine placed two residues closer to the putative quenching group at hyperpolarized potentials. This mutation revealed that attachment of TMRM caused a leftward shift of the Q-V, with a large part of the gating charge now moving at −160 mV. At the same time, the gating charge movement at −160 mV was associated with a fluorescence signal. It is interesting that in the previous investigation of A359C in the wt linker channel it was also found that attachment of TMRM caused a leftward shift in the Q-V (Cha and Bezanilla 1997; Table ). We suggest that TMRM is able to interact with a group in the protein (probably located in the inner crevice), causing an increased Cole-Moore shift, and that in the 5-aa linker mutation this interaction persists, in the absence of TMRM staining, as suggested by the experiments on the M356C, which demonstrated the progressive slowdown of the voltage sensor at negative potentials (Fig. 3).
In the L361C W434F wt linker channel, the activation is faster than in the deletion mutant, and therefore gating currents are easier to measure, which made it possible to determine that both parts of the fluorescence signal track conformational changes carrying gating charge (Fig. 6 and Fig. 7). Although the signal in L361C was biphasic, the difference in fluorescence between the intermediate state and the two other states was clearly much larger when the linker was deleted. This places the linker close to the S2 state of the A359C probe.
A Two-Step Activation Model Describes the Fluorescence Change
Both the fast and slow parts of the fluorescence trace track conformational changes related to charge carrying transitions near the S4 segment. This makes it possible to further explore the three-state model in Fig. 9 by directly fitting the kinetic equivalent of this model (Fig. 10 A) to fluorescence data. With the above data, it became clear that all rate parameters (Fig. 10 A, α, β, γ, and δ) must be modeled as being voltage dependent. Furthermore, each state has assigned to it its own fluorescence intensity, which adds another three free parameters to the model in this case. We chose to fit the model to the A359C 5-aa linker data, since in this mutant the fast and slow fluorescence components had comparable magnitudes, thereby furnishing the two interconversions in the kinetic scheme with similar weights during the fit. The model was fitted simultaneously to seven traces from two holding potentials, showing the characteristic features of the signal. The resulting fit represents the data well (Fig. 10 B). The fit is most satisfactory for extreme voltage steps, which is expected when considering that at least eight states in a linear scheme are required to fit the gating charge movement of the Shaker channel (Bezanilla et al. 1994). The deviations of the model from the data at intermediate potentials confirms the necessity of more than three states in describing the movement of the voltage sensor.
Figure 10.
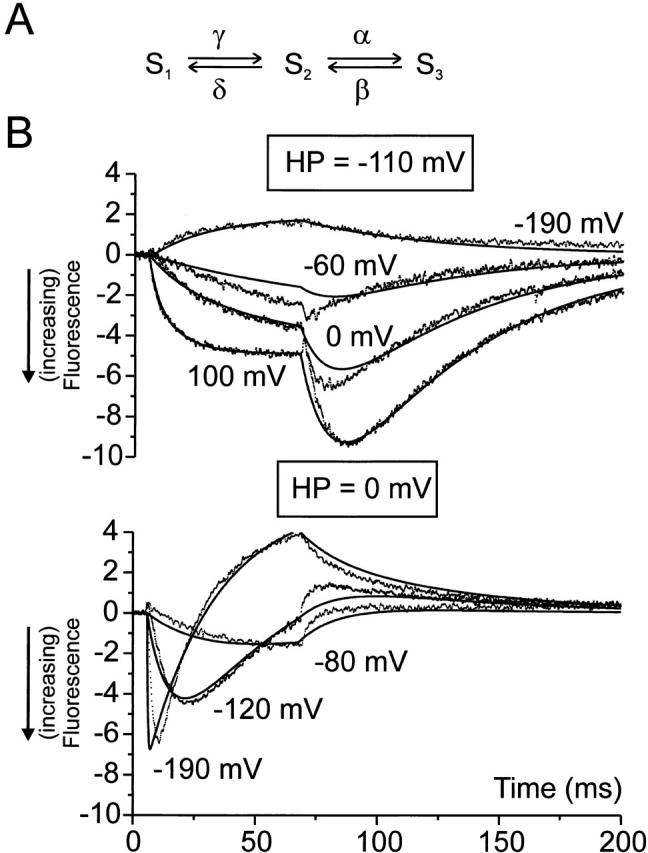
(A) Model used to account for biphasic fluorescence traces in the A359C 5-aa linker and the L361C wt linker channel. The rate constants α, β, γ, and δ were all assumed to be voltage dependent, in agreement with the demonstration that both interconversions carried gating charges. Thus α = α0 exp[z α eV/(kT)], β = β0 exp[−z β eV/(kT)], γ = γ0 exp[z γ eV/(k T)], δ = δ0 exp[−z δ eV/(kT)], where z is the fractional charge in elementary charge units, e is the elementary charge, k is Boltzmann's constant, V is the transmembrane voltage, and T is the absolute temperature. (B) Seven fluorescence traces (points) for the A359C 5-aa linker distributed between two holding potentials (−110 and 0 mV). The seven traces were fitted simultaneously with the three-state model in A and the fit displayed as lines. Fitted as free parameters were the eight rate constant parameters (α0, β0, γ0, δ0 , z α, z β , z γ , z δ), the three fluorescence intensities (negative values are higher fluorescence) associated with the three states (FS1, FS2, FS3), one parameter (Ws) for the interaction energy with the voltage sensor when the channel is C-type inactivated (Olcese et al. 1997), leading to a leftward displacement of the gating in the case of HP = 0 mV (Ws was set to zero for HP = −90 mV). Finally, one parameter (bleach) allowing the two holding potentials to have different absolute fluorescence intensities, due to the unavoidable bleaching of the fluorescence probe. The fitted values were: α0 = 59.7 s−1, β0 = 0.216 s−1, γ0 = 16.4 s−1, δ0 = 5.00 s−1, z α = 0.439, z β = 1.32, z γ = 0.430, z δ = 0.279, FS1 = 0.892, FS2 = −12.2, FS3 = −4.80, WS = 0.155 (kT U), bleach = 1.23 (i.e., total fluorescence intensity was 23% higher at HP = −110 mV compared with 0 mV).
The fitted parameters of the model confirms the interpretation suggested above: the middle state (S2) has the highest fluorescence intensity (lowest quenching; −12.2 vs. 0.9 for S1 and −4.8 for S2). The hysteresis of the fluorescence signal at large voltage steps is explained by the difference in kinetics between hyperpolarizing and depolarizing voltage steps. Thus, when stepping, for instance from −110 to 100 mV, the rate constant for entry into state S2 is much smaller than from exit (γ < α). During the return of the voltage sensor (from 100 to −110 mV), the rate constant for entry into state S2 is now larger than that of exit (β > δ). As a consequence, S2 is heavily populated and the fluorescence signal is biphasic only when the potential is stepped in a hyperpolarizing direction, not when it is stepped in a depolarizing direction.
The demonstration that both A359C-TMRM and M356C-TMRM interact with a group outside the S4 segment at depolarized potentials has been economically combined in the model in Fig. 9 by assuming that the same group is involved. The model in Fig. 9 pictures the activation as a rotation of the S4 segment (Bezanilla 2000), rather than a translocation out of the membrane, in order to account for histidine mutagenesis results (Starace et al. 1997) and the distance measurements using lanthanide-based resonance energy transfer (Cha et al. 1999). However, based on the results presented in this paper, other models clearly could also be suggested.
The consequence of applying Fig. 9 or Fig. 10 A to the W434F channel is that there is an intermediate state of the voltage sensor and that activation takes place in (at least) two separate movements. When considering the position of the two parts of the Q-V in the TMRM-labeled L361C (Fig. 7 A), it is most likely that the gating charge moving at −160 mV (Fig. 7 B) moves within the leftward Boltzmann in this mutant, which we denote as Q1 L361C. The two phases of the fluorescence signal when stepping to negative potentials from HP = 0 mV, therefore, most likely correspond to Q2 L361C (the fast part of the fluorescence signal) and Q1 L361C (the slow fluorescence signal), respectively. This conclusion was made possible by the identification of a mutant (L361C) that in the TMRM-stained situation has a better separation between Q1 and Q2 than the wt channel, combined with a fluorescence signal correlating with Q1 L361C. The same conclusion was reached by Baker et al. 1998, who showed that charge-neutralization mutations in S4 segment at R365 (R365C or R365S) were associated with a broadening of the Q-V and a separating out of the two Boltzmann components Q1 R365C/S and Q2 R365C/S. Using the double-reporter channel R365C/F370C, Baker et al. 1998 then showed that movement of the Q1 R365C was associated with protection of F370C from internal modification with methanethiosulfonate-ethyltrimethylammonium (MTSET) and movement of Q2 R365C associated with exposure of R365C to modification from the outside. We have shown here that a charge-conserving mutation that converts a leucine to a cysteine at position 361 in itself results in a broadening of the Q-V, and if the bulky TMRM-probe is attached, the Q1 L361C is displaced to the left by at least 50 mV.
Whereas our data agree with those of Baker et al. 1998 in requiring two separate movements of the S4, in our interpretation we point out that no identification can be made based on the present data as to whether the conformational basis of the two Boltzmanns, Q1 L361C and Q2 L361C, in the mutants, correspond to that of the Q1 and Q2 identified for the W434F channel by Bezanilla et al., 1994. For instance, the Q1 L361C seems to encompass well over 50% of the Q-V, whereas for the Q1 in W434F it was only ∼30% (Bezanilla et al. 1994, and Table ). In our data, we noted that the mutation L361C in itself resulted in a broadening of the Q-V and the attachment of TMRM displaces Q1 L361C to the left. This raises the possibility that these changes to the channel structure destabilize the deactivated state of the voltage sensor and create a novel stable state, where some of the charge has already moved (corresponding to Q1 L361C). Nevertheless, by applying extremely hyperpolarized potentials, the voltage sensor can be moved further into the fully deactivated state, giving rise to the Q1 L361C and the fluorescence signal.
Conclusions
The results presented here confirm the hypothesis that a large fraction of the protein-lined vestibule outside the S4 segment is made up by the S3–S4 linker. The acidic residues of this linker may be responsible for the pH effects on fluorescence changes. After the removal of 22 amino acids of the linker, the probe at M356, placed close to the outside of the S3 segment, still tracked deactivation gating charge movement, but displayed a markedly slower fluorescence change than expected from the gating charge movement during activating voltage steps. Position A359 in the same deletion interacts with two different quenching groups, revealing an intermediate state of the sensor movement. This intermediate state was also seen in the Shaker with wt linker when the leucine at position 361 was replaced with cysteine, suggesting that these mutations stabilize the sensor movement after about half of the charge has translocated.
Acknowledgments
This work was supported by National Institutes of Health (NIH) grant GM30376 (F. Bezanilla) and Chilean grants FONDECYT 197-0739 (R. Latorre) and Cátedra Presidencial (R. Latorre). J.B. Sørensen was supported by a university scholarship from University of Copenhagen. A. Cha was also supported by NIH grant GM08042, a National Research Service Award from the National Institute of Mental Health, and the UCLA Medical Scientist Training Program.
Footnotes
Portions of this work were previously published in abstract form (Sørensen, J.B., A. Cha, R. Latorre, E. Rosenmann, and F. Bezanilla. 1999. Biophys. J. 76:A411).
Abbreviations used in this paper: aa, amino acid; HP, holding potential; wt, wild type; TMRM, tetramethylrhodamine.
Due to false saturation of the Q-V, it was not possible to identify the exact magnitude of the displacement.
References
- Baker O.S., Larsson H.P., Mannuzzu L.M., Isacoff E.Y. Three transmembrane conformations and sequence-dependent displacements of the S4 domain in Shaker K+ channel gating. Neuron. 1998;20:1283–1294. doi: 10.1016/s0896-6273(00)80507-3. [DOI] [PubMed] [Google Scholar]
- Bezanilla F., Perozo E., Stefani E. Gating of Shaker K+ channelsII. The components of gating currents and a model of channel activation. Biophys. J. 1994;66:1011–1021. doi: 10.1016/S0006-3495(94)80882-3. [DOI] [PMC free article] [PubMed] [Google Scholar]
- Bezanilla F. The voltage sensor in voltage dependent ion channels. Physiol. Rev. 2000;80:555–592. doi: 10.1152/physrev.2000.80.2.555. [DOI] [PubMed] [Google Scholar]
- Cha A., Bezanilla F. Characterizing voltage-dependent conformational changes in the Shaker K+ channel with fluorescence. Neuron. 1997;19:1127–1140. doi: 10.1016/s0896-6273(00)80403-1. [DOI] [PubMed] [Google Scholar]
- Cha A., Bezanilla F. Structural implications of fluorescence quenching in the Shaker K+ channel. J. Gen. Physiol. 1998;112:391–408. doi: 10.1085/jgp.112.4.391. [DOI] [PMC free article] [PubMed] [Google Scholar]
- Cha A., Snyder G.E., Selvin P.R., Bezanilla F. Atomic scale movement of the voltage- sensing region in a potassium channel measured via spectroscopy. Nature. 1999;402:809–813. doi: 10.1038/45552. [DOI] [PubMed] [Google Scholar]
- Gonzalez C., Rosenmann E., Bezanilla F., Alvarez O., Latorre R. Modulation of the Shaker K+ channel gating kinetics by the S3-S4 linker. J. Gen. Physiol. 2000;115:193–207. doi: 10.1085/jgp.115.2.193. [DOI] [PMC free article] [PubMed] [Google Scholar]
- Loots E., Isacoff E.Y. Protein rearrangements underlying slow inactivation of the Shaker K+ channel. J. Gen. Physiol. 1998;112:377–389. doi: 10.1085/jgp.112.4.377. [DOI] [PMC free article] [PubMed] [Google Scholar]
- Mannuzzu L.M., Moronne M.M., Isacoff E.Y. Direct physical measure of conformational rearrangement underlying potassium channel gating. Science. 1996;271:213–216. doi: 10.1126/science.271.5246.213. [DOI] [PubMed] [Google Scholar]
- Moore, D.D. 1994. Mutagenesis of cloned DNA. In Current Protocols in Molecular Biology. F.M. Ausubel, R. Brent, R.E. Kingston, D.D. Moore, J.G. Seidman, J.A. Smith, and K. Struhl, editors. John Wiley & Sons, Inc., New York, NY. 8.2.8–8.2.11.
- Olcese R., Latorre R., Toro L., Bezanilla F., Stefani E. Correlation between charge movement and ionic current during slow inactivation in Shaker K+ channels. J. Gen. Physiol. 1997;110:579–589. doi: 10.1085/jgp.110.5.579. [DOI] [PMC free article] [PubMed] [Google Scholar]
- Papazian D.M., Bezanilla F. How does an ion channel sense voltage? News Physiol. Sci. 1997;12:203–210. [Google Scholar]
- Starace D.M., Stefani E., Bezanilla F. Voltage-dependent proton transport by the voltage sensor of the Shaker K+ channel. Neuron. 1997;19:1319–1327. doi: 10.1016/s0896-6273(00)80422-5. [DOI] [PubMed] [Google Scholar]
- Stefani E., Toro L., Perozo E., Bezanilla F. Gating of Shaker K+ channels. I. Ionic and gating currents. Biophys. J. 1994;66:996–1010. doi: 10.1016/S0006-3495(94)80881-1. [DOI] [PMC free article] [PubMed] [Google Scholar]
- Yang N., George A.L., Jr., Horn R. Probing the outer vestibule of a sodium channel voltage sensor. Biophys. J. 1997;73:2260–2268. doi: 10.1016/S0006-3495(97)78258-4. [DOI] [PMC free article] [PubMed] [Google Scholar]