

Abstract
Amplitude, spatial width, and rise time of Ca2+ sparks were compared in frog fast-twitch muscle, in three conditions that alter activation of release channels by [Ca2+]. A total of ∼17,000 sparks from 30 cells were evaluated. In cells under voltage clamp, caffeine (0.5 or 1 mM) increased average spark width by 28%, rise time by 18%, and amplitude by 7%. Increases in width were significant even among events of the same rise time. Spontaneous events recorded in permeabilized fibers with low internal [Mg2+] (0.4 mM), had width and rise times greater than in reference, and not significantly different than those in caffeine. The spark average in reference rides on a continuous fluorescence “ridge” and is continued by an “ember,” a prolongation of width ∼1 μm and amplitude <0.2, vanishing in ∼100 ms. Ridge and ember were absent in caffeine and in permeabilized cells. Exposure of voltage-clamped cells to high internal [Mg2+] (7 mM) had effects opposite to caffeine, reducing spark width by 26% and amplitude by 27%. In high [Mg2+], the ember was visible in individual sparks as a prolongation of variable duration and amplitude up to 1.2. Based on simulations and calculation of Ca2+ release flux from averaged sparks, the increase in spark width caused by caffeine was interpreted as evidence of an increase in radius of the release source—presumably by recruitment of additional channels. Conversely, spark narrowing suggests loss of contributing channels in high Mg2+. Therefore, these changes in spark width at constant rise times are evidence of a multichannel origin of sparks. Because ridge and ember were reduced by promoters of Ca2+-dependent activation (caffeine, low [Mg2+]) and became more visible in the presence of its inhibitors, they are probably manifestations of Ca2+ release directly operated by voltage sensors.
Keywords: excitation–contraction coupling, calcium sparks, ryanodine receptors, caffeine, magnesium
INTRODUCTION
In striated muscle, Ca2+ for contractile activation comes largely from the sarcoplasmic reticulum (SR) through ryanodine receptors (Ryr), channel molecules susceptible to activation and inhibition by Ca2+ (Franzini-Armstrong and Protasi 1997; Leong and MacLennan 1998). In skeletal muscle, a sui-generis Ca2+ channel of the L-type, named the dihydropyridine receptor and resident in the transverse-tubule (T-tubule) membrane (Ríos and Brum 1987; Tanabe et al. 1988), translates membrane depolarization (Hodgkin and Horowicz 1960) to a mechanical influence that causes opening of Ryrs (Schneider and Chandler 1973; Nakai et al. 1996). Reasonably, the increased [Ca2+]i, a consequence of this opening, should interact with the Ca2+-sensitive Ryrs to open them further. To what extent this Ca2+-induced Ca2+ release (CICR) mechanism contributes to physiological Ca2+ release during an action potential is still debated (Fabiato 1984; Endo 1985; Ríos and Pizarro 1991; Jacquemond et al. 1991; Pape et al. 1993).
A substantial evidence of CICR involvement is the existence of Ca2+ sparks (Cheng et al. 1993). In skeletal muscle, they are believed to be largely a manifestation of CICR, based on their similarity with sparks of cardiac muscle, where CICR is the main activation mechanism, and their higher frequency upon increasing cytoplasmic [Ca2+] (Klein et al. 1996). Another indication that CICR underlies sparks is their rapid kinetics, matching those of the initial peak of Ca2+ release flux (Baylor et al. 1983; Melzer et al. 1984), which is believed to contain the greatest CICR contribution within the whole-cell release waveform (Jacquemond et al. 1991; Ríos and Pizarro 1991).
However attractive, the idea that sparks constitute the “quanta” of release and are activated by CICR brings up new puzzles, including the precise nature of the contribution of voltage to release (whether it consists of sparks as well, or some other form, like the event-less release described by Shirokova and Ríos 1997), the number of channels involved in a spark (Schneider 1999; Shirokova et al. 1999), the relationship between function and triadic structure [underscored by the existence of two isoforms of ryanodine receptors in skeletal muscle (Sutko and Airey 1996) and of release channels that are not directly connected to voltage sensors (Block et al. 1988)], and, finally, the absence (Shirokova et al. 1998) or scarcity (Conklin et al. 1999) of sparks in adult mammalian muscle.
The diagrams in Fig. 1 present these issues pictorially on a hypothetical cluster of release channels in a frog muscle junction (presumably constituted by all the channels in a “couplon,” or continuous junctional segment of terminal cisterna). Because it is not known whether the alternating pattern of voltage sensors described by Block et al. 1988 applies to frog fast-twitch muscle, we assumed a less restrictive pattern in the drawing. The arrows depicting release represent various possibilities of local control. In Fig. 1A and Fig. B, individual channels are responsible for sparks; sparks may be elicited by voltage or Ca2+ (A), and a voltage spark may activate a neighbor to produce a “mixed” spark (B, as proposed by Klein et al. 1996).
Figure 1.
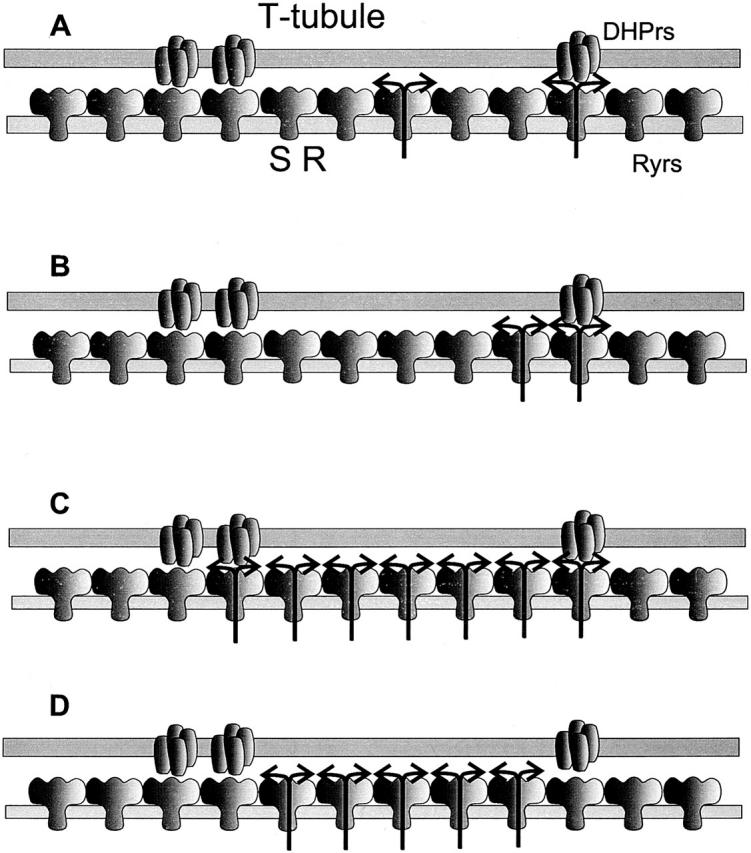
Possible mechanisms of Ca2+ spark generation in frog muscle. Represented are tetrads of dihydropyridine receptors (DHPrs) in the T-tubule membrane facing arrays of release channels in the SR. Arrays are finite couplons, terminated at the end of the junctional segment of T-tubule. Fewer than half of the release channels have voltage sensor tetrads, consistent with a higher stoichiometry of Ryrs to DHPrs in frog muscle (reviewed in Shirokova et al. 1996). (A) Hypothetical sparks produced by single channels, triggered by voltage sensors (right side) or “spontaneous”. (B) A voltage-operated channel opens, and its Ca2+ activates a neighboring sensorless channel, resulting in a two-channel spark. (C and D) Multichannel sparks, triggered by voltage and propagated by Ca2+ (C) or spontaneous, started by stochastic opening of a sensorless channel and propagated by Ca2+ (D). One of the important questions left unspecified in the diagrams is whether voltage-operated channels may also respond to Ca2+ with activation, and/or develop the inactivation that ends sparks.
To underscore that the number of channels involved in a spark is uncertain, a multichannel mechanism is represented in Fig. 1C and Fig. D. Here, sparks result from the opening (presumably synchronized by Ca2+ or allosteric interactions) of several channels. Again, a voltage-operated channel may start the process (C), but spontaneous sparks also occur (D), which may not involve and do not need voltage-gated release as they may occur in situations when the voltage sensors are inactivated. These multichannel schemes raise the question of the precise contribution by voltage-operated channels. Indeed, it is not clear whether voltage-operated release exists at all, apart from CICR.
To address these questions, we compared the morphology of sparks in “reference” conditions with that in conditions that maximize CICR (the presence of caffeine or of very low [Mg2+]) or inhibit the release channel and interfere with CICR (very high intracellular [Mg2+]).
Caffeine at millimolar concentrations induces muscle contracture (Axelsson and Thesleff 1958; Lüttgau and Oetliker 1968). Studies with skinned skeletal fibers (Endo et al. 1970; Endo 1975; Endo 1985) have shown that caffeine potentiates CICR. Rousseau et al. 1988 demonstrated using vesicles and bilayers that it increases the affinity of Ca2+ activation sites for Ca2+ (as proposed by Kirino et al. 1983; Nagasaki and Kasai 1983; reviewed by Herrmann-Frank et al. 1999).
Mg2+, on the other hand, is a classic inhibitor of the release channel. It interferes with CICR specifically, binding to the (high affinity) Ca2+ activation site, and it shares with Ca2+ a (low affinity) inhibitory effect. Its physiological concentration, near 1 mM, is important in maintaining the channels closed at rest, as sparks occur spontaneously in depolarized cells at [Mg2+] below 0.5 mM (Lacampagne et al. 1998).
Studying massive numbers of sparks, we characterized the effects of caffeine and high Mg2+ on local aspects of Ca2+ release. Two components, apparently controlled by different mechanisms, could be separated within the local events.
MATERIALS AND METHODS
Experiments were carried out in cut skeletal muscle fibers from the semitendinosus muscle of Rana pipiens. Adult frogs were anaesthetized in 15% ethanol, and then killed by pithing. Fibers were mounted, at sarcomere lengths of 3.2–3.6 μm, on the stage of an inverted microscope (Axiovert 100 TV; Carl Zeiss, Inc.) equipped for confocal scanning of laser-excited fluorescence (MRC 1000; Bio-Rad Laboratories).
Three types of studies were done: experiments on the effects of caffeine, under voltage clamp, experiments on “spontaneous” sparks, carried out in permeabilized cells, and experiments in high intracellular [Mg2+], also under voltage clamp. The implementation of voltage clamp was as described by González and Ríos 1993. The methods for permeabilized cells, derived from those of Lacampagne et al. 1998 were described by Ríos et al. 1999.
Solutions
The external solution contained (mM) 10 Ca(CH3SO3)2, 110 TEA-CH3SO3, 10 mM HEPES, 1 3,4 diaminopyridine, and 1 μM tetrodotoxin. Internal solutions with four different [Mg2+] were formulated using stability constants for EGTA, ATP, and phosphocreatine from Martell and Smith 1974 or references therein, plus dissociation constants of 1.03 μM for Ca-fluo-3 (Harkins et al. 1993) and 117 mM for Mg-glutamate (Kirsch, W.G., A. González, N. Shirokova, and E. Ríos, manuscript in preparation). They all contained (mM) ∼100 Cs-glutamate (changed to adjust osmolality), 1 EGTA, 5 glucose, 5 phosphocreatine, 10 HEPES, 5 Mg-ATP, 0.2 fluo-3 (Molecular Probes), added calcium for a nominal [Ca2+] of 100 nM, and MgCl2 or MgS04 to set free [Mg2+]. The standard internal solution (e.g., Ríos et al. 1999) had 0.5 mM MgCl2 added, for a nominal [Mg2+] of 0.54 mM. The low [Mg2+] internal solution had 0.25 mM MgCl2 added (0.41 mM nominal [Mg2+]), plus 8% (40,000 kD) dextran. The high [Mg2+] internal solution had 17 mM MgSO4 added (6.9 mM nominal [Mg2+]). The Mg2+ washout solution had 5 mM citrate and no Mg2+ added (0.13 mM [Mg2+]). Solutions were titrated to pH 7 and adjusted to 270 mosmol/kg (external) or 260 mosmol/kg (internal) by modifying Cs-glutamate. Experiments were at 17°C.
The scanning microscope was in standard fluo-3 configuration (Ríos et al. 1999) and used a 40×, 1.2 n.a. water immersion objective (Carl Zeiss, Inc.). Images shown are of fluorescence of fluo-3, determined at 2-ms intervals at 768 points of abscissa x j along a line parallel to the fiber axis. Fluorescence intensity, F(x,t), was normalized to the baseline intensity F 0(x), derived as an average of F(x,t) before the depolarization pulse (in voltage-clamp experiments) or as the average in the nonspark regions (in permeabilized cell experiments). When used, filtering of images included a two-dimensional three-point median [in which F(x i,t i) is replaced by F m(x j,t i) = median of F(x,t) in the nine pixels surrounding j,i], followed if so specified by a digital low pass of space constant 0.5 μM and time constant 6 ms.
Detection of Sparks
Sparks were detected by a computer procedure described earlier (Cheng et al. 1999) that locates events automatically on tens of images, characterizing thousands of events per experiment in a reasonable analysis time. Events were detected by an absolute criterion, simply a separation of fluorescence from a global level by a set fraction of resting fluorescence, or one determined relative to regional noise.
In the present study, the relative threshold algorithm was given multiple guards (developed by H. Cheng, Cardiovascular Research Laboratory, NIA, NIH, Baltimore, MD) that allowed it to separate sparks positioned close in time within the same triad region, separate sparks with origins at short distances, reject events based on minimal signal mass that is considered acceptable (a criterion that simultaneously takes into account amplitude and spatial width), and implement a better characterization of regional noise to set the threshold amplitude. While the absolute method is better for comparison of different conditions resulting in changes of resting fluorescence, the newly refined relative method is less susceptible to false detection of small sparks and therefore better suited for studying relationships between spark parameters within a homogeneous set of images. We systematically applied both methods to the same images, obtaining qualitatively similar effects.
Four morphological parameters were determined on the identified events: amplitude (a), full width at half magnitude (FWHM or “spatial width”), full duration at half magnitude (FDHM), and rise time. a was determined as the difference between the peak value of the normalized fluorescence and its baseline value at the same spatial position immediately before the event (the average of 10 values between 40 and 20 ms before the peak). FWHM was determined on the spatial distribution of fluorescence at the time of maximum change, simply as the number of pixels above half amplitude multiplied by the scanning increment (0.1428 μM). Occasionally, it was done on a spline interpolate, which increases the apparent resolution and improves visualization of scatter plots. FDHM was determined on the time dependence at the spark center. Rise time as the interval between time to 10% increase from pre-event baseline and time to peak, determined on a spline interpolate of the time-dependent fluorescence, and then averaged over three spatial pixels at the center of the spark (which nominally enhances time resolution threefold). Even though the event locator uses filtration steps, the morphometric measurements were carried out on the unfiltered normalized image. The automatic locator also allowed for the averaging of sparks; specifically of an array of pixels around the peak of each event. Averages included all sparks detected, sometimes subject to additional criteria, namely rise times within a narrow range, or peak amplitudes above a certain value (which preferentially reduces sparks farther from the scanned line; Ríos et al. 1999).
Simulation of Sparks
Simulations of fluorescence increases due to local Ca2+ release were carried out as described by Ríos et al., 1999. An assumed release current was deposited uniformly into a sphere in the presence of an isotropic myoplasm containing endogenous buffers. Reaction–diffusion equations describing the movements of Ca2+, and Ca2+-bound and -free fluo-3, were solved (PDEASE; Macsyma Inc.) to calculate the concentration of Ca2+-bound fluo-3, hence the fluorescence. The calculated fluorescence was then blurred according to the experimentally determined point spread function of the imaging system.
Release Flux
Release flux under individual sparks was calculated as described by Ríos et al. 1999, on averages of the events located automatically. Because fluorescence images are obtained in scans along a line, the fluorescence information available is assumed to apply equally to all directions in space (i.e., sparks are assumed to be centered on the scanned line, and symmetric). Using this assumption, plus specific assumptions about dye reactivity and diffusion, the fluorescence of a spark and its surrounding space–time region is first processed to derive free [Ca2+] as a function of space and time. Then, release flux is computed as the sum of binding fluxes to the known binding molecules. As with earlier whole-cell methods (Baylor et al. 1983), this calculation assumes values for a set of parameters [listed in Table (I) of Ríos et al., 1999], which are the same as used in the spark simulation technique described in the previous paragraph. The result of the calculation is a spatially resolved flux density (with units of concentration over time). Volume integration of this density yields flux (quantity per unit time), which can be converted to Ca2+ current.
Membrane current was recorded throughout the experiments. The solutions and pulse protocols used were suitable to determine intramembranous charge movement (González and Ríos 1993), and asymmetric current was visualized on-line and stored. Standards of electrophysiologic viability were required in the experiments, including conversion of at least 70% of charge 2 upon initial membrane polarization (Brum and Ríos 1987) and maintenance of holding current within 30% of the steady level reached upon initial polarization.
RESULTS
Properties of sparks were first characterized in reference conditions under voltage clamp, with special attention to the correlations among morphometric parameters. Then three conditions were studied, designed to maximize putative contributions of Ca2+ or voltage. (a) In fibers under voltage clamp, we studied the effects of caffeine (used at “low” concentrations to increase the sensitivity of release channels to Ca2+, hence maximizing the CICR component in sparks). (b) Spontaneous sparks were characterized in permeabilized, depolarized fibers, where presumably voltage has no role. (c) Events were also elicited by voltage clamp at high cytoplasmic [Mg2+], to reduce or eliminate CICR, therefore maximizing the relative contribution of voltage.
Sparks Under Voltage Clamp in Reference Conditions
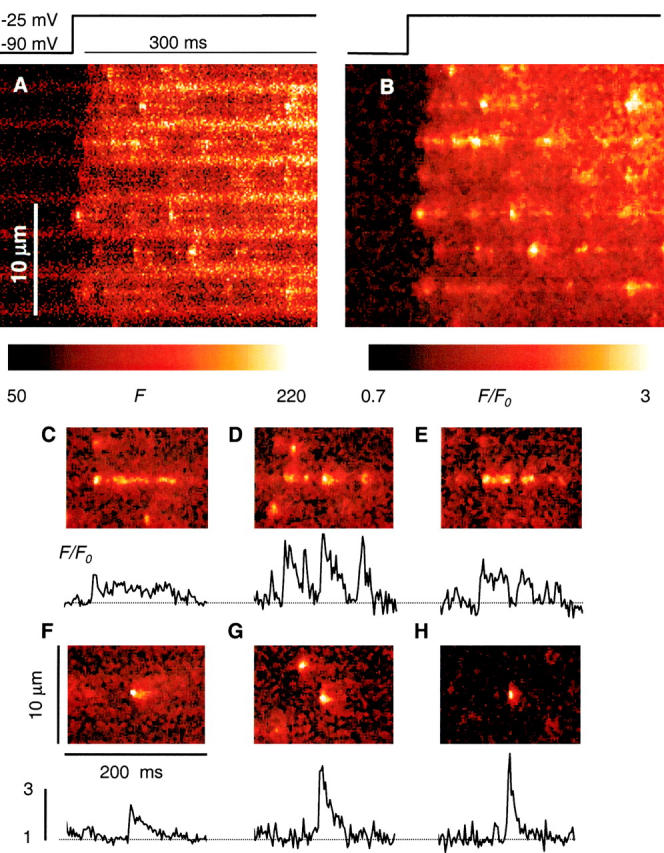
Reference sparks and the effect of caffeine were studied on fibers held under voltage clamp at a resting potential of −90 mV. Fig. 2 presents normalized line scan images (F/F 0) from one experiment in reference, upon introduction of 0.5 mM caffeine in the external solution, and after washout. Sparks were seldom seen at the resting potential in the absence of caffeine, but appeared under pulse depolarization in regions corresponding to Z disks. The pulse voltage was selected so that the frequency of sparks would be <150 per image, 5 or less per image per disk, and the incidence of superposition of rising phases was 6% or less. At such low voltages, the peak of release that occurs early in the pulse at higher voltages was also avoided, and global fluorescence, which builds up slowly during the pulse, was kept within 2 units of resting fluorescence.
Figure 2.

Effect of caffeine and detector performance. Line-scan images of fluorescence normalized to F 0 in a fiber under voltage clamp. Ca2+ release was elicited by depolarization as shown (reference), 2 min after introduction of 0.5 mM caffeine in the external solution, and 3 min after washout with caffeine-free solution. Caffeine mainly causes widening of the discrete events. The boxed portion (middle) is expanded at right, analyzed by the automatic detector. Silhouettes in red indicate regions where the separation from the global fluorescence level met a relative criterion (ΔF/F 0 > 3 SD). Fiber identifier 0507b.
Fig. 2 (inset, grey) illustrates the performance of the automatic detector working on the boxed region of the image in caffeine. In red are the areas where the amplitude threshold (3 SD of the fluorescence in a surrounding region, roughly 0.6 F 0) is surpassed. With this criterion, virtually every event that a human observer would note is recorded, and there are no obvious false positives.
The detector tabulated four morphological parameters of every event (see materials and methods). Average values of these parameters are presented for nine experiments (5,301 events) in Table . Spatial width was distributed broadly around an average of 1.3 μM in the experiment of Fig. 2, or 1.15 μM for all fibers. The distribution of amplitudes was monotonically decaying from 0.5 to a maximum that could reach as much as 13 in some fibers. Rise time was widely distributed, with an average near 5 ms.
Table 1.
A Comparison of Average Spark Morphology in Fibers Treated with Caffeine
| Fiber | Events | Amplitude | Half width | FDHM | Rise time | |||||||||
|---|---|---|---|---|---|---|---|---|---|---|---|---|---|---|
| Ref | Caff | Ref | Caff | Δ | Ref | Caff | Δ | Ref | Caff | Δ | Ref | Caff | Δ | |
| μm | ms | ms | ||||||||||||
| Mean* | 574 | 308 | 1.65 | 1.83 | 0.19‡ | 1.16 | 1.37 | 0.22‡ | 9.01 | 9.86 | 0.85‡ | 4.82 | 5.35 | 0.53‡ |
| SEM | 155 | 59 | 0.06 | 0.06 | 0.06 | 0.05 | 0.06 | 0.02 | 0.21 | 0.33 | 0.23 | 0.15 | 0.19 | 0.22 |
| Mean§ | 619 | 965 | 2.25 | 2.27 | 0.02 | 1.02 | 1.51 | 0.49‡ | 8.55 | 10.73 | 2.18 | 4.73 | 6.32 | 1.59 |
| SEM | 159 | 125 | 0.19 | 0.14 | 0.29 | 0.05 | 0.11 | 0.09 | 0.59 | 2.13 | 1.55 | 0.13 | 1.05 | 0.91 |
| Mean‖ | 1.85 | 1.98 | 0.13 | 1.11 | 1.42 | 0.31‡ | 8.85 | 10.15 | 1.30‡ | 4.79 | 5.67 | 0.88‡ | ||
| SEM | 0.12 | 0.09 | 0.10 | 0.04 | 0.05 | 0.05 | 0.23 | 0.67 | 0.52 | 0.11 | 0.36 | 0.35 | ||
| Mean¶ | 1.77 | 1.83 | 0.05 | 1.17 | 1.41 | 0.24‡ | 11.1 | 12.40 | 1.30‡ | 5.52 | 6.75 | 1.23‡ | ||
| SEM | 0.24 | 0.25 | 0.11 | 0.12 | 0.14 | 0.05 | 1.10 | 1.30 | 0.30 | 0.55 | 0.79 | 0.45 | ||
Listed are averages over six fibers exposed to 0.5 mM* or three fibers in 1 mM§ caffeine; see parameters of events detected using the absolute criterion (ΔF/F 0 > 0.6). ref, averages in reference (that bracket the exposure to caffeine, at 0.5 mM, or precede it, at 1 mM). Δ, average paired differences between averages in ref and caffeine. ‖Mean of all experiments. ¶Mean of corresponding values using the relative threshold (ΔF/F 0 > 3 SD) for detection. ‡Significant at P < 0.05 in a two-tailed t test of paired differences. Note general similarity of results obtained with both methods. The differences (Δ) induced by 0.5 and 1 mM caffeine were significantly different for width only (t test of difference of averages).
The correlation between the morphometric parameters was studied in all cells treated with 0.5 mM caffeine. Only that between width and rise time was significantly different from zero; its correlation coefficient averaged 0.04 ± 0.01 (SEM), and the first-order regression coefficient 0.015 ± 0.004 μM/ms. This number will be used when evaluating the widening of sparks under caffeine.
Effects of Caffeine
After obtaining some 10 line scan images in reference condition (or close to 1,000 events), which took 10–20 min of recording, external solution with 0.5 or 1 mM caffeine was introduced in the chamber. 0.5 mM was the lowest concentration that consistently produced significant changes in spark morphology and frequency. Concentrations higher than 1 mM were avoided to stay far from the reported dissociation constant of caffeine binding to fluo-3 (21 mM; Muschol et al. 1999). After obtaining a variable number of images, caffeine-free solution was placed in the external compartment and another large set of events was recorded. In six experiments, the fibers were stable during exposure to 0.5 mM caffeine. In five of them a successful washout was performed, while in one fiber at 0.5 mM and all fibers at 1 mM the preparations experienced an increase in resting fluorescence and/or electrical leak upon removal of caffeine, so that washout data were not used.
The images in Fig. 2 illustrate an experiment exhibiting reversibility. The sojourn in caffeine is marked by a visible increase in size of sparks—largely an increase in spatial width, accompanied by lesser increases in rise time and variable changes in amplitude. There was also an increase in frequency, which was compensated by a reduction in pulse voltage by 5 mV (5–15 mV in other experiments). Exposure to caffeine also caused some sparks at the holding potential (−90 mV), which were not significantly different from those elicited during the depolarization (an observation documented below).
In Fig. 3, the averaged morphometric parameters of the experiment of Fig. 2 are plotted versus image order, showing remarkable stability in the course of the experiment. The effects are best evaluated with regard to the regression line, traced through the reference points. As in every experiment, spatial width and rise time were augmented by caffeine. Spark duration increased by approximately the same amount as rise time (not shown), and amplitude did not change. Resting fluorescence F 0, plotted at bottom, was growing slowly throughout, probably reflecting increase in dye during the experiment. It rose somewhat during the time in caffeine, over and above that slow tendency, which suggests a slight increase in resting [Ca2+]i. Because relative spark amplitude, ΔF/F 0, is approximately proportional to the increase in [Ca2+]i relative to resting [Ca2+]i, it is likely that the average Δ[Ca2+]i associated with a spark also went up slightly in caffeine.
Figure 3.

Evolution in time of parameter values. Lines plot average values of three spark parameters and the resting fluorescence vs. image order for five images in reference, four in caffeine, and six after washout, in the experiment of Fig. 2. Image 1 was recorded 60 min after admission of fluo-3 in the end pools, and subsequent images were obtained at 1–2 min intervals. The regression lines are calculated for reference data only (before caffeine and after washout).
The frequency of events per image varied widely. No correlation was found between event frequency and morphology, hence events from images at all frequencies (up to 100 per image) were included in the summaries.
Table lists average parameter values for events detected with the absolute criterion in nine experiments at two caffeine concentrations. Event parameters were first averaged individually, for each experiment. The top two rows list averages and SEM of individual (cell) averages in six experiments in 0.5 mM caffeine and the next two rows list three experiments in 1 mM drug. Columns labeled Δ list differences of averages (caffeine-ref), calculated for each experiment, and then averaged over all experiments. 5,301 sparks were evaluated in reference and 4,741 in caffeine. In rows 5 and 6 are averages that include experiments at both concentrations; caffeine determined significant increases in spatial width and rise time, and a smaller, not significant increase in amplitude. The last two rows list concentration-pooled average effects, evaluated on events detected using the relative threshold 3 SD (6,979 events in reference and 5,168 in caffeine). The numbers are somewhat different, but the effects and their significance are qualitatively the same. Not listed is the effect on resting fluorescence, which on average was increased 10%. Also analyzed were 269 sparks detected in the experiments during exposure to 1 mM caffeine, but in the resting times before or after the pulse. The parameters of those sparks were not different from those during the pulse in the presence of caffeine. In sum, there was a 28% increase in spatial width, an 18% increase in rise time, and a smaller, not significant increase in amplitude. The average differences induced by 1 mM drug were greater than for the lower concentration, but this was significant only for spatial width.
Effects on Spatial Width and Rise Time Are Independent
In simulations (illustrated in Fig. 4, see also Smith et al. 1998; Jiang et al. 1999; Ríos et al. 1999; Shirokova et al. 1999), the half width of the fluorescence event near a Ca2+ source increases with open source duration. Accordingly, the greater width seen in caffeine could be just a consequence of the effect on rise time, which (again in simulations) corresponds closely to source open time. To explore this possibility, the joint distributions of rise time and spatial width were compared in detail (Fig. 4 and Fig. 5).
Figure 4.

Effects of caffeine on distributions of rise time and width. (A and B) Rise-time histograms of events in reference (before and after washout, A) and 0.5 mM caffeine. (C and D) Joint histogram of width and rise time for events in reference or caffeine (interpolated by cubic convolution). The yellow line represents the time course of spatial width for a simulated event, resulting from a 10-pA current released from a spherical source of 0.4 μM (details in materials and methods). Identifier 0507b (same as in previous figures).
Figure 5.

Effects of 1 mM caffeine. Normalized fluorescence in line scans in reference (A) and after 2 min in 1 mM caffeine (B). Note different voltage used to maintain event frequency. (C and D) Corresponding joint histograms of width and rise time for 389 events in reference and 782 in caffeine. Width increases in caffeine, without comparable changes in rise time. (E) Averages of spatial width (±SEM) in successive rise-time intervals (average of interval ± SEM indicated). Note significant increase of width in caffeine at all rise times. Identifier 0315b.
Fig. 4A and Fig. B, shows the histograms of rise times of all events in reference and caffeine in the experiment illustrated before. Remarkably, a mode appears in caffeine, at ∼6 ms, which was not present before caffeine application and shifted to lower rise times upon washout (not shown). Modes in the rise-time histograms were also observed in fibers never exposed to caffeine. Their significance (mainly that they cannot be explained if sparks are produced by single Markovian channels evolving in equilibrium), is considered in detail elsewhere (González et al. 2000c).
Joint histograms of width and rise time are in Fig. 4 C for all reference events (before and after washout), and D for events in caffeine. The histograms are plotted after interpolation by the “cubic convolution” method of Park and Schowengerdt 1983, which improves the visibility of the joint distribution to a greater extent than bicubic and bilinear interpolations (not shown). The yellow line is the time course of spatial width for the fluorescence increase simulated with a 10-pA source of Ca2+ current (details and parameter values given by Ríos et al. 1999), showing how width increases with open time, but recalling also that the actual width of sparks is greater than that of simulated signals, an observation made by several groups, using different simulation methods.
The joint histogram of events in 0.5 mM caffeine shows a mode at 6 ms rise time and a width of ∼1.6 μM, and a lower mode at 2 ms and 0.8 μM, probably due to false detections because it remains when the automatic detector works on images that do not have events recognized by an observer.
The enhancement of spatial width by caffeine is largely independent from its effect on other parameters. Specifically, the distribution of width appears shifted toward higher values in caffeine, at all rise times. The center of mass of the events in caffeine lies well above the region expected if the caffeine effect was simply due to a prolongation of release open time. On average, the regression coefficient for nine fibers in reference was 0.015 ± 0.004 μM/ms, which means that the average increment in spatial width induced by caffeine, 0.24 μM, if due to the change in rise time would require it to be increased by 16 ms, while the actual change was only 1.2 ms (Table ). In conclusion, caffeine exerts an effect on spark width separate from the prolongation of open source time.
The increased width is not a trivial consequence of a change in amplitude, because there is no correlation between these variables and because the average amplitude of events in this range was greater in reference (2.02, vs. 1.96 in caffeine). Nor is it an artifact of variable superposition of events, because the event frequency, which was kept relatively low to minimize superposition, was approximately the same in both conditions. A more obviously independent increase in width and rise time is found in the experiments with 1 mM drug.
Effects of 1 mM Caffeine
The greatest changes in width and rise time were found under this condition. However, they were not correlated: the greatest increase in rise time (almost 5 ms) was found in cell 0315a, while the increase in half width was largest in cell 0315b, illustrated in Fig. 5. Its electrical properties changed somewhat upon drug removal, and no washout data were kept. The results tabulated, however, were obtained while the cell was stable, and are only quantitatively different from those in reversible experiments.
Fig. 5 (top)shows two line scan images, normalized to F 0, obtained in reference and caffeine within a 4-min interval. The joint histograms (Fig. 5C and Fig. D) show that the main effect was a large increase in spatial width. Fig. 5 E shows the relationship between width and rise time in a wider time span: every symbol marks the average spatial width for all events contained in one rise time bin, of variable size. It can be seen that the enhancement in half width due to caffeine is similar at all rise times but the lowest, and that the correlation between rise time and width is equally poor in both conditions.
To isolate the effect on spatial width, averages of all events with rise time near 6 ms (range 5.1–6.9 ms) are compared in Fig. 6. The difference in width induced by caffeine is in remarkable contrast with the similar amplitude and identical rise time. Fig. 6 C shows the spatial profiles of both averages, with a gaussian superimposed. The FWHM of the fitted gaussian was 1.30 μM for reference, and 1.68 for the caffeine average.
Figure 6.

Effects of caffeine on spark averages. (A and B) Two representations of the average of all sparks detected in reference and 1 mM caffeine in the fiber of Fig. 5, with rise times in the range 5.1–6.9 ms. The scales (and color table) are the same for both averages. The color representation shows best a ridge that precedes the spark in reference and an ember that follows it. (C) Spatial profiles at the peak of the average sparks. In green are the best fits by a shifted Gauss function (parameters given in the text). (D) Spatial dependence of the normalized fluorescence between 28 and 48 ms after the peak of the average sparks. Scales for the two curves are shifted for better comparison.
The Ember
The average in reference shows a feature not present in caffeine, which may be described as a low intensity prolongation of the (averaged) spark at its spatial core, an “ember.” It was present with the same characteristics when events occurring during the initial and final 40 ms of the pulse were avoided, to rule out trivial artifacts due to global changes in fluorescence. Fig. 6 D graphs the spatial dependence of the fluorescence averaged during the last 20 ms of the images at top (starting 26 ms after the peak of the spark) showing for the reference average an excess at the center of ∼0.15, not present in caffeine. This ember varies in magnitude in different fibers. It continues the spark without a break, becoming (in the averages) gradually narrower and of lower amplitude. As shown later, embers are seen best at high intracellular [Mg2+].
Fig. 6 A also shows that in reference average sparks ride on a barely visible “ridge,” a local fluorescence increase, centered at the Z disk, which usually lasts for the duration of the depolarizing pulse. Other sparks may contribute to the ridge (or ember), but should not be their main cause, because neither ridge nor ember was visible in caffeine, at voltages that determined similar frequency of sparks.
In summary, caffeine at 0.5–1 mM caused, reversibly and in a dose-dependent manner, an increase in event frequency, a substantial prolongation in rise time, a small increase in amplitude, largely hidden by a small increase in resting fluorescence, and a large increase in width, which was independent from the change in rise time. Events in reference rode on a small ridge of increased fluorescence and their average was prolonged by a narrow and decaying ember. A working hypothesis is that ridge and ember are due, at least in part, to the direct opening of channels by voltage sensors. To test this idea, events obtained without the activating influence of voltage sensors were examined.
The Morphology of Spontaneous Events
Spontaneous events were recorded in large quantities in fibers permeabilized by brief exposure to saponin, and then immersed in an internal solution with low [Mg2+] (which increases spark frequency; Lacampagne et al., 1998). At 0.4 mM, the spark frequency varied between 5 and 50 per image, which approximately matched the range of the voltage clamp experiments. Fig. 7 A shows a line scan image of normalized fluorescence. Note the similarity with events in caffeine (Fig. 2 and Fig. 5). B shows two representations of the average of 168 events with rise times between 5.1 and 6.9 ms (out of 1,187 detected in 68 images). The gaussian fit of the profile through the peak, shown in C, has a FWHM of 1.68 μM, similar to that of the average of events with the same rise time in caffeine (Fig. 6).
Figure 7.

Properties of spontaneous sparks. (A) Normalized fluorescence in a line scan of a permeabilized fiber immersed in internal solution with low [Mg2+]. Sparks are spontaneous. (B) Average of all sparks of rise times between 5.1 and 6.9 ms, detected in 68 images. (C) Spatial profile at the peak of the spark average in B (similar to that in caffeine in Fig. 6). In green is the best gaussian fit. Identifier, 0429a.
Almost 5,000 events were tabulated from 12 experiments with permeabilized fibers. Average parameter values are listed in Table . Spatial width, rise time, and duration were all significantly greater than the corresponding reference values under voltage clamp, while the amplitude was greater but not significantly so. On the other hand, the average parameter values of the spontaneous events were not significantly different from those elicited by voltage in the presence of caffeine (included for comparison in Table ).
Table 2.
Summary of Spark Properties
| No. of | |||||||
|---|---|---|---|---|---|---|---|
| Condition | Events | Cells | Amplitude | Half width | FDHM | Rise time | |
| μm | ms | ms | |||||
| Reference | 5301 | 9 | Mean | 1.85 | 1.11 | 8.85 | 4.79 |
| SEM | 0.12 | 0.05 | 0.23 | 0.35 | |||
| Caffeine | 4741 | 9 | Mean | 1.98 | 1.42 | 10.2 | 5.67 |
| SEM | 0.09 | 0.05 | 0.67 | 0.36 | |||
| Low Mg | 4944 | 12 | Mean | 1.92 | 1.31 | 11.0 | 5.60 |
| SEM | 0.08 | 0.04 | 0.29 | 0.28 | |||
| High Mg | 775 | 7 | Mean | 1.44 | 0.82 | 8.69 | 5.40 |
| SEM | 0.15 | 0.02 | 0.46 | 0.29 | |||
All events detected with amplitude >0.6 were included. Mean, average of individual cell averages. Reference and caffeine entries are the same as in Table , and were both calculated in the same experiments. Low Mg, experiments in permeabilized fibers; High Mg, cells under voltage clamp, after equilibration with a 7 mM Mg2+ internal solution.
In agreement with the idea that ridge and ember reflect directly voltage sensor–operated release, none of these features were present in spontaneous sparks. To complete the test of this idea, and perhaps obtain better conditions for the observation of “voltage-specific” features, the properties of events obtained upon equilibration of the myoplasm with a high [Mg2+] solution were then determined. We expected to minimize CICR and therefore be able to observe local features of release at greater levels of depolarization and voltage sensor activation.
Local Aspects of Release in High [Mg2+]
Observations were carried out in voltage-clamped fibers after variable times of exposure to an internal solution with a total Mg concentration of 22 mM, a free Mg2+ concentration of ∼7 mM, and a [Mg-ATP] of 5 mM. The half time for free Mg2+ equilibration in the cytoplasm (evaluated measuring absorbance of the dye antipyrylazo III at 500 nm; Kirsch et al. 1999) was between 25 and 50 min. Because the events used in the summary list were all obtained after exposure times >75 min, the cytoplasmic [Mg2+] must have been close to 7 mM in all cases.
A representative line scan image of fluorescence obtained in a fiber exposed to high [Mg2+] for 115 min is in Fig. 8. A is the raw fluorescence, and B is F/F 0. Partly because of the electrostatic shift caused by high [Mg2+] (∼9 mV; Kirsch et al. 1999), but largely because of the inhibitory effect of Mg2+, the cell had to be pulsed to −25 mV or higher to elicit events in substantial numbers. Even at these high voltages, events were few, but the increase in fluorescence included a nearly continuous ridge, visible in virtually every disk, on which discrete events were superimposed, giving the image a characteristic aspect of beads on a string. The “string” is most visible after normalization and median filtering (right side), but it can be seen in the raw image as well.
Figure 8.
Local effects of high Mg2+. (A and B) Line scan image of fluorescence in a fiber exposed for 115 min to internal solution with 7 mM [Mg2+]. Release was elicited by depolarization to −25 mV, as indicated. (A) Raw fluorescence. (B) F/F 0, after nine-point median filtering. To improve contrast, color scale does not start at 0. Identifier, 0107b. (C–G) Selected events from images in high Mg2+, normalized and median filtered as in B. (H) An event in reference, with characteristics of an average spark. The graphs under each panel are averages over five pixels at the center of the events, all with the same vertical scale. The color table was adjusted in each panel for best visualization of the increase in fluorescence that follows the sparks. Identifiers for C–H: 1106a, 1022a, 0623a, 0107b, 1022a, 0315a.
Though wider than the ridge, the discrete events were narrow. Average parameters in seven experiments are listed in Table . At 0.82 ± 0.02 μM, their width was 26% less than in reference, and ∼42% less than in caffeine or in permeabilized fibers in low [Mg2+].
Ridge and Ember in High Mg2+
Some events in Fig. 8 B start with a spark, and then are followed by a continuous prolongation of lower amplitude and width. Fig. 8 (bottom) illustrates similar events in other experiments, including for comparison a typical spark in reference (H). The local increases in fluorescence that follow sparks in high Mg2+ had amplitudes (averaged over 0.7 μM) ranging from barely noticeable to more than 1 F 0. Their duration ranged from a few milliseconds to >100 ms. In a few cases, the small local increase preceded the spark. Occasionally, sparks were followed by brief events of low intensity, better described as “after-sparks” than a continuous prolongation (Fig. 8 E). Prolongations like these were very seldom seen in reference and never in low frequency images with caffeine present, or in permeabilized fibers in low Mg2+. In the spark averages, these prolongations result in a prominent ember.
In Fig. 9 is an average of 62 events from the same fiber, selected for having rise times between 3.1 and 7.9 ms. (A similar but noisier average was obtained when the rise times were restricted, as in the caffeine experiments, to between 5.1 and 6.9 ms.) The average spark is narrow (0.82 μM on average for all events in this fiber, 1.17 μM for the gaussian fit shown in Fig. 9 D), and smaller in amplitude. The most remarkable features, however, are the ridge on which sparks ride (spatial profile in purple trace in D), and the notable ember. The “poncho” palette was designed to render the ember and ridge in detail. The temporal profile, in C, shows that the average spark rides on an upward slope, an increase in global fluorescence during the −25-mV pulse, which was subtracted to improve the description.
Figure 9.

Spark averages in high Mg2+. (A and B) Average of normalized fluorescence for all sparks detected in the experiment of Fig. 8 A with rise time in the range 3.1–7.9 ms. Note a ridge, present in the average before the beginning of the spark, and an ember. (C) Fluorescence in the spark average, further averaged in the central 1 μM (7 pixels), vs. time. (D) Spatial profile at the peak of the spark average, with gaussian fit in green. In purple trace is the average fluorescence for 20 ms before the beginning of the spark (the ridge).
The subtraction is done in Fig. 10, where the features of the average spark are compared in high Mg2+ and in caffeine. Fig. 10, top, compares averages after subtracting the global fluorescence level. Fig. 10, bottom, compares these differences as functions of time. Note that the waveform in high Mg2+ includes a ridge (essentially a constant of ∼0.04) and the ember (an excess above the ridge after the spark) that decays with time. The ridge and ember were equally prominent when events in the initial and final 40 ms of the pulse were omitted (not shown).
Figure 10.

Comparison between sparks in caffeine and high Mg2+. (Top) Comparison of the average of sparks for the experiment in Fig. 8 with that of events obtained in the presence of 1 mM caffeine in experiment 0315b (illustrated in Fig. 5 and Fig. 6). Shown is the difference between the average event and the global fluorescence level (obtained as described in text). The color palette spans 1.4 in high Mg2+ or 3.6 in caffeine. The lower graph plots the time profiles of the normalized averages (time course of central seven pixels or 1 μM), scaled to match the peaks. Note that while in caffeine the profile starts from 0 (i.e., the global fluorescence level), the high Mg2+ profile starts above 0 (the ridge) and remains above the starting level for the time span of the graph (the ember).
The effects of high Mg2+ were partially reversible. Two examples are in Fig. 11. A was obtained in a fiber exposed to high Mg2+ for 75 min, and B was obtained 45 min after changing to washout internal solution. The frequency of events increased upon washout and the release became sufficient to cause contractile movement (visible as a bending of the fluorescence pattern at the end of the pulse). In this cell, the events increased in width to 0.95 μM, and their average amplitude increased to 2.02, which are not significantly different from the corresponding values in reference (Table ).
Figure 11.
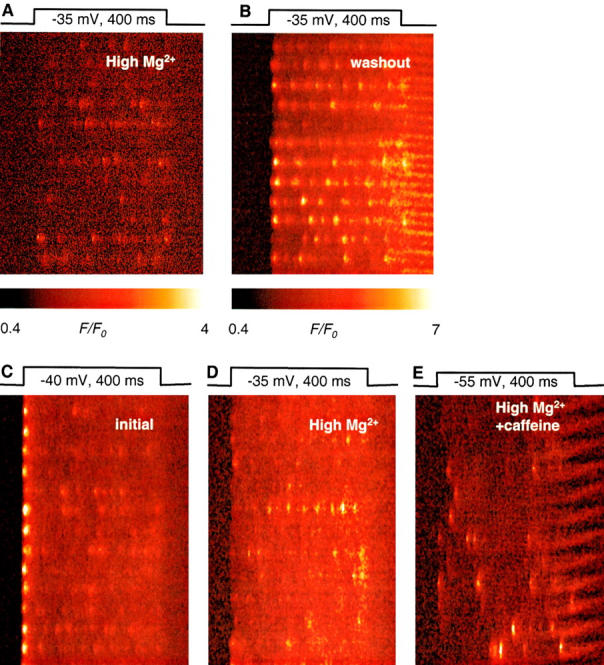
Reversibility of high Mg2+ effects. (A) Normalized fluorescence in a line scan in a fiber exposed to high Mg2+ for 75 min. (B) The same fiber 45 min after changing to a standard internal solution with 5 mM citrate and nominal [Mg2+] of 0.13 mM. Voltage stimuli as shown. Note increase in event intensities in spite of the more compressed color scale. Identifier, 1016a. (C and D) Normalized fluorescence, after 80 and 130 min of exposure to high Mg2+. (E) Response to a lower voltage, at 133 min in high Mg2+, 1 min after adding 0.5 mM caffeine. Same color scale as in A. Fiber identifier, 0103a.
Fig. 11 (bottom) demonstrates that caffeine may locally cancel the Mg2+ effect: C and D show normalized fluorescence responses to a pulse to −40 mV after 80 and 130 min, respectively, of exposure to high Mg2+. The reduction in frequency and size of sparks is clear (to a width of 0.82 μM and amplitude of 1.19, 100 events). E was obtained after 133 min in high Mg2+, 1 min after adding 0.5 mM caffeine. The response shown contains sparks of normal size and a large movement artifact. The sparks obtained in caffeine had an average width of 1.41 μM and amplitude 1.68 (65 events). Recovery of sparks upon exposure to caffeine was found consistently in three experiments in high Mg2+.
DISCUSSION
In spite of the stereotypical appearance of sparks, in cardiac muscle several interventions are known to change their morphology. Thus, SR depletion (Song et al. 1997; Lukyanenko et al. 1998) or exposure to ruthenium red (Lukyanenko et al. 1999) result in reduction in spark size, while Ca2+ overload (Cheng et al. 1996) or β-adrenergic agonists (Tanaka et al. 1997) augment their size, and the immunosuppressant FK506 increases their duration (Xiao et al. 1997). In skeletal muscle, the existing reports stress instead the resilience of spark morphology. Lacampagne et al. 1998 did not find any changes in spark parameters upon changing intracellular [Mg2+] between 0.1 and 0.7 mM, while Lacampagne et al. 1996 and Klein et al. 1997 found no change upon varying depolarization levels. The present results, by contrast, show that skeletal muscle sparks can be modified significantly by interventions designed to interfere with CICR.
Significance of the Effects of Caffeine
Caffeine augments rise time, duration, and spatial width of sparks. The changes, on average near 20%, are statistically highly significant, and in individual fibers may reach 60% (in width) or 80% (in rise time). This could be due to changes in Ca2+ release or in the processes that remove locally increased Ca2+. At these low drug concentrations, however, changes in removal are highly unlikely (for instance binding of caffeine to dyes is reported to require much higher concentrations; Muschol et al. 1999). Moreover, the spatial width of simulated sparks is essentially insensitive to changes in parameters of parvalbumin, troponin, and the Ca2+ pump (Ríos et al. 1999). Hence, the altered spark morphology almost certainly reflects changes in Ca2+ release.
The most significant aspect of the effects is that spark width increases independently of rise time and duration. An increase in spatial width at constant rise time requires an increase in Ca2+ release flux, which must be substantial because the growth in signal mass of an event is proportional to the third power of the increase in spatial width (thus the signal mass of sparks in Fig. 6 grows 3.7-fold in caffeine). Because the drug does not change unitary current in bilayers (Rousseau et al. 1988), we considered three other possibilities to explain the enhanced release flux: increase in P o of a single channel, local saturation of the dye, and recruitment of channels. This exploration was done through simulations and calculations of release flux.
Inferences from Simulations of Sparks
In simulations (examples in Smith et al. 1998; Jiang et al. 1999; Ríos et al. 1999; Shirokova et al. 1999), the spatial width of a spark produced by opening of a point source is largely insensitive to source intensity. Hence an increase in P o or duty cycle of a single channel during a brief burst is easily ruled out as an explanation of the caffeine effect.
An enhancement in current could result in sizable widening if the increased current drove the dye to saturation locally. This possibility was explored with spark simulations for 5- and 30-pA source current. The larger current caused dye saturation, as revealed by a characteristic “flat top” in the simulated spark, and the growth of the event amplitude by ∼2 with a sixfold increase in current. This resulted in an increase in half width, from 0.65 to 0.97 μM. Therefore, saturation did cause substantial increase in spatial width, but it also resulted in events with very different time course. Additionally, if saturation was the mechanism explaining the wider sparks, there should be a good correlation between spark amplitude and width, which was not observed in experiments.
Wider sparks could be simulated, without substantially changing their amplitude, by increasing the radius of the source. Thus, the only possible explanation of a substantial widening appears to be the recruitment of physically separate additional channels. This explanation poses its own questions. Indeed, scanning was parallel to the fiber axis, so that the recruited channels must be outside junctional regions, or perhaps more massive recruitment within junctional regions (which lengthens the source) results in sparks with a wider appearance in every direction of space.
Ca2+ Release Flux in the Presence of Caffeine
Release flux and current were evaluated by the method of Blatter et al. 1997 as modified by Ríos et al. 1999. Even though its results depend on model parameter values (rate constants and diffusion constants of the main Ca2+ sites), it is suitable as a comparison tool, especially when a condition (caffeine) and its reference are imposed for brief periods, during which the main parameters should not change greatly.
Release flux was first calculated for the averages in Fig. 5, of events in reference and caffeine that had rise times between 5.1 and 6.9 ms. The parameters of removal were given the values listed in Table of Ríos et al. 1999 (but Dparvalbumin was increased to 4.5 × 10⁻⁷ cm2 s−1; following Maughan and Godt 1999). Fig. 12, left, represents [Ca2+](x,t) transients calculated from spark averages in reference (top) and 1 mM caffeine (bottom). Amplitudes of the Ca2+ transients are similar, but the one in caffeine has a characteristic “wing,” in correspondence with the greater width of the fluorescence spark. The calculated release flux density waveforms (with dimensions of calcium concentration/time) are shown on the right side. The calculation results in a source with greater spatial spread. This was expected: as argued in the previous section, if in simulations removal parameters do not change, a greater spark width can only be produced with greater source width.
Figure 12.
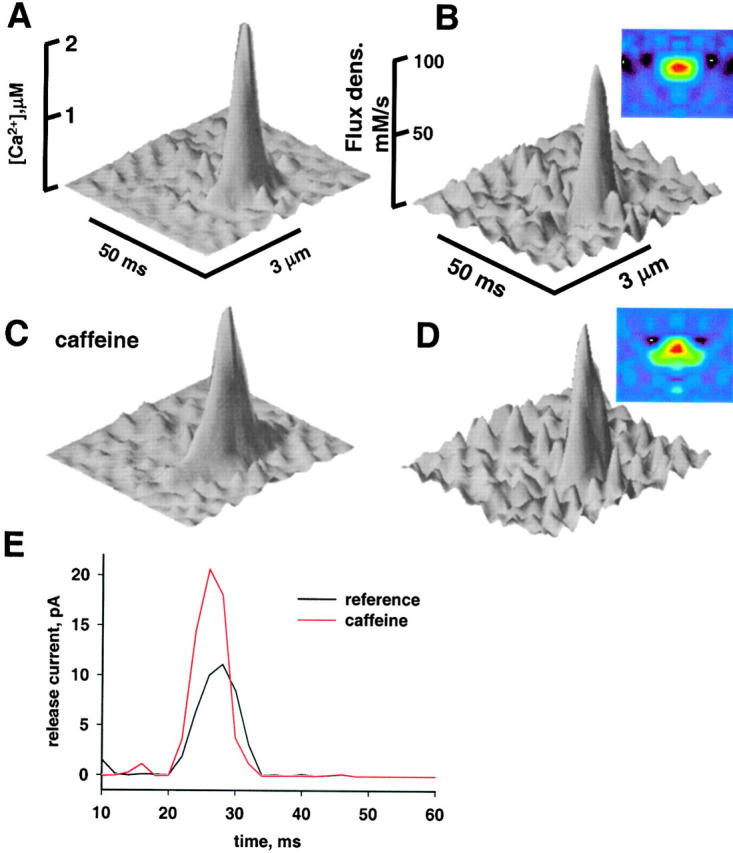
Effect of caffeine on the calculated release flux and current. (A) “Calcium transient” {[Ca2+](x,t)} calculated for the average of sparks in reference illustrated in Fig. 6 A (images before caffeine and after washout, rise times restricted to the range 5.1–6.9 ms). (B) Ca2+ release flux density, for the top view in color the horizontal span is 3 μM and the vertical is 30 ms). (C and D) Corresponding waveforms for the average of events in caffeine. Note widening of Ca2+ transient and release flux, without change in flux density. (E) Release current, computed by volume integration of flux density. Computations were carried out as described by Ríos et al. 1999, with parameter values listed in their Table (I).
Fig. 12 E plots the release Ca2+ current, obtained by volume integration of flux density. There is an approximate doubling of current in caffeine, an increase that starts as soon as the method resolves release.
The analysis was extended to averages of events with other rise times. The effect of caffeine was observed at all rise times. In this and two other fibers in which a similar analysis was performed, release flux and current were found to be less for sparks of rise time >7 ms. Such negative correlation between release flux and rise time reflects the lack of correlation between signal amplitude and rise time, first noted by Lacampagne et al. 1999. Intriguingly, the negative correlation between flux and rise time was less clear in caffeine, which resulted in a greater relative effect of the drug (up to a fourfold increment in current) at higher rise times.
In summary, that events in caffeine are wider reveals a greater release flux and Ca2+ current from the SR. By both “forward” calculations (i.e., simulations that start from a defined release) and “backward” calculations (that derive release from the measured fluorescence) we infer that caffeine produces a spatial widening, rather than an increase in the intensity of a point source. Source widening by caffeine is best explained if Ca2+ mediates channel opening. Indeed, the putative mechanism of caffeine is an increase in the channels' sensitivity to activation by Ca2+. The widening of the source can be a manifestation of drug-enhanced, Ca2+-mediated channel activation, propagating away from the initial source. The observations are in agreement with a multichannel, propagating view of sparks, such as that in Fig. 1 C.
CICR Enhances Spark Size
It was reported that sparks induced in permeabilized fibers at low [Mg2+] are similar to those elicited by depolarization under voltage clamp (Lacampagne et al. 1998). The present study, using average properties of thousands of sparks, qualifies the previous observation: sparks in permeabilized fibers are indistinguishable from those observed under voltage clamp in the presence of caffeine. They are, however, ∼25% wider and slightly longer lasting than those elicited under voltage clamp in reference conditions. The result appears to be in disagreement with the reported invariance of sparks morphology between 0.15 and 0.65 mM Mg2+ (Lacampagne et al. 1998). Indeed, in our case, width and rise time of sparks obtained under voltage clamp in reference (0.54 mM nominal [Mg2+]) were less than in permeabilized fibers in lower [Mg2+]. One reason for the discrepancy may be that in our experiments the sparks were elicited by different mechanisms (the ones in reference were elicited by voltage, while at low [Mg2+], and in the experiments of Lacampagne et al. 1996, Lacampagne et al. 1998, Lacampagne et al. 1999, they occurred spontaneously). Perhaps the spontaneous generation of sparks requires local conditions leading to a stereotyped behavior, not very sensitive to [Mg2+].
The similarity of properties under two conditions that sensitize the channels to activation by Ca2+ (low Mg2+ and a low concentration of caffeine) suggest that in both cases sparks are increased above their “normal” magnitude (i.e., when voltage is the trigger) by a similar mechanism, enhancement of CICR. In turn, enhancement of CICR may increase spark size by recruitment of additional channels in a cluster or because channels remain open a longer time. Because both release flux and rise time increase, both mechanisms (recruitment and prolongation of open times) appear to be at work.
Embers Are Evidence of Two Separately Controlled Components of Ca2+ Release
A consensus is emerging for the participation of CICR in physiological control of Ca2+ release in skeletal muscle, and the evidence discussed in the previous sections supports this belief. The process, however, is under continuous control by voltage through the mechanical connection between voltage sensors in the T-tubule membrane and release channels. Two main alternatives must be considered within this framework of dual control. (a) That spark generation is the only modus operandi of the release units, so that release events, whether initiated by voltage sensors, or escaping under the influence of drugs or low Mg2+, would be discrete sparks. (b) That spark generation is not the sole local manifestation, but appears when the conditions are right for amplification, mediated by CICR, of an initial nonspark release directly controlled by voltage. The first possibility is consistent with calculations of Klein et al. 1997, showing that essentially all of the fluorescence waveform under voltage clamp could be accounted for as a sum of sparks.
In favor of the second alternative, Shirokova and Ríos 1997 showed that a continuous nonspark fluorescence increase could be elicited at very low voltages, or in the presence of tetracaine (a blocker of channels in bilayers), proposing that this “nonevent” or “small-event” release results from direct opening of channels by voltage sensors. It was not clear at the time why some fibers displayed the small-event release while others did not, or whether tetracaine simply modified release (as suggested by Schneider 1999), rather than isolating a pre-existent mode.
We now show that sparks elicited by voltage have a small prolongation, named the ember to convey the fact that it is dim and may cause, or be caused by, the spark proper.
Two interpretations of the ember are possible. (a) It results from direct opening of channels by voltage. If this were the case, the ember might then cause the spark by providing a trigger Ca2+ that would be amplified by CICR. A quantitative model of embers, which uses this hypothesis, is presented in the and is shown to account for the results. (b) The ember is an average of after-sparks, discrete events that, for unspecified reasons, occur more frequently after a spark.
In favor of the first interpretation are the ember's enhancement by high Mg2+ and its reduction by caffeine. A good part of these effects is due to changes in applied pulse voltage under these interventions. Thus the presence of caffeine enables the production of sparks at very low voltages, which minimizes activation by the voltage sensor, explaining the smaller ember within the framework of the first hypothesis. Conversely, production of sparks in high Mg2+ requires applying pulses to −40 mV or higher, therefore maximizing the ember.
The ember is seen on averages of large numbers of events, but can also be seen in selected events, sometimes as a prolongation of constant amplitude (Fig. 8). In the framework of the first hypothesis, the decaying amplitude of the average ember reflects the termination at different times of individual events of constant amplitude.
In the second interpretation, average embers result from after-sparks, following after variable intervals the spark being averaged. This could only explain an ember if after-sparks were smaller than the detection criterion; otherwise the association of multiple sparks in time should result in an average with fluorescence both preceding and following the peak. The occurrence of small after-sparks was ruled out as follows. Small sparks (of amplitude less than one third the average, small width, and short rise time) were selected automatically and averaged in those experiments that exhibited large embers. If a substantial fraction of these small sparks were associated or determined by prior sparks, their average should have an indication of the prior spark. It did not, the time before the beginning of the spark average was not especially active (not shown). Finally, a somewhat smaller ember was still present when sparks located within 80 ms of others were excluded from the average. This again contradicts expectations from the after-spark model of embers.
In amplitude and width, individual embers are roughly comparable with signals produced by ligands that open individual channels [imperatoxin A (Shtifman et al. 1999), ryanodine (Cheng et al. 1993), bastadin 10 (González et al. 2000a), and the polypeptide As-20 (El-Hayek and Ikemoto 1998) from the II–III linker of the rabbit or frog DHP receptor (González et al. 2000a)]. The similarity between embers and these signals lends credibility to the proposal that embers reflect direct channel opening by the voltage sensor, and Fig. 1C as putative mechanism for sparks.
An explanation of the ember should also account for the ridge. Because in spark averages the ridge has constant amplitude throughout the pulse, it must have no particular association with the individual spark being averaged (it involves other release units, which are imaged in the same location). It must be largely voltage operated because in high Mg2+ it increases in amplitude and detectability relative to sparks. In sum, the ridge that appears in spark averages results from voltage-operated events (embers), with or without associated sparks, occurring in release units other than that of the spark that is averaged.
Implications of the Effects of High Mg2+
The present results demonstrate that, by increasing pulse voltage, it is possible to elicit substantial Ca2+ release, including Ca2+ sparks, in fibers exposed to internal solutions with 7 mM Mg2+. Release and sparks are therefore possible at a Mg2+ concentration that should occupy not only the Ca2+ activation site on the release channels, but also their low affinity Ca2+–Mg2+ inhibition site, to near saturation (e.g., Meissner 1994; Lamb 2000). This implies that, given adequate membrane voltage, the voltage sensor will overcome not just the competitive inhibition effect of Mg2+ bound to the activation site, but also the effect at the Ca2+–Mg2+ inhibition site. This ability to overcome high Mg2+ inhibition is shared by high voltage and caffeine, consistent with observations in skinned frog fibers, where caffeine (at 5 mM) shifts the inhibitory branch of the Ca2+ dependence of release to much higher concentrations (Kurebayashi and Ogawa 1986; Ogawa 1994). At a molecular level, therefore, there are similarities in what caffeine and the voltage sensor can accomplish.
There are, however, clear differences in the ability of the two agonists to overcome Mg2+ inhibition. While caffeine restores an essentially normal-looking spark of high spatial width, voltage produces narrow sparks of low amplitude. This seems reasonable: caffeine should make it possible for every release channel to participate in sparks, while voltage sensors should have their effect restricted to those channels in direct contact (perhaps making them sensitive to Ca2+ activation by promoting a pre-open state that is refractory to Mg2+ inhibition, similar to a proposal by Lamb 2000). In the presence of high Mg2+, sparks would result from activation of the directly voltage-operated release channels, under the combined influence of the voltage sensor and Ca2+, while in the presence of caffeine every channel might participate (as depicted in Fig. 1 C).
Such ideas could be tested in multiple ways. Experiments with Ca2+ buffers, which have been difficult to interpret under whole-cell photometry (Jacquemond et al. 1991; Jong et al. 1993), are called for (González et al. 2000b). Quantitative models of spark production (e.g., Stern et al. 1997) seem premature when definitive structural information on triadic structure of frog twitch muscle is lacking (Franzini-Armstrong and Jorgensen 1994). In spite of the uncertainties, the present work yields as tentative conclusions that sparks of frog muscle have physically extended, hence multichannel, sources, and that propagation of activation relies at least partially on CICR. The existence of embers suggests that channels are directly opened by T-tubule membrane voltage sensors to start a spark.
Acknowledgments
We thank H. Cheng for supplying an improved version of the event detector and for insightful comments, G.D. Lamb, D.G. Stephenson (LaTrobe University, Victoria, Australia), A. Herrmann-Frank (University of Ulm, Ulm, Germany) and H.Ch. Lüttgau (Ruhr University, Bochum, Germany) for making articles available to us before their publication.
This work was supported by grants from NIH to N. Shirokova and E. Ríos. A. González was the recipient of a Senior Fellowship from the American Heart Association of Metropolitan Chicago.
A Simple Model Ember
As drawn in 13, inset, the model assumes that a spark may occur at some point in time during the opening of a trigger channel. The time from start of trigger to spark is t lead, and from there to end of trigger is t trail.
Figure 13.
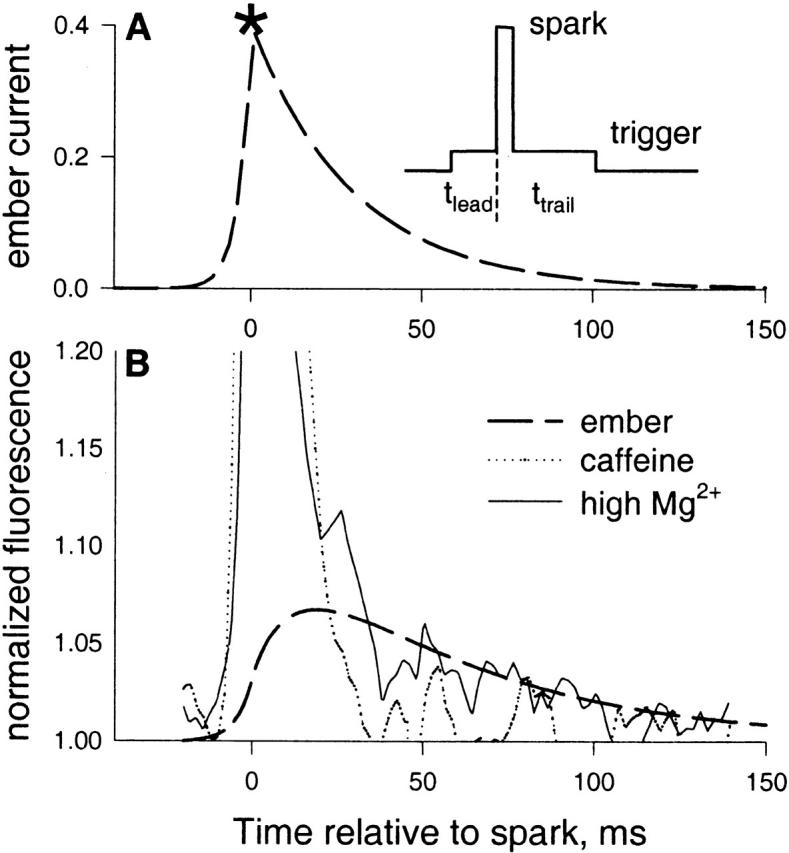
A model of embers. (A) The inset represents the model hypothesis: the average ember is the consequence of a current resulting from averaging openings of a trigger channel that caused a spark, centered at the spark. The spark occurs at time t lead from the leading edge of the trigger and t trail from its end. (A) Dashed trace, average trigger current when unitary channel current is 0.4 pA, calculated according to and , with τ = 40 ms and φ = 0.9. (B, dashed trace) Ember fluorescence time course, calculated by simulation, assuming that the current in A exits a source of 20-nm radius. Plotted is the calculated normalized fluorescence averaged over the central 1 μM of the signal. Other traces, fluorescence in the central 1 μM of averaged sparks in the presence of caffeine (dotted) or high Mg2+ (solid) (same traces as in Fig. 10, with a constant 0.03, representing the ridge, subtracted from the high Mg2+ record).
Consider, initially, a population of events that are all single openings of the trigger channel. Assuming that the open times are exponentially distributed, the probability (density) that this opening lasts exactly t 1 is given by
 |
While the trigger channel is open, there is a rate v of spark formation, so the sparks have a density, conditional on the trigger channel being open, of v e−vt. The probability density of the event (a spark occurred at time t after the start of a trigger of duration t 1) is therefore ρ(t,t 1) dt dt 1 where:
 |
A1 |
provided that t < t 1, and zero otherwise. Integrating this density gives the fraction of triggers that produce a spark:
 |
A2 |
The probability density σ for the event (there is a spark, preceded by a leader of exactly t lead, and a trailer of t trail) is obtained by (a) normalizing the distribution in by dividing it by φ (all events selected have sparks), and (b) transforming to the new variables t lead = t, t trail = t 1 − t lead:
 |
A3 |
For averaging, events are synchronized at the spark time, then if the full open intensity is 1, the intensity at time t on the trailer would be given by the probability that t trail > t, obtained by integrating :
 |
A4 |
A similar calculation can be carried out for the average intensity before the spark:
 |
A5 |
where t* = −t, time counted in the negative direction, from 0, when the spark occurs. v can be calculated from the fraction φ of triggers that cause a spark solving for v ():
 |
A6 |
substituting in gives :
 |
A7 |
Defining characteristics of the ember, which the model aims to simulate, are its very low amplitude, its duration, slowly decaying in roughly 100 ms, and its asymmetry. In the model, ember duration is determined by the average duration of the openings (τ). To have asymmetry, the spark must occur very early in the opening, which in turn demands a high triggering rate v.
The asymmetry of the average ember current is given by the ratio of time constants of trails over leads, or 1/(φ − 1), which grows beyond bounds as the fraction tends to 1. The curve in 13 A is obtained for the average ember current (plotting together I trail(t) for t > 0 and I lead(−t) for t < 0), using the values τ = 40 ms, a guess for the average duration of the trigger, φ = 0.9, similar to the value found for a series of events in the presence of imperatoxin A by González et al. 2000d and unitary current of 0.4 pA (measured by Mejía-Alvarez et al. 1999, with cardiac Ryrs in near-physiologic ion gradients). Note that this is the release current of the ember only; that is, the trigger, not the spark. The actual ember fluorescence, calculated by the simulation technique described in materials and methods, assuming that the current plotted in 13 A is released in the myoplasmic medium from a source of 0.02 μM radius, is compared in B (dashed line) with the time course of the average spark in high Mg2+, which has ember (solid line), and that in caffeine, which does not (dotted line).
Footnotes
Abbreviations used in this paper: CICR, Ca2+-induced Ca2+ release; DHPr, dihydropyridine receptor; FDHM, full duration at half magnitude; FWHM, full width at half magnitude; Ryr, ryanodine receptor; SR, sarcoplasmic reticulum; T-tubule, transverse tubule.
Because these are spark averages, their amplitude is reduced by off-focus events, hence the amplitude of the derived [Ca2+](x,t) and release flux waveforms is probably underestimated.
The inference that there is recruitment of channels in caffeine conflicts with the assumption of symmetry in the release calculation. Indeed, the spatial distribution of newly recruited channels is unlikely to be symmetric. This implies that the calculated release flux is likely to be in error, but does not detract from the main conclusion.
References
- Axelsson J., Thesleff S. Activation of the contractile mechanism in striated muscle. Acta Physiol. Scand. 1958;44:55–66. doi: 10.1111/j.1748-1716.1958.tb01608.x. [DOI] [PubMed] [Google Scholar]
- Baylor S.M., Chandler W.K., Marshall M.W. Sarcoplasmic reticulum calcium release in frog skeletal muscle fibres estimated from Arsenazo III calcium transients. J. Physiol. 1983;344:625–666. doi: 10.1113/jphysiol.1983.sp014959. [DOI] [PMC free article] [PubMed] [Google Scholar]
- Blatter L.A., Hüser J., Ríos E. Sarcoplasmic reticulum Ca2+ release flux underlying Ca2+ sparks in cardiac muscle. Proc. Natl. Acad. Sci. USA. 1997;94:4176–4181. doi: 10.1073/pnas.94.8.4176. [DOI] [PMC free article] [PubMed] [Google Scholar]
- Block B.A., Imagawa T., Campbell K.P., Franzini-Armstrong C. Structural evidence for direct interaction between the molecular components of the transverse tubule/sarcoplasmic reticulum junction in skeletal muscle. J. Cell Biol. 1988;107:2587–2600. doi: 10.1083/jcb.107.6.2587. [DOI] [PMC free article] [PubMed] [Google Scholar]
- Brum G., Ríos E. Intramembrane charge movement in frog skeletal muscle fibres. Properties of charge 2. J. Physiol. 1987;387:489–517. doi: 10.1113/jphysiol.1987.sp016586. [DOI] [PMC free article] [PubMed] [Google Scholar]
- Cheng H., Lederer W.J., Cannell M.B. Calcium sparkselementary events underlying excitation–contraction coupling in heart muscle. Science. 1993;262:740–744. doi: 10.1126/science.8235594. [DOI] [PubMed] [Google Scholar]
- Cheng H., Lederer M.R., Lederer W.J., Cannell M.B. Calcium sparks and [Ca2+]i waves in cardiac myocytes. Am. J. Physiol. 1996;270:C148–C159. doi: 10.1152/ajpcell.1996.270.1.C148. [DOI] [PubMed] [Google Scholar]
- Cheng H., Song L.S., Shirokova N., González A., Lakatta E.G., Ríos E., Stern M.D. Amplitude distribution of calcium sparks in confocal images. Theory and studies with an automatic detection method. Biophys. J. 1999;76:606–617. doi: 10.1016/S0006-3495(99)77229-2. [DOI] [PMC free article] [PubMed] [Google Scholar]
- Conklin M.W., Barone V., Sorrentino V., Coronado R. Contribution of ryanodine receptor type-3 to Ca2+ sparks in embryonic mouse skeletal muscle. Biophys. J. 1999;77:1394–1403. doi: 10.1016/S0006-3495(99)76988-2. [DOI] [PMC free article] [PubMed] [Google Scholar]
- El-Hayek R., Ikemoto N. Identification of the minimum essential region in the II–III loop of the dihydropyridine receptor alpha 1 subunit required for activation of skeletal muscle-type excitation–contraction coupling. Biochemistry. 1998;37:7015–7020. doi: 10.1021/bi972907o. [DOI] [PubMed] [Google Scholar]
- Endo M., Tanaka M., Ogawa Y. Calcium induced release of calcium from the sarcoplasmic reticulum of skinned skeletal muscle fibres. Nature. 1970;228:34–36. doi: 10.1038/228034a0. [DOI] [PubMed] [Google Scholar]
- Endo M. Mechanism of action of caffeine on the sarcoplasmic reticulum of skeletal muscle. Proc. Jpn. Acad. 1975;51:479–484. [Google Scholar]
- Endo M. Calcium release from sarcoplasmic reticulum. Curr. Top. Membr. Transp. 1985;25:181–230. [Google Scholar]
- Fabiato A. Dependence of the Ca2+-induced release from sarcoplasmic reticulum of skinned skeletal muscle fibres from the frog semitendinosus on the rate of change of free Ca2+ concentration at the outer surface of the sarcoplasmic reticulum. J. Physiol. 1984;353:56P. [Google Scholar]
- Franzini-Armstrong C., Jorgensen A.O. Structure and development of E–C coupling units in skeletal muscle. Annu. Rev. Physiol. 1994;56:509–534. doi: 10.1146/annurev.ph.56.030194.002453. [DOI] [PubMed] [Google Scholar]
- Franzini-Armstrong C., Protasi F. Ryanodine receptors of striated musclesa complex channel capable of multiple interactions. Physiol. Rev. 1997;77:699–729. doi: 10.1152/physrev.1997.77.3.699. [DOI] [PubMed] [Google Scholar]
- González A., Ríos E. Perchlorate enhances transmission in skeletal muscle excitation–contraction coupling. J. Gen. Physiol. 1993;102:373–421. doi: 10.1085/jgp.102.3.373. [DOI] [PMC free article] [PubMed] [Google Scholar]
- González A., El-Hayek R., Kirsch W.G., Shirokova N., Pessah I.N., Ikemoto N., Ríos E. Ca release events induced in frog muscle by bastadin and ii–iii loop peptides from rabbit and frog Biophys. J 78 2000. 276Aa [Google Scholar]
- González A., Kirsch W.G., Shirokova N., Pizarro G., Cheng H., Stern M.D., Ríos E. rise times of Ca sparks in skeletal muscle Biophys. J 78 2000. 437Ac [DOI] [PMC free article] [PubMed] [Google Scholar]
- González A., Pizarro G., Shirokova N., Kirsch W.G., Ríos E., Stern M.D. Local voltage-activated Ca release in frog skeletal muscle cells containing BAPTA Biophys. J 78 2000. 437Ab [Google Scholar]
- González A., Shirokova N., Kirsch W.G., Stern M.D., Cheng H., Pizarro G., Ríos E. Ca release currents underlying local events produced by imperotoxin A in frog muscle Biophys. J. 78 2000. 276Ad [Google Scholar]
- Harkins A.B., Kurebayashi N., Baylor S.M. Resting myoplasmic free calcium in frog skeletal muscle fibers estimated with fluo-3. Biophys. J. 1993;65:865–881. doi: 10.1016/S0006-3495(93)81112-3. [DOI] [PMC free article] [PubMed] [Google Scholar]
- Herrmann-Frank A., Lüttgau H.-Ch., Stephenson D.G. Caffeine and excitation–contraction coupling in skeletal musclea stimulating story. J. Muscle Res. Cell Motil. 1999;20:223–237. doi: 10.1023/a:1005496708505. [DOI] [PubMed] [Google Scholar]
- Hodgkin A.L., Horowicz P. Potassium contractures in single muscle fibres. J. Physiol. 1960;153:386–403. doi: 10.1113/jphysiol.1960.sp006541. [DOI] [PMC free article] [PubMed] [Google Scholar]
- Jacquemond V., Csernoch L., Klein M., Schneider M.F. Voltage-gated and calcium-gated calcium release during depolarization of skeletal muscle fibers. Biophys. J. 1991;60:867–873. doi: 10.1016/S0006-3495(91)82120-8. [DOI] [PMC free article] [PubMed] [Google Scholar]
- Jiang Y.-H., Klein M.G., Schneider M.F. Numerical simulation of Ca2+ “sparks” in skeletal muscle. Biophys. J. 1999;77:2333–2357. doi: 10.1016/s0006-3495(99)77072-4. [DOI] [PMC free article] [PubMed] [Google Scholar]
- Jong D.S., Pape P.C., Chandler W.K., Baylor S.M. Reduction of calcium inactivation of sarcoplasmic reticulum calcium release by fura-2 in voltage-clamped cut twitch fibers from frog muscle. J. Gen. Physiol. 1993;102:333–370. doi: 10.1085/jgp.102.2.333. [DOI] [PMC free article] [PubMed] [Google Scholar]
- Kirino Y., Osakabe M., Shimizu H. Ca2+-induced Ca2+ release from fragmented sarcoplasmic reticulumCa2+-dependent passive Ca2+ efflux. J. Biochem. (Tokyo). 1983;94:1111–1118. doi: 10.1093/oxfordjournals.jbchem.a134454. [DOI] [PubMed] [Google Scholar]
- Kirsch W.G., González A., Pizarro G., Shirokova N., Ríos E. Ratifying the frogeffects of high intracellular [Mg2+] on global Ca2+ release in skeletal muscle. Biophys. J. 1999;76:A385. [Google Scholar]
- Klein M.G., Cheng H., Santana L.F., Jiang Y.H., Lederer W.J., Schneider M.F. Two mechanisms of quantized calcium release in skeletal muscle. Nature. 1996;379:455–458. doi: 10.1038/379455a0. [DOI] [PubMed] [Google Scholar]
- Klein M.G., Lacampagne A., Schneider M.F. Voltage dependence of the pattern and frequency of discrete Ca2+ release events after brief repriming in frog skeletal muscle. Proc. Natl. Acad. Sci. USA. 1997;94:11061–11066. doi: 10.1073/pnas.94.20.11061. [DOI] [PMC free article] [PubMed] [Google Scholar]
- Kurebayashi N., Ogawa Y. Characterization of increased Ca2+ efflux by quercetin from the sarcoplasmic reticulum in frog skinned skeletal muscle fibres. J. Muscle Res. Cell Motil. 1986;7:142–150. doi: 10.1007/BF01753415. [DOI] [PubMed] [Google Scholar]
- Lacampagne A., Lederer W.J., Schneider M.F., Klein M.G. Repriming and activation alter the frequency of stereotyped discrete Ca2+ release events in frog skeletal muscle. J. Physiol. 1996;497:581–588. doi: 10.1113/jphysiol.1996.sp021791. [DOI] [PMC free article] [PubMed] [Google Scholar]
- Lacampagne A., Klein M.G., Schneider M.F. Modulation of the frequency of spontaneous sarcoplasmic reticulum Ca2+ release events (Ca2+ sparks) by myoplasmic [Mg2+] in frog skeletal muscle. J. Gen. Physiol. 1998;111:207–224. doi: 10.1085/jgp.111.2.207. [DOI] [PMC free article] [PubMed] [Google Scholar]
- Lacampagne A., Ward C.W., Klein M.G., Schneider M.F. Time course of individual voltage-activated Ca2+ sparks recorded at ultra-high time resolution in frog skeletal muscle. J. Gen. Physiol. 1999;113:187–198. doi: 10.1085/jgp.113.2.187. [DOI] [PMC free article] [PubMed] [Google Scholar]
- Lamb G. Excitation–contraction coupling in skeletal musclecomparisons with cardiac Muscle. Clin. Exp. Pharmacol. Physiol. 2000;In press doi: 10.1046/j.1440-1681.2000.03224.x. [DOI] [PubMed] [Google Scholar]
- Leong P., MacLennan D.H. Complex interactions between skeletal muscle ryanodine receptor and dihydropyridine receptor proteins. Biochem. Cell Biol. 1998;76:681–694. doi: 10.1139/bcb-76-5-681. [DOI] [PubMed] [Google Scholar]
- Lukyanenko V., Wiesner T.F., Gÿoke S. Termination of Ca2+ release during Ca2+ sparks in rat ventricular myocytes. J. Physiol. 1998;507:667–677. doi: 10.1111/j.1469-7793.1998.667bs.x. [DOI] [PMC free article] [PubMed] [Google Scholar]
- Lukyanenko V., Gyorke I., Gyorke S. Probing the functional organization of Ca release units in cardiac myocytes by RyR channel inhibitors. Biophys. J. 1999;76:A464. [Google Scholar]
- Lüttgau H.C., Oetliker H. The action of caffeine on the activation of the contractile mechanism in striated muscle fibres. J. Physiol. 1968;194:51–74. doi: 10.1113/jphysiol.1968.sp008394. [DOI] [PMC free article] [PubMed] [Google Scholar]
- Martell A.E., Smith R.M. Critical Stability Constants. Vol. 1. Plenum Publishing Corp; New York, NY: 1974. [Google Scholar]
- Maughan D.W., Godt R.E. Parvalbumin concentration and diffusion coefficient in frog myoplasm. J. Muscle Res. Cell Motil. 1999;20:199–209. doi: 10.1023/a:1005477002220. [DOI] [PubMed] [Google Scholar]
- Meissner G. Ryanodine receptor/Ca2+ release channels and their regulation by endogenous effectors. Annu. Rev. Physiol. 1994;56:485–508. doi: 10.1146/annurev.ph.56.030194.002413. [DOI] [PubMed] [Google Scholar]
- Mejía-Alvarez R., Kettlun C., Ríos E., Stern M.D., Fill M. Unitary calcium currents through cardiac ryanodine receptors under physiological conditions. J. Gen. Physiol. 1999;113:177–186. doi: 10.1085/jgp.113.2.177. [DOI] [PMC free article] [PubMed] [Google Scholar]
- Melzer W., Ríos E., Schneider M.F. Time course of calcium release and removal in skeletal muscle fibers. Biophys. J. 1984;45:637–641. doi: 10.1016/S0006-3495(84)84203-4. [DOI] [PMC free article] [PubMed] [Google Scholar]
- Muschol M., Dasgupta B.R., Salzberg B.M. Caffeine interaction with fluorescent calcium indicator dyes. Biophys. J. 1999;77:577–586. doi: 10.1016/S0006-3495(99)76914-6. [DOI] [PMC free article] [PubMed] [Google Scholar]
- Nagasaki K., Kasai M. Fast release of calcium from sarcoplasmic reticulum vesicles monitored by chlorotetracycline fluorescence. J. Biochem. (Tokyo). 1983;94:1101–1109. doi: 10.1093/oxfordjournals.jbchem.a134453. [DOI] [PubMed] [Google Scholar]
- Nakai J., Dirksen R.T., Nguyen H.T., Pessah I.N., Beam K.G., Allen P.D. Enhanced dihydropyridine receptor channel activity in the presence of ryanodine receptor. Nature. 1996;380:72–75. doi: 10.1038/380072a0. [DOI] [PubMed] [Google Scholar]
- Ogawa Y. Role of ryanodine receptors. Crit. Rev. Biochem. Mol. Biol. 1994;29:229–274. doi: 10.3109/10409239409083482. [DOI] [PubMed] [Google Scholar]
- Pape P.C., Jong D.S., Chandler W.K., Baylor S.M. Effect of fura-2 on action potential-stimulated calcium release in cut twitch fibers from frog muscle. J. Gen. Physiol. 1993;102:295–332. doi: 10.1085/jgp.102.2.295. [DOI] [PMC free article] [PubMed] [Google Scholar]
- Park S., Schowengerdt R. Image reconstruction by parametric cubic convolution. Comp. Vis. Graph. Image Proces. 1983;s. 23:256–265. [Google Scholar]
- Ríos E., Brum G. Involvement of dihydropyridine receptors in excitation– contraction coupling in skeletal muscle. Nature. 1987;325:717–720. doi: 10.1038/325717a0. [DOI] [PubMed] [Google Scholar]
- Ríos E., Stern M.D., Gonzalez A., Pizarro G., Shirokova N. Calcium release flux underlying Ca2+ sparks of frog skeletal muscle. J. Gen. Physiol. 1999;114:31–48. doi: 10.1085/jgp.114.1.31. [DOI] [PMC free article] [PubMed] [Google Scholar]
- Ríos E., Pizarro G. The voltage sensor of excitation–contraction coupling in skeletal muscle. Physiol. Rev. 1991;71:849–908. doi: 10.1152/physrev.1991.71.3.849. [DOI] [PubMed] [Google Scholar]
- Rousseau E., LaDine J., Qi-Yi L., Meissner G. Activation of the Ca2+ release channel of skeletal muscle sarcoplasmic reticulum by caffeine and related compounds. Arch. Biochem. Biophys. 1988;267:75–86. doi: 10.1016/0003-9861(88)90010-0. [DOI] [PubMed] [Google Scholar]
- Schneider M.F., Chandler W.K. Voltage dependent charge movement of skeletal musclea possible step in excitation–contraction coupling. Nature. 1973;242:244–246. doi: 10.1038/242244a0. [DOI] [PubMed] [Google Scholar]
- Schneider M.F. PerspectiveCa2+ sparks in frog skeletal muscle: generation by one, some, or many SR Ca2+ release channels? J. Gen. Physiol. 1999;113:365–372. doi: 10.1085/jgp.113.3.365. [DOI] [PMC free article] [PubMed] [Google Scholar]
- Shirokova N., García J., Pizarro G., Ríos E. Ca2+ release from the sarcoplasmic reticulum compared in amphibian and mammalian skeletal muscle. J. Gen. Physiol. 1996;107:1–18. doi: 10.1085/jgp.107.1.1. [DOI] [PMC free article] [PubMed] [Google Scholar]
- Shirokova N., Ríos E. Small event Ca2+ releasea probable precursor of Ca2+ sparks in frog skeletal muscle. J. Physiol. 1997;502:3–11. doi: 10.1111/j.1469-7793.1997.003bl.x. [DOI] [PMC free article] [PubMed] [Google Scholar]
- Shirokova N., García J., Ríos E. Local calcium release in mammalian skeletal muscle. J. Physiol. 1998;512:377–384. doi: 10.1111/j.1469-7793.1998.377be.x. [DOI] [PMC free article] [PubMed] [Google Scholar]
- Shirokova N., Gonzalez A., Kirsch W.G., Ríos E., Pizarro G., Stern M.D., Cheng H. Calcium sparksrelease packets of uncertain origin and fundamental role. J. Gen. Physiol. 1999;113:377–384. doi: 10.1085/jgp.113.3.377. [DOI] [PMC free article] [PubMed] [Google Scholar]
- Shtifman A., Ward C.W., Valdivia H.H., Schneider M.F. Induction of long duration Ca2+ release events by imperatoxin A in frog skeletal muscle. Biophys. J. 1999;76:A465. doi: 10.1016/S0006-3495(00)76338-7. [DOI] [PMC free article] [PubMed] [Google Scholar]
- Smith G.D., Keizer J.E., Stern M.D., Lederer W.J., Cheng H. A simple numerical model of calcium spark formation and detection in cardiac myocytes. Biophys. J. 1998;75:15–32. doi: 10.1016/S0006-3495(98)77491-0. [DOI] [PMC free article] [PubMed] [Google Scholar]
- Song L.S, Stern M.D., Lakatta E.G., Cheng H.J. Partial depletion of sarcoplasmic reticulum calcium does not prevent calcium sparks in rat ventricular myocytes. J. Physiol. 1997;505:665–675. doi: 10.1111/j.1469-7793.1997.665ba.x. [DOI] [PMC free article] [PubMed] [Google Scholar]
- Stern M.D., Pizarro G., Ríos E. Local control model of excitation–contraction coupling in skeletal muscle. J. Gen. Physiol. 1997;110:415–440. doi: 10.1085/jgp.110.4.415. [DOI] [PMC free article] [PubMed] [Google Scholar]
- Sutko J.L., Airey J.A. Ryanodine receptor Ca2+ release channelsdoes diversity in form equal diversity in function? Physiol. Rev. 1996;76:1027–1071. doi: 10.1152/physrev.1996.76.4.1027. [DOI] [PubMed] [Google Scholar]
- Tanabe T., Beam K.G., Powell J.A., Numa S. Restoration of excitation–contraction coupling and slow calcium current in dysgenic muscle by dihydropyridine receptor complementary DNA. Nature. 1988;336:134–139. doi: 10.1038/336134a0. [DOI] [PubMed] [Google Scholar]
- Tanaka H., Nishimaru K., Sekine T., Kawanishi T., Nakamura R., Yamagaki K., Shigenobu K. Two-dimensional millisecond analysis of intracellular Ca2+ sparks in cardiac myocytes by rapid scanning confocal microscopyincrease in amplitude by isoproterenol. Biochem. Biophys. Res. Commun. 1997;233:413–418. doi: 10.1006/bbrc.1997.6470. [DOI] [PubMed] [Google Scholar]
- Xiao R.P., Valdivia H.H., Bogdanov K., Valdivia C., Lakatta E.G., Cheng H.J. The immunophilin FK506-binding protein modulates Ca2+ release channel closure in rat heart. J. Physiol. 1997;500:343–354. doi: 10.1113/jphysiol.1997.sp022025. [DOI] [PMC free article] [PubMed] [Google Scholar]