

Abstract
Using a strategy related to intragenic suppression, we previously obtained evidence for structural interactions in the voltage sensor of Shaker K+ channels between residues E283 in S2 and R368 and R371 in S4 (Tiwari-Woodruff, S.K., C.T. Schulteis, A.F. Mock, and D.M. Papazian. 1997. Biophys. J. 72:1489–1500). Because R368 and R371 are involved in the conformational changes that accompany voltage-dependent activation, we tested the hypothesis that these S4 residues interact with E283 in S2 in a subset of the conformational states that make up the activation pathway in Shaker channels. First, the location of residue 283 at hyperpolarized and depolarized potentials was inferred by substituting a cysteine at that position and determining its reactivity with hydrophilic, sulfhydryl-specific probes. The results indicate that position 283 reacts with extracellularly applied sulfhydryl reagents with similar rates at both hyperpolarized and depolarized potentials. We conclude that E283 is located near the extracellular surface of the protein in both resting and activated conformations. Second, we studied the functional phenotypes of double charge reversal mutations between positions 283 and 368 and between 283 and 371 to gain insight into the conformations in which these positions approach each other most closely. We found that combining charge reversal mutations at positions 283 and 371 stabilized an activated conformation of the channel, and dramatically slowed transitions into and out of this state. In contrast, charge reversal mutations at positions 283 and 368 stabilized a closed conformation, which by virtue of the inferred position of 368 corresponds to a partially activated (intermediate) closed conformation. From these results, we propose a preliminary model for the rearrangement of structural interactions of the voltage sensor during activation of Shaker K+ channels.
Keywords: conformational changes, transmembrane segment, voltage clamp, cysteine mutagenesis
INTRODUCTION
Voltage-dependent cation channels control the excitability of nerve and muscle (Hille 1992). Normally closed at the hyperpolarized resting potentials found in cells, these channels open in response to membrane depolarization. The control of activity by voltage is due to the presence of an intrinsic voltage sensor in the channel protein (Papazian and Bezanilla 1997). In the voltage-dependent Shaker K+ channel, four conserved charged residues in transmembrane segments are essential components of the voltage sensor (Seoh et al. 1996). The fourth putative transmembrane segment, S4, contains three positively charged voltage-sensing residues, R365, R368, and R371 (Aggarwal and MacKinnon 1996; Seoh et al. 1996). During voltage-dependent activation, these residues traverse a large fraction or all of the transmembrane electric field (Larsson et al. 1996; Starace et al. 1997). E293, a negatively charged residue found in the S2 transmembrane segment, is also crucial for the voltage sensor (Seoh et al. 1996). Whether this residue traverses the field or instead contributes to the electric field detected by the moving S4 residues has not yet been determined (Papazian and Bezanilla 1997). Other charged residues, including E283 in S2 and K374 in S4, do not contribute to the channel's gating charge and therefore do not move significantly relative to the transmembrane electric field during voltage-dependent activation (Seoh et al. 1996).
Biophysical analysis indicates that activation gating is a dynamic process involving a number of different conformational changes. In Shaker channels, several models for activation gating have been presented (Bezanilla et al. 1994; Zagotta et al. 1994; Schoppa and Sigworth 1998). These models posit a minimum of two voltage-dependent conformational changes per subunit in the tetrameric channel. These steps prime the channel for opening. Entry into the conducting state involves a less voltage-dependent step that may be cooperative (Smith-Maxwell et al. 1998; Ledwell and Aldrich 1999).
To understand gating in molecular terms, it is important to identify the structural changes underlying voltage-dependent activation. We have used a strategy related to intragenic suppression to provide some constraints on the packing of the voltage sensor (Papazian et al. 1995; Tiwari-Woodruff et al. 1997). In this approach, mutations that disrupt key structural interactions and thereby prevent proper folding of the channel protein are identified. Then, second-site mutations that specifically restore a compensatory structural interaction are identified. Specific suppression of folding defects strongly suggests that the positions of first- and second-site mutations are involved in short-range structural interactions in the native protein. We have focused on identifying the interactions of conserved charged residues in transmembrane segments because these are likely to play a key role in specifying the particular fold of the native protein (Hendsch and Tidor 1994; Oliveberg and Fersht 1996; Tissot et al. 1996).
The wild-type Shaker protein folds and assembles into the native channel structure in the endoplasmic reticulum (ER) (Nagaya and Papazian 1997; Schulteis et al. 1998). Full-length Shaker protein is first detected as an immature, core-glycosylated precursor in the ER (Schulteis et al. 1995; Nagaya and Papazian 1997). Upon proper folding and assembly, the protein is transferred to the Golgi complex, where the oligosaccharide chains are modified, generating the mature form of the protein (Nagaya and Papazian 1997). The immature and mature forms of the protein are easily distinguished because they have different electrophoretic mobilities (Santacruz-Toloza et al. 1994; Schulteis et al. 1995).
Mutations likely to interfere with folding of the Shaker channel are readily identified because they disrupt protein maturation. Proteins that fail to fold or assemble properly are efficiently retained in the ER by its quality control system, thereby preventing maturation of the glycan chains (Schulteis et al. 1998). Using the intragenic suppression strategy, we have obtained evidence for short-range structural interactions of K374 in S4 with E293 in S2 and D316 in S3, and of E283 in S2 with R368 and R371 in S4 (Papazian et al. 1995; Tiwari-Woodruff et al. 1997). For example, K374E, a charge reversal mutation in the S4 segment, eliminates both protein maturation and functional expression. These defects are suppressed in the double-mutant combinations K374E+E293K and K374E+D316K, but not in other double-mutant combinations. A charge reversal mutation in S2, E283R, reduces maturation significantly and eliminates functional expression. These defects are specifically suppressed in the double mutant combinations E283R+R368E and E283R+R371E (Tiwari-Woodruff et al. 1997).
The dynamic role of the voltage sensor in channel function raises the question of whether these interactions exist in only a subset of protein conformations. For instance, measurements of gating charge per channel indicate that E283 in S2 does not move relative to the transmembrane field during activation (Seoh et al. 1996), whereas the interacting residues R368 and R371 traverse a large fraction or all of the electric field during gating (Larsson et al. 1996; Starace and Bezanilla 1998; Starace et al. 1998). Combined, these results suggest that R368 and R371 interact with E283 in some but not all channel conformations.
To test this hypothesis, we substituted a cysteine residue at position 283 in S2 to investigate its reactivity with hydrophilic, sulfhydryl-specific reagents applied at different voltages. We find that C283 reacts with extracellular reagents at both hyperpolarized and depolarized potentials. These results suggest that E283 does not interact with R368 or R371 in deep closed states that are populated at hyperpolarized potentials, in which R368 and R371 are near the intracellular surface of the protein (Larsson et al. 1996; Starace et al. 1997). Rather, our data suggest that E283 interacts with R368 and R371 in some activated or partially activated conformations. Analysis of the functional effects of double charge reversal mutations suggests that 283 and 371 are in their closest proximity in the activated conformation of the voltage sensor, whereas 283 and 368 may achieve their closest proximity in an intermediate closed state in which some but not all of the gating charge has moved.
MATERIALS AND METHODS
Molecular Biology
Mutations were generated by PCR, using a three or four primer strategy (Horton et al. 1989; Landt et al. 1990; Sarkar and Sommer 1990). PCR products were digested with appropriate restriction enzymes and transferred into a Bluescript (Stratagene Inc.) subclone of the Shaker-IR cDNA. In Shaker-IR, amino acids 6–46 have been deleted to remove N-type inactivation (Hoshi et al. 1990). Sequences were verified by dideoxy sequencing. Run-off transcripts of RNA were prepared using the mMESSAGE mMACHINE kit (Ambion Inc.) and injected into Xenopus oocytes as previously described (Timpe et al. 1988; Santacruz-Toloza et al. 1994). Injected oocytes were stored at 18°C for 1–2 d in ND96 (96 mM NaCl, 5 mM KCl, 1 mM MgCl2, 1.8 mM CaCl2, 5 mM HEPES, pH 7.5) before electrophysiological analysis.
Electrophysiology
Whole-cell currents were measured with a two-electrode voltage clamp (OC-725; Warner Electronics). Recording electrodes were filled with 3 M KCl and had resistances of 0.3–1 MΩ. Currents were recorded at room temperature (20–22°C) in modified Barth's saline containing 50 mM RbCl [50 mM RbCl, 39 mM NaCl, 2.4 mM NaHCO3, 0.82 mM MgSO4, 0.33 mM Ca (NO3)2, 0.41 mM CaCl2, 10 mM HEPES, pH 7.5]. Alternatively, currents were recorded in modified Barth's saline containing 1 mM KCl [1 mM KCl, 88 mM NaCl, 2.4 mM NaHCO3, 0.82 mM MgSO4, 0.33 mM Ca (NO3)2, 0.41 mM CaCl2, 10 mM HEPES, pH 7.5], or Shaker currents were partially blocked by 118 mM TEA (complete composition: 118 mM TEA-Cl, 1.8 mM CaCl2, 10 mM HEPES, pH 7.5). Oocytes were perfused with bath solutions and the bath solution was changed using a gravity-driven perfusion system that was governed by solenoid valves and controlled manually (exchange time ≈1 s, measured using TEA). Linear leak and capacitative currents were subtracted using the P/−4 protocol (Bezanilla and Armstrong 1977), or were not subtracted, as noted in the text. Data were filtered at 1–4 kHz and acquired using pCLAMP v. 5.5.1 (Axon Instruments, Inc.).
The probability of opening (P o) was measured as a function of voltage from isochronal tail currents. The membrane potential was depolarized from −100 mV to the test potential, and then repolarized to −100 mV. Tail current amplitudes were determined at 0.8 ms after repolarization. The amplitudes were normalized to the maximal current amplitude for that cell and plotted as a function of test potential. The data were fitted using a single, first-power Boltzmann equation to obtain the midpoint potential and slope factor.
The reaction of E283C with hydrophilic sulfhydryl reagents, including the methanethiosulfonate (MTS) derivatives MTS-ethylsulfonate (MTSES) and MTS-ethyltrimethylammonium (MTSET) (Toronto Research Chemicals, Inc.), and CdCl2 (Sigma Chemical Co.), was monitored in oocytes under voltage clamp at a variety of membrane potentials during continuous perfusion of bath solution with or without reagent. MTS reagents were stored at −20°C and were dissolved in the bath solution before each experiment. A series of pulses from a holding potential of −100 to +40 mV were given at 5-s intervals before and during application of sulfhydryl reagents. Deactivation kinetics were fitted with a single exponential function using CLAMPFIT v. 6.0.5 (Axon Instruments, Inc.). A time constant for modification was obtained by plotting deactivation time constants as a function of cumulative exposure time, and fitting the time course with a single exponential function. An apparent second-order rate constant for modification (M−1 s−1) was then calculated as the reciprocal of the time constant divided by the concentration. The reversibility of the functional changes induced by MTS reagents was examined by perfusing with bath solution containing 2 mM dithiothreitol (DTT) (Sigma Chemical Co.) for 20 min. Control experiments showed that this treatment had no effect on oocytes (data not shown). The Cd2+ effect was reversed by perfusing with bath solution supplemented with 1 mM EGTA (Sigma Chemical Co.) and an additional 1 mM CaCl2.
Alternatively, sulfhydryl reagents were applied to oocytes continuously clamped at −100 or +40 mV. According to the P o-V curve (see Fig. 1 B), a negligible fraction of E283C+R371Q-IR channels were activated at −100 mV. Therefore, at this potential, the majority of channel molecules were in the resting conformation. In contrast, at +40 mV, the probability of opening was >90% of its maximal value (see Fig. 1 B). At this potential, the majority of E283C+R371Q-IR channel molecules contained activated voltage sensors, corresponding to open or slow-inactivated conformations.
Figure 1.

Functional expression of E283C+R371Q-IR channels in Xenopus oocytes. (A) Shaker-IR, R371Q-IR, and E283C+R371Q-IR were expressed individually in Xenopus oocytes. 24 h after injection of RNA, currents were recorded using a two-electrode voltage clamp. From a holding potential of −100 mV, the membrane was pulsed to voltages between −100 and +80 mV in 20-mV increments. Tail currents were evoked by return to the holding potential, −100 mV. The bath contained 50 mM RbCl in a modified Barth's solution. (B) P o-V curves for Shaker-IR (•), R371Q-IR (▴), and E283C+ R371Q-IR (▪) channels were derived from isochronal measurements of tail current amplitude. Tail current amplitudes at the indicated potentials were normalized to the maximal amplitude obtained in the experiment. To derive midpoint voltages (Vmid) and slope factors (a), the P o-V curves were fitted with a Boltzmann function: IR, Vmid = −23.3 ± 4.8, a = 9.9 ± 2.5 (n = 8); R371Q-IR, Vmid = −45.4 ± 3.0, a = 5.0 ± 1.0 (n = 7); and E283C+R731Q-IR, Vmid = −13.6 ± 3.3, a = 8.9 ± 1.8 (n = 14). Values are shown in millivolt units as mean ± SD.
To assess the conformation dependence of reaction with the sulfhydryl reagents, the rates of modification at −100 and +40 mV were compared. Control current traces were first recorded during perfusion with bath solution. Then the membrane was clamped to −100 or +40 mV, and reagents were applied by perfusion for various durations. After 30 s of perfusion with reagent-free bath solution, current traces were again recorded. Apparent second-order rate constants for modification were calculated as described above.
For inactivation tagging experiments, the E283R+R368E double mutation was transferred into the Shaker B wild-type background containing an intact inactivation ball and chain (Schwarz et al. 1988). RNA encoding Shaker-IR and E283R+R368E subunits was mixed in molar ratios of 1:1, 1:10, and 1:20, and injected into oocytes. RNA concentration was estimated by measuring absorption at 260 nm and confirmed by electrophoresis with standards of known concentration.
Statistical significance was assessed using a one way ANOVA or Student's t test, as indicated.
RESULTS
An Active Channel with Cysteine Substituted at Position 283 in S2
Substitution of E283 in S2 with cysteine to generate the E283C mutation resulted in low channel activity (data not shown). Previously, we have shown that substituting E283 with the positively charged amino acid, arginine, eliminates functional expression of Shaker channels. In E283R, activity is restored by introducing a second charge reversal mutation at position R371 in S4 to generate the double mutant, E283R+R371E (Tiwari-Woodruff et al. 1997). Therefore, we reasoned that replacing the interacting residue, R371, with the neutral amino acid, glutamine, might restore the activity of E283C. Consistent with our previous analysis of these positions using the intragenic suppression strategy, the double mutant combination E283C+R371Q produced active channels in Xenopus oocytes (Fig. 1).
The functional consequences of the double mutation E283C+R371Q were evaluated in the Shaker-IR background (Fig. 1). The IR deletion removes amino acids 6–46, thereby eliminating fast (N-type) inactivation (Hoshi et al. 1990). E283C+R371Q-IR channels were expressed in Xenopus oocytes and analyzed using a two-electrode voltage clamp. Compared with Shaker-IR channels, E283C+R371Q-IR channels had slower activation and deactivation kinetics (Fig. 1 A). In addition, the midpoint voltage for activation was shifted by ∼10 mV in the depolarized direction (Fig. 1 B). In contrast, R371Q-IR channels had somewhat slower deactivation kinetics but relatively normal activation kinetics compared with Shaker-IR channels (Fig. 1 A). The voltage dependence of activation was shifted in the hyperpolarized direction (Fig. 1 B).
Reaction of C283 with Sulfhydryl-specific Reagents
Reaction of C283 with methanethiosulfonate derivatives was detected by changes in the functional properties of E283C+R371Q-IR channels. After expression of E283C+R371Q-IR in oocytes, MTSET or MTSES was applied extracellularly during continuous perfusion. Shaker-IR and R371Q-IR served as controls. Treatment with MTSET, a positively charged reagent, slowed activation kinetics and markedly accelerated deactivation in E283C+R371Q-IR channels (Fig. 2 A). In addition, MTSET application reduced the amplitude of the current. This effect was due, at least in part, to a shift of approximately +27 mV in the midpoint voltage for activation upon modification with MTSET (data not shown). In contrast, the properties of Shaker-IR and R371Q-IR channels were unaffected by MTSET, indicating that the functional changes in E283C+R371Q-IR channels resulted from modification of the cysteine at position 283 (Fig. 2 A).
Figure 2.

Modification of C283 by extracellular MTS reagents. (A) Currents were recorded from Shaker-IR, R371Q-IR, and E283C+R371Q-IR channels before (#) and after (*) treatment with 5 mM MTSET applied in the 50-mM RbCl bath solution during continuous perfusion. From a holding potential of −100 mV, the membrane was pulsed to +40 mV. (B) Currents were recorded from Shaker-IR, R371Q-IR, and E283C+R371Q-IR channels before (#) and after (*) treatment with 5 mM MTSES applied in the 50-mM RbCl bath solution during continuous perfusion. Pulse protocol was the same as in A.
Upon extracellular application of the negatively charged sulfhydryl reagent, MTSES, similar results were obtained (Fig. 2 B). Deactivation of E283C+R371Q-IR channels was significantly accelerated, and the P o-V curve was shifted by ∼40 mV in the depolarized direction. No change in activation kinetics was detected after treatment with MTSES, however. Control experiments showed that MTSES did not significantly alter the functional properties of Shaker-IR or R371Q-IR channels (Fig. 2 B).
In subsequent experiments, reaction of C283 with the MTS reagents was monitored by measuring deactivation kinetics.
To characterize the rate of C283 modification, the change in tail current kinetics was measured as a function of cumulative exposure time to the MTS reagents (Fig. 3). At regular intervals, tail currents were recorded and subsequently fit with one exponential component to obtain deactivation time constants (Fig. 3A and Fig. B). These time constants were plotted versus perfusion time, and apparent second-order rate constants for modification by MTSET and MTSES were derived by fitting single exponential functions to the data (Fig. 3C and Fig. D). Modification with the negatively charged MTSES reagent was approximately three times as fast as with the positively charged MTSET reagent, presumably reflecting differences in their size, inherent reactivity, and sensitivity to the local electrostatic environment (Stauffer and Karlin 1994). Reaction rates with C283 were similar to those reported for cysteine residues lining the pore in KIR2.1 channels (Lu et al. 1999), but were ∼1,000-fold slower than with free thiols (Stauffer and Karlin 1994), suggesting that C283 is not fully exposed to the extracellular solution.
Figure 3.

Rate of modification of deactivation kinetics in E283C+R371Q-IR channels treated with MTS reagents. (A) The pulse protocol for the experiment is shown. At 5.6-s intervals, the membrane was pulsed from the holding potential of −100 to +40 mV for 200 ms. The first current trace was recorded in the control bath solution containing 50 mM RbCl, whereas for subsequent pulses, the bath solution was supplemented with 5 mM MTSET or 1 mM MTSES (arrow). Oocytes were subjected to continuous perfusion with the indicated solutions. (B) Representative tail currents recorded from single cells after every fifth pulse to +40 mV are shown superimposed. Currents recorded in control solution after the first pulse (#) and in MTS-containing solution after the last pulse (*) are labeled as indicated. Tail currents were fitted with single exponential functions, shown as solid curves superimposed on current traces, to derive deactivation time constants (τdeact.). (C) Fitted τdeact. values were plotted as a function of perfusion time. A time constant for modification was derived by fitting a single exponential function to the data (solid curve). For the representative experiment shown, τ for 5 mM MTSET was 20.0 s and τ for 1 mM MTSES was 52.0 s. (D) Apparent second-order rate constants, calculated as 1/(time constant of modification × concentration), are shown in a box plot. Means (M−1 s−1) ± SD were 11.8 ± 2.0 (n = 14), and 32.2 ± 15.5 (n = 8) for MTSET and MTSES, respectively. The box plot depicts the statistical distribution of the data: × indicates the 95th (top) and 5th (bottom) percentile points, error bars represent the 90th (top) and 10th (bottom) percentiles, the upper and lower margins of the box correspond to the 75th and 25th percentiles, solid lines within the box mark the median, while □ indicates the mean.
Modification of C283 by the MTS reagents could not be reversed by treatment with DTT. Perfusion with 2 mM DTT for 20 min at room temperature did not restore the original functional properties of E283C+R371Q-IR channels (data not shown). Similar findings have been reported previously (McLaughlin et al. 1995).
To investigate the effect of another sulfhydryl reagent on the functional properties of E283C+R371Q-IR channels, Cd2+ (300 μM) was applied in the extracellular solution. Similar to the MTS reagents, Cd2+ accelerated the kinetics of deactivation (Fig. 4 A). Unlike modification by the MTS reagents, however, the Cd2+ effect could be completely reversed upon perfusion with the Cd2+ chelator, EGTA (Fig. 4B and Fig. C). Cd2+ also slowed activation kinetics (data not shown) and shifted the P o-V curve by ∼10 mV in the depolarized direction (Fig. 4 D). In control experiments, Cd2+ did not significantly alter the deactivation kinetics or other functional properties of Shaker-IR channels (Fig. 4 E). These results confirm that specific reaction of sulfhydryl reagents with C283 substantially alters the functional properties of E283R+R371Q-IR channels.
Figure 4.

Onset and reversal of Cd2+ acceleration of E283C+R371Q-IR deactivation kinetics. (A) Using the pulse protocol shown in Fig. 3 A, the first pulse was recorded in control bath solution, whereas subsequent pulses were recorded in bath solution supplemented with 300 μM CdCl2. Representative tail currents recorded from a single cell after successive pulses are shown superimposed. Currents recorded in control solution after the first pulse (#) and in Cd2+-containing solution after the last pulse (*) are labeled as indicated. Tail currents were fitted with single exponential functions, shown as solid curves superimposed on current traces. (B) The pulse protocol was repeated in the same cell after saturation of the Cd2+ effect. The first pulse was recorded in the Cd2+-containing solution, and subsequent pulses were recorded in control bath solution supplemented with 1 mM EGTA. Representative tail currents recorded from the same cell as in A are shown. Currents recorded in Cd2+-containing solution after the first pulse (*) and in EGTA-containing solution after the last pulse (+) are labeled as indicated. Tail currents were fitted with single exponential functions, shown as solid curves superimposed on current traces. (C, left) Deactivation time constants (τdeact.) obtained from fits shown in A and B were plotted as a function of perfusion time. Values of τdeact. obtained in control (▴), Cd2+-containing (○), and EGTA-containing (□) bath solutions are shown. Time constants for the onset (7.5 s) and reversal (45.3 s) of the Cd2+ effect were derived as described in Fig. 3 C. (Right) Box plots show apparent second-order rate constant for onset of the Cd2+ effect, calculated as 1/(time constant of modification × concentration), and apparent first-order rate constant for reversal in the presence of EGTA, calculated as 1/time constant of modification. Means ± SD for modification by Cd2+ and reversal in the presence of EGTA were 430 ± 97 M−1 s−1 (n = 8), and 0.018 ± 0.003 s−1 (n = 8), respectively. (D) P o-V curves for E283C+R371Q-IR channels were derived from isochronal measurements of tail current amplitude before (▴) and after (○) treatment with Cd2+, and after reversal with EGTA (□). (E) Currents were recorded from Shaker-IR channels in the presence (*) and absence (#) of 300 μM CdCl2 by pulsing from a holding potential of −100 to +40 mV. The bath solution was modified Barth's saline containing 50 mM KCl [50 mM KCl, 39 mM NaCl, 2.4 mM NaHCO3, 0.82 mM MgSO4, 0.33 mM Ca (NO3)2, 0.41 mM CaCl2, 10 mM HEPES, pH 7.5].
The rate of change of deactivation kinetics upon application of Cd2+ and its reversal with EGTA was characterized as a function of perfusion time (Fig. 4 C). Interestingly, the onset of the Cd2+ effect was significantly faster than its reversal with EGTA. While this may reflect a faster on than off rate for Cd2+, it is important to note that the onset and reversal of the Cd2+ effect may have different stoichiometries. Binding of Cd2+ to a single subunit is expected to modify the deactivation kinetics of the channel. In contrast, recovery requires the dissociation of Cd2+ from all subunits to which it has bound. Therefore, the recovery of channels that have bound more than one Cd2+ will be delayed compared with channels where only one subunit has bound Cd2+.
Similar Rates of Reaction at Depolarized and Hyperpolarized Potentials
The results described above establish that C283 reacts with extracellularly applied sulfhydryl reagents to generate easily detected differences in deactivation rate, as well as less dramatic effects on other channel properties. In the preceding experiments, reagents were applied during continuous perfusion at a variety of voltages, allowing exposure to all channel conformations.
To determine whether the reactivity of C283 was conformation dependent, we compared reaction with sulfhydryl reagents at two potentials, −100 mV, at which most voltage sensors in E283C+R371Q-IR channels would be expected to be in a resting, closed conformation, and +40 mV, at which most voltage sensors would have undergone the voltage-dependent conformational changes associated with gating and thereby be in an activated conformation (see Fig. 1 B). In our experiments, we have not attempted to distinguish between open- and slow-inactivated conformations.
To investigate whether C283 reacted preferentially at depolarized or hyperpolarized potentials, MTSET was applied according to the voltage protocols shown in Fig. 5 A. Control currents were recorded from unmodified channels during a 200-ms pulse to +40 mV. Then, the reagent was applied for 2 min at either −100 or +40 mV. MTSET was quenched by perfusion with 2 mM DTT for 30 s, followed by a 200-ms test pulse to +40 mV to record currents from treated channels. Application of MTSET at −100 or at +40 mV produced identical changes in deactivation kinetics (Fig. 5 B). Indeed, all functional effects seen during continuous perfusion of MTSET were reproduced regardless of whether the reagent was applied at −100 or +40 mV (data not shown). Similarly, MTSES applied at either −100 or +40 mV produced the same changes in the functional properties of the channel as did continuous perfusion (data not shown).
Figure 5.

Modification of C283 by extracellular MTS reagents applied at −100 or +40 mV. (A) The pulse protocols for the experiments are shown. While clamping the membrane at either −100 mV (“resting” protocol) or +40 mV (“activated” protocol), 5 mM MTSET or 1 mM MTSES (MTS) was applied for 2 min, followed by 2 mM DTT (DTT) for 30 s. MTS reagents or DTT were added to the control (50 mM RbCl) bath solution and applied by continuous perfusion. Before (1) and after (2) treatment, current traces were recorded while perfusing with the control solution by pulsing from the holding potential of −100 to +40 mV for 200 ms. (B) Representative tail currents obtained before (1) and after (2) treatment with 5 mM MTSET at −100 mV (left) or +40 mV (right) are shown. Traces were fitted with a single exponential function, which is shown (solid curve) superimposed on the tail currents. (C) Box plot of deactivation time constants (τdeact.) derived from single component fits is shown for E283C+R371Q-IR channels before and after treatment with MTS reagents at −100 or +40 mV, as indicated. Mean (ms) ± SD were: untreated control, 90.9 ± 18.5 (n = 15); MTSET at −100 mV, 35.2 ± 6.8 (n = 13); MTSET at +40 mV, 43.6 ± 9.7 (n = 12); MTSES at −100 mV, 23.4 ± 5.4 (n = 6); and MTSES at +40 mV, 34.7 ± 9.1 (n = 7). Time constants obtained after treatment at −100 or +40 mV do not differ significantly, as assessed by a one way ANOVA (P > 0.01).
The effects of MTSET and MTSES on deactivation kinetics at −100 and +40 mV were quantified by fitting a single exponential function to tail currents before and after application of the reagents. As shown in Fig. 5 C, the resulting time constants were not significantly different (P > 0.01) whether the indicated reagent was applied at hyperpolarized or depolarized potentials. These results indicate that C283 reacts with extracellular sulfhydryl reagents whether the voltage sensor is in an activated or resting conformation.
A large change in the environment of C283 between the resting and activated conformations might be indicated by substantial differences in the rate of modification at −100 and +40 mV. A slow rate of reaction might indicate limited accessibility of the reagent to an intracellularly oriented or buried residue (Holmgren et al. 1996; Liu et al. 1996). Therefore, we measured the rate of change of deactivation kinetics in response to MTSET or MTSES application at −100 or +40 mV (Fig. 6) using the same experimental protocol as shown in Fig. 5 A, except that the cumulative exposure time to the MTS reagents was varied between 5 and 60 s.
Figure 6.

Rate of modification of deactivation kinetics in E283C+R371Q-IR channels treated with MTS reagents at −100 or +40 mV. The pulse protocol was the same as in Fig. 5 A, except that the time of application of the MTS reagents was varied between 5 and 60 s. Box plot of apparent second-order rate constants for modification by MTS reagents at either −100 or +40 mV is shown. Mean (M−1 s−1) ± SD were: MTSET at −100 mV, 17.9 ± 6.7 (n = 5); MTSET at +40 mV, 5.2 ± 2.1 (n = 5); MTSES at −100 mV, 70.2 ± 23.9 (n = 5); MTSES at +40 mV, 19.9 ± 5.6 (n = 10). Difference in reaction rates with both MTS reagents at −100 and +40 mV are statistically significant, as assessed by a one way ANOVA (P < 0.01).
The apparent second-order rate constants for modification by either the positively or negatively charged MTS reagent were somewhat larger at −100 than at +40 mV (Fig. 6). These differences were compared with a one-way ANOVA and shown to be statistically significant at the 0.01 probability level. This suggests a somewhat altered environment for C283 in the resting and activated conformations. Because an increased rate of reaction at −100 mV was observed with both positively and negatively charged reagents, this was not an electrostatic effect attributable to the charge on the reagent. However, the change in reaction rate at these potentials was relatively small, suggesting that any change in environment is limited and does not correspond to a large change in exposure of C283 in resting and activated conformations. Instead, the results suggest that C283 may be slightly more accessible in the resting than the activated conformation. However, the more or less equal reactivity of position 283 at hyperpolarized and depolarized potentials with both positively and negatively charged reagents is consistent with the idea that 283 is accessible to the extracellular fluid in both resting and activated channel conformations. In addition, C283 in E283C+R371Q-IR channels is unlikely to feel a strong local electric field in either conformation.
Similar to the MTS reagents, Cd2+ had an identical effect on deactivation kinetics whether it was applied at −100 or +40 mV. Because it can be reversed by EGTA, the effect on the deactivation kinetics of Cd2+ applied to the resting and activated conformations could be compared in the same oocyte and shown not to differ (Fig. 7).
Figure 7.

Onset and reversal of Cd2+ effect at −100 and +40 mV. (A) The pulse protocols for the experiments are shown. While clamping the membrane at either −100 mV (“resting” protocol) or +40 mV (“activated” protocol), 300 μM CdCl2 (indicated by Cd2+) or 1 mM EGTA (indicated by EGTA) was applied for 2 min. Currents were recorded in the control bath solution (50 mM RbCl lacking EGTA) during 200-ms test pulses from −100 to +40 mV before (1), between (2), and after (3) Cd2+ and EGTA treatment. (B) Box plot of deactivation time constants obtained after application of Cd2+ and EGTA at −100 or +40 mV is shown. Time constants (τdeact.), obtained by fitting a single exponential function to tail current traces, were: untreated control, 81.4 ± 16.9 (n = 7); Cd2+ at −100 mV, 26.9 ± 4.8 (n = 7); EGTA at −100 mV, 81.5 ± 36.8 (n = 4); Cd2+ at +40 mV, 30.5 ± 11.9 (n = 6); and EGTA at +40 mV, 85.0 ± 32.9 (n = 4). Values are given as mean (ms) ± SD. Deactivation time constants for Cd2+ applied at −100 and +40 mV were not statistically different (one way ANOVA, P > 0.05). EGTA completely reversed the Cd2+ effect at −100 and +40 mV (P > 0.05, compared with untreated control).
These results indicate that position 283 is exposed to hydrophilic sulfhydryl reagents on the extracellular side of the membrane at both −100 and +40 mV, although there may be small changes in the environment of the residue at these potentials. In contrast, residues 368 and 371 traverse virtually all of the transmembrane electric field when the channel moves between resting and activated conformations (Larsson et al. 1996; Starace et al. 1997). Taken together, these data suggest that position 283 does not interact with 368 or 371 in the resting, closed conformation(s) that predominate at hyperpolarized membrane potentials. In these circumstances, position 283 is separated from 368 and 371 by the barrier of the transmembrane electric field. Rather, it is likely that the interactions inferred from the intragenic suppression approach occur only in conformations where some or all of the gating charge (including R368 and R371) has crossed the field.
E283R+R371E Increases the Relative Stability of the Activated Conformation and Slows Activation and Deactivation Kinetics
To test the hypothesis that E283 interacts with R368 and R371 in partially or fully activated conformations, we analyzed the functional effects of the double charge reversal mutations, E283R+R368E and E283R+R371E. Because electrostatic interactions are involved in specifying a particular fold of a protein (Hendsch and Tidor 1994; Oliveberg and Fersht 1996; Tissot et al. 1996), these charge reversal mutations, which cause dramatic changes in local electrostatic potential compared with the wild-type protein, should provide insights into the conformations in which these residues are in the closest proximity.
As we previously reported, the mutation E283R partially blocks maturation of the Shaker protein (Tiwari-Woodruff et al. 1997). This defect is specifically suppressed by the addition of either R368E or R371E, but no other S4 charge reversal mutation. E283R+R368E and E283R+R371E subunits adopt native protein conformations as shown by their efficient maturation and their incorporation into functional channels. Strikingly, however, the double charge reversal mutants have distinct effects on the steady state voltage dependence of the Shaker channel.
Two observations initially suggested that the voltage dependence of E283R+R371E-IR channels was substantially shifted in the hyperpolarized direction. Oocytes expressing E283R+R371E-IR channels and bathed in a solution containing 1 mM K+ had extremely negative resting potentials (−77 ± 7 mV, mean ± SD, n = 25) compared with oocytes expressing Shaker-IR channels (−36 ± 5 mV, mean ± SD, n = 15). Furthermore, in a high K+ bath solution, these oocytes could not be stably clamped at a negative holding potential (data not shown). In 1 mM K+, however, the oocytes could be held at −80 mV, close to the reversal potential for K+ under these ionic conditions.
To test the hypothesis that activation is shifted to hyperpolarized potentials in E283R+R371E-IR channels, unsubtracted currents were recorded using a two-electrode voltage clamp (Fig. 8 A). In this experiment, the extracellular solution contained 1 mM K+, and the membrane potential was stepped from −100 mV to potentials between −100 and +80 mV, in increments of +20 mV. Depolarizing pulses evoked an instantaneous outward current through channels that were already open at the holding potential plus a slowly activating component of current. Two lines of evidence indicate that both the instantaneous and slowly activating currents were primarily due to mutant Shaker channels. First, currents in injected oocytes were significantly larger than unsubtracted, time-independent leak currents recorded from uninjected oocytes of the same batch (Fig. 8 B). This suggests that the contribution of leak currents to the records obtained from injected oocytes was very small. Second, both the instantaneous and slowly activating currents in injected oocytes were substantially blocked by 118 mM TEA (Fig. 8 C). It should be noted that this concentration of TEA did not completely block Shaker-IR channels (data not shown). In contrast, TEA had no significant effect on leak currents recorded from uninjected oocytes of the same batch (Fig. 8 D).
Figure 8.

Activation at hyperpolarized potentials in E283R+R371E-IR channels. (A) E283R+R371E-IR channels were expressed in oocytes, and currents were recorded without leak subtraction. The membrane potential was stepped from the holding potential of −100 mV to voltages between −100 and +80 mV in +20-mV increments. The oocyte was continuously perfused with bath solution containing 1 mM KCl in a modified Barth's saline. (B) Unsubtracted currents were recorded from an uninjected oocyte of the same batch using the same protocol as in A. (C) Currents were recorded from E283E+R371E-IR channels in the presence of 118 mM TEA using the same protocol as in A. These records were obtained from the same oocyte used in A. This concentration of TEA did not completely block the channels; in some oocytes, a larger fraction of the current was blocked (data not shown). (D) Unsubtracted currents were recorded from an uninjected oocyte of the same batch in the presence of 118 mM TEA using the same protocol as in A. These records were obtained from the same oocyte used in B.
These results are consistent with the idea that E283R+R371E-IR channels have a substantial open probability at hyperpolarized potentials. However, the open probability of E283R+R371E-IR channels is not maximal at −100 mV because depolarizing pulses activated additional channels. Activation kinetics were very slow compared with Shaker-IR channels (see Fig. 1 A).
In E283R+R371E-IR channels, current kinetics depended on the order in which a series of depolarizing voltage steps was applied. Fig. 9 shows current traces recorded from the same injected and uninjected oocytes used in Fig. 8. In the experiment shown in Fig. 9, however, the membrane potential was stepped from −100 mV to potentials between +80 and −100 mV, in increments of −20 mV. Using this protocol, the slowly activating component of E283R+R371E-IR current was seen during the first pulse to +80 mV, but subsequent pulses evoked only instantaneous currents (Fig. 9 A). Again, both instantaneous and slowly activating currents were substantially blocked by TEA and were not present in uninjected oocytes from the same batch (Fig. 9, B–D). During short periods of time (20 ms), tail currents did not decay significantly. These results suggest that E283R+R371E-IR channels deactivate extremely slowly. Channels opened during the first, large depolarizing step remained open during the 5-s interepisode interval during which the membrane potential was held at −100 mV. Slow deactivation of the channel was not obvious in Fig. 8 because each successive pulse was more depolarized than the last, opening additional channels.
Figure 9.

Current kinetics depend on pulse protocol in E283R+R371E-IR channels. (A) E283R+R371E-IR channels were expressed in oocytes, and currents were recorded without leak subtraction. The membrane potential was stepped from the holding potential of −100 mV to voltages between +80 and −100 mV in −20-mV increments. These records were obtained from the same oocyte used in Fig. 8 A, but the voltage pulses were applied in the opposite order compared with Fig. 8. The oocyte was continuously perfused with bath solution containing 1 mM KCl. (B) Unsubtracted currents were recorded from an uninjected oocyte of the same batch using the same protocol as in A. These records were obtained from the same oocyte used in Fig. 8 B. (C) Currents were recorded from E283E+R371E-IR channels in the presence of 118 mM TEA chloride using the same protocol as in A. These records were obtained from the same oocyte used in A and Fig. 8 A. (D) Unsubtracted currents were recorded from an uninjected oocyte of the same batch in the presence of 118 mM TEA using the same protocol as in A. These records were obtained from the same oocyte used in B and Fig. 8 B.
To confirm that the apparent hyperpolarized shift in the voltage dependence of E283R+R371E-IR channels was not due to extremely slow deactivation kinetics, we investigated the effect of interepisode interval on current kinetics. Repeated test pulses to +60 mV were applied, while varying the interepisode interval, during which the membrane was held at −100 mV (Fig. 10 A). Using a 5- or 15-s interval at −100 mV, currents evoked by three successive pulses to +60 mV failed to superimpose (Fig. 10B and Fig. C), suggesting that channels opened during the first pulse did not deactivate completely during the interepisode interval. However, interepisode intervals of 30 s or longer led to excellent superposition of successive traces (Fig. 10, D–F). These results confirm that deactivation of E283R+R371E-IR channels occurs slowly at −100 mV. However, the persistence of an instantaneous component of current despite complete deactivation indicates that the channels do have a substantial but submaximal open probability at the hyperpolarized holding potential.
Figure 10.

Slow deactivation kinetics do not account for activation at hyperpolarized potentials in E283R+R371E-IR channels. (A) The pulse protocol for the experiment is shown. Three test pulses from the holding potential of −100 to +60 mV were applied. The interepisode interval (Δt) at −100 mV was varied. The oocyte was continuously perfused with bath solution containing 1 mM KCl. (B) Δt = 5 s. (C) Δt = 15 s. (D) Δt = 30 s. (E) Δt = 45 s. (F) Δt = 60 s. Capacitative transients have been truncated in B–F.
We conclude that E283R+R371E-IR channels differ from Shaker-IR channels in at least three aspects. The voltage dependence of activation is significantly shifted to hyperpolarized potentials, and the kinetics of both pore opening and deactivation have been greatly slowed.
E283R+R368E Shifts Channel Opening to Depolarized Potentials
In biochemical experiments, the second site mutation R368E was as effective as R371E at restoring maturation to E283R subunits (Tiwari-Woodruff et al. 1997). However, activity from tetrameric E283R+R368E-IR channels was not detected in Xenopus oocytes. This was not because the subunits are misfolded. Using an inactivation-tagging strategy, we have demonstrated that E283R+R368E subunits incorporate efficiently into active channels, and therefore these subunits must adopt a native conformation (Tiwari-Woodruff et al. 1997).
To explain the lack of activity in E283R+R368E-IR channels, we proposed that the paired mutations shifted the voltage dependence of activation to depolarized potentials, beyond the range of our voltage-clamp apparatus. This hypothesis was tested using the inactivation-tagging strategy. E283R+R368E subunits were tagged with the amino-terminal ball and chain responsible for fast inactivation (Hoshi et al. 1990), and were coexpressed in oocytes with noninactivating Shaker-IR subunits. These two types of subunits assemble to form tetrameric channels that conduct a hybrid current (Tiwari-Woodruff et al. 1997). An inactivating component of the current is derived from channels that contain at least one inactivation-tagged E283R+R368E subunit, whereas the steady state component of the current reflects the activity of channels composed of noninactivating Shaker-IR subunits (Fig. 11 A). To assess the effect of E283R+R368E subunits on the voltage dependence of channel opening, the steady state activation properties of the inactivating component of current were compared with those of the steady state component. To derive a G-V curve for the inactivating component, the steady state current was subtracted from the peak current and the chord conductance equation was applied. Also shown are the positions of the G-V curve from homotetrameric wild-type and IR channels (Fig. 11 B).
Figure 11.

Activation shifted to depolarized potentials by the presence of E283R+R368E subunits in heterotetrameric channels. (A) RNA encoding Shaker-IR and inactivation-tagged E283R+R386E subunits was coinjected into oocytes at ratios of 1:10 (top) or 1:1 (middle), or Shaker-IR RNA was injected alone (bottom). Currents were elicited by pulsing from a holding potential of −100 to +70 mV. A constant amount of Shaker-IR RNA was injected in each case. Note the change in current amplitude as a function of injection ratio. (B) G-V curves are shown for Shaker-IR (▵) and Shaker wild-type (•) channels and for the steady state (□, noninactivating) and peak (▪, ▴, inactivating) components of currents obtained after coexpression of Shaker-IR and E283R+R368E subunits at RNA ratios of 1:1 (▴, □) and 1:10 (▪). Similar results were obtained for an injection ratio of 1:20 (data not shown). Currents were evoked by 100-ms pulses from the holding potential of −100 mV to potentials ranging from −90 to +90 mV in 20-mV increments. Conductances were calculated using the chord conductance equation from inactivating (peak minus steady state, filled symbols) or noninactivating (steady state, open symbols) current amplitudes, normalized to the maximum conductance obtained in the experiment, and plotted as a function of pulse potential. Values are shown as mean ± SEM obtained from three experiments with four to eight oocytes tested per experiment. Midpoint voltages in units of millivolts ± SD, obtained by fitting the conductance data with a single Boltzmann function, were: Shaker-IR, −19 ± 2; Shaker wild type, −10 ± 2; inactivating component of Shaker-IR and E283R+R368E coinjected at a 1:1 ratio, 30 ± 2; inactivating component of Shaker-IR and E283R+R368E coinjected at a 1:10 ratio, 28 ± 3; noninactivating component of Shaker-IR and E283R+R368E coinjected at a 1:1 ratio, −21 ± 4. (C) E283R+R368E subunits exert a dominant negative effect on the current amplitude. RNA encoding Shaker-IR and E283R+ R368E subunits was injected at molar ratios of 1:1, 1:10, or 1:20, or Shaker-IR RNA was injected alone. A constant amount of Shaker-IR RNA was injected in each case. Currents were evoked by pulsing from −100 to +70 mV. Maximum (peak) current amplitudes are shown in a histogram as mean ± SD, n = 5–15 for each injection ratio. Statistical significance was evaluated using Student's t test (***P < 0.001).
After coexpression of Shaker-IR and inactivation-tagged E283R+R368E subunits, the G-V curve of the inactivating component of current was significantly shifted (by ∼38 mV) in the depolarized direction compared with that of Shaker wild-type channels (Fig. 11 B). As expected, the G-V curves of the steady state component of current and of Shaker-IR channels overlapped. These results demonstrate that the presence of at least one E283R+R368E subunit shifts channel opening significantly in the depolarized direction.
Interestingly, the position of the G-V curve of the inactivating component was identical after injecting RNA encoding IR and E283R+R368E in ratios of 1:1 and 1:10 (Fig. 11 B). These data suggest that Shaker channels containing a limited number, perhaps no more than one, E283R+R368E subunit were able to open in the accessible voltage range. Consistent with this interpretation, we observed a significant dominant negative effect on the maximum current amplitude as the proportion of E283R+R368E subunits was increased relative to IR subunits (Fig. 11 C).
Thus, the combination of the E283R mutation with R368E or R371E results in dramatically different effects on the steady state activation properties of Shaker channels. These data suggest that the double mutant combinations E283R+R368E and E283R+R371E stabilize the channel protein in different conformations. One interpretation of these experiments is that the mutant phenotypes identify conformations in which the residues approach each other most closely. In this case, analysis of the E283R+R371E phenotype suggests that the 283/371 interaction occurs in an activated conformation that is permissive for pore opening. In contrast, the E283R+R368E phenotype suggests that the 283/368 interaction occurs in a closed conformation. Because 368 must move towards the extracellular surface to interact with 283, we infer that this conformation would not correspond to the resting state, but rather an intermediate closed state along the activation pathway.
DISCUSSION
Model for Voltage-dependent Structural Interactions in the Shaker Channel
The results obtained in this study suggest that structural interactions between E283 in S2 and R368 and R371 in S4, previously inferred using an intragenic suppression strategy (Tiwari-Woodruff et al. 1997), occur in a subset of the conformations through which the Shaker channel progresses during voltage-dependent activation. A tentative model for voltage-dependent structural interactions between positions 283, 368, and 371 is shown in Fig. 12. This model proposes three conformations corresponding to a resting state, in which the channel's gating charge has not moved, an intermediate closed state, in which at least some of the gating charge has moved, and an activated conformation, in which most or all of the gating charge has moved. We propose that positions 283, 368, and 371 do not interact in the resting state, which corresponds to the conformation that predominates at hyperpolarized potentials in wild-type channels (Fig. 12). Our results indicate that position 283 is near the extracellular surface of the protein at hyperpolarized potentials, whereas the results of others indicate that positions 368 and 371 are near the intracellular surface of the protein under these conditions (Larsson et al. 1996; Starace et al. 1997). We further propose that E283 in S2 and R371 in S4 achieve their closest proximity in an activated conformation in which most or all of the channel's gating charge has moved. Such a conformation would presumably permit both pore opening and slow inactivation. Finally, we suggest the existence of an intermediate closed state, in which E283 and R368 achieve their closest proximity. In this conformation, R368 has moved to a position near the extracellular surface of the protein, suggesting that some of the gating charge has moved. This conformation may be a short-lived or unstable state along the activation pathway of wild-type channels. We have inferred its existence from the phenotype of the E283R+R368E double-mutant subunit, in which this conformation has an increased stability or a prolonged lifetime. Our model represents a preliminary attempt to describe some of the structural rearrangements that occur upon voltage-dependent activation of the Shaker K+ channel. It is not intended to describe all of the conformational states in the gating process.
Figure 12.
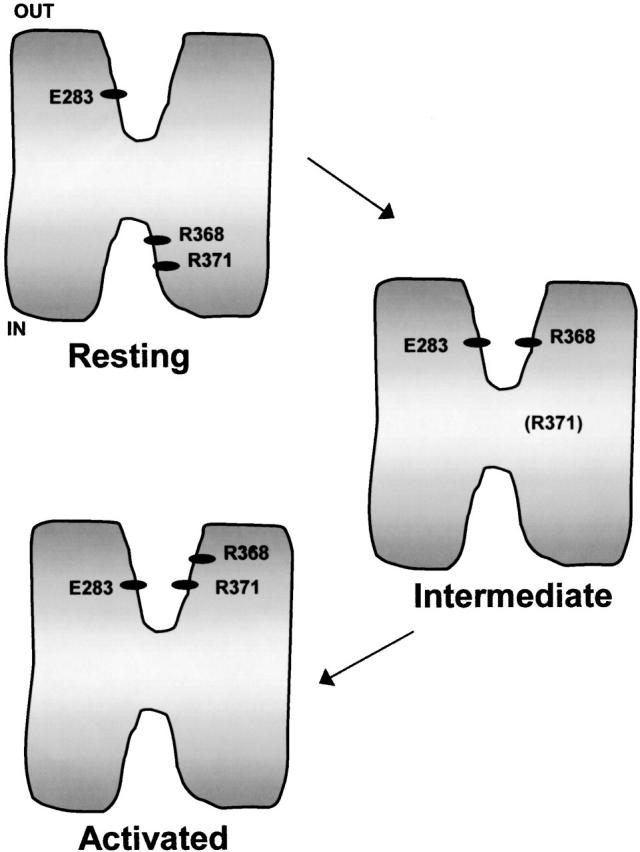
Tentative model of structural rearrangements that accompany voltage-dependent activation in Shaker K+ channels. In the resting state, E283 is near the extracellular surface of the protein (this study), whereas R368 and R371 are near the intracellular surface (Larsson et al. 1996; Starace et al. 1997). In an intermediate closed conformation, R368 is in proximity with E283. R371 is shown in parentheses because our data do not suggest its position in this conformation. In the activated conformation, E283 and R371 are in proximity.
Our model is consistent with S4 involvement in at least two stages of gating charge movement in Shaker channels. In our model, the first stage is characterized by the movement of R368 from its resting position near the intracellular surface of the protein to a position near E283 at the extracellular surface of the protein. The second stage is characterized by the movement of R371 from its (undetermined) position in the intermediate closed conformation to a position near E283 at the extracellular surface of the protein.
Two stages of charge movement in Shaker channels have previously been inferred from analysis of gating currents and their fluctuations (Bezanilla et al. 1994; Perozo et al. 1994; Sigg et al. 1994; Kanevsky and Aldrich 1999). Baker et al. 1998 have investigated the topology of the S4 segment in an intermediate closed conformation that may separate these two phases of charge movement, defining a state in which a cysteine residue at position 365 in the S4 segment is not reactive extracellularly and a cysteine at position 370 in S4 is not reactive intracellularly. The relationship between this conformation and the intermediate state proposed in our model cannot be determined at this time.
Position 283 in S2 Is Located Near Extracellular Surface in Resting and Activated Conformations
A key feature of our model is that position 283 does not interact with 368 or 371 at hyperpolarized potentials. Our data indicate that position 283 is located near the extracellular surface of the protein in both resting and activated conformations. Previous reports indicate that positions 368 and 371 are near the intracellular surface of the protein at hyperpolarized potentials (Larsson et al. 1996; Starace et al. 1997). Therefore, in the resting state, position 283 is separated from 368 and 371 by the portion of the protein across which the transmembrane electric field falls.
Despite the reactivity of C283 with externally applied hydrophilic probes, residue 283 may not be fully extended into the extracellular solution. Mutations at this position have significant effects on protein folding and function, contrary to expectations for a fully exposed surface residue. Rather, the position is involved in electrostatic interactions that are important for specifying the native fold of the protein. Furthermore, MTS reagents react 1,000-fold more slowly with C283 than with thiol groups in solution (Stauffer and Karlin 1994). The observed modification rates are similar to those for pore-lining residues in other channels (Lu et al. 1999), suggesting that access of the reagents to C283 is partially hindered. Consistent with the idea that the large MTS reagents have hindered access to the site, the smaller probe Cd2+ reacts significantly faster with C283 (compare Fig. 3 C and 4 C). Therefore, E283 may be located in a solvent-filled pit near the extracellular surface of the protein. The existence of a pit or crevice in the vicinity of the voltage sensor has been postulated previously (Goldstein 1996; Larsson et al. 1996; Yang et al. 1996; Papazian and Bezanilla 1997).
Measurements of gating charge per channel have previously revealed that E283 is either out of the transmembrane electric field or does not move relative to the field during activation of Shaker channels (Seoh et al. 1996). Consistent with that result, we found that C283 was modified at similar rates by positively and negatively charged MTS reagents, indicating that the charged groups on these compounds did not experience a significant electric field near C283. Taken together, these findings indicate that position 283 is external to most or all of the transmembrane electric field.
Both MTSET and MTSES reacted more rapidly at hyperpolarized than at depolarized potentials, suggesting small changes in the environment of C283 in resting and activated conformations. According to our model, the charged residue R371 approaches position 283 in the activated conformation. Therefore, in the wild-type protein or in mutants with charged residues at positions 283 and 371, a large change in the electrostatic environment near 283 would be expected during gating. However, C283 was modified by MTS reagents in subunits that contained the neutralization mutation, R371Q. This mutation would be expected to cause a smaller change in the local electrostatic environment of C283 than the original arginine residue. Therefore, the apparent decrease in C283 accessibility at +40 mV compared with −100 mV probably reflects steric constraints resulting from the movement of residue 371 into the vicinity.
Interestingly, modification of E283C+R371Q-IR channels by MTSET or MTSES shifted the voltage dependence of activation to depolarized potentials, reflecting a decrease in the relative stability of the open state. Steric constraints near 283 in the activated conformation can also account for this observation. Modifying C283 with a bulky MTS reagent presumably makes it more difficult for the S4 residues to move into their new positions upon activation, thereby favoring the resting conformation.
We found that C283 reacted somewhat faster with the negatively charged MTSES than with the positively charged MTSET (see Fig. 3 D and 6). In contrast, MTSES reacts more slowly than MTSET with thiol groups in solution (Stauffer and Karlin 1994). These results suggest that a fixed positive electrostatic potential, probably generated by another part of the protein, exists in the vicinity of position 283.
E283 and R371 Interact in an Activated Conformation
From the phenotype of the E283R+R371E-IR channel, we propose that positions 283 and 371 are most likely to interact in an activated conformation permissive for pore opening. Both the kinetic and steady state properties of voltage-dependent activation in E283R+R371E-IR channels differed dramatically from IR channels. Activation was shifted in the hyperpolarized direction, with a high but submaximal open probability at −100 mV. In addition, the rates of pore opening and of deactivation were dramatically decreased. These results indicate that the relative stability of the activated state as well as the heights of energetic barriers for transitions into and out of this state have been increased by combining the E283R and R371E mutations. Changing the polarity of the residues in these positions may not only have stabilized the interaction between 283 and 371, but may also have destabilized interactions between 283 and other residues such as 368 that occur in alternative conformations.
Shaker channels are subject to one or more slow inactivation processes that have little inherent voltage dependence, but are more likely to occur once the pore has opened (Hoshi et al. 1991; Olcese et al. 1997; Yang et al. 1997). Given this, it might seem surprising to detect activity from Shaker channels that have a significant open probability at hyperpolarized potentials because of the opportunity for slow inactivation to accumulate before the beginning of a voltage-clamp experiment. Activity from left-shifted mutants has been previously reported, however (Miller and Aldrich 1996). Slow inactivation in Shaker B channels and mutants derived from it is an incomplete process, with ∼10% residual activity detectable after prolonged depolarizations (Olcese et al. 1997). Therefore, it is likely that the activity seen in E283R+R371E-IR channels is due to those channels not inactivated at any given time.
Previous reports indicate that position 371 approaches the extracellular surface of the protein at depolarized potentials. A cysteine at position 371 reacts with intracellularly applied MTS reagents at hyperpolarized potentials, but does not react with extracellularly applied reagents at depolarized potentials (Larsson et al. 1996). We find that C283 readily reacts with extracellular MTS reagents, whereas C371 does not (data not shown). A histidine substituted at position 371 is accessible to intracellular protons at hyperpolarized potentials and extracellular protons at depolarized potentials, resulting in voltage-dependent proton transport (Starace and Bezanilla 1998). Interestingly, proton transport by H371 is reduced if E283 is neutralized, suggesting that the proton may interact with E283 before being released to the extracellular solution (Starace and Bezanilla 1998). Thus, the accessibility of position 371 in the activated conformation depends not only on the size of the probe but also on the nature of the amino acid at position 283. These results suggest that, in the activated conformation, position 371 is deeper inside the proposed pit or crevice than position 283.
E283 and R368 Interact in a Partially Activated, Closed Conformation
According to inactivation tagging experiments, the double mutant E283R+R368E shifts pore opening to depolarized potentials. One interpretation of these results is that changing the polarity at these residues stabilizes the protein in an intermediate closed state in which 368 is closer to 283 than in other conformations. This state would differ from the resting state because position 368 must move relative to the transmembrane field to interact with 283. Thus, in the transition(s) between the resting and intermediate closed states, at least some of the gating charge traverses the field. The positions of R365 and R371, the other charge-moving residues in S4, cannot be inferred from our results, however.
Our inactivation tagging results suggest the existence of a cooperative transition between the intermediate closed state and the open (conducting) state. Opening of channels composed of E283R+R368E and IR subunits is shifted to depolarized potentials. Our interpretation of these data is that the hybrid channels have a voltage dependence intermediate to that of tetrameric IR channels (which open at more hyperpolarized potentials) and tetrameric E283R+R368E channels (which do not open in the accessible voltage range). If activation gating involved independent conformational changes in individual subunits, no inactivating component of current would be expected from hybrid channels because the voltage dependence of the more right-shifted subunit would dominate activation of the whole channel. Whether the cooperative transition opens the pore or instead leads to a more fully activated but still closed conformation cannot be inferred from our data. Interestingly, Ledwell and Aldrich 1999 have recently implicated the S4 segment in the final cooperative step in the activation of Shaker channels.
The existence of a cooperative transition between the intermediate closed state and the conducting state may not be the only possible explanation for our results, however. The idea that K+ channels can open with fewer than four subunits in an activated conformation has been raised by the observation of subconductance states at the single channel level (Chapman et al. 1997; Zheng and Sigworth 1997, Zheng and Sigworth 1998). Thus, we cannot exclude the possibility that the right-shifted, inactivating component of current detected upon coexpression of E283R+R368E and IR subunits represents channels opening with three IR subunits in an activated conformation. In this case, the E283R+R368E subunit would be unable to gate in the accessible voltage range, but the inactivation ball and chain from such subunits would be able to block conduction through the pore.
The structure of the intermediate closed state in which 283 and 368 interact is probably closely related to that of the activated conformation. With rare exceptions, such as the E283R+R368E subunit, efficient rescue of protein maturation using the intragenic suppression strategy results in functional channels with activation midpoints more negative than 0 mV (Papazian et al. 1995; Tiwari-Woodruff et al. 1997; our unpublished observations). In such channels, the activated conformation is inherently more stable (in the absence of a membrane potential) than closed conformations. This suggests that the voltage sensor folds into an activated conformation during channel biogenesis in the ER. Insight into the (normally short-lived) interaction between positions 283 and 368 has been provided as a result of the change in polarity of the residues.
Our data suggest a preliminary picture of some of the structural rearrangements that accompany voltage-dependent activation in Shaker K+ channels. Together with other approaches, such as labeling specific residues with fluorescent probes to assess their environments at different stages of the gating process (Mannuzzu et al. 1996; Cha and Bezanilla 1997, Cha and Bezanilla 1998), these results contribute to an emerging picture of the molecular mechanism of activation.
Acknowledgments
We are grateful to S. Krasne, C.-Y. Tang, W.R. Silverman, and M.P. Myers for comments on the manuscript.
This work was supported by grants from the National Institutes of Health (GM43459) and the American Heart Association, Greater Los Angeles Affiliate.
Footnotes
Abbreviations used in this paper: DTT, dithiothreitol; ER, endoplasmic reticulum; MTS, methanethiosulfonate; MTSES, MTS-ethylsulfonate; MTSET, MTS-ethyltrimethylammonium.
Drs. Tiwari-Woodruff and Lin contributed equally to the work and should be considered co-first authors.
Dr. Tiwari-Woodruff's present address is Department of Neurology, UCLA School of Medicine, Los Angeles, CA 90095. Dr. Schulteis' present address is Molecular Neurobiology Laboratory, The Salk Institute, La Jolla, CA 92037.
References
- Aggarwal S.K., MacKinnon R. Contribution of the S4 segment to gating charge in the Shaker K+ channel. Neuron. 1996;16:1169–1177. doi: 10.1016/s0896-6273(00)80143-9. [DOI] [PubMed] [Google Scholar]
- Baker O.S., Larsson H.P., Mannuzzu L.M., Isacoff E.Y. Three transmembrane conformations and sequence-dependent displacement of the S4 domain in Shaker K+ channel gating. Neuron. 1998;20:1283–1294. doi: 10.1016/s0896-6273(00)80507-3. [DOI] [PubMed] [Google Scholar]
- Bezanilla F., Armstrong C.M. Inactivation of the sodium channel. I. Sodium current experiments. J. Gen. Physiol. 1977;70:549–566. doi: 10.1085/jgp.70.5.549. [DOI] [PMC free article] [PubMed] [Google Scholar]
- Bezanilla F., Perozo E., Stefani E. Gating of Shaker K+ channelsII. The components of gating currents and a model of channel activation. Biophys. J. 1994;66:1011–1021. doi: 10.1016/S0006-3495(94)80882-3. [DOI] [PMC free article] [PubMed] [Google Scholar]
- Cha A., Bezanilla F. Characterizing voltage-dependent conformational changes in the Shaker K+ channel with fluorescence. Neuron. 1997;19:1127–1140. doi: 10.1016/s0896-6273(00)80403-1. [DOI] [PubMed] [Google Scholar]
- Cha A., Bezanilla F. Structural implications of fluorescence quenching in the Shaker K+ channel. J. Gen. Physiol. 1998;112:391–408. doi: 10.1085/jgp.112.4.391. [DOI] [PMC free article] [PubMed] [Google Scholar]
- Chapman M.L., VanDongen H.M.A., VanDongen A.M.J. Activation-dependent subconductance levels in the drk1 K channel suggest a subunit basis for ion permeation and gating. Biophys. J. 1997;72:708–719. doi: 10.1016/s0006-3495(97)78707-1. [DOI] [PMC free article] [PubMed] [Google Scholar]
- Goldstein S.A.N. A structural vignette common to voltage sensors and conduction porescanaliculi. Neuron. 1996;16:717–722. doi: 10.1016/s0896-6273(00)80092-6. [DOI] [PubMed] [Google Scholar]
- Hendsch Z.S., Tidor B. Do salt bridges stabilize proteins? A continuum electrostatic analysis. Prot. Sci. 1994;3:211–226. doi: 10.1002/pro.5560030206. [DOI] [PMC free article] [PubMed] [Google Scholar]
- Hille B. Ionic Channels of Excitable Membranes 2nd ed 1992. Sinauer Associates Inc; Sunderland, MA: pp. 607 [Google Scholar]
- Holmgren M., Liu Y., Xu Y., Yellen G. On the use of thiol-modifying agents to determine channel topology. Neuropharmacology. 1996;35:797–804. doi: 10.1016/0028-3908(96)00129-3. [DOI] [PubMed] [Google Scholar]
- Horton R.M., Hunt H.D., Ho S.N., Pullen J.K., Pease L.R. Engineering hybrid genes without the use of restriction enzymesgene splicing by overlap extension. Gene. 1989;77:61–68. doi: 10.1016/0378-1119(89)90359-4. [DOI] [PubMed] [Google Scholar]
- Hoshi T., Zagotta W.N., Aldrich R.W. Biophysical and molecular mechanisms of Shaker potassium channel inactivation. Science. 1990;250:533–538. doi: 10.1126/science.2122519. [DOI] [PubMed] [Google Scholar]
- Hoshi T., Zagotta W.N., Aldrich R.W. Two types of inactivation in Shaker K+ channelseffects of alterations in the carboxy-terminal region. Neuron. 1991;7:547–556. doi: 10.1016/0896-6273(91)90367-9. [DOI] [PubMed] [Google Scholar]
- Kanevsky M., Aldrich R.W. Determinants of voltage-dependent gating and open-state stability in the S5 segment of Shaker potassium channels. J. Gen. Physiol. 1999;114:215–242. doi: 10.1085/jgp.114.2.215. [DOI] [PMC free article] [PubMed] [Google Scholar]
- Landt O., Grunert H.P., Hahn U. A general method for rapid site-directed mutagenesis using the polymerase chain reaction. Gene. 1990;96:125–128. doi: 10.1016/0378-1119(90)90351-q. [DOI] [PubMed] [Google Scholar]
- Larsson H.P., Baker O.S., Dhillon D.S., Isacoff E.Y. Transmembrane movement of the Shaker K+ channel S4. Neuron. 1996;16:387–397. doi: 10.1016/s0896-6273(00)80056-2. [DOI] [PubMed] [Google Scholar]
- Ledwell J.L., Aldrich R.W. Mutations in the S4 region isolate the final voltage-dependent cooperative step in potassium channel activation. J. Gen. Physiol. 1999;113:389–414. doi: 10.1085/jgp.113.3.389. [DOI] [PMC free article] [PubMed] [Google Scholar]
- Liu Y., Jurman M.E., Yellen G. Dynamic rearrangement of the outer mouth of a K+ channel during gating. Neuron. 1996;16:859–867. doi: 10.1016/s0896-6273(00)80106-3. [DOI] [PubMed] [Google Scholar]
- Lu T., Nguyen B., Zhang X., Yang J. Architecture of a K+ channel inner pore revealed by stoichiometric covalent modification. Neuron. 1999;22:571–580. doi: 10.1016/s0896-6273(00)80711-4. [DOI] [PubMed] [Google Scholar]
- Mannuzzu L.M., Moronne M.M., Isacoff E.Y. Direct physical measure of conformational rearrangement underlying potassium channel gating. Science. 1996;271:213–216. doi: 10.1126/science.271.5246.213. [DOI] [PubMed] [Google Scholar]
- McLaughlin J.T., Hawrot E., Yellen G. Covalent modification of engineered cysteines in the nicotinic acetylcholine receptor agonist-binding domain inhibits receptor activation. Biochem. J. 1995;310:765–769. doi: 10.1042/bj3100765. [DOI] [PMC free article] [PubMed] [Google Scholar]
- Miller A.G., Aldrich R.W. Conversion of a delayed rectifier K+ channel to a voltage-gated inward rectifier K+ channel by three amino acid substitutions. Neuron. 1996;16:853–858. doi: 10.1016/s0896-6273(00)80105-1. [DOI] [PubMed] [Google Scholar]
- Nagaya N., Papazian D.M. Potassium channel α and β subunits assemble in the endoplasmic reticulum. J. Biol. Chem. 1997;272:3022–3027. doi: 10.1074/jbc.272.5.3022. [DOI] [PubMed] [Google Scholar]
- Olcese R., Latorre R., Toro L., Bezanilla F., Stefani E. Correlation between charge movement and ionic current during slow inactivation in Shaker K+ channels. J. Gen. Physiol. 1997;110:579–589. doi: 10.1085/jgp.110.5.579. [DOI] [PMC free article] [PubMed] [Google Scholar]
- Oliveberg M., Fersht A.R. A new approach to the study of transient protein conformationsthe formation of a semiburied salt link in the folding pathway of barnase. Biochemistry. 1996;35:6795–6805. doi: 10.1021/bi9529317. [DOI] [PubMed] [Google Scholar]
- Papazian D.M., Bezanilla F. How does an ion channel sense voltage? News Physiol. Sci. 1997;12:203–210. [Google Scholar]
- Papazian D.M., Shao X.M., Seoh S.A., Mock A.F., Huang Y., Wainstock D.H. Electrostatic interactions of S4 voltage sensor in Shaker K+ channel. Neuron. 1995;14:1293–1301. doi: 10.1016/0896-6273(95)90276-7. [DOI] [PubMed] [Google Scholar]
- Perozo E., Santacruz-Toloza L., Stefani E., Bezanilla F., Papazian D.M. S4 mutations alter gating currents of Shaker K+ channels. Biophys. J. 1994;66:345–354. doi: 10.1016/s0006-3495(94)80783-0. [DOI] [PMC free article] [PubMed] [Google Scholar]
- Santacruz-Toloza L., Huang Y., John S.A., Papazian D.M. Glycosylation of Shaker potassium channel protein in insect cell culture and in Xenopus oocytes. Biochemistry. 1994;33:5607–5613. doi: 10.1021/bi00184a033. [DOI] [PubMed] [Google Scholar]
- Sarkar G., Sommer S.S. The “megaprimer” method of site-directed mutagenesis. Biotechniques. 1990;8:404–407. [PubMed] [Google Scholar]
- Schoppa N.E., Sigworth F.J. Activation of Shaker potassium channels. III. An activation gating model for wild-type and V2 mutant channels. J. Gen. Physiol. 1998;111:313–342. doi: 10.1085/jgp.111.2.313. [DOI] [PMC free article] [PubMed] [Google Scholar]
- Schulteis C.T., Nagaya N., Papazian D.M. Subunit folding and assembly steps are interspersed during Shaker potassium channel biogenesis. J. Biol. Chem. 1998;273:26210–26217. doi: 10.1074/jbc.273.40.26210. [DOI] [PubMed] [Google Scholar]
- Schulteis C.T., John S.A., Huang Y., Tang C.-Y., Papazian D.M. Conserved cysteine residues in the Shaker K+ channel are not linked by a disulfide bond. Biochemistry. 1995;34:1725–1733. doi: 10.1021/bi00005a029. [DOI] [PubMed] [Google Scholar]
- Schwarz T.L., Tempel B.L., Papazian D.M., Jan Y.N., Jan L.Y. Multiple potassium channel components are produced by alternative splicing at the Shaker locus in Drosophila . Nature. 1988;331:137–142. doi: 10.1038/331137a0. [DOI] [PubMed] [Google Scholar]
- Seoh S.-A., Sigg D., Papazian D.M., Bezanilla F. Voltage-sensing residues in the S2 and S4 segments of the Shaker K+ channel. Neuron. 1996;16:1159–1167. doi: 10.1016/s0896-6273(00)80142-7. [DOI] [PubMed] [Google Scholar]
- Sigg D., Stefani E., Bezanilla F. Gating current noise produced by elementary transitions in Shaker potassium channels. Science. 1994;264:578–582. doi: 10.1126/science.8160016. [DOI] [PubMed] [Google Scholar]
- Smith-Maxwell C.J., Ledwell J.L., Aldrich R.W. Uncharged S4 residues and cooperativity in voltage-dependent potassium channel activation. J. Gen. Physiol. 1998;111:421–439. doi: 10.1085/jgp.111.3.421. [DOI] [PMC free article] [PubMed] [Google Scholar]
- Starace D.M., Stefani E., Bezanilla F. Voltage-dependent proton transport by the voltage sensor of the Shaker K+ channel. Neuron. 1997;19:1319–1327. doi: 10.1016/s0896-6273(00)80422-5. [DOI] [PubMed] [Google Scholar]
- Starace D., Stefani E., Bezanilla F. Histidine scanning mutagenesis indicates full translocation of two charges of the Shaker K channel voltage sensor Biophys. J. 74 1998. A215(Abstr.) [Google Scholar]
- Starace D., Bezanilla F. Accessibility studies of Shaker K channel S4 residues by histidine-scanning mutagenesis Biophys. J. 74 1998. A254(Abstr.) [Google Scholar]
- Stauffer D.A., Karlin A. Electrostatic potential of the acetylcholine binding sites in the nicotinic receptor probed by reactions of binding site cysteines with charged methanethiosulfonates. Biochemistry. 1994;33:6840–6849. doi: 10.1021/bi00188a013. [DOI] [PubMed] [Google Scholar]
- Timpe L.C., Schwarz T.L., Tempel B.L., Papazian D.M., Jan Y.N., Jan L.Y. Expression of functional potassium channels from Shaker cDNA in Xenopus oocytes. Nature. 1988;331:143–145. doi: 10.1038/331143a0. [DOI] [PubMed] [Google Scholar]
- Tissot A.C., Vuilleumier S., Fersht A.R. Importance of two buried salt bridges in the stability and folding pathway of barnase. Biochemistry. 1996;35:6786–6794. doi: 10.1021/bi952930e. [DOI] [PubMed] [Google Scholar]
- Tiwari-Woodruff S.K., Schulteis C.T., Mock A.F., Papazian D.M. Electrostatic interactions between transmembrane segments mediate folding of Shaker K+ channel subunits. Biophys. J. 1997;72:1489–1500. doi: 10.1016/S0006-3495(97)78797-6. [DOI] [PMC free article] [PubMed] [Google Scholar]
- Yang N., George A.L., Horn R. Molecular basis of charge movement in voltage-gated sodium channels. Neuron. 1996;16:113–122. doi: 10.1016/s0896-6273(00)80028-8. [DOI] [PubMed] [Google Scholar]
- Yang Y., Yan Y., Sigworth F.J. How does the W434F mutation block current in Shaker potassium channels? J. Gen. Physiol. 1997;109:779–789. doi: 10.1085/jgp.109.6.779. [DOI] [PMC free article] [PubMed] [Google Scholar]
- Zagotta W.N., Hoshi T., Aldrich R.W. Shaker potassium channel gating. IIIEvaluation of kinetic models for activation. J. Gen. Physiol. 1994;103:321–362. doi: 10.1085/jgp.103.2.321. [DOI] [PMC free article] [PubMed] [Google Scholar]
- Zheng J., Sigworth F.J. Selectivity changes during activation of mutant Shaker potassium channels. J. Gen. Physiol. 1997;110:101–117. doi: 10.1085/jgp.110.2.101. [DOI] [PMC free article] [PubMed] [Google Scholar]
- Zheng J., Sigworth F.J. Intermediate conductances during deactivation of heteromultimeric Shaker potassium channels. J. Gen. Physiol. 1998;112:457–474. doi: 10.1085/jgp.112.4.457. [DOI] [PMC free article] [PubMed] [Google Scholar]