

Abstract
We studied how mitochondrial Ca2+ transport influences [Ca2+]i dynamics in sympathetic neurons. Cells were treated with thapsigargin to inhibit Ca2+ accumulation by SERCA pumps and depolarized to elevate [Ca2+]i; the recovery that followed repolarization was then examined. The total Ca2+ flux responsible for the [Ca2+]i recovery was separated into mitochondrial and nonmitochondrial components based on sensitivity to the proton ionophore FCCP, a selective inhibitor of mitochondrial Ca2+ transport in these cells. The nonmitochondrial flux, representing net Ca2+ extrusion across the plasma membrane, has a simple dependence on [Ca2+]i, while the net mitochondrial flux (Jmito) is biphasic, indicative of Ca2+ accumulation during the initial phase of recovery when [Ca2+]i is high, and net Ca2+ release during later phases of recovery. During each phase, mitochondrial Ca2+ transport has distinct effects on recovery kinetics. Jmito was separated into components representing mitochondrial Ca2+ uptake and release based on sensitivity to the specific mitochondrial Na+/Ca2+ exchange inhibitor, CGP 37157 (CGP). The CGP-resistant (uptake) component of Jmito increases steeply with [Ca2+]i, as expected for transport by the mitochondrial uniporter. The CGP-sensitive (release) component is inhibited by lowering the intracellular Na+ concentration and depends on both intra- and extramitochondrial Ca2+ concentration, as expected for the Na+/Ca2+ exchanger. Above ∼400 nM [Ca2+]i, net mitochondrial Ca2+ transport is dominated by uptake and is largely insensitive to CGP. When [Ca2+]i is ∼200–300 nM, the net mitochondrial flux is small but represents the sum of much larger uptake and release fluxes that largely cancel. Thus, mitochondrial Ca2+ transport occurs in situ at much lower concentrations than previously thought, and may provide a mechanism for quantitative control of ATP production after brief or low frequency stimuli that raise [Ca2+]i to levels below ∼500 nM.
Keywords: mitochondria, calcium, calcium signaling, neurons, CGP 37157
INTRODUCTION
There is a growing interest in mitochondrial Ca2+ transport. Ca2+ uptake and release by these organelles is thought to influence the dynamics of cytosolic free Ca2+ concentration ([Ca2+]i) in a variety of cell types after stimuli that promote either Ca2+ entry from the extracellular medium or release from intracellular stores (for reviews see Miller 1991, Miller 1998; Babcock and Hille 1998; Duchen 1999). Modulation of [Ca2+]i dynamics by mitochondria may be a key factor in some forms of Ca2+ signaling (Hajnoczky et al. 1995; Budd and Nicholls 1996; Hoth et al. 1997; Tang and Zucker 1997; David et al. 1998). Moreover, changes in intramitochondrial free Ca2+ concentration ([Ca2+]m) that occur as a result of stimulation are thought to regulate ATP synthesis in anticipation of cellular energy demands (McCormack and Denton 1993; Robb-Gaspers et al. 1998).
Mitochondrial Ca2+ transport has been studied extensively in isolated mitochondria. Ca2+ uptake is controlled by a Ca2+-sensitive uniporter (EC50 ∼10–20 μΜ; Gunter and Gunter 1994) that permits Ca2+ to flow into the matrix down its steep electrochemical gradient. Ca2+ release from neuronal mitochondria is regulated primarily by a Na+/Ca2+ exchanger (Gunter and Pfeiffer 1990) that is distinct from the plasma membrane exchanger found in many excitable cells (Crompton et al. 1978; Cox and Matlib 1993). Overall, the magnitude and direction of net mitochondrial Ca2+ transport depends on the relative rates of Ca2+ uptake and release. When the extramitochondrial Ca2+ concentration is high, the rate of Ca2+ uptake via the uniporter greatly exceeds the maximal rate of Ca2+ release via the Na+/Ca2+ exchanger (Gunter and Pfeiffer 1990), resulting in strong net mitochondrial Ca2+ accumulation. In contrast, at lower Ca2+ concentrations, where activity of the uniporter is far below its maximum, the net mitochondrial flux should depend on the relative rates of uptake and release.
Despite the importance of mitochondrial Ca2+ uptake and release pathways in defining the rate of net mitochondrial Ca2+ transport, their individual contributions to [Ca2+]i dynamics in situ have not been determined, in part because they operate within an intracellular network of coupled transporters that makes contributions from individual transport systems difficult to resolve. Pharmacological agents have been useful in identifying mitochondrial contributions to depolarization-evoked [Ca2+]i responses in intact cells. Proton ionophores, such as FCCP, depolarize the inner membrane and reduce the electrochemical driving force for Ca2+ uptake, suppressing mitochondrial Ca2+ accumulation. Inhibitors of the uniporter, such as ruthenium red or its active component Ru360 (Matlib et al. 1998), directly block Ca2+ uptake. However, because inhibition of Ca2+ uptake precludes subsequent Ca2+ release, neither approach is suited for discriminating between mitochondrial Ca2+ uptake and release fluxes and their interplay in situ.
We sought to characterize the Ca2+ transport systems that restore resting [Ca2+]i after depolarization-induced [Ca2+]i elevations in sympathetic neurons. These cells respond to depolarization with a rise in [Ca2+]i that is initiated by Ca2+ entry through voltage-gated Ca2+ channels but is strongly influenced by mitochondrial Ca2+ transport (Friel and Tsien 1994; Pivovarova et al. 1999). The net cytosolic Ca2+ flux was determined by measuring the rate at which [Ca2+]i declines after repolarization, and the mitochondrial and nonmitochondrial components of this flux were distinguished based on sensitivity to FCCP; cells were pretreated with thapsigargin to minimize contributions from ER Ca2+ transport. Separation of the net mitochondrial flux into uptake and release components was accomplished with CGP 37157 (CGP), a specific inhibitor of the mitochondrial Na+/Ca2+ exchanger (Chiesi et al. 1988; Cox et al. 1993). It was found that the activity of each Ca2+ transport pathway depends on Ca2+ concentration in a distinctive manner. At high [Ca2+]i, mitochondrial Ca2+ transport is dominated by the uptake pathway and is largely insensitive to CGP. However, mitochondrial Ca2+ transport also occurs at [Ca2+]i levels as low as 200–300 nM; under these conditions, the net mitochondrial flux is the sum of much larger uptake and release fluxes of similar magnitude that largely cancel. Some of these results have been presented in abstract form (Colegrove and Friel 1998).
MATERIALS AND METHODS
Cell Dissociation and Culture
All procedures conform with guidelines established by our Institutional Animal Care and Use Committee. Sympathetic neurons were obtained as described previously (Friel and Tsien 1992). Adult male bullfrogs (Rana catesbeiana) were killed by decapitation and pithing, after which the sympathetic chains were removed and de-sheathed. The chains were incubated for 40 min at 35°C in nominally Ca-free Ringer's solution containing 3 mg/ml collagenase (Worthington, Type I) and for 10 min in Ringer's supplemented with 1.5 mg/ml trypsin (EC 3.4.21.4, Sigma). Ringer's consisted of (in mM): 128 NaCl, 2 KCl, 10 HEPES (N-[2-Hydroxyethyl]piperazine-N′-[2-ethanesulfonic acid]), 10 glucose, pH 7.3, with NaOH. Normal Ringer's contained 2 mM added CaCl2, while low Ca2+ Ringer's contained nominally Ca-free Ringer's + 0.2 mM EGTA (ethylene glycol-bis(β-aminoethyl ether) N,N,N′,N′-tetraacetic acid). The ganglia were washed, and cells were dispersed by trituration and plated onto poly-d-lysine–coated cover slips affixed with Sylgard (Dow Corning) to 60-mm culture dishes, covering 20-mm-diam holes in the bottom of the dishes. Cells were cultured for up to 1 wk at room temperature (19–22°C) in a 1:1 mixture of Liebovitz's L-15 medium (GIBCO BRL) and normal Ringer's solution supplemented with glucose (3 μg/ml), ascorbic acid (25 μg/ml), glutathione (2.5 μg/ml), and 6,7-dimethyl-5,6,7,8-tetra-hydropterine, HCl (0.25 μg/ml; Calbiochem).
Cytosolic Calcium Measurements
Cells were incubated with 3 μM fura-2 AM (Molecular Probes) for 40 min at room temperature with gentle agitation. Fura-2 AM was dispensed from a 1-mM stock solution in DMSO containing 25% (wt/wt) pluronic F127 (BASF Corporation) that was stored at −20°C. Cells were rinsed and recordings began after ∼20 min to facilitate de-esterification of the Ca2+ indicator. Cells were placed on the stage of an inverted microscope (Nikon Diaphot TMD) and superfused continuously (∼5 ml/min) with normal Ringer's. Solution changes (∼200 ms) were made using a system of microcapillaries (Drummond microcaps, 20 μl) mounted on a micromanipulator as described in Friel and Tsien 1992.
Cells were illuminated by light from a 150 W Xenon lamp that passed through excitation filters (350 ± 5 nm, 380 ± 5 nm) mounted on a filter wheel rotating at 40–100 Hz and was focused with a 40×objective (NA 1.3; Nikon, Fluor). Emitted light passed through a long-pass dichroic mirror (400 nm) and an emission filter (510 ± 10 nm) and was detected by a photomultiplier tube (Thorn EMI 9124). A spectrophotometer (Cairn Research Limited) was used to control the filter wheel and measure fluorescence intensity at the two excitation wavelengths. Fluorescence measurements were made at 4–5 Hz and saved on a laboratory computer. [Ca2+]i was calculated according to the method of Grynkiewicz et al. 1985 as described previously (Friel and Tsien 1992).
Voltage Clamp
Simultaneous measurements of depolarization-evoked [Ca2+]i elevations and voltage-sensitive Ca2+ currents (ICa) were made under voltage clamp in fura-2 AM loaded cells using the perforated patch technique. Patch electrodes (1–2 MΩ) were pulled (Sutter Instruments P-97), and tips were filled with a solution containing (in mM): 125 CsCl, 5 MgCl2, 10 HEPES, and 0–10 mM Na+ (with reciprocal changes in Cs+), pH 7.3, with CsOH. After filling tips, pipettes were back-filled with the same solution supplemented with 520 μM amphotericin B, dispensed from concentrated aliquots (12 mg/100 μl DMSO). Amphotericin B–containing internal solutions were kept on ice and used within 2 h. After achieving a high resistance seal, series resistance declined over 5–10 min to <10 MΩ. Cells were exposed to an extracellular solution containing (in mM): 130 TEACl, 10 HEPES, 10 glucose, 2 CaCl2, 1 MgCl2, pH = 7.3, with TEAOH. Currents were measured with an Axopatch 200A voltage clamp (Axon Instruments) using series resistance compensation (∼90%) and were filtered at 5 kHz. Cells were held at −70 mV and depolarized to voltages between −15 and 0 mV, while current and fluorescence intensity were measured at 0.1–5 kHz just before and 0.2–10 s after changes in voltage, and at 4–5 Hz otherwise, and saved on a laboratory computer. Currents were corrected for a linear leak based on responses to small hyperpolarizing voltage steps. [Ca2+]i elevations evoked under voltage clamp were somewhat larger than those elicited by high K+ at comparable membrane potentials, presumably because of more rapid depolarization and more efficient Ca2+ channel activation under voltage clamp. However, the kinetics of the [Ca2+]i recovery after repolarization were similar for the two techniques, provided that pipette solutions contained mM levels of Na+.
Measurement of Ca2+ Fluxes
To study the Ca2+ transport systems that restore [Ca2+]i to its resting level after depolarization-evoked Ca2+ entry, cells were depolarized either by exposure to high K+ Ringer's (equimolar substitution for Na+) or under voltage clamp, and the [Ca2+]i recovery that followed repolarization was examined. Cells were treated with 200–500 nM thapsigargin (Tg) for 10–20 min before beginning measurements to inhibit SERCA pump activity and minimize Ca2+ accumulation by the endoplasmic reticulum. Such treatments rendered cells completely insensitive to other SERCA pump inhibitors, including CPA (50 μM) and BHQ (10 μM), and to caffeine (1–10 mM), each of which consistently elicited [Ca2+]i transients in cells that had not been treated with Tg.
Cells typically responded to high K+ depolarization with [Ca2+]i responses that were quite reproducible, making it possible to compare, in single cells, responses elicited under several different conditions. Under voltage clamp, intracellular ion concentrations could be manipulated and Ca2+ fluxes could be measured over a wider range of [Ca2+]i, but after depolarizations in the presence of FCCP, [Ca2+]i recovered to values that were ∼50–100 nM higher than those measured in the presence of FCCP before depolarization. The reason for this increase is not clear, but it is consistent with the development of a small Ca2+ leak (∼5 nM/s), which would introduce a small error in the measured FCCP-sensitive component of the total flux, leading to a slight overestimation of this flux (∼5% at 500 nM [Ca2+]i).
The net cytosolic Ca2+ flux per unit volume during the recovery (J, units: nM/s) was calculated as the time derivative of [Ca2+]i at each intermediate sample time ti according to ([Ca2+]i(ti + Δt/2) − [Ca2+]i(ti − Δt/2))/Δt, where Δt (400–500 ms) is twice the sampling interval. For the first and last sample points, the flux was estimated by computing the slope of a fitted line over the first and last sets of three sample points, respectively, or by fitting an exponential over 4Δt and calculating the slope of the fitted exponential at the endpoints. The total Ca2+ flux during the recovery (Jcont) was separated into mitochondrial and nonmitochondrial components based on their differing sensitivities to FCCP. The net mitochondrial flux was determined by taking the difference between the total cytosolic Ca2+ flux in the presence and absence of FCCP at corresponding values of [Ca2+]i. The net mitochondrial Ca2+ flux was then separated into components based on sensitivity to CGP and intracellular Na+. This approach is described and validated in Results. Data were acquired at discrete times so that flux measurements in the presence and absence of an inhibitor were not always made at identical values of [Ca2+]i. Therefore, linear interpolation was used to approximate each measured flux at equally spaced values of [Ca2+]i. Before calculating difference fluxes, the measured fluxes were smoothed 1–3 times with a binomial filter that replaced each intermediate flux value Ji with a weighted average of Ji and its nearest neighbors (Ji−1 + 2Ji + Ji+1)/4.
Data Analysis
Quantifying the plateau level during the [Ca2+]i recovery.
The plateau level was defined as the value of [Ca2+]i where the first inflection point occurs during the recovery. It was measured by fitting a 9–12th order polynomial to the [Ca2+]i recovery and determining where the second derivative of the fitted curve changed sign. This provided a suitable way to quantify the plateau level and its sensitivity to CGP. At high concentrations of CGP, an inflection point was sometimes difficult to resolve, so in these cases the plateau level was defined as the value of [Ca2+]i where the second derivative fell below 0.001 nM/s2.
Statistics.
Population results are expressed as mean ± SEM and statistical significance was assessed using Student's t test (Hoel 1971).
Drugs
CGP 37157 was a kind gift from Anna Suter (Novartis). Purified ruthenium red was generously provided by Dr. M. A. Matlib. Unless indicated otherwise, all other compounds were obtained from Sigma Chemical Co.
RESULTS
Mitochondrial and Nonmitochondrial Components of the Total Ca2+ Flux
Fig. 1 compares [Ca2+]i responses elicited by weak and strong depolarization in an intact fura-2–loaded sympathetic neuron that was pretreated with Tg to inhibit ER Ca2+ accumulation by SERCA pumps. Exposure to a solution containing 30 mM K+, which depolarizes Vm from a typical resting potential of −69.9 ± 2.5 mV to ∼−35 mV (Friel and Tsien 1992), increases [Ca2+]i from its resting level to ∼300 nM (Fig. 1 A, left). After restoring [K+]o to 2 mM, which rapidly repolarizes Vm (Friel and Tsien 1992), [Ca2+]i declines with a nearly exponential time course (see fitted curve). During a stronger depolarization (50 mM K+, which depolarizes Vm to −21 ± 1.5), [Ca2+]i rises to a higher level approaching ∼500 nM, and the recovery that follows repolarization is kinetically complex, consisting of four distinct phases (Fig. 1 A, middle): an initial rapid decline (i), a plateau (ii), an accelerated decline (iii), and a final slow approach to the prestimulation level (iv). Similar complex response kinetics are observed when [Ca2+]i is elevated by other means, including trains of stimulated action potentials (Friel and Tsien 1994) and depolarization under voltage clamp (see below) and have been observed in a variety of other excitable cells (e.g., Thayer and Miller 1990; Herrington et al. 1996; McGeown et al. 1996).
Figure 1.

Comparison between [Ca2+]i responses evoked by weak and strong depolarization. (A) [Ca2+]i responses elicited by 30 mM K+ (left) and 50 mM K+ before (middle) and during (right) maintained exposure to 1 μM FCCP. Solid curve during the recovery after weak depolarization represents a single exponential (in nM): 35.5 + 242exp(−t/31.3 s). Cell sc0c45. (B) Plots of the total Ca2+ flux (J = −d[Ca2+]i /dt) vs [Ca2+]i for each recovery in A, showing the [Ca2+]i dependence of Ca2+ removal rate. After small [Ca2+]i elevations, recoveries are nearly exponential (linear in the J/[Ca2+]i plot, dashed line), while recoveries after larger [Ca2+]i elevations have two additional components: an outward flux at high [Ca2+]i and an inward flux at lower [Ca2+]i. In the presence of FCCP, the rate of Ca2+ removal is nearly proportional to [Ca2+]i over the majority of the [Ca2+]i range, much like the recovery after weak depolarization, but becomes limited at high [Ca2+]i.
Four observations indicate that mitochondria play a role in shaping [Ca2+]i responses elicited by strong depolarization in these cells. First, the responses are greatly modified if cells are stimulated during maintained exposure to the proton ionophore carbonyl cyanide p-(trifluoromethoxy) phenylhydrazone (FCCP, 1 μM; Fig. 1 A, right). In this case, [Ca2+]i rises to a higher level during stimulation, and the ensuing recovery lacks both the initial rapid decline and the slow plateau phase (30 cells). Similar modifications are observed after treatment with antimycin A1 and oligomycin (see below), and after microinjection of ruthenium red (not shown). Second, rapid exposure to FCCP (10 μM) in Ca2+-free Ringer's elicits a large [Ca2+]i transient during the plateau phase of the recovery, but not in the same cells after [Ca2+]i returns to basal levels, arguing that depolarization reversibly increases the Ca2+ content of an FCCP-releasable Ca2+ store. Third, FCCP has little or no effect on resting [Ca2+]i or on responses to weak depolarization which raise [Ca2+]i to ∼300 nM or below (Friel and Tsien 1994), indicating that the effectiveness of FCCP increases with [Ca2+]i, as expected if it suppresses Ca2+ uptake by the mitochondrial uniporter. Finally, direct measurement of total mitochondrial Ca2+ concentration ([Ca]m) in these cells using electron probe microanalysis indicates that exposure to 50 mM K+ reversibly elevates [Ca]m in an FCCP-inhibitable manner, and that the recovery parallels the decline in [Ca2+]i (Pivovarova et al. 1999), leaving little doubt that the FCCP-sensitive store is mitochondrial. Ca2+ accumulation by mitochondria at high [Ca2+]i would slow the rise in [Ca2+]i during depolarization and speed the initial decline after repolarization; subsequent net mitochondrial Ca2+ release would slow the recovery, contributing to the plateau.
To illustrate mitochondrial and nonmitochondrial contributions to the complex [Ca2+]i recovery, Fig. 1 B plots the total cytosolic Ca2+ flux (J = −d[Ca2+]i/dt) vs [Ca2+]i for each of the three recoveries in A, (positive values of J represent outward fluxes from the cytosol). In each case, J is positive, indicating that Ca2+ removal is dominant, but there is a striking difference between the recoveries that follow small and large depolarization-evoked [Ca2+]i elevations. After weak depolarization (Fig. 1 B, left), J is nearly proportional to [Ca2+]i below ∼300 nM, as expected if Ca2+ is removed from the cytosol by a simple first order process. In contrast, after stronger depolarizations that elevate [Ca2+]i to higher levels (Fig. 1 B, middle), J varies with [Ca2+]i in a complex manner that mirrors the temporal complexity of the recovery (Fig. 1 A, middle). During phase i, when [Ca2+]i is high, J is much larger than the extrapolated linear flux (Fig. 1 B, dashed line), but then declines so that over the range of [Ca2+]i associated with the plateau (phase ii), it is smaller than the linear flux. J then rises during phase (iii), approaching and ultimately coinciding with the linear flux as [Ca2+]i nears its prestimulation level (phase iv). Fig. 1 B (right) shows J during the recovery after 50 K+ depolarization in the presence of FCCP. For [Ca2+]i up to ∼300 nM, the FCCP-resistant flux (JFCCP-res) closely resembles the linear flux that restores [Ca2+]i to its resting level after weak depolarization (dashed line). However, at higher [Ca2+]i, JFCCP-res is smaller than the extrapolated linear flux, indicating that Ca2+ removal by the underlying transporters becomes limited when [Ca2+]i is high, or that a source of Ca2+ is active just after repolarization (see also Herrington et al. 1996; Fig. 3B and Fig. C). Treatment with oligomycin did not modify the effects of FCCP, arguing that ATP consumption via reverse mode ATP synthase activity does not seriously deplete ATP during treatment with FCCP in these experiments (not shown).
Figure 3.
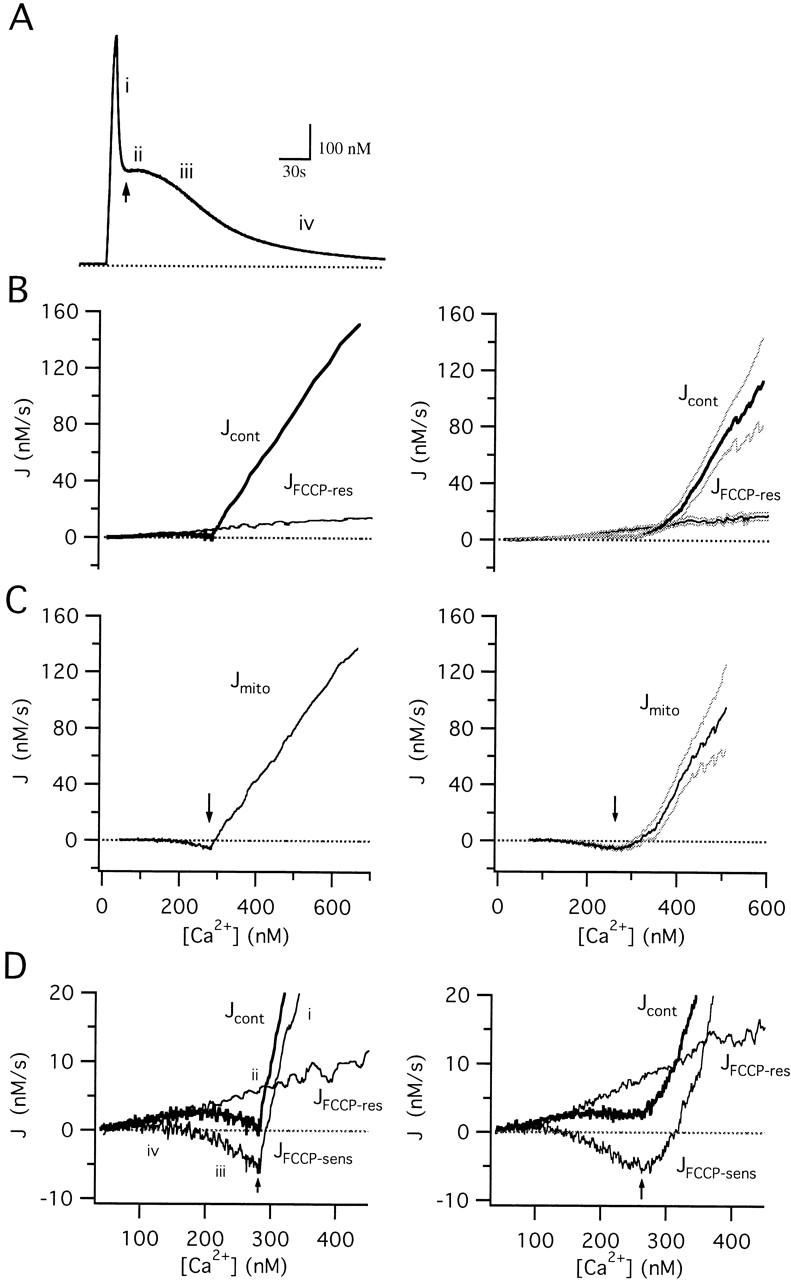
Separation of the total Ca2+ flux during the recovery into mitochondrial and nonmitochondrial components. (A) [Ca2+]i response elicited by exposure to 50 mM K+, illustrating the four phases of recovery (i–iv). Arrow indicates the [Ca2+]i plateau. Cell sc0c73. (B) [Ca2+]i dependence of the total Ca2+ flux (Jcont, thick trace) obtained by calculating −d[Ca2+]i/dt during the recovery in A and plotting against [Ca2+]i. The FCCP-resistant component of Jcont (JFCCP-res, thin trace) was determined in the same cell during exposure to FCCP (1 μM). Average fluxes from 10 cells are shown at right (± SEM indicated by light traces). (C) Jmito, calculated by subtracting JFCCP-res from Jcont at corresponding values of [Ca2+]i for the single cell (left) and collected results (right). Arrows indicate the [Ca2+]i plateau level. (D) Comparison between Jcont (thick trace) and its component fluxes Jmito and JFCCP-res (thin traces) on an expanded scale, showing that, while Jcont is small during the plateau phase, it is the sum of much larger component fluxes of opposite sign that have similar magnitudes. Right panel shows collected results.
A simple interpretation of the complex [Ca2+]i recovery after large [Ca2+]i elevations is that the underlying Ca2+ flux consists of two components. One component represents Ca2+ removal by nonmitochondrial transporters at a rate that increases saturably with [Ca2+]i, while the other component represents reversible net Ca2+ transport by mitochondria: net Ca2+ accumulation at high [Ca2+]i followed by net Ca2+ release at low [Ca2+]i. An obvious approach to separating J into mitochondrial and nonmitochondrial components is to take the difference between J in the presence and absence of FCCP at corresponding values of [Ca2+]i to give the FCCP-sensitive flux (JFCCP-sens). This method has been used in previous studies (e.g., Herrington et al. 1996; Fierro et al. 1998), but the conditions under which it is valid have not been examined in detail. In the next section, these conditions are described and evaluated, permitting the separation of J into its mitochondrial and nonmitochondrial components.
Properties of the FCCP-resistant component of the total Ca2+ flux.
Fig. 1 B (right) illustrates the [Ca2+]i dependence of the FCCP-resistant flux (JFCCP-res). Since this flux is seen under conditions where Ca2+ transport by both mitochondria and the endoplasmic reticulum should be largely inhibited, it presumably represents the parallel combination of plasma membrane Ca2+ extrusion and a background leak. The net mitochondrial Ca2+ flux can be determined from the control flux by subtracting JFCCP-res at corresponding values of [Ca2+]i if: (a) FCCP specifically and completely inhibits net mitochondrial Ca2+ transport, and (b) the rate of nonmitochondrial Ca2+ transport at each instant in time depends only on [Ca2+]i at that time. If these conditions are satisfied, JFCCP-res gives the contribution of nonmitochondrial Ca2+ transport to the control flux. Moreover, at each time during the recovery, the control flux is the sum of the net mitochondrial flux and JFCCP-res at the corresponding value of [Ca2+]i, making it possible to calculate Jmito by subtracting JFCCP-res from Jcont.
To test for specificity of FCCP, cells were treated with antimycin A1 and oligomycin as an independent way to inhibit mitochondrial Ca2+ transport, and then depolarized both in the presence and absence of 1 μM FCCP. If FCCP directly influences nonmitochondrial Ca2+ transport, it should modify the recovery in cells treated with antimycin A1 and oligomycin. Fig. 2 A compares recoveries in a cell that was treated with antimycin A1 and oligomycin and then depolarized in the presence (left) and absence of FCCP (middle). FCCP has little or no effect on the recovery kinetics, which can be seen more clearly by superimposing the recoveries (right). To assess potential nonmitochondrial effects of FCCP quantitatively, recoveries in the presence and absence of FCCP were fit with two decaying exponentials and the parameters of the fitted curves were compared. FCCP did not influence any of the parameters (five cells, data not shown). Therefore, FCCP (1 μM) does not influence antimycin/oligomycin-resistant Ca2+ transport, arguing that it specifically inhibits mitochondrial Ca2+ transport in these cells.
Figure 2.
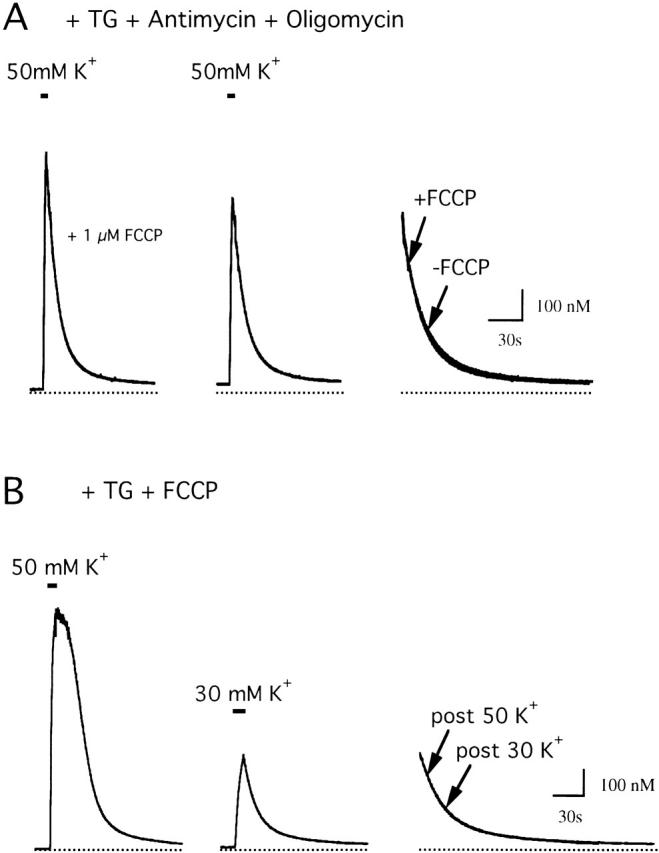
Characterization of the FCCP-resistant flux. (A) FCCP has little effect after inhibition of mitochondrial Ca2+ transport. [Ca2+]i responses were evoked by depolarization in the presence of antimycin A1 (1 μM), oligomycin (1 μg/ml), and 1 μM FCCP (left), and then after washing out FCCP (center). FCCP did not alter the kinetics of the recovery, as shown by superimposing the recoveries on an expanded time scale (right). Cell sc0d79. (B) JFCCP-res is defined by [Ca2+]i at each time during the recovery. Responses to 50 mM K+ (left) and 30 mM K+ (center) elicited in the presence of 1 μM FCCP. Although the recoveries follow very different [Ca2+]i histories, they are essentially identical over the common range of [Ca2+]i; superimposed recoveries are shown on an expanded time scale (right). Cell sc0c67.
To determine if JFCCP-res is influenced by long lasting effects of the [Ca2+]i elevation that precedes the recovery, responses to strong and weak depolarization were elicited in the continued presence of 1 μM FCCP and the recoveries were compared (Fig. 2 B). Despite following [Ca2+]i elevations of very different magnitude and time course, the recoveries were essentially identical over the common range of [Ca2+]i (see superimposed traces, Fig. 2 B). To examine the impact of prior [Ca2+]i elevations on recovery kinetics quantitatively, recoveries after weak and strong depolarization were fit over the common range of [Ca2+]i with the sum of two decaying exponentials and the parameters of the fitted curves were compared, which indicated that the recoveries were indistinguishable (four cells, data not shown). This shows that at each time during the recovery, the rate of Ca2+ removal by FCCP-resistant transporters depends on [Ca2+]i at that time but not on the history of [Ca2+]i (or membrane potential). Thus, given an initial value of [Ca2+]i, the time course of the [Ca2+]i recovery is determined. These results also indicate that inhibition of mitochondrial Ca2+ transport by FCCP is nearly complete at 1 μM: otherwise, the recovery after strong depolarization would be slower than that after weak depolarization.
It is concluded that JFCCP-res represents the activity of nonmitochondrial Ca2+ transport systems that restore resting [Ca2+]i after depolarization. Collectively, these transporters generate an outward net Ca2+ flux whose magnitude at each instant in time is defined by [Ca2+]i at that time. Therefore, the FCCP-sensitive flux, which will be referred to below as the net mitochondrial Ca2+ flux (Jmito), can be calculated from the control flux (Jcont) by subtracting JFCCP-res at corresponding values of [Ca2+]i.
Properties of the mitochondrial Ca2+ flux.
Fig. 3 compares mitochondrial and nonmitochondrial components of Jcont during the recovery after a 9 s 50 K+ depolarization from a representative cell (left column) along with collected results from 10 cells (right column). The measured fluxes (Jcont, JFCCP-res) are shown in Fig. 3 B, while the difference flux (Jmito) is shown in (C). Jmito is large and outward at high [Ca2+]i but small and inward when [Ca2+]i is low (see Fig. 3 D). The properties of JFCCP-res and Jmito provide an explanation of the four phases of recovery after strong depolarization (see Fig. 3A and Fig. D). During phase i, Jmito is large and outward, indicative of strong mitochondrial Ca2+ accumulation over this [Ca2+]i range, and is largely responsible for the rapid decline in [Ca2+]i. As [Ca2+]i declines, Jmito falls, changing sign to become a small but prolonged inward flux over the [Ca2+]i range associated with the plateau (Fig. 3 A, phase ii, see arrow). During this phase, Jmito and JFCCP-res have opposite signs but nearly equal magnitudes (D), accounting for the small magnitude of Jcont and the slow rate of recovery. Since Jmito decays with [Ca2+]i more rapidly than JFCCP-res (Fig. 3 D), Jcont rises, accounting for the accelerated recovery during phase iii. Finally, as Jmito approaches zero, Jcont is dominated by nonmitochondrial Ca2+ removal systems that define the slow final phase of recovery (phase iv). Note that while Jmito is plotted against [Ca2+]i, it may also depend on other quantities that change during the recovery, such as the intramitochondrial Ca concentration (see below). However, since the flux subtraction used to measure Jmito requires only that the nonmitochondrial flux is defined by [Ca2+]i, it is valid even if Jmito depends on variables other than [Ca2+]i.
Two main conclusions can be drawn from these results. First, mitochondrial Ca2+ accumulation provides the major mechanism for cytosolic Ca2+ clearance when [Ca2+]i is high, in general agreement with the findings of Herrington et al. 1996 and Xu et al. 1997 in adrenal chromaffin cells. Second, net mitochondrial Ca2+ transport occurs at [Ca2+]i levels as low as 200 nM but at a rate that is comparable to nonmitochondrial Ca2+ transport. Under these conditions, it is the relative rate of mitochondrial and nonmitochondrial transport that is critical in determining the total Ca2+ flux.
Separation of the Net Mitochondrial Ca2+ Flux into Uptake and Release Components
Effects of the mitochondrial Na+/Ca2+ exchange inhibitor CGP 37157.
To understand how mitochondrial Ca2+ transport contributes to Ca dynamics, it is necessary to separate Jmito into its components. Neuronal mitochondria accumulate Ca2+ via a uniporter and release Ca2+ via a Na+/Ca2+ exchanger (Gunter and Pfeiffer 1990). The benzothiazepine CGP 37157 (CGP) selectively inhibits Na+-dependent mitochondrial Ca2+ release from isolated cardiac mitochondria with an IC50 in the range ∼360–800 nM (Cox et al. 1993; Chiesi et al. 1988). Therefore, actions of this compound on depolarization-evoked [Ca2+]i responses were examined. Fig. 4 A illustrates effects of CGP on [Ca2+]i responses elicited by 50 mM K+. CGP did not detectably modify the rise in [Ca2+]i during depolarization or the rapid [Ca2+]i decline that immediately followed repolarization, but it almost completely suppressed the [Ca2+]i plateau (A, see superimposed traces at right), consistent with the idea that mitochondrial Ca2+ release via the Na+/Ca2+ exchanger contributes to the slow [Ca2+]i decline during this phase of the recovery. Similar effects of CGP on the plateau have been seen in other cells (Babcock et al. 1997; White and Reynolds 1997; Baron and Thayer 1997). Reproducible effects were observed after 2–3-min incubations with 2 μM CGP and were largely reversed within ∼10 min of washout.
Figure 4.

Effects of CGP on depolarization-evoked [Ca2+]i responses. (A) Control response to 50 mM K+ depolarization followed by a response elicited in the presence of CGP (2 μM). Responses are superimposed (right) showing that CGP essentially abolishes the [Ca2+]i plateau. Cell sc0b83. (B) Concentration dependence of CGP effects, showing superposition of two control responses elicited by high K+ before exposure to CGP (cont 1 and cont 2) along with two responses elicited during exposure to CGP at 0.2 and 0.6 μM, showing a progressive reduction of the plateau level (indicated by crosses) and prolongation of the recovery. (C) Summary of the effects of CGP on the plateau level. Ordinate shows ratio of the plateau level in the presence and absence of CGP measured in the same cells at different CGP concentrations. Smooth curve shows a single binding site model with IC50 = 560 nM. Data represent collected results from 28 cells.
If CGP completely inhibits mitochondrial Ca2+ release, it might be expected to enhance mitochondrial Ca2+ accumulation when [Ca2+]i is high enough to activate the uniporter, slowing the rise in [Ca2+]i during stimulation and speeding the initial phase of recovery after repolarization. This was not observed, arguing that when [Ca2+]i is high, net mitochondrial Ca2+ transport is dominated by the uptake pathway. The slow [Ca2+]i tail observed during the recovery in the presence of CGP may represent residual mitochondrial Ca2+ release due to incomplete block of the Na+/Ca2+ exchanger or release by a CGP-insensitive pathway. The observation that the slow tail is not seen at higher CGP concentrations (see Fig. 6 C) support the former explanation.
Figure 6.
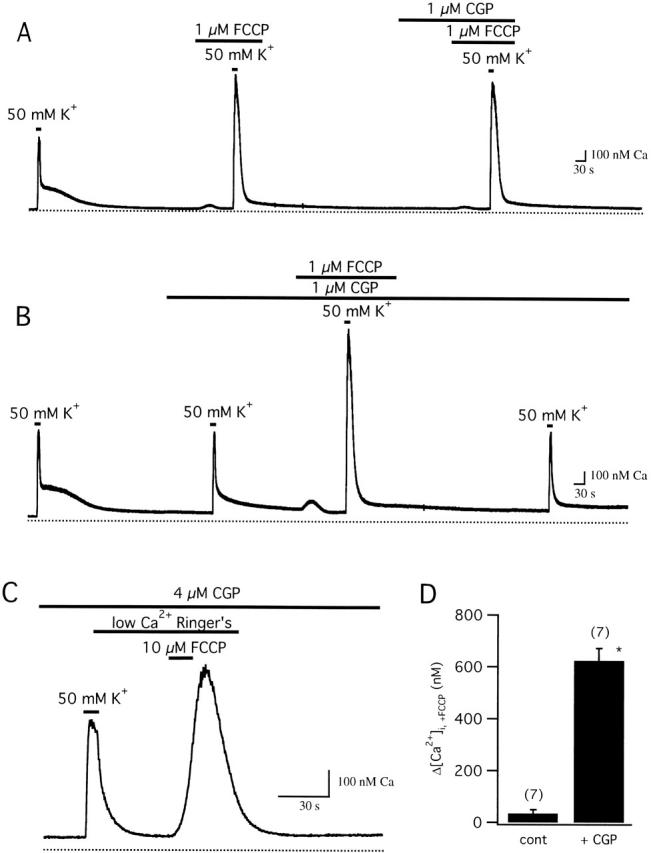
Relationship between FCCP- and CGP-sensitive targets. (A) FCCP occludes the actions of CGP. Cell was depolarized (50 mM K+) before (first response) and during exposure to 1 μM FCCP (second response) and then in the combined presence of FCCP and CGP (last response). CGP had little or no effect when applied during exposure to FCCP. Cell sc0c90. (B) CGP does not occlude the actions of FCCP. Cell was depolarized before (first response) and during exposure to 1 μM CGP (second response), which nearly eliminated the plateau. Additional treatment with FCCP greatly modified the response (third response). A final response elicited after FCCP washout shows that the actions of FCCP are reversible. Cell sc0c91. (C) After depolarization and recovery in the presence of CGP (4 μM), rapid application of FCCP (10 μM) in low Ca2+ Ringer's (nominally Ca2+ free with 0.2 mM EGTA) elicits a large [Ca2+]i transient, in contrast to the small response seen in the absence of CGP; collected results comparing FCCP-induced [Ca2+]i transients (Δ[Ca2+]i,+FCCP) in the presence (+CGP, 2–6 μM) and absence (cont) of CGP are shown in panel D (* indicates significant difference from control, P < 0.001).
The actions of CGP are concentration dependent. When cells are depolarized in the presence of CGP at increasing concentrations, the [Ca2+]i plateau level is progressively lowered and the recovery is prolonged (Fig. 4 B). This effect was quantified by measuring the [Ca2+]i level where the rate of recovery reaches a minimum (see Materials and Methods). Plotting the normalized plateau level vs CGP concentration shows that the plateau level falls with concentration in a manner consistent with a single binding site model with IC50 ∼ 560 nM (Fig. 4 C, smooth curve). This value agrees with the IC50 for CGP-induced inhibition of Na+-dependent Ca2+ efflux from isolated cardiac mitochondria (360–800 nM; Chiesi et al. 1988; Cox et al. 1993). These results support the conclusion that CGP modifies [Ca2+]i dynamics by inhibiting Ca2+ release via the mitochondrial Na+/Ca2+ exchanger, and that drug binding has reached equilibrium before depolarization under the conditions of these experiments (see also Baron and Thayer 1997).
The CGP-sensitive component of the recovery requires intracellular sodium.
If the [Ca2+]i plateau reflects Ca2+ release via the mitochondrial Na+/Ca2+ exchanger, both the plateau level and its sensitivity to CGP should depend on intracellular Na+. To examine this point, cells were depolarized under voltage clamp (perforated patch conditions) with or without Na+ added to the pipette solution (Fig. 5). When 10 mM Na+ was included in the pipette solution, brief depolarization elicited [Ca2+]i elevations followed by recoveries showing pronounced plateaus (Fig. 5 A, 323 ± 19 nM, n = 12) much like those seen in non-voltage-clamped cells after high K+ depolarization; peak [Ca2+]i elevations are larger than those elicited by high K+ presumably because depolarization and Ca2+ channel activation are more rapid under voltage clamp, leading to higher Ca2+ entry rates. This concentration of Na+ would be expected to enable mitochondrial Na+/Ca2+ exchange based on studies of isolated mitochondria (half-maximal activation at ∼2–3 mM [Na+]i, maximal activation at ∼10 mM [Na+]i; Cox and Matlib 1993). Plateau levels were similar when [Na+]i = 6.5 (293 ± 9 nM, n = 6) so results with [Na+]i = 6.5 and 10 mM were pooled (see Fig. 5D).
Figure 5.
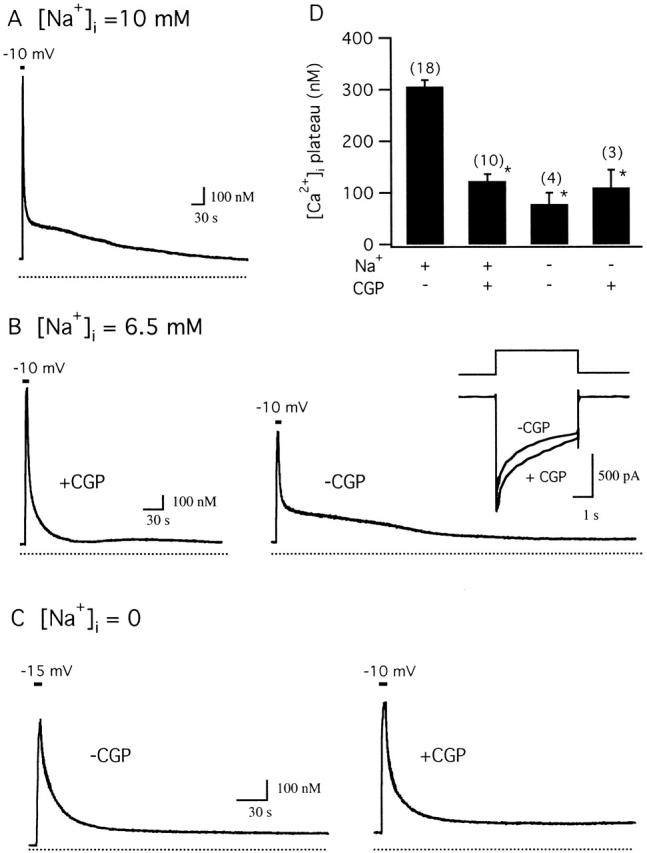
The CGP-sensitive component of the recovery is sensitive to intracellular Na+. Depolarization-evoked [Ca2+]i response recorded under voltage clamp (perforated patch conditions). (A) Response to a 2-s depolarization from −70 to −10 mV (pipette solution contained 10 mM Na+). After repolarization, the recovery exhibited a prolonged plateau whose magnitude was similar to those seen in intact cells after high K+ depolarization. Cell sc0w51. (B) Responses from another Na+-containing cell (6.5 mM) elicited first in the presence of 0.8 μM CGP and then 12.5 min after washing out the drug (right) showing reversible suppression of the [Ca2+]i plateau. Inset compares ICa elicited by these depolarizations. Cell sc0w42. (C) [Ca2+]i response measured with low intracellular Na+. When pipette solutions contained no added Na+, the recovery after depolarization lacked a plateau (left) and was not modified by CGP (1 μM, right). In this cell, the second depolarization (-10 mV) was stronger than the first (−15 mV) in an effort to elevate [Ca2+]i to approximately the same level to facilitate comparison of the recoveries. Cell sc0w59. (D) Collected results showing that the [Ca2+]i plateau level observed in cells containing intracellular Na+ (6.5–10 mM) is significantly depressed by CGP, that there is no further effect if Na+ is omitted from the pipette solution, and that CGP has no detectable effect when intracellular Na+ concentration is low (* indicates significant difference from control, P < 0.001).
As with cells depolarized with high K+, the plateau observed under voltage clamp is depressed by CGP. Fig. 5 B illustrates a [Ca2+]i response elicited by a depolarizing step from −70 to −10 mV, first in the presence of CGP (left) and then after washout (right). In the presence of CGP, the plateau is largely suppressed and there is a prolonged tail, possibly reflecting incomplete inhibition of Ca2+ release and/or release via a CGP-insensitive pathway. After washing out CGP, depolarization elicits a rise in [Ca2+]i followed by a pronounced plateau, even though the rise in [Ca2+]i was smaller, reflecting current rundown during the washout period (see Fig. 5 B, right, inset). These responses are representative of ten cells in which Na+ was included in the pipette solution: in the presence of CGP, recoveries were marked by plateaus (123 ± 13 nM) that were significantly lower than those measured in the same cells in the absence of CGP (305 ± 13 nM, P < 0.001) (Fig. 5 D).
When Na+ was not added to pipette solutions, depolarization elicited [Ca2+]i elevations that were followed by simple recoveries (Fig. 5 C, left; n = 4) like those seen in Na+-containing cells in the presence of CGP (Fig. 4 A). A second response elicited after treatment with CGP exhibited a recovery that was very similar to that seen in the absence of CGP (Fig. 5 C, right), indicating that CGP has little effect in the absence of intracellular Na+ (D), supporting the conclusion that CGP specifically blocks the mitochondrial Na+/Ca2+ exchanger. The failure of [Ca2+]i to recover completely to prestimulation levels (Fig. 5B and Fig. C) is consistent with the development of a Ca2+ leak over these long experiments.
Relationship between the actions of CGP and FCCP.
If CGP specifically inhibits mitochondrial Ca2+ release via the Na+/Ca2+ exchanger, it should have no additional effect on [Ca2+]i responses elicited in the presence of FCCP. Fig. 6 A shows responses induced by high K+ before and during exposure to FCCP, and then in the combined presence of FCCP and CGP. CGP had no additional effect after treatment with FCCP, indicating that it only modifies FCCP-sensitive (mitochondrial) Ca2+ transport and does not affect nonmitochondrial Ca2+ transport systems. Similar results were obtained in each of three cells. A different conclusion was reached by Baron and Thayer 1997 based on the finding that CGP depressed high K+-induced [Ca2+]i responses in rat DRG neurons (∼50% at 3 μM), suggesting that it directly blocks voltage-gated Ca2+ channels in these cells. We found that at concentrations which virtually eliminated the slow plateau phase of recovery, CGP had little or no effect on [Ca2+]i during depolarization, or on the initial rate of recovery after repolarization (Fig. 4). Moreover, CGP did not detectably inhibit ICa (Fig. 5). In any case, all flux measurements in this study were made after repolarization, when Ca2+ channels are closed. Therefore, potential effects of CGP on ICa during depolarization do not influence the conclusions of this study (see below). As expected, FCCP still had a prominent effect on depolarization-induced [Ca2+]i responses during treatment with CGP (Fig. 6 B, four cells), indicating that CGP modifies some, but not all, FCCP-sensitive processes.
When FCCP is applied at a higher concentration (10 μM) in the absence of extracellular Ca2+ during the plateau phase of recovery, it elicits a large [Ca2+]i transient (Δ[Ca2+]i = 1,438 ± 396 nM, n = 7) but only a small [Ca2+]i rise when applied after [Ca2+]i recovers to basal levels (35 ± 14 nM, n = 7), providing another way to monitor Ca2+ loss from loaded mitochondria during the recovery. If CGP effectively inhibits mitochondrial Ca2+ release, then in the presence of the inhibitor, depolarization should still increase mitochondrial Ca2+ concentration, but the increase should persist even after resting [Ca2+]i is restored. To test this, cells were depolarized in the continued presence of a nearly saturating concentration of CGP, and then after [Ca2+]i recovered, they were challenged with FCCP (Fig. 6 C). In the presence of CGP, FCCP elicited a large [Ca2+]i transient, in striking contrast to the small [Ca2+]i elevation seen under similar conditions in the absence of the blocker (Fig. 6 D). Therefore, CGP does not prevent mitochondrial Ca2+ accumulation but does cause these organelles to retain their Ca2+ load. The ability of FCCP to discharge mitochondria under these conditions implicates a Ca2+ release pathway that senses mitochondrial membrane potential and is not blocked by CGP, possibly the Ca2+ uniporter. The observation that FCCP elicits a larger [Ca2+]i transient when applied at 10 μM in the presence of 4 μΜ CGP (Fig. 6 C) than at 1 μM in the presence of 1 μM CGP (B) probably reflects a combination of incomplete block by CGP at the lower concentration (see prolonged tail during the recovery after the second depolarization in B) and slower Ca2+ release induced by FCCP at the lower concentration. Slow FCCP-induced Ca2+ release would also explain why rapid application of the protonophore at the lower concentration during the plateau only prolongs the recovery (four cells) in contrast to the large and rapid rise elicited by 10 μM FCCP (not shown).
Properties of the CGP-sensitive and -resistant components of Jmito.
Taken together, the observations presented above indicate that CGP is a specific inhibitor of mitochondrial Ca2+ efflux via the Na+/Ca2+ exchanger. This compound was therefore used to dissect the net mitochondrial Ca2+ flux into its components. Fig. 7 A shows [Ca2+]i responses elicited under control conditions (left), in the presence of a nearly saturating concentration of CGP (2 μM, middle), and in the presence of 1 μM FCCP after CGP washout (right). Using a strategy like that employed to separate the total Ca2+ flux into mitochondrial and nonmitochondrial components, CGP was used to separate Jmito into CGP-sensitive and -resistant components that are associated with mitochondrial Ca2+ release and uptake pathways.
Figure 7.
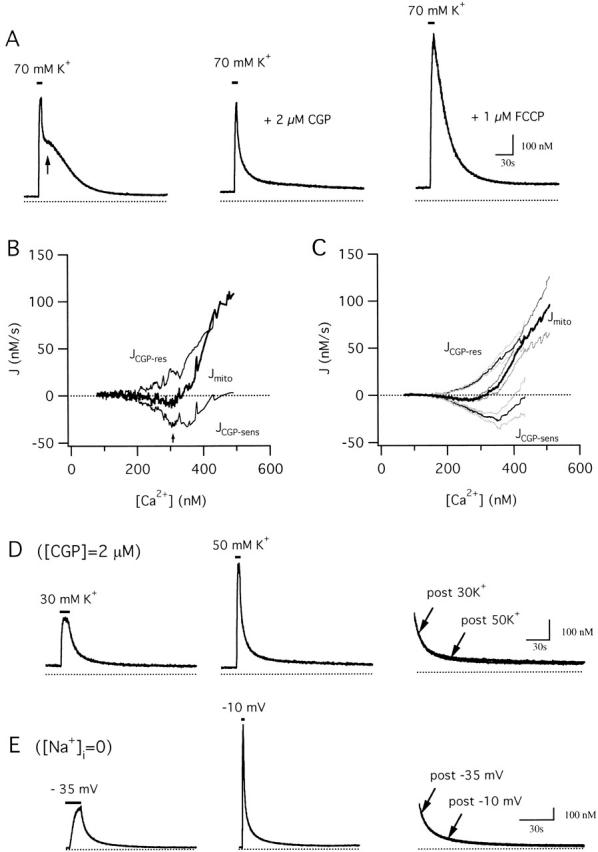
Separation of the total mitochondrial Ca2+ flux into components representing Ca2+ uptake and release. (A) Comparison between control response elicited by 70 mM K+ (left) and subsequent responses elicited from the same cell in the presence of CGP (2 μM, middle) and FCCP (1 μM, right). (B) [Ca2+]i dependence of Jmito (thick trace) and its CGP-sensitive and resistant components (JCGP-sens and JCGP-res, respectively, thin traces) calculated from the responses in (A). JCGP-res was determined by subtracting JFCCP-res from the total flux measured in the presence of CGP (J+CGP), and JCGP-sens was calculated as the difference between the total flux in the absence and presence of CGP at corresponding values of [Ca2+]i. JCGP-res is positive and increases steeply with [Ca2+]i above ∼200 nM. JCGP-sens is inward and has an apparent U-shaped dependence on [Ca2+]i. Cell sc0d22. (C) Plot of mean Jmito (thick trace) and its component fluxes (thin traces) from 10 cells (± SEM indicated by light traces). (D) Comparison between recoveries after weak (30 mM K+, left) and strong (50 mM K+, middle) depolarization in the same cell during maintained exposure to 2 μM CGP; these recoveries are superimposed on an expanded time scale (right) showing that they are nearly identical over the common range of [Ca2+]i. Cell sc0d25. (E) Comparison between recoveries after weak (−35 mV, left) and strong (−10 mV, middle) depolarization elicited from another cell under voltage clamp using a Na+-free pipette solution. The recoveries are superimposed on an expanded time scale (right) showing that they are indistinguishable over the common range of [Ca2+]i. Cell ma5000.
Fig. 7 B plots Jmito and its CGP-resistant component (JCGP-res) versus [Ca2+]i during the recovery from the cell shown in panel A and collected results from ten cells (C). JCGP-res was calculated by subtracting JFCCP-res from the total flux measured in the presence of CGP (J+CGP) at corresponding values of [Ca2+]i. JCGP-res is an outward flux that increases steeply and montonically with [Ca2+]i, as expected for the mitochondrial uniporter under conditions where the electrochemical driving force for Ca2+ favors uptake. Importantly, this flux is non-zero even when bulk [Ca2+]i is as low as 200–300 nM. Since these measurements were made after voltage-gated Ca2+ channels have closed and radial Ca2+ gradients have largely dissipated (Hernandez-Cruz et al. 1990; Hua et al. 1993), bulk [Ca2+]i measurements should provide a reasonable estimate of the extramitochondrial Ca2+ concentration. Therefore, our results support the conclusion that mitochondrial Ca2+ uptake occurs when local [Ca2+]i is as low as 200–300 nM.
The CGP-sensitive component of Jmito, determined by subtracting JCGP-res at corresponding values of [Ca2+]i, is easily interpreted if CGP and JCGP-res satisfy conditions like those described above for FCCP and JFCCP-res: (a) CGP specifically and completely inhibits mitochondrial Ca2+ release, and (b) the CGP-resistant flux depends only on the magnitude of [Ca2+]i at each instant in time during the recovery and not on the history of [Ca2+]i. If these conditions are satisfied, JCGP-res gives the rate of mitochondrial Ca2+ uptake, and the net mitochondrial flux is the sum of JCGP-res and the CGP-sensitive component of Jmito (JCGP-sens) at corresponding values of [Ca2+]i, making it possible to calculate JCGP-sens as the difference between Jmito and JCGP-res.
Regarding specificity, the results described above indicate that CGP inhibits Na+-dependent mitochondrial Ca2+ release, and the following observations show that if CGP influences any other Ca2+ transport systems that contribute to the recovery, its effects are small. CGP does not alter resting [Ca2+]i (1–4 μM CGP, 50 cells) and therefore has little effect on Ca2+ transporters responsible for setting this [Ca2+]i level. Also, CGP does not influence [Ca2+]i recoveries after depolarization in cells already treated with FCCP (1 μM; e.g., Fig. 6 A): in the absence of CGP, the fast and slow time constants of recovery were (s) 14.7 ± 3.8 and 249.7 ± 117.4, while in the presence of 1 μM CGP they were 17.7 ± 3.9 s and 271.3 ± 83.1, n = 3, NS). Finally, CGP does not modify [Ca2+]i recovery kinetics under perforated patch conditions when pipette solutions lack Na+ (Fig. 5 C).
Two complementary approaches were used to determine if the CGP-resistent flux is defined by [Ca2+]i during the recovery. In these experiments, J+CGP was analyzed since it should be the sum of JCGP-res and JFCCP-res, and the latter flux component has already been shown to have this property. For each approach, mitochondrial Ca2+ release via the Na+/Ca2+ exchanger was inhibited and [Ca2+]i was elevated to different levels by weak and strong depolarization so that the subsequent recoveries could be compared. The approaches differed in the way Ca2+ release was inhibited. When release was inhibited by CGP (2 μM), recoveries were nearly identical over the common range of [Ca2+]i despite being preceded by very different [Ca2+]i elevations (Fig. 7 D, see superimposed recoveries at right). Therefore, under the conditions of these experiments, the rate of Ca2+ removal in the presence of CGP depends only on the magnitude of [Ca2+]i at each time. The second approach used Na+-free pipette solutions under voltage clamp to suppress mitochondrial Ca2+ release without relying on CGP. Large and small [Ca2+]i responses were elicited and the ensuing recoveries were compared. Under these conditions, both fast and slow components of the recoveries were indistinguishable (Fig. 7 E, recoveries are compared at right), demonstrating that, like the CGP-resistant component of the total flux, the Na+-insensitive component depends on [Ca2+]i but not its history or the state of mitochondrial Ca2+ loading.
Fig. 7 B shows the CGP-sensitive flux (JCGP-sens) calculated by subtracting J+CGP from Jcont at corresponding values of [Ca2+]i; averaged results from 10 cells are presented in C. JCGP-sens represents net mitochondrial Ca2+ release and exhibits a U-shaped dependence on [Ca2+]i. As [Ca2+]i declines during the recovery, the magnitude of JCGP-sens rises from a small value near zero to a maximum when [Ca2+]i is near the plateau level (see arrow) and then declines as [Ca2+]i approaches the prestimulation level. The biphasic dependence of JCGP-sens on [Ca2+]i is also evident from the [Ca2+]i responses: CGP has little effect on the recovery rate during the initial rapid phase when [Ca2+]i is high, or on the final approach to prestimulation levels, when [Ca2+]i is low. It is only when [Ca2+]i is at intermediate levels that CGP-sensitive flux is a significant fraction of the total Ca2+ flux, rendering the recovery rate sensitive to CGP.
Components of the mitochondrial flux measured under voltage clamp.
The components of the total Ca2+ flux were also measured under voltage clamp, which made it possible to examine the [Ca2+]i dependence of the fluxes over a wider [Ca2+]i range. The first set of experiments was designed to measure the nonmitochondrial Ca2+ flux and the uptake component of Jmito. Fig. 8 A shows results from a cell with low internal Na+ to inhibit mitochondrial Ca2+ release via the Na+/Ca2+ exchanger. The total Ca2+ flux was then measured during the recovery after raising [Ca2+]i by a 2.3-s depolarization from −70 to −10 mV before (Jcont) and after exposure to 1 μM FCCP (JFCCP-res). The FCCP-sensitive component of the total flux was outwardly directed and increased steeply with [Ca2+]i, closely resembling JCGP-res measured in cells after high K+ depolarization (compare with Fig. 7B and Fig. C). Similar results were observed in 3/3 cells. The second set of experiments examined the CGP-sensitive component of Jmito (Fig. 8 B). Ca2+ fluxes were measured in Na+-containing cells by depolarizing before (Jcont) and after exposure to CGP (J+CGP). The CGP-sensitive flux, obtained by subtraction, was inwardly directed and displayed a U-shaped [Ca2+]i dependence qualitatively like that seen with JCGP-sens measured in cells stimulated with high K+ (compare with Fig. 7B and Fig. C). Similar results were obtained in 4/4 cells. Overall, the similarity between these results and those obtained from cells depolarized with high K+ indicate that the properties of the component fluxes are largely independent of the method used to evoke voltage-sensitive Ca2+ entry, and depend primarily on the size of the cytosolic Ca2+ load.
Figure 8.

Mitochondrial Ca2+ uptake and release fluxes measured under voltage clamp. (A) Fluxes measured from a representative cell under voltage clamp after depolarization from −70 to −10 mV with a Na+-free pipette solution, before (Jcont) and after exposure to 1 μM FCCP (JFCCP-res). The FCCP-sensitive flux (JFCCP-sens, thin trace), calculated as the difference between the total flux measured in the absence (Jcont) and presence of FCCP (JFCCP-res), is positive and increases steeply with [Ca2+]i, much like the CGP-resistant flux seen in cells after high K+ depolarization. Cell ma4980. (B) Flux measurements from another cell during the recovery after a step from −70 to −10 mV (pipette solution contained 6.5 mM NaCl) before and after exposure to CGP (1 μM). The CGP-sensitive flux (thin trace), calculated as the difference between the total flux in the absence and presence of CGP, is inward and biphasic, similar to JCGP-sens observed in cells depolarized with high K+. Cell sc0w21.
To summarize, Jmito can be separated into uptake and release components based on their sensitivity to CGP: Mitochondrial Ca2+ uptake is steeply dependent on [Ca2+]i and becomes the dominant mitochondrial Ca2+ transport pathway when [Ca2+]i is high (>∼500 nM). Uptake still occurs when [Ca2+]i is as low as 200–300 nM, but it is opposed by release at comparable rate, accounting for the small net mitochondrial Ca2+ flux. Under these conditions, the relative rates of uptake and release are critical in defining the net mitochondrial Ca2+ flux. Since the uniporter is the main pathway for mitochondrial Ca2+ uptake and the Na+/Ca2+ exchanger is the principle route for neuronal mitochondrial Ca2+ release (Gunter and Pfeiffer 1990), JCGP-res and JCGP-sens will be referred to in the following as Juni and JNa/Ca, although it is impossible to rule out small contributions to these components from other mitochondrial Ca2+ transport pathways during these recoveries.
Properties of the Component Fluxes Explain the Complex Time Course of Recovery
The kinetics of the [Ca2+]i recovery can be understood in terms of Jcont and its components. Fig. 9 A shows a [Ca2+]i response elicited by a 70 mM K+ depolarization with the four phases of recovery (i–iv) indicated. Fig. 9 B shows the time course of Jcont (thick trace) and its mitochondrial and nonmitochondrial components (thin traces); Fig. 9 C illustrates Jmito and its components on the same scale. Also shown is the time course of the integrated mitochondrial Ca2+ flux (Fig. 9 A, dotted trace) which provides a measure of the change in mitochondrial Ca2+ concentration (Δ[Ca2+]m (i)) from its resting value after recovery is complete (see ). During recovery phase i (see Fig. 9A and Fig. B), Jcont is large and outward because of the combined effects of strong mitochondrial Ca2+ uptake and weak extrusion across the plasma membrane. As a result, Δ[Ca2+]m (i) rises and [Ca2+]i falls rapidly. As [Ca2+]i falls, JFCCP-res declines and Jmito changes sign to become an inward flux, which causes Δ[Ca2+]m (i) to fall and the [Ca2+]i recovery to be slowed (phase ii). Jcont reaches a minimum near zero when the opposing fluxes JFCCP-res and Jmito are nearly balanced, and then rises because the inward flux Jmito decays more rapidly than the outward flux JFCCP-res, causing the recovery to accelerate. Finally, during phase iv, Jmito approaches zero and the [Ca2+]i recovery is controlled by net Ca2+ extrusion. Note that while the initial rapid phase of recovery is dominated by mitochondrial Ca2+ transport, and the final phase is dominated by net Ca2+ extrusion, the intermediate phases (ii–iii) are influenced similarly by net mitochondrial Ca2+ release and net Ca2+ extrusion.
Figure 9.
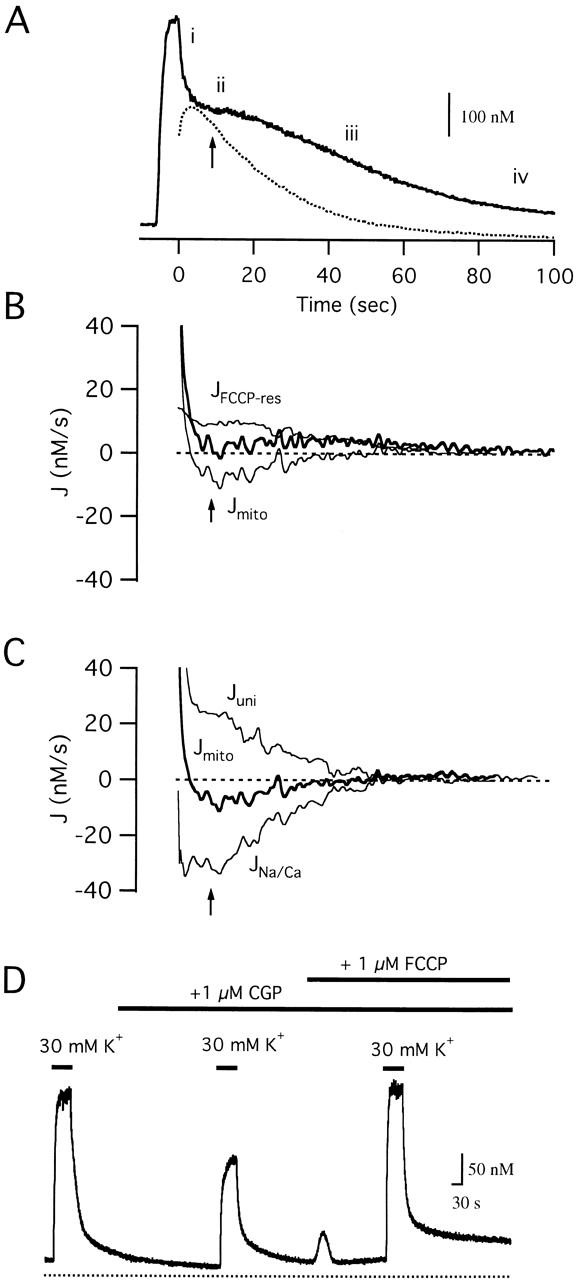
Temporal relationship between Ca2+ fluxes during the recovery. (A) Time course of [Ca2+]i during and after a 5.9 s exposure to 70 mM K+ with phases (i–iv) of the recovery indicated. Also shown is the integrated net mitochondrial Ca2+ flux (dotted trace), which provides a measure of the change in mitochondrial Ca2+ concentration from its initial value just before repolarization. (B) Time dependence of Jcont (thick trace) and its mitochondrial and nonmitochondrial components, Jmito and JFCCP-res (thin traces) during the recovery in A. The [Ca2+]i dependence of JFCCP-res was deduced from the recovery in the presence of FCCP, JFCCP-res was determined at each point in time t as JFCCP-res([Ca2+]i(t)) and Jmito was by calculated as the difference Jcont(t) − JFCCP-res([Ca2+]i(t)). (C) Time dependence of Jmito (thick trace) and its components Juni and JNa/Ca (thin traces) A slight, but nearly steady imbalance between the component fluxes is responsible for the small but nearly constant net mitochondrial Ca2+ release that contributes to the [Ca2+]i plateau. The time course of Juni (= JCGP-res) was determined from J+CGP and JFCCP-res using the same approach employed for calculating Jmito(t). Given a measurement of Jmito in the same cell (requiring an additional response in the absence of drugs), JNa/Ca (= JCGP-sens) was calculated as the difference Jmito(t) − JCGP-res ([Ca2+]i(t)). Cell sc0d22. (D) Effect of CGP (1 μM) on responses to weak depolarization (30 mM K+). CGP greatly slows the rise in [Ca2+]i during depolarization and reduces the apparent steady-state level, effects that are overcome by FCCP (1 μM). Cell sc0c98.
The dynamics of Jmito can be understood in terms of its components (Fig. 9 C). During phase i, Jmito is large and outward because Juni is much larger in magnitude than the inward flux JNa/Ca, which is close to zero. Mitochondrial Ca2+ accumulation causes [Ca2+]i to fall, which is accompanied by a decline in Juni and a rise in the inward flux JNa/Ca. Together, these changes cause Jmito to change sign to become an inward flux. Then Juni and JNa/Ca decline at approximately the same rate, so that for a time Jmito is a nearly constant inward flux that maintains [Ca2+]i near the plateau level. As both fluxes approach zero during phase iii, the inward flux Jmito declines, net Ca2+ extrusion becomes unopposed and the recovery accelerates (see Fig. 9 B). Note that while Ca2+ uptake via the uniporter is the dominant component of the net mitochondrial flux during phase i of the recovery, uptake and release fluxes have similar magnitudes during phases ii–iii.
The results presented above show that even when [Ca2+]i is as low as 200–300 nM during the recovery, the mitochondrial Ca2+ uptake pathway is active (Fig. 7 B and 9 C). Thus, uptake should occur even during weak depolarizations that elevate [Ca2+]i to levels within this range. However, previous work has shown that FCCP has little effect under these conditions (Friel and Tsien 1994), suggesting that the net mitochondrial Ca2+ flux is small, requiring that ongoing uptake and release fluxes nearly balance one another. If this were true, inhibition of the release pathway should enhance net mitochondrial Ca2+ accumulation and measurably slow the rise in [Ca2+]i induced by weak depolarization, and additionally speed the recovery after repolarization. As a test of this prediction, small [Ca2+]i elevations were evoked by exposure to 30 mM K+ before and after treatment with 1 μM CGP (Fig. 9 D). In the presence of CGP, the rise in [Ca2+]i was greatly slowed, the apparent steady-state [Ca2+]i elevation was reduced, and the recovery after repolarization was accelerated when compared with the control response elicited in the absence of CGP over the same [Ca2+]i range, effects that were reversed by FCCP (3/3 cells).
DISCUSSION
Summary of Main Results
This study describes the interplay between Ca2+ transport systems that restore the resting distribution of Ca in sympathetic neurons after depolarization-evoked Ca2+ entry. Cells were treated with thapsigargin to inhibit SERCA pump activity and minimize contributions from ER Ca2+ transport, and the remaining Ca2+ flux was separated into mitochondrial and nonmitochondrial components. It was found that mitochondria are powerful Ca2+ sequestration organelles (Brinley et al. 1978) and provide the major Ca2+ clearance system when [Ca2+]i is high during the initial rapid phase of recovery (see also Herrington et al. 1996; Xu et al. 1997). The same conclusion is reached when SERCA pumps are operational, since SERCA inhibitors have a much smaller effect on [Ca2+]i recovery kinetics after strong depolarization than does FCCP; this is expected, since when [Ca2+]i is high the rate of Ca2+ uptake by the uniporter greatly exceeds the rate of uptake via SERCA pumps (unpublished observations). It was also found that during the later phases of the recovery, when [Ca2+]i is lower, the relative rates of net mitochondrial release and net Ca2+ extrusion are critical. During the plateau phase of recovery, these rates are similar, causing [Ca2+]i to be nearly steadily elevated for a period of time that depends on mitochondrial Ca2+ load (see accompanying study). During the subsequent phases of recovery, net Ca2+ extrusion becomes the dominant Ca2+ clearance system, and is primarily responsible for restoring resting [Ca2+]i. When SERCA pumps are operational, the later phases of recovery are also influenced by net ER Ca2+ accumulation (Friel and Tsien 1992) followed by net Ca2+ release (Colegrove, S.L., and D.D. Friel, unpublished observations).
The net mitochondrial Ca2+ flux was separated into components representing distinct Ca2+ uptake and release components. It was found that mitochondrial Ca2+ uptake is steeply dependent on [Ca2+]i, as expected for the mitochondrial uniporter, and occurs even when [Ca2+]i is as low as 200–300 nM. Mitochondrial Ca2+ release requires intracellular Na+ and is blocked by CGP 37157, a specific inhibitor of the mitochondrial Na+/Ca2+ exchanger, indicating that release depends on activity of this transporter. Because of its high transport rate and steep [Ca2+]i dependence, the uptake pathway dominates the net mitochondrial Ca2+ flux when [Ca2+]i is high (>∼400–500 nM), while both uptake and release pathways make comparable contributions to the net flux when [Ca2+]i is lower. Mitochondrial Ca2+ transport also occurs during weak depolarization when [Ca2+]i rises to low levels (∼300 nM). Under these conditions, the net mitochondrial Ca2+ flux is small, representing the sum of much larger uptake and release fluxes that nearly cancel one another. Recent studies have shown that similar [Ca2+]i elevations stimulate mitochondrial Ca2+ accumulation in heart cells (e.g., Zhou et al. 1998).
Properties of the Measured Fluxes
The FCCP-resistant flux was measured after treatment with Tg and FCCP, so it probably represents predominantly net Ca2+ transport across the plasma membrane. Additional support for this conclusion is provided by the finding that JFCCP-res is reduced by ∼90% after removal of extracellular Na+ and addition of La3+ (1–5 mM, unpublished observations). This flux increases with [Ca2+]i and levels off at high [Ca2+]i, possibly indicating saturation of the underlying extrusion systems. Since JFCCP-res was defined by [Ca2+]i at each instant in time during the recovery, the underlying transport systems appear to have little intrinsic time dependence under the conditions of our experiments.
The CGP-resistant component of the net mitochondrial Ca2+ flux represents mitochondrial Ca2+ uptake and shows a steep dependence on [Ca2+]i (Hill coefficient ∼2, see accompanying study) as expected for the mitochondrial uniporter (Scarpa and Graziotti 1973). One of the most important findings is that Ca2+ uptake occurs even when [Ca2+]i is as low as 200–300 nM. It is unlikely that these measurements grossly underestimate [Ca2+]i near the majority of mitochondria since they were made long after Ca2+ channels have closed and radial [Ca2+]i gradients have dissipated (Hernandez-Cruz et al. 1990; Hua et al. 1993). Activity of the Ca uniporter at such low [Ca2+]i may seem surprising in view of the high EC50 for activation of the uniporter (∼10–20 μM; Gunter and Pfeiffer 1990), but is expected based on the properties of the transporter in isolated mitochondria (Carafoli 1979; Gunter and Gunter 1994; see discussion in Pivovarova et al. 1999). Activity of the uniporter at low [Ca2+]i reconciles the low affinity and steep [Ca2+]i dependence of this transporter with the widely reported finding that mitochondria accumulate Ca2+ even when [Ca2+]i < 1 μM. Like JFCCP-res, Juni did not appear to have a strong intrinsic time dependence.
The CGP-sensitive flux represents mitochondrial Ca2+ release and shows an apparent U-shaped dependence on [Ca2+]i. However, even though JNa/Ca varies with [Ca2+]i, it is not clear that it actually depends on [Ca2+]i (i.e., is a function of [Ca2+]i) and a dependence on other factors is likely, such as the concentration of intramitochondrial free Ca ([Ca2+]m). Wingrove and Gunter 1986 showed that with constant extramitochondrial Ca2+ concentration, the rate of Ca2+ release from liver mitochondria increases saturably with [Ca2+]m. However, this is difficult to reconcile with the measured flux which has the same small magnitude initially after repolarization, and after recovery is nearly complete, even though mitochondrial Ca concentration is very different at these times (Fig. 9A and Fig. C). One possible explanation is provided by the finding that the mitochondrial Na+/Ca2+ exchanger can be inhibited by submicromolar concentrations of external Ca2+ (Hayat and Crompton 1982). Dual regulation of JNa/Ca by [Ca2+]m and [Ca2+]i provides a possible explanation for the apparent U-shaped dependence on [Ca2+]i. During the initial phase of recovery, [Ca2+]i may be large enough to inhibit JNa/Ca despite high [Ca2+]m. Inhibition would then be relieved as [Ca2+]i declines so that JNa/Ca subsequently depends primarily on [Ca2+]m. Using Δ[Ca2+]m (i) as a basis for estimating changes in mitochondrial Ca concentration, such a model provides a reasonable quantitative description of JNa/Ca, although regulation by other factors (e.g., intramitochondrial Na+) is also possible (see accompanying study).
Interplay between the Components of the Total Ca2+ Flux
This study illustrates how net mitochondrial Ca2+ transport and Ca2+ transport across the plasma membrane contribute to [Ca2+]i dynamics. It also shows how the rate of net mitochondrial Ca2+ transport depends on the relative rates of uptake and release. When [Ca2+]i is high (<∼300–400 nM) uptake is much more powerful than release, accounting for strong mitochondrial Ca2+ accumulation. When [Ca2+]i is low (∼200–300 nM), mitochondrial Ca2+ uptake and release occur at comparable rates, accounting for the small net mitochondrial Ca2+ flux. Moreover, since the component fluxes are large compared with the net flux, modulation of either the uptake or release rate would have a large impact on the net mitochondrial Ca2+ flux. Also, since the rate of release depends on the intramitochondrial Ca2+ concentration, which in turn depends on the history of [Ca2+]i (see accompanying study), the net mitochondrial Ca2+ flux at low [Ca2+]i should be sensitive to stimulus history (see accompanying study).
The interplay between net mitochondrial Ca2+ transport and net Ca2+ extrusion across the plasma membrane is also important in determining the [Ca2+]i level reached during depolarization, but in this case the relative rates of mitochondrial Ca2+ accumulation and net Ca2+ entry are critical. Assuming an initial steady-state before depolarization in which [Ca2+]i is at its resting level and the net mitochondrial flux is zero, a small steady rise in [Ca2+]i induced by weak depolarization would be expected to stimulate the mitochondrial Ca2+ uptake pathway, creating an imbalance between uptake and release which leads to net Ca2+ accumulation. The resulting increase in [Ca2+]m would be expected to increase the rate of release, eventually leading to a new steady-state in which release and uptake balance. Indeed, during maintained exposure to 30 mM K+ which raises [Ca2+]i to ∼300 nM, mitochondrial Ca accumulation does occur (Pivovarova et al. 1999). Paradoxically, proton ionophores have little effect on the magnitude of [Ca2+]i responses elicited by such weak stimuli (Friel and Tsien 1994; Herrington et al. 1996). However, as shown in the accompanying study, this is expected for weak stimuli that raise [Ca2+]i and [Ca2+]m toward new steady-state levels. With stronger stimuli that elevate [Ca2+]i to levels where uptake via the uniporter exceeds the maximal rate of release, the rate of mitochondrial Ca2+ accumulation would increase until it balances net entry and then become constant. For example, during 45–120 s exposure to 50 mM K+, mitochondrial Ca accumulation continues at a nearly constant rate even though [Ca2+]i is essentially constant at ∼500–800 nM (Pivovarova et al. 1999). This would explain why such strong depolarizations elicit much larger [Ca2+]i elevations during treatment with FCCP.
In the accompanying study, JFCCP-res, Juni and JNa/Ca are described quantitatively and incorporated into a model of Ca2+ dynamics. The model reproduces the recovery time course with its four distinct phases, the effects of graded inhibition of the Na+/Ca2+ exchanger by CGP (Fig. 4), and accounts for the actions of CGP and FCCP on responses to weak depolarization. The model also clarifies the relationship between the [Ca2+]i plateau level and the previously described mitochondrial set-point.
Comparison with Other Studies
We found that mitochondria accumulate Ca at a rate of ∼400 nM/s (nmol Ca2+/li effective cytosolic vol/s) when [Ca2+]i ∼0.8 μM (Fig. 8 A), in general agreement with results from rat chromaffin cells (Herrington et al. 1996). The net mitochondrial Ca2+ fluxes in this study can also be compared with direct measurements of the rate of total Ca accumulation obtained with electron probe microanalysis in the same cell type under the same conditions of stimulation (see , ). During exposure to high K+ (50 mM, 2 min), which elevates [Ca2+]i to ∼500–800 nM, mitochondria accumulate Ca at an approximately constant rate, ∼184 μΜ/s (Pivovarova et al. 1999). Since the ratio of mitochondrial and cytosolic volumes in sympathetic neurons is ∼ 0.1 (0.09 ± 0.10; Friel, D.D., and S.B. Andrews, unpublished data), this would give a total cytosolic Ca flux of (184)(0.1) = 18.4 μΜ/s (i.e., the rate of mitochondrial Ca accumulation referred to cytosolic volume). Estimating the ratio (κi T, see ) of total to free cytosolic Ca concentration (∼200; Friel, D.D., unpublished observations) provides an estimate of the free cytosolic Ca2+ flux of 92 nM/s, placing a lower limit on the rate of uptake via the uniporter that is consistent with the value obtained in the present study, ∼100 nM/s at ∼500 nM, (Fig. 7 B and 8 A).
Our measurements of Juni and JNa/Ca can only be compared with results obtained from isolated mitochondria, since measurements of these fluxes in situ have not been reported previously. At a membrane potential of 150 mV and external Ca2+ concentration of 500 nM, uptake by isolated rat liver mitochondria occurs at ∼4 nmol/mg prot/min (Wingrove et al. 1984), which converts to 25 nM/s (see Pivovarova et al. 1999), somewhat less than our measured value (∼100 nM/s, Fig. 8 A). Na+-dependent Ca2+ release by isolated heart and brain mitochondria occur at maximal rates of ∼10 and 30 nmol/mg prot/min (Hayat and Crompton 1982; Gunter and Gunter 1994), which convert to ∼63 and 188 nM/li cytosolic vol/s, compared with our measured values of JNa/Ca, which were ∼35–40 nM/s after brief depolarizations. While these comparisons are undoubtedly complicated by differences between experimental conditions and between mitochondria in isolation and in intact cells, the results are in rough quantitative agreement.
Integrating the net mitochondrial Ca2+ flux during the entire recovery provides a measure of the depolarization-evoked increase in mitochondrial total Ca concentration referred to the effective cytosolic volume (Δ[Ca2+]m (i), Appendix Eq. 9; e.g., dotted trace in Fig. 9 a). This quantity can be compared with measured changes in total mitochondrial Ca concentration induced by high K+ depolarization. For example, during the recovery that follows a ∼13-s exposure to 50 mM K+, Δ[Ca2+]m (i) declines by ∼1,000 nM. This may be interpreted as the change in [Ca2+]i that would result if the entire stimulus-evoked mitochondrial Ca load at the instant of repolarization were distributed within a closed compartment having the same effective volume as the cytosol. Estimating the ratio of mitochondrial and cytosolic volume as above (∼0.1) and the ratio of mitochondrial and cytosolic Ca2+ buffering strength as ∼4,000/200 = 20 (Babcock and Hille 1998; Friel, D.D., unpublished data) gives an estimated change in [Ca2+]m of (1,000 nM)/(0.1 × 20) = 500 nM (see ) and a change in total mitochondrial Ca concentration of (4,000 × 500 nM) = 2 mM, which is similar to the rise in [Ca]m that would be predicted from the electron probe results assuming a constant rate of net mitochondrial Ca accumulation (13 s × 184 μΜ/s = 2.4 mM).
What Is the Physiological Role of Mitochondrial Calcium Transport at Low [Ca2+]i?
Mitochondrial Ca2+ transport may play a role in modulating cytosolic [Ca2+] signals (Thayer and Miller 1990; Friel and Tsien 1994; Hajnoczky et al. 1995; Jouaville et al. 1995; McGeown et al. 1996; Babcock et al. 1997; Hoth et al. 1997; Peng 1998), in buffering potentially cytotoxic Ca2+ loads (Werth and Thayer 1994; White and Reynolds 1995) and in regulating ATP synthesis so that it meets cellular energy demands (McCormack and Denton 1993; Robb-Gaspers et al. 1998). In the context of [Ca2+]i signaling, mitochondrial Ca2+ transport attenuates and prolongs stimulus-evoked [Ca2+]i signals. Since Ca2+ produces many of its cellular effects by interacting with binding proteins according to the principle of mass action (Wier 1990), such changes in the [Ca2+]i signal are likely to influence the impact of excitatory stimuli on [Ca2+]i-sensitive processes within the cell, such as action potential generation, synaptic transmission (Tang and Zucker 1997) and gene expression (Finkbeiner and Greenberg 1998). Our results confirm those of Baron and Thayer 1997 who showed that the mitochondrial Na+/Ca2+ exchanger is an important determinant of the plateau level. Modulation of the exchanger, for example by intracellular Na+, Mg2+, Ca2+ or spermine (reviewed in Gunter and Gunter 1994) would be expected to modify the kinetics of recovery after stimulation and thereby modify activity of Ca2+-sensitive effectors within the cytosol.
Traditionally, mitochondrial Ca2+ uptake has been viewed as a low affinity process that comes into play only when [Ca2+]i reaches high levels (>∼0.5–1 μM). However, results in the present study indicate that mitochondrial Ca2+ uptake via the uniporter occurs even when [Ca2+]i is much lower (200–300 nM). What is the physiological role of Ca2+ uptake at such low [Ca2+]i? One possibility arises in the context of Ca2+-regulated mitochondrial ATP production (McCormack and Denton 1993; Robb-Gaspers et al. 1998). As pointed out by Nicholls and Akerman 1982, ongoing mitochondrial Ca2+ transport would be more sensitive to modulation (for example by Ca2+) than transport requiring large suprathreshold [Ca2+]i elevations for activation. Also, in excitable cells, most mitochondria within the cell body lie far from plasma membrane Ca2+ channels that are the principal sites of Ca2+ entry; this contrasts with many nonexcitable cells, where receptor-mediated Ca2+ release may occur in close proximity to many mitochondria (Rizzuto et al. 1998). Thus, brief suprathreshold excitatory stimuli would evoke large [Ca2+]i elevations only near those mitochondria situated close to the plasma membrane, with the vast majority of mitochondria being exposed to lower [Ca2+]i via diffusion from the Ca2+ source. Based on studies in sympathetic neurons, radial [Ca2+]i gradients would be dissipated within a few seconds after a stimulus (Hernandez-Cruz et al. 1990; Hua et al. 1993). Subsequently, slow Ca2+ clearance would restore [Ca2+]i to basal levels. During the intervening time, [Ca2+]i levels beyond ∼200 nM would create an imbalance between mitochondrial Ca2+ uptake and release that favors net Ca2+ accumulation and a rise in [Ca2+]m. A small but prolonged increase in [Ca2+]m within the vast majority of mitochondria could make a significant contribution to overall ATP production. Moreover, during repetitive stimulation that leads to frequency-dependent increases in bulk [Ca2+]i <500 nM, small increases in [Ca2+]m could contribute to ATP production in anticipation of energy demands for processes triggered by periodic [Ca2+]i elevations, such as gene transcription (Fields et al. 1997).
Acknowledgments
The authors thank Drs. S.B. Andrews, S.W. Jones, D. Kunze, R.S. Lewis, and R.W. Tsien for their helpful comments on an earlier version of the manuscript.
This work was supported by grants from the American Heart Association (no. 96011490) and from the National Institutes of Health (NS 33514-03).
Relationship between Mitochondrial and Cytosolic Ca Fluxes
The net mitochondrial Ca2+ flux (Jmito) measured in this study can be compared with the rate of total mitochondrial Ca transport deduced from electron probe microanalysis (Pivovarova et al. 1999). Let J̃be the total net Ca2+ flux between all mitochondria and the cytosol at an instant in time (e.g., in mmol/s). This flux would cause mitochondrial total Ca concentration to change at a rate J̃/vm (e.g., mM/s), where vm is the mitochondrial volume. It would also cause the total cytosolic Ca concentration to change at a rate J̃/vi (vi is the cytosolic volume). If Ca2+ binding to cytosolic buffers reaches equilibrium rapidly and conforms to a single binding site model, this flux would cause the cytosolic free Ca concentration to change at a rate Jmito = J̃viκi T,where κi T is the ratio of the change in total Ca concentration that accompanies an infinitesimal change in [Ca2+]i ():
 |
1 |
Btotal,j is the total concentration of the jth cytosolic buffer and K d,j is the corresponding dissociation constant. The superscript specifies that κi Tis the ratio of total to free Ca concentration to distinguish it from the bound to free ratio (e.g., Neher and Augustine 1992). The relationship between Jmito and the mitochondrial total Ca flux (J̃/vm) is then:
 |
2 |
If [Ca2+]i < < K d,j for each buffer (),
 |
3 |
so that κi Tis independent of [Ca2+]i. Studies in several cell types have provided evidence that κi Tis approximately constant when [Ca2+]i < 1 μM (e.g., Tse et al. 1994), so for simplicity this will be assumed when estimating changes in [Ca]m that accompany changes in [Ca2+]i. Nevertheless, a rigorous test of this assumption is warranted.
The time integral of Jmito during the recovery provides information about the change in total mitochondrial Ca concentration [Ca]m from the instant of repolarization (t = 0) to time t. It is convenient to define the difference Δ[Ca]m(t) between [Ca]m at time t and the resting value measured when t is large [Ca]m(∞) ():
 |
4 |
 |
5 |
Solving for J̃/vm in above and substituting in gives :
 |
6 |
Assuming that the ratio of changes in total to free intramitochondrial Ca concentration (κm T) is constant, the change in free mitochondrial Ca concentration is ( and ):
 |
7 |
 |
8 |
where γ = (vm/vi)κm Tκi Tis the ratio of effective mitochondrial and cytoplasmic volumes. Multiplying both sides of this equation by γ shows that the integral of Jmito gives the change in [Ca2+]i that would result if the total mitochondrial flux from time 0 to t were deposited in a closed compartment having the same effective volume as the cytosol:
 |
9 |
where the superscript (i) identifies this as a change in cytosolic Ca concentration that accompanies a change in [Ca]m.
References
- Babcock D.F., Herrington J., Goodwin P.C., Park Y.B., Hille B. Mitochondrial participation in the intracellular Ca2+ network. J. Cell Biol. 1997;136:833–844. doi: 10.1083/jcb.136.4.833. [DOI] [PMC free article] [PubMed] [Google Scholar]
- Babcock D.F., Hille B. Mitochondrial oversight of cellular Ca2+ signaling. Curr. Opin. Neurobiol. 1998;8:398–404. doi: 10.1016/s0959-4388(98)80067-6. [DOI] [PubMed] [Google Scholar]
- Baron K.T., Thayer S.A. CGP 37157 modulates mitochondrial Ca2+ homeostasis in cultured rat dorsal root ganglion neurons. Eur. J. Pharmacol. 1997;340:295–300. doi: 10.1016/s0014-2999(97)01433-7. [DOI] [PubMed] [Google Scholar]
- Brinley F.J., Tiffert T., Scarpa A. Mitochondria and other calcium buffers of squid axon studied in situ. J. Gen. Physiol. 1978;72:101–127. doi: 10.1085/jgp.72.1.101. [DOI] [PMC free article] [PubMed] [Google Scholar]
- Budd S.L., Nicholls D.G. A reevaluation of the role of mitochondria in neuronal Ca2+ homeostasis. J. Neurochem. 1996;66:403–411. doi: 10.1046/j.1471-4159.1996.66010403.x. [DOI] [PubMed] [Google Scholar]
- Carafoli E. The calcium cycle of mitochondria. FEBS (Fed. Eur. Biochem. Soc.) Lett. 1979;104:1–5. doi: 10.1016/0014-5793(79)81073-x. [DOI] [PubMed] [Google Scholar]
- Chiesi M., Schwaller R., Eichenberger K. Structural dependency of the inhibitory action of benzodiazepines and related compounds on the mitochondrial Na+-Ca2+ exchanger. Biochem. Pharmacol. 1988;37:4399–4403. doi: 10.1016/0006-2952(88)90623-5. [DOI] [PubMed] [Google Scholar]
- Colegrove S.L., Friel D.D. The mitochondrial Na+/Ca2+ exchanger and its role in depolarization-induced [Ca2+]i responses in sympathetic neurons. Biophys. J. 1998;79:A38. [Google Scholar]
- Cox D.A., Matlib M.A. A role for the mitochondrial Na+-Ca2+ exchanger in the regulation of oxidative phosphorylation in isolated heart mitochondria. J. Biol. Chem. 1993;268:938–947. [PubMed] [Google Scholar]
- Cox D.A., Conforti L., Sperelakis N., Matlib M.A. Selectivity of inhibition of Na+ -Ca2+ exchange of heart mitochondrial by benzothiazepine CGP-37157. J. Cardiovasc. Pharmacol. 1993;21:595–599. doi: 10.1097/00005344-199304000-00013. [DOI] [PubMed] [Google Scholar]
- Crompton M., Moser R., Ludi H., Carafoli E. The interrelations between the transport of sodium and calcium in mitochondria of various mammalian tissues. Eur. J. Biochem. 1978;82:25–31. doi: 10.1111/j.1432-1033.1978.tb11993.x. [DOI] [PubMed] [Google Scholar]
- David G., Barrett J.N., Barrett E.F. Evidence that mitochondria buffer physiological Ca2+ loads in lizard motor nerve terminals. J. Physiol. 1998;509:59–65. doi: 10.1111/j.1469-7793.1998.059bo.x. [DOI] [PMC free article] [PubMed] [Google Scholar]
- Duchen M.R. Contributions of mitochondria to animal physiologyfrom homeostatic sensor to calcium signaling and cell death. J. Physiol. 1999;516:1–17. doi: 10.1111/j.1469-7793.1999.001aa.x. [DOI] [PMC free article] [PubMed] [Google Scholar]
- Fields R.D., Eshete F., Stevens B., Itoh K. Action potential-dependent regulation of gene expressiontemporal specificity in Ca2+, cAMP-responsive element binding proteins, and mitogen-activated protein kinase signaling. J. Neurosci. 1997;17:7252–7266. doi: 10.1523/JNEUROSCI.17-19-07252.1997. [DOI] [PMC free article] [PubMed] [Google Scholar]
- Fierro L., DiPolo R., Llano I. Intracellular calcium clearance in Purkinje cell somata from rat cerebellar slices. J. Physiol. 1998;510:499–512. doi: 10.1111/j.1469-7793.1998.499bk.x. [DOI] [PMC free article] [PubMed] [Google Scholar]
- Finkbeiner S., Greenberg M.E. Ca2+ channel-regulated neuronal gene expression. J. Neurobiol. 1998;37:171–189. [PubMed] [Google Scholar]
- Friel D.D., Tsien R.W. A caffeine- and ryanodine-sensitive Ca2+ store in bullfrog sympathetic neurones modulates effects of Ca2+ entry on [Ca2+]i . J. Physiol. 1992;450:217–246. doi: 10.1113/jphysiol.1992.sp019125. [DOI] [PMC free article] [PubMed] [Google Scholar]
- Friel D.D., Tsien R.W. An FCCP-sensitive Ca2+ store in bullfrog sympathetic neurons and its participation in stimulus-evoked changes in [Ca2+]i . J. Neurosci. 1994;14:4007–4024. doi: 10.1523/JNEUROSCI.14-07-04007.1994. [DOI] [PMC free article] [PubMed] [Google Scholar]
- Grynkiewicz G., Poenie M., Tsien R.Y. A new generation of Ca2+ indicators with greatly improved fluorescence properties. J. Biol. Chem. 1985;260:3440–3450. [PubMed] [Google Scholar]
- Gunter K.K., Gunter T.E. Transport of calcium by mitochondria. J. Bioenerg. Biomem. 1994;26:471–485. doi: 10.1007/BF00762732. [DOI] [PubMed] [Google Scholar]
- Gunter T.E., Pfeiffer D.R. Mechanisms by which mitochondria transport calcium. Am. J. Physiol. 1990;258:C755–C786. doi: 10.1152/ajpcell.1990.258.5.C755. [DOI] [PubMed] [Google Scholar]
- Hajnoczky G., Robb-Gaspers L.D., Seitz M.B., Thomas A.P. Decoding of cytosolic calcium oscillations in the mitochondria. Cell. 1995;82:415–424. doi: 10.1016/0092-8674(95)90430-1. [DOI] [PubMed] [Google Scholar]
- Hayat L.H., Crompton M. Evidence for the existence of regulatory sites for Ca2+ on the Na+/Ca2+ carrier of cardiac mitochondria. Biochem. J. 1982;202:509–518. doi: 10.1042/bj2020509. [DOI] [PMC free article] [PubMed] [Google Scholar]
- Hernandez-Cruz A., Sala F., Adams P.R. Subcellular calcium transients visualized by confocal microscopy in a voltage-clamped vertebrate neuron. Science. 1990;247:858–862. doi: 10.1126/science.2154851. [DOI] [PubMed] [Google Scholar]
- Herrington J., Park Y.B., Babcock D.F., Hille B. Dominant role of mitochondria in clearance of large Ca2+ loads from rat adrenal chromaffin cells. Neuron. 1996;16:219–228. doi: 10.1016/s0896-6273(00)80038-0. [DOI] [PubMed] [Google Scholar]
- Hoel P.G. Introduction to Mathematical Statistics. 4th edition. John Wiley & Sons; New York: 1971. [Google Scholar]
- Hoth M., Fanger C.M., Lewis R.S. Mitochondrial regulation of store-operated calcium signaling in T Lymphocytes. J. Cell Biol. 1997;137:633–648. doi: 10.1083/jcb.137.3.633. [DOI] [PMC free article] [PubMed] [Google Scholar]
- Hua S.Y., Nohmi M., Kuba K. Characteristics of Ca2+ release induced by Ca2+ influx in cultured bullfrog sympathetic neurons. J. Physiol. 1993;464:245–272. doi: 10.1113/jphysiol.1993.sp019633. [DOI] [PMC free article] [PubMed] [Google Scholar]
- Jouaville L.S., Ichas F., Holmuhamedov E.L., Camacho P., Lechleiter J.D. Synchronization of calcium waves by mitochondrial substrates in Xenopus laevis oocytes. Nature. 1995;377:438–441. doi: 10.1038/377438a0. [DOI] [PubMed] [Google Scholar]
- Matlib M.A., Zhou Z., Knight S., Ahmed S., Choi K.M., Krause J.B., Phillips R., Altschuld R., Katsube Y., Sperelakis N., Bers D.M. Oxygen-bridged dinuclear ruthenium amine complex specifically inhibits Ca2+ uptake into mitochondria in vitro and in situ in single cardiac myocytes. J. Biol. Chem. 1998;273:10223–10231. doi: 10.1074/jbc.273.17.10223. [DOI] [PubMed] [Google Scholar]
- McCormack J.G., Denton R.M. Mitochondrial Ca2+ transport and the role of intramitochondrial Ca2+ in the regulation of energy metabolism. Dev. Neurosci. 1993;15:165–173. doi: 10.1159/000111332. [DOI] [PubMed] [Google Scholar]
- McGeown J.G., Drummond R.M., McCarron J.G., Fay F.S. The temporal profile of calcium transients in voltage clamped gastric myocytes from Bufo marinus. J. Physiol. 1996;497:321–336. doi: 10.1113/jphysiol.1996.sp021771. [DOI] [PMC free article] [PubMed] [Google Scholar]
- Miller R.J. The control of neuronal Ca2+ homeostasis. Prog. Neurobiol. 1991;37:255–285. doi: 10.1016/0301-0082(91)90028-y. [DOI] [PubMed] [Google Scholar]
- Miller R.J. Mitochondria—the Kraken wakes! Trends Neurosci. 1998;21:95–97. doi: 10.1016/s0166-2236(97)01206-x. [DOI] [PubMed] [Google Scholar]
- Neher E., Augustine G.J. Calcium gradients and buffers in bovine chromaffin cells. J. Physiol. 1992;450:273–301. doi: 10.1113/jphysiol.1992.sp019127. [DOI] [PMC free article] [PubMed] [Google Scholar]
- Nicholls D., Akerman K. Mitochondrial calcium transport. Biochim. Biophys. Acta. 1982;683:57–88. doi: 10.1016/0304-4173(82)90013-1. [DOI] [PubMed] [Google Scholar]
- Peng Y.Y. Effects of mitochondrion on calcium transients in intact presynaptic terminals depend on frequency of nerve firing. J. Neurophysiol. 1998;80:186–195. doi: 10.1152/jn.1998.80.1.186. [DOI] [PubMed] [Google Scholar]
- Pivovarova N.B., Hongpaisan J., Andrews S.B., Friel D.D. Depolarization-induced mitochondrial Ca accumulation in sympathetic neuronsspatial and temporal characteristics. J. Neurosci. 1999;19:6372–6384. doi: 10.1523/JNEUROSCI.19-15-06372.1999. [DOI] [PMC free article] [PubMed] [Google Scholar]
- Rizzuto R., Pinton P., Carrington W., Fay F.S., Fogarty K.E., Lifshitz L.M., Tuft R.A., Pozzan T. Close contacts with the endoplasmic reticulum as determinants of mitochondrial Ca2+ responses. Science. 1998;280:1763–1766. doi: 10.1126/science.280.5370.1763. [DOI] [PubMed] [Google Scholar]
- Robb-Gaspers L.D., Burnett P., Rutter G.A., Denton R.M., Rizzuto R., Thomas A.P. Integrating cytosolic calcium signals into mitochondrial metabolic responses. EMBO (Eur. Mol. Biol. Organ.) J. 1998;17:4987–5999. doi: 10.1093/emboj/17.17.4987. [DOI] [PMC free article] [PubMed] [Google Scholar]
- Scarpa A., Graziotti P. Mechanisms for intracellular calcium regulation in heart. J. Gen. Physiol. 1973;62:756–772. doi: 10.1085/jgp.62.6.756. [DOI] [PMC free article] [PubMed] [Google Scholar]
- Tang Y., Zucker R.S. Mitochondrial involvement in post-tetantic potentiation of synaptic transmission. Neuron. 1997;18:483–491. doi: 10.1016/s0896-6273(00)81248-9. [DOI] [PubMed] [Google Scholar]
- Thayer S.A., Miller R.J. Regulation of the intracellular free calcium concentration in single rat dorsal root ganglion neurones in vitro. J. Physiol. 1990;425:85–115. doi: 10.1113/jphysiol.1990.sp018094. [DOI] [PMC free article] [PubMed] [Google Scholar]
- Tse A., Tse F.W., Hille B. Calcium homeostasis in identified rat gonadotrophs. J. Physiol. 1994;477:511–525. doi: 10.1113/jphysiol.1994.sp020212. [DOI] [PMC free article] [PubMed] [Google Scholar]
- Werth J.L., Thayer S.A. Mitochondria buffer physiological calcium loads in cultured rat dorsal root ganglion neurons. J. Neurosci. 1994;14:348–356. doi: 10.1523/JNEUROSCI.14-01-00348.1994. [DOI] [PMC free article] [PubMed] [Google Scholar]
- White J.R., Reynolds I.J. Mitochondria and Na+/Ca2+ exchange buffer glutamate-induced calcium loads in cultured cortical neurons. J. Neurosci. 1995;15:1318–1328. doi: 10.1523/JNEUROSCI.15-02-01318.1995. [DOI] [PMC free article] [PubMed] [Google Scholar]
- White R.J., Reynolds I.J. Mitochondria accumulate Ca2+ following intense glutamate stimulation of cultured rat forebrain neurons. J. Physiol. 1997;498:31–47. doi: 10.1113/jphysiol.1997.sp021839. [DOI] [PMC free article] [PubMed] [Google Scholar]
- Wier W.G. Cytoplasmic [Ca2+]i in mammalian ventricledynamic control by cellular processes. Annu. Rev. Physiol. 1990;52:467–485. doi: 10.1146/annurev.ph.52.030190.002343. [DOI] [PubMed] [Google Scholar]
- Wingrove D.E., Gunter T.E. Kinetics of mitochondrial calcium transport. J. Biol. Chem. 1986;261:15166–15171. [PubMed] [Google Scholar]
- Wingrove D.E., Amatruda J.M., Gunter T.E. Glucagon effects on the membrane potential and calcium uptake rate of rat liver mitochondria. J. Biol. Chem. 1984;259:9390–9394. [PubMed] [Google Scholar]
- Xu T., Naraghi M., Kang H., Neher E. Kinetic studies of Ca2+ binding and Ca2+ clearance in the cytosol of adrenal chromaffin cells. Biophys. J. 1997;73:532–545. doi: 10.1016/S0006-3495(97)78091-3. [DOI] [PMC free article] [PubMed] [Google Scholar]
- Zhou Z., Matlib M.A., Bers D.M. Cytosolic and mitochondrial Ca2+ signals in patch clamped mammalian ventricular myocytes. J. Physiol. 1998;507:379–403. doi: 10.1111/j.1469-7793.1998.379bt.x. [DOI] [PMC free article] [PubMed] [Google Scholar]