

Abstract
We studied the extracellular [HCOabstract 3 −] dependence of two renal clones of the electrogenic Na/HCO3 cotransporter (NBC) heterologously expressed in Xenopus oocytes. We used microelectrodes to measure the change in membrane potential (ΔVm) elicited by the NBC cloned from the kidney of the salamander Ambystoma tigrinum (akNBC) and by the NBC cloned from the kidney of rat (rkNBC). We used a two-electrode voltage clamp to measure the change in current (ΔI) elicited by rkNBC. Briefly exposing an NBC-expressing oocyte to HCOabstract 3 −/CO2 (0.33–99 mM HCOabstract 3 −, pHo 7.5) elicited an immediate, DIDS (4,4-diisothiocyanatostilbene-2,2-disulfonic acid)-sensitive and Na+-dependent hyperpolarization (or outward current). In ΔVm experiments, the apparent K m for HCOabstract 3 − of akNBC (10.6 mM) and rkNBC (10.8 mM) were similar. However, under voltage-clamp conditions, the apparent K m for HCOabstract 3 − of rkNBC was less (6.5 mM). Because it has been reported that SOabstract 3 =/HSO abstract 3 − stimulates Na/HCO3 cotransport in renal membrane vesicles (a result that supports the existence of a COabstract 3 = binding site with which SOabstract 3 = interacts), we examined the effect of SOabstract 3 =/HSO abstract 3 − on rkNBC. In voltage-clamp studies, we found that neither 33 mM SOabstract 4 = nor 33 mM SOabstract 3 =/HSOabstract 3 − substantially affects the apparent K m for HCO abstract 3 −. We also used microelectrodes to monitor intracellular pH (pHi) while exposing rkNBC-expressing oocytes to 3.3 mM HCOabstract 3 −/0.5% CO2. We found that SO abstract 3 =/HSOabstract 3 − did not significantly affect the DIDS-sensitive component of the pHi recovery from the initial CO2 -induced acidification. We also monitored the rkNBC current while simultaneously varying [CO2]o, pHo, and [COabstract 3 =]o at a fixed [HCOabstract 3 −]o of 33 mM. A Michaelis-Menten equation poorly fitted the data expressed as current versus [COabstract 3 =]o . However, a pH titration curve nicely fitted the data expressed as current versus pHo. Thus, rkNBC expressed in Xenopus oocytes does not appear to interact with SOabstract 3 =, HSOabstract 3 −, or COabstract 3 =.
Keywords: Xenopus oocytes, intracellular pH, extracellular pH, sulfite, carbonate
INTRODUCTION
Since its first description in the renal proximal tubule of the salamander Ambystoma tigrinum ( Boron and Boulpaep 1983), the electrogenic Na/HCO3 cotransporter has been functionally identified in a wide variety of cell types (for reviews, see Boron and Boulpaep 1989; Boron et al. 1997). After the expression cloning of the electrogenic Na/HCO3 cotransporter (NBC) from Ambystoma kidney (Romero et al. 1997a), closely related cDNAs have been cloned from human kidney ( Burnham et al. 1997), rat kidney ( Romero et al. 1998), and human pancreas and heart ( Abuladze et al. 1998a; Choi et al. 1999). An in situ hybridization study showed the presence of NBC mRNA in the renal proximal tubule of the rabbit (Abuladze et al. 1998b). Immunocytochemical studies with polyclonal NBC antibodies have localized the NBC protein to the basolateral membrane of the Ambystoma, rat, and rabbit renal proximal tubule (Schmitt et al. 1999), rat epididymis (Jensen et al. 1999), and human pancreatic duct (Marino et al. 1999).
The electrogenic Na/HCO3 cotransporter plays the major role in HCO3 − reabsorption by the renal proximal tubule (Alpern 1985; Yoshitomi et al. 1985). Several groups have determined the apparent K m for HCO 3 − [K m(HCO3 −)] of the Na/HCO3 cotransporter, as naturally expressed in cells. Working on monkey kidney epithelial (BSC-1) cells, Jentsch et al. 1985 measured DIDS (4,4-diisothiocyanatostilbene-2,2-disulfonic acid)-sensitive 22 Na+ uptake and estimated an apparent K m (HCO3 −) of 7–14 mM for extracellular HCO3 − at a [Na]o of 151 mM. Later, they demonstrated an inverse relationship between K m(HCO3 −) and [Na+] o (Jentsch et al. 1986). Akiba et al. 1986, in a study of 22Na+ fluxes in basolateral membrane vesicles from rabbit kidney cortex, obtained an apparent K m(HCO3 − ) of 10 mM at a [Na]o of 8 mM. Using a fluorescent probe thought to react with an amino acid near the substrate-binding site of NBC in solubilized membrane proteins from rabbit renal basolateral vesicles, Stim et al. 1994 obtained an apparent K m (HCO3 −) of 15 mM. The only study of the intracellular HCO3 − dependence of NBC is that of Gross and Hopfer 1998. These authors measured short-circuit current in an apically permeabilized monolayer of rat proximal-tubule (SKPT-0193) cells grown on filters. They obtained an apparent K m(HCO3 −) of 19 mM ([Na+] i = 10 mM, Vhold = −60 mV).
The cloning of NBC has made it possible to address the physiology of Na/HCO3 cotransport heterologously expressed in Xenopus oocytes. Under the conditions of our experiments, no other acid–base transporters are active in the oocyte. In the present study, in which we expressed Ambystoma kidney NBC (akNBC) or rat kidney NBC (rkNBC) in Xenopus oocytes, we had two major goals. The first was to determine the apparent K m of the two NBCs for extracellular HCO3 − under conditions of net HCO3 − influx. This uptake of HCO3 − is in the direction opposite the net HCO3 − efflux that normally occurs in the renal proximal tubule. Our approach was to measure the change in membrane potential (ΔVm) or change in current (ΔI) (under voltage-clamp conditions) as we added varying levels of HCO3 − /CO2 to the extracellular solution at a constant pH.
Our second goal was to examine the possibility that NBC can transport sulfite (SO3 =), bisulfite (HSO3 −), or carbonate (CO3 =); SO 3 = and HSO3 − would presumably substitute for CO3 = and HCO3 −, respectively. An earlier study with microelectrodes and 22Na+ fluxes provided no evidence that SO3 = substitutes for CO3 = or HCO3 − on the electrogenic Na/HCO3 cotransporter of cultured bovine corneal endothelial cells ( Jentsch et al. 1986). However, a later 22Na+ -uptake study on basolateral membrane vesicles isolated from rabbit kidney cortex led to the hypothesis that the electrogenic Na/HCO3 cotransporter has a binding site for CO3 =, and that SO3 = can substitute for CO3 = (Soleimani and Aronson 1989). In our experiments, we examined the effect of SO3 =/HSO3 − on both the apparent K m(HCO3 −) and on the pHi changes caused by rkNBC heterologously expressed in Xenopus oocytes. We found that SO3 =/HSO3 − had no significant effect on either, making it unlikely that rkNBC, as expressed by itself in oocytes, transports either SO3 = or HSO 3 −. To investigate a potential role for CO 3 =, we monitored rkNBC current while simultaneously varying [CO2]o, pHo, and [CO3 =]o at a constant [HCO3 − ]o. Based on the data from these experiments, we suggest that increased pHo stimulates NBC with a pK of 7.5, but that NBC does not interact with CO3 =.
METHODS
Preparation of Xenopus Oocytes
We prepared oocytes from Xenopus laevis (NASCO) by incubating small pieces of ovary for 45 min in a Ca2+-free ND96 solution (pH 7.5, room temperature) containing 2 mg/ml collagenase (Type IA, #C-2674; Sigma Chemical Co.). We washed the oocytes three times for 10 min each in Ca2+-free ND96, and then washed them again for an additional 20 min in Ca2+-containing ND96. Until we used the oocytes, we incubated them at 18°C in OR3 media. This medium is a 1:2 dilution in water of Leibovitz's L15 Medium (41300-039; GIBCO BRL), supplemented with 50 U/ml of penicillin-streptomycin (15140-122; GIBCO BRL), 10 mM of HEPES, and titrated to pH 7.5 with NaOH. 1 d after this isolation procedure, we injected stage V or VI oocytes with either water (50 nl/cell) or 0.2 μg/μl cRNA (50 nl/cell) encoding rkNBC or akNBC. We used oocytes expressing NBC in electrophysiological experiments 3–10 d after injection.
Solutions
Table summarizes the composition of standard solutions used in the present study. For experiments conducted in the absence of SO4 = or SO3 =/HSO3 −, our HEPES-buffered HCO3 − /CO2-free solution was Solution 1. This solution was noteworthy in that it contained only 7.6 mM Cl−, but 99 mM gluconate. Our standard HCO3 −/CO2 Solution 2 contained 66 mM gluconate and 33 mM HCO3 − (i.e., compared with Solution 1, 33 mM HCO3 − replaced 33 mM gluconate) and was equilibrated with 5% CO2, pH 7.5. We varied [HCO3 −] o from 0.66 to 99 mM at constant pHo by always maintaining the same ratio of [HCO3 −]/[CO 2]. For example, the solution containing 16.5 mM HCO3 − also contained 2.5% CO2. We maintained a constant [Cl−]o by exchanging HCO3 − for gluconate in the solutions. The CO2 /O2 mixtures with which we equilibrated our solutions were primary standard grade and analyzed; the mixing tolerance for the CO2 was 1% (TechAir). In all solutions, pH was 7.5.
Table 1.
Composition of Standard Solutions‡
| Component | 1 standardHEPES | 2 standardHCO3 − | 3 standardSO4 + HEPES | 4 standardSO4 + HCO3 − | 5 standardSO3 + HEPES | 6 standardSO3 + HCO3 − |
|---|---|---|---|---|---|---|
| mM | mM | mM | mM | mM | mM | |
| Na+ | 104 | 104 | 104 | 104 | 97.4 | 97.4 |
| K+ | 2 | 2 | 2 | 2 | 2 | 2 |
| Mg2+ | 1 | 1 | 1 | 1 | 1 | 1 |
| Ca2+ | 1.8 | 1.8 | 1.8 | 1.8 | 1.8 | 1.8 |
| Total cations, meq | 111.6 | 111.6 | 111.6 | 111.6 | 105 | 105 |
| Cl− | 7.6 | 7.6 | 7.6 | 7.6 | 7.6 | 7.6 |
| Gluconate− | 99 | 66 | 33 | 0 | 33 | 0 |
| HCO3 − | 0 | 33 | 0 | 33 | 0 | 33 |
| SO4 = | 0 | 0 | 33 | 33 | 0 | 0 |
| SO3 = | 0 | 0 | 0 | 0 | 26.4 | 26.4 |
| HSO3 − | 0 | 0 | 0 | 0 | 6.6 | 6.6 |
| HEPES− | 5 | 5 | 5 | 5 | 5 | 5 |
| Total anions, meq | 111.6 | 111.6 | 111.6 | 111.6 | 105 | 105 |
| Mannitol | 0 | 0 | 33 | 33 | 33 | 33 |
| HEPES (neutral) | 5 | 5 | 5 | 5 | 5 | 5 |
| pH | 7.5 | 7.5 | 7.5 | 7.5 | 7.5 | 7.5 |
‡Solutions containing 33 mM HCO3 − were equilibrated with 5% CO2.
The solutions containing SO4 = were similar to those described above, except that we replaced 66 of the 99 mM gluconate in the HEPES-buffered solution (Solution 3 in Table ) with 33 mM SO4 = and 33 mM mannitol. In the HCO3 − /CO2-containing solutions, we kept [SO4 = ] fixed at 33 mM, and substituted HCO3 − for gluconate. Because the solutions contained a maximal [gluconate]o of only 33 mM, we were limited to HCO3 − concentrations no higher than 33 mM.
The so-called “sulfite” solutions actually contained both SO 3 = and HSO3 − (pK 6.9). Thus, a pH 7.5 solution containing 33 mM “total SO3 = ” actually contains 26.4 mM SO3 = and 6.6 mM HSO3 −. Similar to the situation for the SO 4 = solutions, we replaced 66 of the 99 mM gluconate in the HEPES-buffered solution with 33 mM total SO3 = /HSO3 − and 33 mM mannitol (Solution 5 in Table ). In the HCO3 −/CO2 -containing solutions, we kept [total SO3 =/HSO 3 −]o fixed at 33 mM, but substituted HCO3 − for gluconate. In all solutions, pH was 7.5.
To determine the pHo or [CO3 =]o dependence of the NBC current, we used solutions containing a constant 33 mM HCO3 −. We varied pHo from 9.2 to 6.2 by equilibrating with gas mixtures having [CO2] values of 0.1–100%; as a result, [CO3 =] o varied from ∼3.5 μM to ∼3.5 mM. Our standard 33 mM HCO3 −/5% CO2 (Solution 2 in Table ) contained ∼70 μM CO3 = at pH 7.5.
In all solutions, [Cl−] was 7.6 mM, osmolarity was 225 mOsm, and temperature was 22°C. We delivered solutions continuously at a rate of 7 ml/min through Tygon (Tygon Norton Co.) tubing, which has a low permeability to CO2.
Voltage and pH-sensitive Microelectrodes
Vm measurements.
In some experiments, we used the change in membrane potential (ΔV m) elicited by switching from a HEPES-buffered solution to a HCO3 −/CO2-buffered solution as an index of the electrogenic flux mediated by NBC. We made the voltage microelectrodes by pulling borosilicate glass capillary tubing, 1.16 mm i.d. × 2.0 mm o.d. (GC200F-10; Warner Instruments Corp.) on a microelectrode puller (P-97; Sutter Instrument Co.), and then filling with 3 M KCl. The electrodes had resistances of 1–10 MΩ.
pHi measurements.
In some experiments, we used the rate of pHi increase (d pHi/dt) as an index of the flux of HCO3 − into oocytes expressing rkNBC. We made the pH microelectrodes using the same glass as described above, using an approach described previously (Siebens and Boron 1987; Nakhoul et al. 1998). We silanized the glass by exposing it to vapors of bis-(dimethylamino)-dimethylsilane (14755; Fluka Chemical Corp.). We filled the tips of these electrodes with hydrogen-ionophore-I (Cocktail B, #918882/1; Fluka Chemical Corp.) and back-filled the electrodes with a solution containing 15 mM NaCl, 230 mM NaOH, and 40 mM KH2PO4, pH 7.0. The pH microelectrodes had slopes of −54 to −59 mV per pH unit between pH values of 6.0 and 8.0. They had resistances of up to 100 MΩ. The voltage- and pH-sensitive microelectrodes were connected to high-impedance electrometers (FD223; World Precision Instruments, Inc.). The bath reference electrode was a calomel reference electrode (1362079; Fisher Scientific). We corrected for bath junction potentials.
Two-Electrode Oocyte Voltage Clamp
We voltage clamped oocytes using a two-electrode voltage clamp (OC-725B Oocyte Clamp; Warner Instrument Corp.). We impaled cells with microelectrodes filled with 3 M KCl (resistance = 0.3–1.0 MΩ). The holding potential (Vhold) was −60 mV. The currents were filtered at 20 Hz (four-pole Bessel filter).
Data Acquisition
The pHi, Vm, and Iout data were recorded digitally on 80486-based personal computer. The analogue-to-digital converter (ADC-30; Contec Microelectronics U.S.A., Inc.) sampled the Vm and pHi data at a rate of 0.4 Hz, and sampled the current data at a rate of 1 Hz. Software for data acquisition and analysis, as well as for fitting of the data, was developed in our laboratory.
Statistics and Data Analysis
We determined rates of pHi change (dpHi/ dt) by fitting a line to pHi versus time data using a linear least-squares method. All average dpHi/dt , ΔVm, and ΔI data are reported as mean ± SEM. For ratios, we present the averages as log-normal means. The statistical significance of log-normal data was determined using an unpaired Student's t test.
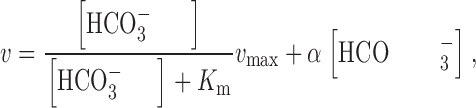
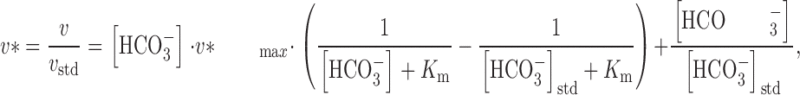
In analyzing ΔVm (or ΔI) data obtained in the absence of SO4 = or SO3 =/HSO3 − (i.e., when gluconate and HCO3 − were the major anions), we normalized absolute values of ΔVm (or ΔI) obtained under “test” conditions to bracketing values of ΔVm (or ΔI) obtained under “standard” conditions of 33 mM HCO3 −. As noted in the discussion, the simplest equation that adequately fitted our data was a model having a Michaelis-Menten dependence on [HCO3 −]o , plus a linear component:
 |
1 |
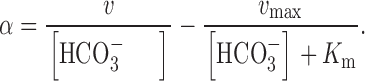
where v is an absolute value of the velocity of the reaction (i.e., ΔVm or ΔI) at each value of [HCO3 −], v max is the maximum velocity, and α is a constant. We can rearrange to obtain α as follows ():
 |
2 |
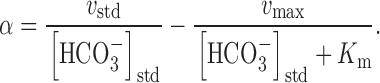
Under our standard conditions of [HCO3 −] = [HCO3 −]std = 33 mM, α becomes:
 |
3 |
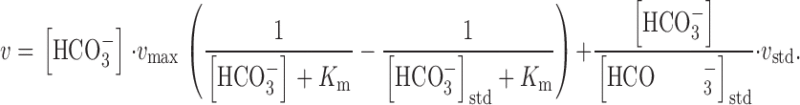
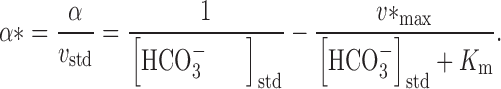
Substituting into yields:
 |
4 |
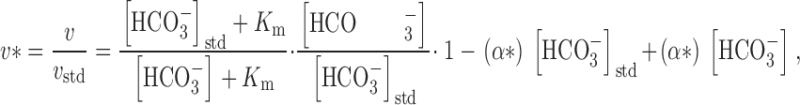
We define the normalized velocity (v*) to be the ratio of the observed velocity to the velocity under standard conditions (i.e., v * = v/v std). Substituting this definition of v* into , we have:
 |
5 |
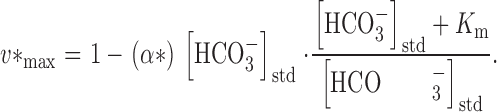
where the normalized v max is defined as v *max = v max/v std. We used a nonlinear least-squares curve fitting approach to obtain v* max and K m, and then computed the normalized α* = α/v std, using the following equation:
 |
6 |
In analyzing normalized ΔI data obtained in the presence of sulfate or sulfite, ([HCO3 −]o between 0 and 33 mM), we fitted the data with a normalized version of a function similar to , except that we assumed that α* was fixed to the same value obtained from the curve fit of the data obtained in the absence of sulfate or sulfite (see Table ). In this case, the equation for normalized data is:
 |
7 |
where α* = 0.00577 mM−1. After obtaining K m by curve fitting, we obtained the value of v* max using :
 |
8 |
Table 3.
Effect of SO4 = and SO3 =/HSO3 − on Kinetic Parameters of rkNBC ‡
| Major extracellular anion | K m(HCO3 −) | Relative v max | α* | n |
|---|---|---|---|---|
| mM | mM−1 | |||
| 66 mM gluconate− | 6.5 ± 0.7 | 0.97 ± 0.03 | 0.00577 | 58 |
| 33 mM SO4 = | 7.1 ± 0.5 | 0.98 | 0.00577 (fixed) | 24 |
| 26.4 mM SO3 =/6.6 mM HSO 3 − | 7.6 ± 0.6 | 0.99 | 0.00577 (fixed) | 48 |
‡The parameter values for 66 mM gluconate were obtained using and , whereas those for SO4 = and SO3 =/HSO3 − were obtained using and .
RESULTS
[HCO3 −]o Dependence of akNBC, Based on Changes in Vm
Effect of adding 33 mM HCO3 −/5% CO2 on pHi and Vm.
Fig. 1 A illustrates the results of an experiment on a water-injected (i.e., control) oocyte. As described previously (Romero et al. 1997a), switching the extracellular solution from one buffered with HEPES to one buffered with HCO3 −/CO2, at a constant pHo, causes a slow and sustained fall in pHi, as well as a slowly developing depolarization. These changes in pHi and Vm are fully reversible. Fig. 1 B illustrates the results of a similar experiment, but performed on an oocyte injected 3 d earlier with cRNA encoding rkNBC. Although there is a modest recovery of pHi from the initial CO2-induced acidification, the major difference between this experiment and the one in Fig. 1 A is that applying HCO3 − /CO2 elicited an immediate hyperpolarization of 85 mV. This hyperpolarization partially decayed over the course of 12 min. The slow pHi recovery and the large hyperpolarization are both consistent with the electrogenic influx of Na+ and HCO3 −. Previous work has shown that pretreating akNBC-expressing oocytes with DIDS blocks both the pHi recovery and the Vm changes (Romero et al. 1997a).
Figure 1.

Membrane potential and pHi of Xenopus laevis oocytes during a superfusion of 33 HCO3 −/5% CO2 solution. (A) Water-injected oocyte. The CO2/HCO3 − solution is Solution 2 in Table . Typical of six experiments. (B) Oocyte expressing rkNBC. Typical of nine experiments. pHo 7.5, 22°C.
Effect on Vm of adding graded levels of HCO3 −/CO2 at a constant pHo of 7.5.
The expression level of the akNBC clone, as judged in voltage-clamp experiments (not shown), was not sufficiently high to allow us to measure NBC currents accurately at low values of [HCO3 − ]o. To obtain a first approximation of the [HCO3 −]o dependence of akNBC, we monitored changes in Vm while briefly applying extracellular solutions containing various levels of HCO3 −/CO2 . Fig. 2 shows a typical experiment. We began with the oocyte in our standard gluconate-HEPES solution ( Table , Solution 1). We then switched to our standard gluconate-HCO 3 −/CO2 solution, which was buffered to pH 7.50 with 33 mM HCO3 − and 5% CO2 (Solution 2), and determined the maximal change in Vm (ΔVm). After returning the oocyte to the HEPES-buffered solution and waiting for Vm to stabilize, we exposed the cell to the first of five test HCO3 −/CO2 solutions, each having a pH of 7.50. During the rest of the experiment, we bracketed each test HCO3 −/CO2 pulse with a standard HCO3 −/CO2 pulse. To compensate for differences in the expression level of akNBC in individual oocytes, we then obtained a normalized ΔVm by computing the ratio of the ΔVm of the test pulse to the mean ΔVm of the two bracketing standard pulses.
Figure 2.

Membrane potential of akNBC-expressing Xenopus laevis oocytes during superfusion of solutions with different levels of HCO3 −/CO2. In our assay, we bracketed each test pulse with a pulse of the standard (std) CO2/HCO3 − solution (33 mM HCO3 −/5% CO 2, Solution 2 in Table ). We normalized the ΔVm under test conditions to the mean ΔVm for the bracketing std pulses. The HEPES-buffered solution was Solution 1 in Table . Typical of nine experiments.
Curve fitting.
As noted in the discussion, we attempted to fit the normalized akNBC data (Fig. 3, ▪) with a variety of “single-enzyme” rapid-equilibrium kinetic models. Visually, none of these fits was fully satisfactory. We also fitted our normalized ΔVm data with a model for two enzymes catalyzing the same reaction. Although this fit was visually satisfactory (not shown), the higher of the two K m(HCO3 − ) values (i.e., ∼231 mM) was far higher than the highest [HCO 3 −]o tested (i.e., 99 mM), and the standard deviation of this K m(HCO3 −) was more than twofold higher than the K m value. Therefore, we fitted the normalized ΔVm akNBC data with a kinetic model for a single Michaelis-Menten process plus a linear component (). The result of this fit is shown as the solid curve in Fig. 3. As summarized in Table , the apparent K m(HCO3 −) was 10.6 mM.
Figure 3.

[HCO3 −]o dependence of akNBC and rkNBC, based on ΔVm data. The solid curve represents the result of a nonlinear least-squares curve fit of to the akNBC data (▪) similar to those shown in Fig. 2 . The broken curve represents the result of a similar fit to the rkNBC data (□). Each symbol represents the mean of six to nine data points, obtained in separate experiments. The vertical bars represent SEMs; the bars are omitted when they are smaller than the size of the symbol. The kinetic parameters are summarized in the first two lines of Table .
Table 2.
[HCO3 −]o Dependence of akNBC and rkNBC‡
| NBC | K m (HCO3 −) | Relative v*max | α* | n | Method |
|---|---|---|---|---|---|
| mM | mM−1 | ||||
| akNBC | 10.6 ± 1.2 | 1.22 ± 0.06 | 0.00226 | 33 | Membrane voltage |
| rkNBC | 10.8 ± 4.4 | 1.25 ± 0.21 | 0.00177 | 45 | Membrane voltage |
| rkNBC | 6.5 ± 0.7 | 0.97 ± 0.03 | 0.00577 | 58 | Membrane current |
‡The parameter values were obtained using and .
[HCO3 −]o Dependence of rkNBC, Based on Changes in Vm
To compare the HCO3 − dependencies of rkNBC and akNBC, we used a protocol identical to that used in Fig. 2, except that we used oocytes expressing rkNBC rather than akNBC. The results of this series of rkNBC experiments are summarized (Fig. 3, □). The broken curve represents the result of the nonlinear least-squares fit of . The result is an apparent K m(HCO3 −) of 10.8 mM, which is not different from the value obtained for akNBC (Table ).
[HCO3 −]o Dependence of rkNBC, Studied in Voltage-clamped Oocytes
Because NBC is voltage dependent (Heyer et al. 1999), negative shifts in Vm produced by NBC would slow the very transporter responsible for the Vm change. Because the expression of rkNBC (as judged by NBC-dependent currents obtained under voltage-clamp conditions) was much higher than for akNBC, we elected to use the voltage-clamp approach to study the [HCO3 − ]o dependence of rkNBC.
Effect of 99 mM HCO3 − on membrane current.
Fig. 4 A shows that briefly exposing a control (i.e., H2O-injected) oocyte to a solution containing 99 mM HCO3 −/15% CO2 caused very little change in the membrane current (Vhold = −60 mV). However, as shown in Fig. 4 B, the same maneuver elicited an outward current of ∼500 nA in an oocyte expressing rkNBC. Fig. 4 C shows the results from a second oocyte expressing rkNBC. Here, the HCO3 −/CO 2 exposure caused almost no change in membrane current in the absence of Na+. Restoring the extracellular Na+ substantially increased the current elicited by adding 99 mM HCO3 −/15% CO2. Thus, the current elicited by HCO3 − depends on the expression of rkNBC and requires Na+. Previous work has shown that pretreating oocytes with 200 μM DIDS blocks the activity of rkNBC ( Romero et al. 1996, Romero et al. 1997b).
Figure 4.
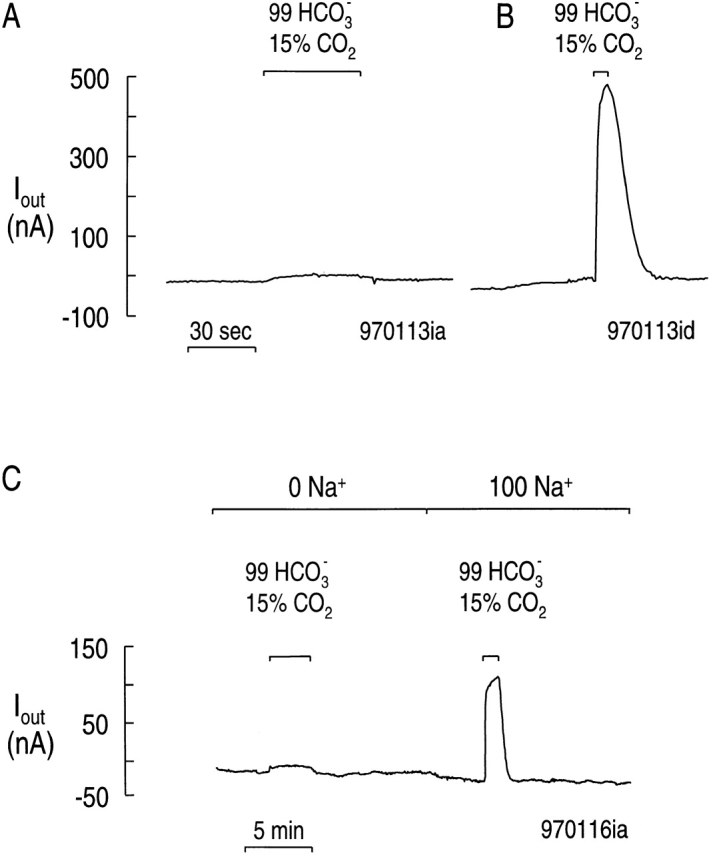
Dependence of HCO3 −-evoked currents on the expression rkNBC and the presence of Na+. (A) H2 O-injected, control oocyte. (B) Oocyte expressing rkNBC. (C) Effect of removing Na+ in an oocyte expressing rkNBC. In each case, we pulsed the oocyte with a pH 7.5 solution containing 99 mM HCO3 −/15% CO2. Vhold = −60 mV, 22°C.
Effect on membrane current of adding graded levels of CO2 /HCO3 − at a constant pHo of 7.5.
We used the peak amplitude of the current induced by exposing oocytes to HCO3 −/CO2 as a measure of the inward, electrogenic transport of Na+ and HCO3 − via rkNBC. Otherwise, the protocol we used was the same as in Fig. 2. A typical experiment is shown in Fig. 5. We computed a normalized ΔI by dividing the ΔI of the test pulse to the mean ΔI of the two bracketing standard pulses ([HCO3 −]o = 33 mM). The normalized ΔI data are summarized in Fig. 6 (•). The curve represents the result of a nonlinear least-squares fit of . The apparent K m (HCO3 −) was 6.5 mM (Table ). This K m(HCO3 −) value for rkNBC in ΔI experiments is substantially less than for the same clone in ΔVm experiments.
Figure 5.

Membrane current of rkNBC-expressing Xenopus laevis oocyte during superfusion of solutions with different levels of HCO3 −/CO2. The protocol for changing the extracellular solutions was the same as in Fig. 2 . The standard (std) solution contained 33 mM HCO3 −/5% CO2 (Table , Solution 2). Typical of eight experiments. Vhold = −60 mV, 22°C.
Figure 6.

[HCO3 −]o dependence of rkNBC current. The solid curve represents the result of a nonlinear least-squares curve fit of to the data (•) similar to those shown in Fig. 5. Each symbol represents the mean of five to eight data points obtained in separate experiments. The vertical bar represents the SEM; the bars are omitted when they are smaller than the size of the symbol. The kinetic parameters are summarized in the last line of Table .
Effect of Sulfate and Sulfite/Bisulfite on the [HCO3 −]o Dependence of the rkNBC Current
To test the hypothesis (see introduction) that NBC can transport SO3 = or HSO3 −, we first examined the effect of SO3 =/HSO3 − on membrane currents carried by rkNBC expressed in Xenopus oocytes. As a control, we examined the effects of another divalent anion, sulfate (SO4 =).
Effect of SO4 = and SO3 = on rkNBC current evoked by 33 mM HCO3 −.
Fig. 7 shows a voltage-clamp experiment in which we examined the effect of SO4 = and SO3 =/HSO3 − on the peak current produced by 33 mM HCO3 − in an oocyte expressing rkNBC. The changes in current evoked by 33 mM HCO3 − were virtually identical regardless of whether the dominant background anion was 66 mM gluconate, 33 mM SO4 = or 33 mM total SO3 =/HSO3 − (i.e., 26.4 mM SO3 = + 6.6 mM HSO 3 −). In a total of six similar experiments, the ratio of the current in SO4 = to the bracketing-paired currents in gluconate was 0.982. Similarly, in seven experiments, the ratio of the current in SO3 = /HSO3 − to the bracketing-paired currents in gluconate was 0.999. The difference between these mean ratios is not statistically significant (P = 0.13, one tail t test). Thus, under the conditions of our experiments, the current carried by rkNBC in 33 mM HCO3 − is virtually identical in the presence of SO4 = or SO3 = /HSO3 −. It is therefore likely that SO 3 =/HSO3 − per se has no effect on the NBC current.
Figure 7.

Effect of SO4 = and SO3 =/HSO 3 − on the current carried by rkNBC. The oocyte was exposed five times to a solution containing 33 mM HCO3 −/5% CO2. For the first, third, and fifth pulses, we switched from a HEPES solution (Table , Solution 1) to a solution containing 33 mM HCO3 −/5% CO2 solution (Table , Solution 2). For the second HCO3 −/CO2 pulse, we switched from a HEPES solution containing 33 mM SO4 = (Table , Solution 3) to a 33 mM HCO3 −/5% CO2 that also contained 33 mM SO4 = (Table , Solution 4). For the fourth HCO3 − /CO2 pulse, we switched from a HEPES-containing 33 mM SO3 =/HSO3 − (Table , Solution 5) to a 33-mM HCO3 −/5% CO2 solution that also contained 33 mM SO3 =/HSO3 − (Table , Solution 6). Typical of six experiments. Vhold = −60 mV, 22°C.
Effect of SO4 = and SO3 = on the extracellular HCO3 − dependence of the rkNBC current.
Fig. 8 summarizes the results of typical voltage-clamp experiments in which we examined the [HCO3 −]o dependence of the rkNBC current using the same protocol as in Fig. 5, but with either SO4 = (Fig. 8 A) or SO 3 =/HSO3 − (B) as the dominant anion. Because, in these experiments, [gluconate]o was only 33 mM when [HCO3 −]o was 0 mM, we could only investigate the HCO3 − dependence of NBC in the [HCO3 −]o range of 0–33 mM.
Figure 8.
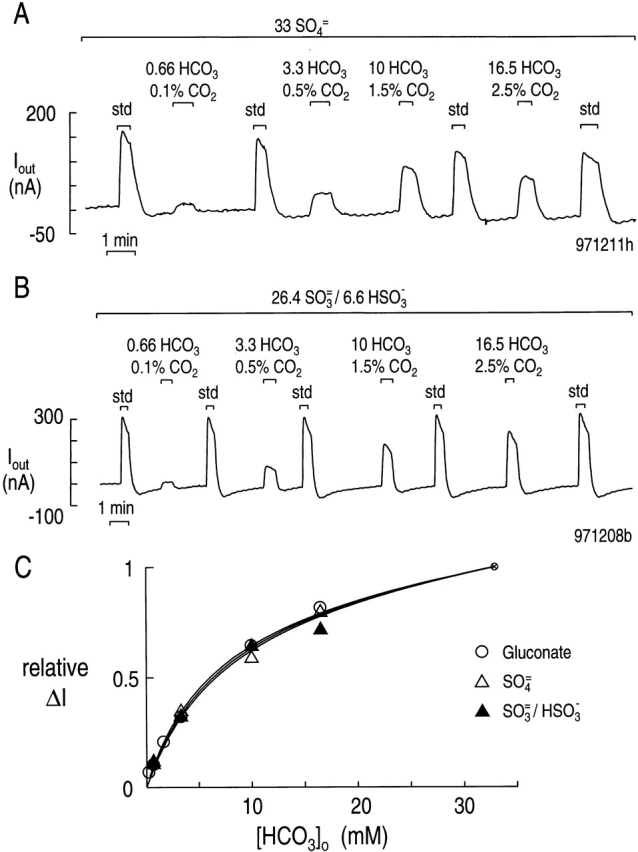
Effect of SO4 = and SO3 =/HSO 3 − on the [HCO3 −] o dependence of the current carried by rkNBC. (A) Experiments conducted in 33 mM SO4 =. The experimental protocol was the same as in Fig. 5, except that all solutions contained 33 mM SO4 =. Typical of eight experiments. Vhold = −60 mV, 22°C, pH 7.5. (B) Experiments conducted in 26.4 mM SO3 =/6.6 mM HSO 3 −. The protocol was the same as in A. Typical of 10 experiments. (C) Effect of SO4 = and SO3 =/HSO3 − on [HCO3 −]o dependency of rkNBC. One of the solid curves is the same as that in Fig. 6, and represents the fit of to the data obtained in the absence of SO4 = and SO3 =/HSO3 − (○). The other two solid curves represent the fits of to the data obtained in SO4 = (▵), as in A, and the data obtained in SO3 =/HSO 3 − (▴), as in B. Each symbol represents the mean of 6–17 data points, obtained in separate experiments. The bars representing SEM are omitted because they are smaller than the size of the symbol.
Fig. 8 C summarizes the data as well as the curve fits. Because the SO4 = and SO3 =/HSO3 − data in the range of 0–33 mM HCO3 − did not permit an accurate determination of a slope of the linear component (i.e., α*), we assumed that α* was the same as that obtained in the fit of the gluconate data in Fig. 6 ([HCO3 −]: 0–99 mM). The results of these curve fits ( ) are summarized in Table , and show that the apparent K m and vmax values are virtually identical, regardless of whether HCO3 − was varied in the presence of gluconate, SO4 = or SO3 = /HSO3 −.
Effect of Sulfite/Bisulfite on DIDS-sensitive pHi Change in Oocytes Expressing rkNBC
Is it possible that SO3 =/HSO3 − could ride rkNBC and yet not produce a change in current? If NBC could neither distinguish SO3 = from CO3 =, nor HSO3 − from HCO 3 −, then introducing SO3 = /HSO3 − would have no effect on the current carried by NBC if the transporter were already near v max. However, because the pK values governing the reactions SO 3 = + H+ ↔ HSO3 − and HSO3 − + H+ ↔ H2SO3 are so much lower than for the corresponding reactions involving CO3 =, HCO3 −, and H2CO3, the pHi changes for NBC carrying SO3 =/HSO3 − would be much slower than for NBC carrying CO3 =/HCO3 − (see discussion ). We therefore examined the possibility that SO3 = /HSO3 − would slow the pHi produced by NBC in the presence of CO2/HCO3 −.
Our assay was to expose an rkNBC-expressing oocytes to an extracellular solution buffered with 3.3 mM HCO3 −/0.5% CO 2. As shown in Fig. 9 A, an experiment conducted in the absence of SO3 =/HSO 3 −, applying HCO3 − /CO2 causes a rapid but small pHi decrease (a–b), followed by a pHi increase (b–c). After ∼30 min, when pHi was recovering at a constant rate in the HCO3 −/CO2 solution, we applied 1 mM DIDS for ∼15 min. This DIDS blocked the NBC-mediated alkalinization, unmasking a slow acidification (c–d). We took the difference between the alkalinization rate in the absence of DIDS (b–c) and the presence of DIDS (c–d) as an index of the net base influx mediated by rkNBC. In a total of five similar experiments, the DIDS-dependent alkalinization rate was 0.98 ± 0.27 × 10⁻⁴ pH U/s, with a mean initial pHi value of 7.34 ± 0.04.
Figure 9.

Effect of SO3 =/HSO3 − on the DIDS-sensitive recovery of pHi from a CO2 -induced acid load. (A) Absence of SO3 =/HSO 3 −. During the indicated time, the solution bathing an oocyte expressing rkNBC was switched from standard HEPES ( Table , Solution 1) to a solution containing 3.3 mM HCO3 −/0.5% CO2. During the pHi recovery from the CO2-induced acid load, we blocked rkNBC by applying 1 mM DIDS. (B) Presence of 26.4 mM SO3 =/6.6 mM HSO 3 −. The protocol was the same as in A, except that all solutions contained 26.4 mM SO3 =/6.6 mM HSO 3 −.
The experiment in Fig. 9 B is the same as in A, except that the oocyte was exposed to 26.4 mM SO3 = /6.6 mM HSO3 − during the application of the 3.3 mM HCO3 −/0.5% CO2 solution. In a total of six such experiments, the mean net base influx was 0.88 ± 0.38 × 10⁻⁴ pH U/s, which is not significantly different from the value in the absence of SO3 =/HSO3 − (P = 0.28, an unpaired one tail t test). The mean initial pHi in the SO3 =/HSO3 − experiments was 7.39 ± 0.06, which also is not significantly different from the value in the absence of SO3 =/HSO3 − (P = 0.20, unpaired two tail t test).
Effect of Altering [CO3 =]o and pHo on the Current Carried by rkNBC
Because the data introduced above make it unlikely that rkNBC, as expressed in Xenopus oocyte, interacts with HSO3 − or SO4 =, we asked whether rkNBC transports CO3 =. Our approach was to hold [HCO3 −]o constant at 33 mM while raising [CO 2] from 0.1% (pHo 9.2, [CO3 =] o = ∼3,500 μM) to 100% (pHo 6.2, [CO3 =]o = ∼3.5 μM). Our protocol was similar to that in Fig. 5, with two pulses of our standard solution (Table , Solution 2, [CO3 = ]o = ∼70 μM) bracketing each test pulse. Because CaCO3 precipitated from the pH 9.2 solution, which nominally contains ∼3,500 μM CO3 =, we replaced all Ca 2+ with Mg2+. Control experiments showed that this switch has no effect on the NBC current.
Fig. 10 A summarizes our results, expressed as normalized ΔI data as a function of [CO3 =] o. The dashed curve, which represents the best fit of a normalized Michaelis-Menten equation (total residual variance = 0.0341), systematically passes above or below points, depending where they lie along the curve. The solid curve, which represents the best fit of the normalized Michaelis-Menten equation plus a linear component [total residual variance (trv) = 0.0088], also systematically misfits the data. On the other hand, when we plot the same data as a function of pH o (Fig. 10 B), whether the best-fit pH titration curve (pK = 7.50 ± 0.05) passes above or below a point does not depend systematically on the position of the point. In addition, the total residual variance of this fit (trv = 0.0055) is comparable with that in Fig. 6 (trv = 0.0043).
Figure 10.
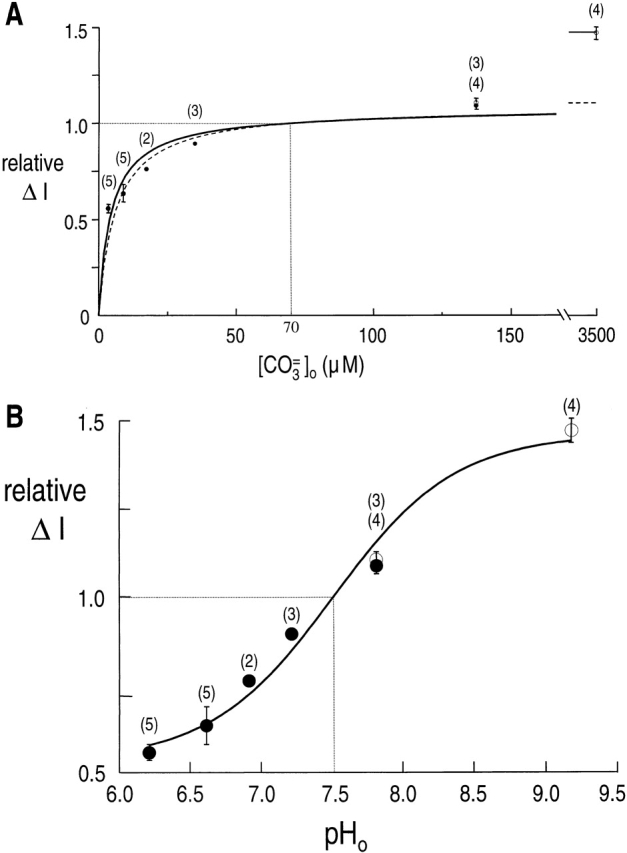
Effect of varying [CO3 =]o and pHo on the rkNBC current. (A) Relative rkNBC current as a function of [CO3 =]o. • represent data obtained in the presence of Ca2+, and ○, with Mg2+ replacing Ca2+. The dashed curve is the result of a nonlinear least-squares fit of the data by a normalized Michaelis-Menten equation. The best-fit value for K m(CO3 =) was 6.1 ± 1.5 μΜ, and for Imax, 1.09. The solid curve represents the best fit of the data by a normalized Michaelis-Menten equation plus a linear component. The best-fit value for K m(CO3 =) was 4.5 ± 0.6 μΜ, for Imax was 1.05, and for α was 0.000122 μΜ−1. (B) Relative rkNBC current as a function of pHo. The solid curve is the result of a nonlinear least-squares fit of the data by a normalized pH titration curve ( Boron and Knakal 1992). The best-fit value for pK was 7.50 ± 0.05. The number of determinations is given in parentheses. The vertical bars indicate SEM values; they are omitted where the length of the bar is smaller than the size of the symbol.
DISCUSSION
Why Is the NBC Current–[HCO3 −] o Relationship Not Sigmoidal?
As expressed in the Xenopus oocyte, rkNBC is electrogenic. This observation is consistent with a Na+:HCO3 − stoichiometry of 1:2, or perhaps 1:3, as has been observed in membrane vesicles prepared from rabbit kidney ( Soleimani et al. 1987). Recent voltage-clamp experiments suggest that rkNBC, at least as expressed in oocytes, has a stoichiometry of 1:2 (Heyer et al. 1999; Sciortino and Romero 1999). Thus, one would not be surprised if the relationship between NBC current and [HCO3 − ]o were more complex than a simple right-rectangular hyperbola, for example. In fact, we found that the current–[HCO 3 −]o relationship is well described by the sum of a hyperbola and a line. Why did we not observe a sigmoidal current–[HCO3 −]o relationship?
First, it is possible that, as expressed in Xenopus oocytes, rkNBC has but a single HCO3 −-related substrate. If rkNBC carried a single CO3 = (equivalent to two HCO3 −), then the Na+ :HCO3 − stoichiometry would be 1:2, and thus one would expect the current–[HCO3 − ]o relationship to be a right-rectangular hyperbola. Thus, our data are consistent with the hypothesis that rkNBC binds a single HCO3 − related species, CO3 =.
Second, if rkNBC carried two HCO3 − ions (for a stoichiometry of 1:2) or one HCO3 − and one CO3 = (for a stoichiometry of 1:3), then the current–[HCO3 −]o relationship might show a foot at low [HCO3 −]o, but only if the K m values for the two binding sites were sufficiently similar and high. For example, if rkNBC carried two HCO 3 − ions, and the K m values for one binding site was 6.5 mM (as observed), but the K m for the other was only 0.1 mM, then we would not have been able to detect a foot, given the precision of our data. Thus, our results are consistent with the hypothesis that rkNBC binds two HCO3 −-related species, but that we cannot detect a foot due to a low K m value.
Third, if rkNBC carried three HCO3 − ions (for a stoichiometry of 1:3), then the current–[HCO3 −]o relationship might show a foot, but, again, only if the K m values for all three were sufficiently similar and high. For example, if the K m values were 6.5, 6.5, and 0.1 mM, or 6.5, 0.1, and 0.1 mM, we would not have been able to detect a foot. Thus, our data are consistent with the hypothesis that rkNBC binds three HCO3 − , but that we cannot detect a foot due to a low K m value.
Fourth, it is possible that a systematic error in the way we monitored rkNBC activity may have masked a foot. For example, when we expose a cell to HCO3 −/CO2, rkNBC transports Na + and HCO3 − into the cell, and the passive entry of CO2 leads to the production of HCO3 − and H+. We attempted to minimize such effects by making our measurements very soon after exposing the cell to HCO3 −/CO2. Nevertheless, any buildup of intracellular Na+, HCO3 − , and/or H+ that might have occurred in the vicinity of rkNBC would have slowed the cotransporter; the effect would have been greater at higher HCO3 −/CO2 levels.
The “Linear Component”
The present study represents the first kinetic experiments on a member of the newly cloned NBC family. As suggested above, we would not have been surprised had the current–[HCO3 −]o relationship been sigmoidal. Instead, the shape of the relationship appears to be the sum of a hyperbola and a line. We could not adequately fit the current versus [HCO3 −]o data using any of several rapid-equilibrium models for random or ordered binding of HCO3 −/CO3 = to the cotransporter. We therefore suggest that some additional process, which is a first-order function of [HCO3 −]o, contributes to the current, especially at [HCO3 −]o values above 33 mM. This linear component is not present in water-injected oocytes. As shown in Fig. 4 A, the transition from HEPES to 99 mM HCO3 − caused a slow and small (∼6 nA) outward current in control oocytes. In contrast, as shown in Fig. 4 B, the same maneuver caused a rapid and large (∼490 nA) outward current in rkNBC-expressing oocytes.
The linear component also requires Na+. As shown in Fig. 4 C, a transition from Na+ -free HEPES to Na+-free 99 mM HCO3 − caused only slow and small (∼9 nA) outward current in rkNBC-expressing Xenopus oocytes. However, in the presence of Na +, the transition from HEPES to 99 mM HCO3 − produced a much larger current (∼140 nA). Because virtually the entire HCO3 −-induced current at 99 mM HCO3 − requires both rkNBC and Na+ , it is very likely that the linear component is carried by rkNBC or a closely related protein. What are the possible sources of the linear component of the current?
First, expression of rkNBC might induce the expression of a previously silent, endogenous NBC-like protein with a low affinity for HCO3 −. As described in several reports, the expression of exogenous membrane proteins induces various endogenous channels in Xenopus oocytes (Attali et al. 1993, Attali et al. 1995; Shimbo et al. 1995; Tzounopoulos et al. 1995; Buyse et al. 1997).
Second, the linear component could represent a parallel HCO3 −-conductance pathway that is part of rkNBC. The glutamate transporters (Fairman et al. 1995) have an intrinsic Cl− conductance, and the electroneutral Na/HCO3 cotransporter has an intrinsic conductance to Na+ (Choi, I., C. Aalkjaer, E.L. Boulpaep, and W.F. Boron, personal communication).
Third, it is possible that increases in [CO2] and/or [HCO 3 −] cause the Na+:HCO3 − stoichiometry of rkNBC to shift from, say, 1:2 to 1:3. If the turnover of rkNBC were governed by a classical kinetic model, then the shift in stoichiometry would lead to greater currents at greater values of [HCO3 −]o.
Fourth, it is possible that changes in the concentrations of gluconate and CO3 =, both of which chelate Ca2+, led to changes in free [Ca2+]o that affected NBC. However, in the series of experiments summarized in Fig. 10, we showed that replacing all Ca2+ with Mg2+ has no effect on the current carried by NBC.
Effect of Extracellular HSO3 −/SO3 = on rkNBC
We found that SO3 =/HSO3 − affected neither the currents (Fig. 7) nor the pHi changes (Fig. 9) produced by rkNBC as it functions as a heterologously expressed protein in Xenopus oocytes. To assess these results, we examined a series of models (Fig. 11, A–G and A′–G′) for how SO3 =/HSO3 − might interact with NBC, and predicted the effects of these interactions on the currents and pHi changes produced by NBC. In A and A′, we assume that neither SO3 = nor HSO3 − is capable of interacting with NBC, so that SO3 =/HSO3 − should have no effect on either NBC-mediated currents or pHi changes, as we in fact observed.
Figure 11.
Figure 11a.
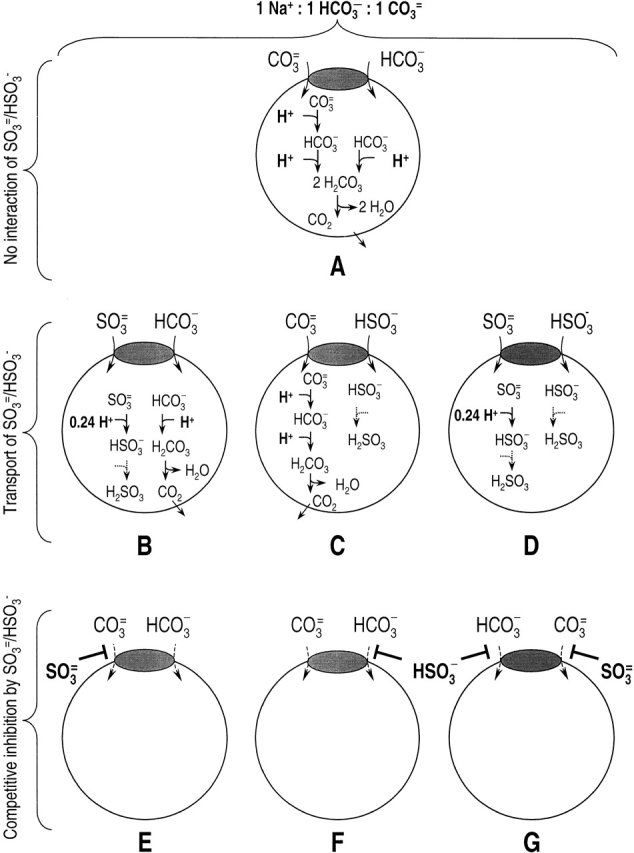
Figure 11b.
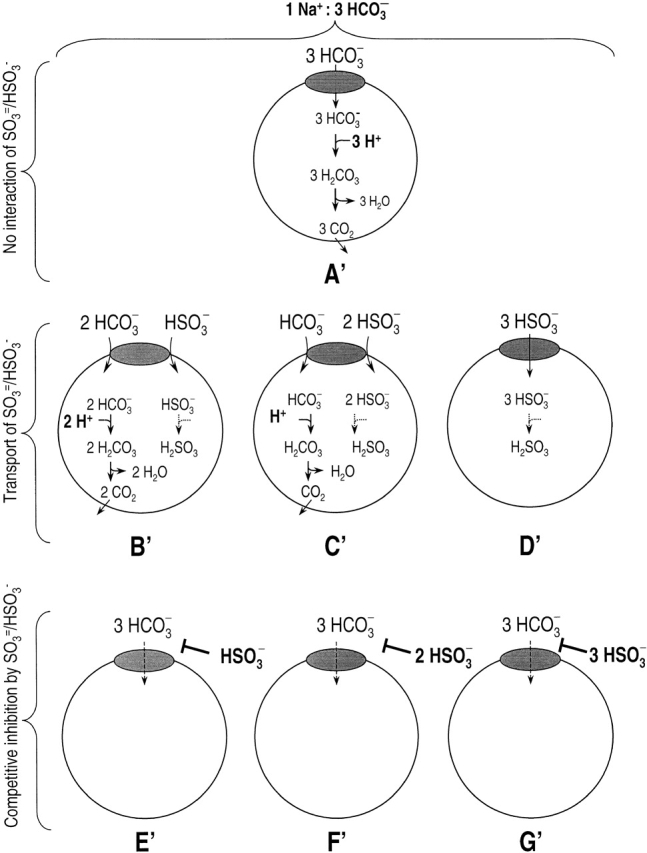
In Fig. 11b–D and Fig. b′– D′, NBC transports SO3 = and/or HSO3 −. Although it is conceivable that SO3 =/HSO3 − might not affect the currents that NBC carries (depending on the concentrations and K m values for SO3 = , HSO3 −, CO3 =, and HCO3 −), the pHi changes would be appreciably slower for three reasons. (a) The pK of the reaction SO3 = + H+ ↔ HSO3 − is ∼6.9, compared with ∼10 for the equilibrium CO3 = + H+ ↔ HCO3 − . (b) The pK of the reaction HSO3 − + H + ↔ H2SO3 is ∼1.6, compared with ∼3.4 for the equilibrium HCO3 − + H+ ↔ H2CO3. (c) [H2SO3 ]i is so low that the net efflux of H2SO3 is expected to be negligible. In contrast, H2CO3 forms CO2, which is present at relatively high concentrations and can rapidly exit the cell. The net effect is that incoming SO3 = and/or HSO3 − will neutralize fewer H+ than incoming CO3 = and/or HCO3 −. Because we found that SO3 =/HSO3 − had no effect on NBC-mediated pHi changes, Fig. 11b–D and Fig. b ′–D′, must be incorrect (i.e., NBC cannot transport SO3 = and/or HSO3 − under the conditions of our experiments).
In Fig. 11E–G and Fig. E′–G′, SO3 = and/or HSO3 − are competitive inhibitors for the transport of CO3 = and/or HCO3 −, respectively. In these cases, adding SO3 =/HSO3 − should decrease both the NBC current and pHi changes. Inasmuch as we found that SO3 =/HSO3 − had no effect on either, E–G and E′–G′ must be incorrect (i.e., neither SO3 = nor HSO3 − can competitively inhibit NBC under the conditions of our experiments).
Thus, we conclude that neither SO3 = nor HSO3 − interacts with rkNBC under the conditions of our experiments. This conclusion is in agreement with an observation of Jentsch et al. 1986 on bovine corneal endothelial cells. However, Soleimani and Aronson 1989, in studies on renal basolateral membrane vesicles, reported that SO3 = /HSO3 −, when applied in the presence of HCO3 −, stimulates 22Na uptake mediated by the Na/HCO3 cotransporter. Based on this and other data, those authors concluded that NBC transports Na+, CO3 =, and HCO3 − in a stoichiometry of 1:1:1, and that SO3 = can substitute for CO3 = at the CO3 = binding site. This line of reasoning was the first, and probably the strongest, evidence that NBC can transport CO3 =.
We could reconcile our data and those of Jentsch et al. 1986 with the data of Soleimani and Aronson 1989 by proposing that (a) oocytes and corneal endothelial cells have a “factor” that prevents the SO3 =/HSO3 − –rkNBC interaction, or (b) oocytes and corneal endothelial cells lack a factor required for the SO3 =/HSO3 −–rkNBC interaction. We think that the latter is more likely. The missing factor could be an enzyme(s) that catalyzes a posttranslational modification of NBC (e.g., phosphorylation) that is essential for the NBC–SO3 =/HSO3 − interaction, or the missing factor could be an additional NBC subunit that confers sensitivity to SO3 = /HSO3 −. Alternatively, the missing factor triggered by SO3 =/HSO3 − could be part of a purely regulatory pathway that modulates NBC (i.e., not an intrinsic part of NBC). Thus, although the rkNBC protein expressed in Xenopus oocytes can carry out all other known functions of the renal NBC, rkNBC by itself cannot interact with SO3 = or HSO3 −.
Effect of Altering [CO3 =]o and pHo on rkNBC
Fig. 10 shows the effect on the current carried by rkNBC of simultaneously varying [CO3 =] o and pHo. The best-fit Michaelis-Menten curve, with or without a linear component, fails to adequately fit the data, expressed in terms of [CO3 =]o (Fig. 10 A). On the other hand, the best-fit pH titration curve nicely fits the data, expressed in terms of pHo, over the entire range of pHo values. One possible explanation for these results is that rkNBC transports CO3 = with a K m of ∼6 μM, but that an idiosyncratic pHo sensitivity is responsible for the poor fits at the extreme [CO 3 =]o values. However, the most straightforward explanation for these data is that rkNBC is not sensitive to [CO3 =]o in the range 3.5–3,500 μM, but has a single titratable site that inhibits NBC when protonated. For example, this site could be an HCO3 − -binding site that has a lower affinity for its substrate when protonated. Note that we cannot rule out the possibility that rkNBC transports CO3 = with an extremely high affinity (i.e., a K m << 3.5 μM).
Acknowledgments
We thank Drs. C.L. Slayman, B.M. Schmitt, and M.O. Bevensee for helpful discussions. We are also indebted to Mr. D. Wong for developing the software.
This work was supported by grant from the National Institutes of Health to W.F. Boron (DK30344). I.I. Grichtchenko was supported by a fellowship from the American Heart Association (AHA), Connecticut Affiliate. M.F. Romero was supported by a Scientist Development Grant from the AHA.
Footnotes
Dr. Romero's present address is Department of Physiology & Biophysics and Pharmacology, Case Western Reserve University, School of Medicine, Cleveland, OH 44106-4970.
Portions of this work were previously published in abstract form (Grichtchenko, I.I., M.F. Romero, and W.F. Boron. 1996. J. Am. Soc. Nephrol. 7:1255. Grichtchenko, I.I., M.F. Romero, and W.F. Boron. 1997. 33rd Int. Congr. Physiol. Sci. P006.15. Grichtchenko, I.I., M.F. Romero, and W.F. Boron. 1998. FASEB J. 12:A638).
Abbreviation used in this paper: NBC, electrogenic Na/HCO3 cotransporter.
The log-normal mean was 0.982 +0.028/−0.027.
The log-normal mean was 0.999 +0.025/−0.025.
We compared NBC currents in two pH 7.8 solutions ([CO3 = ]o= ∼138 mM); one was a Ca2+ -containing solution in which we observed no precipitation, and the other was a solution in which Mg2+ replaced Ca2+. The ratio of NBC current in the pH 7.8, nominally Ca2+-free solution to the currents in the bracketing standard pH 7.5 solution had a log-normal mean of 1.097 +0.056/−0.054 (n = 3). The comparable ratio for the pH 7.8 Ca2+-containing solution had a log-normal mean of 1.079 +0.047/−0.047 (n = 4). The difference between these mean ratios is not statistically significant ( P = 0.318, one tail t test).
, but with [CO3 = ]replacing [HCO3 −].The standard [CO3 = ]was 70 μM.
We modeled a rapid-equilibrium, random terreactant system ( Segel 1993) with dissociation constants of 6.5, 6.5 (or 0.1), and 0.1 mM, and interaction factors of α = β = 1.
We explored the following random-binding models for HCO3 −-related species: 2 HCO3 −, 3 HCO3 −, 1 HCO3 − + 1 CO3 =. We also tested the following ordered-binding models: 2 HCO3 −, 3 HCO3 − , HCO3 − then CO3 = , CO3 = then HCO3 −.
We modeled a rapid-equilibrium, random bireactant system ( Segel 1993) with dissociation constants of 6.5 and 0.1 mM, and interaction factors of α = β = 1.
References
- Abuladze N. , Lee I. , Newman D. , Hwang J. , Boorer K. , Pushkin A. , Kurtz I. Molecular cloning, chromosomal localization, tissue distribution, and functional expression of the human pancreatic sodium bicarbonate cotransporter J. Biol. Chem. 273 1998 . 17689 17695a [DOI] [PubMed] [Google Scholar]
- Abuladze N. , Lee I. , Newman D. , Hwang J. , Pushkin A. , Kurtz I. Axial heterogeneity of sodium-bicarbonate cotransporter expression in the rabbit proximal tubule Am. J. Physiol. Renal Physiol 274 1998 . F628 F633b [DOI] [PubMed] [Google Scholar]
- Akiba T. , Alpern R.J. , Eveloff J. , Calamina J. , Warnock D.G. Electrogenic sodium/bicarbonate cotransport in rabbit renal cortical basolateral membrane vesicles. J. Clin. Invest. 1986 ;78:1472–1478 . doi: 10.1172/JCI112738. [DOI] [PMC free article] [PubMed] [Google Scholar]
- Alpern R.J. Mechanism of basolateral membrane H+/OH− /HCO3 − transport in the rat proximal convoluted tubule. A sodium-coupled electrogenic process. J. Gen. Physiol. 1985 ;86:613–636 . doi: 10.1085/jgp.86.5.613. [DOI] [PMC free article] [PubMed] [Google Scholar]
- Attali B. , Guillemare E. , Lesage F. , Honore E. , Romey G. , Lazdunski M. , Barhanin J. The protein IsK is a dual activator of K+ and Cl − channels. Nature. 1993 ;365:850–852 . doi: 10.1038/365850a0. [DOI] [PubMed] [Google Scholar]
- Attali B. , Latter H. , Rachamim N. , Garty H. A corticosteroid-induced gene expressing an “IsK-like” K+ channel activity in Xenopus oocytes. Proc. Natl. Acad. Sci. USA. 1995 ;92:6092–6096 . doi: 10.1073/pnas.92.13.6092. [DOI] [PMC free article] [PubMed] [Google Scholar]
- Boron W.F. , Boulpaep E.L. Intracellular pH regulation in the renal proximal tubule of the salamanderbasolateral HCO3 − transport . J. Gen. Physiol. 1983 ;81:53–94 . doi: 10.1085/jgp.81.1.53. [DOI] [PMC free article] [PubMed] [Google Scholar]
- Boron W.F. , Boulpaep E.L. The electrogenic Na/HCO3 cotransporter. Kidney Int. 1989 ;36:392–402 . doi: 10.1038/ki.1989.208. [DOI] [PubMed] [Google Scholar]
- Boron W.F. , Hediger M.A. , Boulpaep E.L. , Romero M.F. The renal electrogenic Na+:HCO3 − cotransporter. J. Exp. Biol. 1997 ;200:263–268 . doi: 10.1242/jeb.200.2.263. [DOI] [PubMed] [Google Scholar]
- Boron W.F. , Knakal R.C. Na+-dependent Cl-HCO3 exchange in the squid axon. Dependence on extracellular pH. J. Gen. Physiol. 1992 ;99:817–837 . doi: 10.1085/jgp.99.5.817. [DOI] [PMC free article] [PubMed] [Google Scholar]
- Burnham C.E. , Amlal H. , Wang Z. , Shull G.E. , Soleimani M. Cloning and functional expression of a human kidney Na+ :HCO3 − cotransporter. J. Biol. Chem. 1997 ;272:19111–19114 . doi: 10.1074/jbc.272.31.19111. [DOI] [PubMed] [Google Scholar]
- Buyse G. , Voets T. , Tytgat J. , De Greef C. , Droogmans G. , Nilius B. , Eggermont J. Expression of human pICln and ClC-6 in Xenopus oocytes induces an identical endogenous chloride conductance. J. Biol. Chem. 1997 ;272:3615–3621 . doi: 10.1074/jbc.272.6.3615. [DOI] [PubMed] [Google Scholar]
- Choi I. , Romero M.F. , Khandoudi N. , Bril A. , Boron W.F. Cloning and characterization of a human electrogenic Na+ -HCO3 − cotransporter isoform (hhNBC) . Am. J. Physiol. Cell Physiol. 1999 ;276:C576–C584 . doi: 10.1152/ajpcell.1999.276.3.C576. [DOI] [PubMed] [Google Scholar]
- Fairman W.A. , Vandenberg R.J. , Arriza J.L. , Kavanaugh M.P. , Amara S.G. An excitatory amino-acid transporter with properties of a ligand-gated chloride channel. Nature. 1995 ;375:599–603 . doi: 10.1038/375599a0. [DOI] [PubMed] [Google Scholar]
- Gross E. , Hopfer U. Voltage and cosubstrate dependence of the Na-HCO3 cotransporter kinetics in renal proximal tubule cells. Biophys. J. 1998 ;75:810–824 . doi: 10.1016/S0006-3495(98)77570-8. [DOI] [PMC free article] [PubMed] [Google Scholar]
- Heyer M. , Müller-Berger S. , Romero M.F. , Boron W.F. , Frömter E. Stoichiometry of the rat kidney Na+-HCO3 − cotransporter expressed in Xenopus laevis oocytes. Pflügers Arch. 1999 ;438:322–329 . doi: 10.1007/s004240050916. [DOI] [PubMed] [Google Scholar]
- Jensen L. , Schmitt B.M. , Brown D. , Berger U.V. , Hediger M.A. , Boron W.F. , Breton S. Localization of sodium bicarbonate co-transporter (NBC) protein and mRNA in rat epididymis. Biol. Reprod. 1999 ;60:573–579 . doi: 10.1095/biolreprod60.3.573. [DOI] [PubMed] [Google Scholar]
- Jentsch T.J. , Schill B.S. , Schwartz P. , Matthes H. , Keller S.K. , Wiederholt J. Kidney epithelial cells of monkey origin (BSC-1) express a sodium bicarbonate cotransport. J. Biol. Chem. 1985 ;260:15554–15560 . [PubMed] [Google Scholar]
- Jentsch T.J. , Schwartz P. , Schill B.S. , Langner B. , Lepple A.P. , Keller S.K. , Wiederholt M. Kinetic properties of the sodium bicarbonate (carbonate) symport in monkey kidney epithelial cells (BSC-1) J. Biol. Chem. 1986 ;261:10673–10679 . [PubMed] [Google Scholar]
- Marino C.R. , Jeanes V. , Boron W.F. , Schmitt B.M. Expression and distribution of the Na+-HCO3 − cotransporter in human pancreas. Am. J. Physiol. Gastrointest. Liver Physiol. 1999 ;277:G487–G494 . doi: 10.1152/ajpgi.1999.277.2.G487. [DOI] [PubMed] [Google Scholar]
- Nakhoul N.L. , Davis B.A. , Romero M.F. , Boron W.F. Effect of expressing the water channel aquaporin-1 on the CO2 permeability of Xenopus oocytes. Am. J. Physiol. Cell Physiol. 1998 ;274:C543–C548 . doi: 10.1152/ajpcell.1998.274.2.C543. [DOI] [PubMed] [Google Scholar]
- Romero M.F. , Fong P. , Berger U.V. , Hediger M.A. , Boron W.F. Cloning and functional expression of rNBC, an electrogenic Na+ -HCO3 − cotransporter from rat kidney . Am. J. Physiol. Renal Physiol. 1998 ;274:F425–F432 . doi: 10.1152/ajprenal.1998.274.2.F425. [DOI] [PubMed] [Google Scholar]
- Romero M.F. , Hediger M.A. , Boulpaep E.L. , Boron W.F. Cloning and functional expression of the rat renal electrogenic Na/HCO3 cotransporter (rNBC) J. Am. Soc. Nephrol. 7 1996 . 1259(Abstr.) [Google Scholar]
- Romero M.F. , Hediger M.A. , Boulpaep E.L. , Boron W.F. Expression cloning and characterization of a renal electrogenic Na +/HCO3 − cotransporter Nature 387 1997 . 409 413a [DOI] [PubMed] [Google Scholar]
- Romero M.F. , Hediger M.A. , Fong P. , Boron W.F. Expression of the rat renal electrogenic Na/HCO3 cotransporter (rkNBC) FASEB J. 11 1997 . 25b (Abstr.) [Google Scholar]
- Schmitt B.M. , Biemesderfer D. , Romero M.F. , Boulpaep E.L. , Boron W.F. Immunolocalization of the electrogenic Na+/HCO3 − cotransporter in mammalian and amphibian kidney . Am. J. Physiol. Renal Physiol. 1999 ;276:F27–F36 . doi: 10.1152/ajprenal.1999.276.1.F27. [DOI] [PubMed] [Google Scholar]
- Sciortino C.M. , Romero M.F. Cation and voltage dependence of rat kidney electrogenic Na+ -HCO3 − cotransporter, rkNBC, expressed in oocytes. Am. J. Physiol. Renal Physiol. 1999 ;277:F611–F623 . doi: 10.1152/ajprenal.1999.277.4.F611. [DOI] [PubMed] [Google Scholar]
- Segel I.H. Enzyme Kinetics 1993 . John Wiley & Sons, Inc; New York, NY : pp. 957 [Google Scholar]
- Shimbo K. , Brassard D.L. , Lamb R.A. , Pinto L.H. Viral and cellular small integral membrane proteins can modify ion channels endogenous to Xenopus oocytes. Biophys. J. 1995 ;69:1819–1829 . doi: 10.1016/S0006-3495(95)80052-4. [DOI] [PMC free article] [PubMed] [Google Scholar]
- Siebens A.W. , Boron W.F. Effect of electroneutral luminal and basolateral lactate transport on intracellular pH in salamander proximal tubules. J. Gen. Physiol. 1987 ;90:799–831 . doi: 10.1085/jgp.90.6.799. [DOI] [PMC free article] [PubMed] [Google Scholar]
- Soleimani M. , Aronson P.S. Ionic mechanism of sodium bicarbonate cotransport in rabbit renal basolateral membrane vesicles. J. Biol. Chem. 1989 ;264:18302–18308 . [PubMed] [Google Scholar]
- Soleimani M. , Grassl S.M. , Aronson P.S. Stoichiometry of Na+-HCO3 − cotransport in basolateral membrane vesicles isolated from rabbit renal cortex. J. Clin. Invest. 1987 ;79:1276–1280 . doi: 10.1172/JCI112948. [DOI] [PMC free article] [PubMed] [Google Scholar]
- Stim J. , Bernardo A.A. , Kear F.T. , Qiu Y.Y. , Arruda J.A.L. Renal cortical basolateral Na+/HCO3 − cotransporterII. Detection of conformational changes with fluorescein isothiocyanate labeling. J. Membr. Biol. 1994 ;140:39–46 . doi: 10.1007/BF00234484. [DOI] [PubMed] [Google Scholar]
- Tzounopoulos T. , Maylie J. , Adelman J.P. Induction of endogenous channels by high levels of heterologous membrane proteins in Xenopus oocytes. Biophys. J. 1995 ;69:904–908 . doi: 10.1016/S0006-3495(95)79964-7. [DOI] [PMC free article] [PubMed] [Google Scholar]
- Yoshitomi K. , Burckhardt B.C. , Frömter E. Rheogenic sodium-bicarbonate cotransport in the peritubular cell membrane of rat renal proximal tubule. Pflügers Arch. 1985 ;405:360–366 . doi: 10.1007/BF00595689. [DOI] [PubMed] [Google Scholar]