Abstract
The Xenopus oocyte expression system was used to explore the mechanisms of inhibition of the cloned rat epithelial Na+ channel (rENaC) by PKC (Awayda, M.S., I.I. Ismailov, B.K. Berdiev, C.M. Fuller, and D.J. Benos. 1996. J. Gen. Physiol. 108:49–65) and to determine whether human ENaC exhibits similar regulation. Effects of PKC activation on membrane and/or channel trafficking were determined using impedance analysis as an indirect measure of membrane area. hENaC-expressing oocytes exhibited an appreciable activation by hyperpolarizing voltages. This activation could be fit with a single exponential, described by a time constant (τ) and a magnitude (ΔI V). A similar but smaller magnitude of activation was also observed in oocytes expressing rENaC. This activation likely corresponds to the previously described effect of hyperpolarizing voltage on gating of the native Na+ channel (Palmer, L.G., and G. Frindt. 1996. J. Gen. Physiol. 107:35–45). Stimulation of PKC with 100 nM PMA decreased ΔIV in hENaC-expressing oocytes to a plateau at 57.1 ± 4.9% (n = 6) of baseline values at 20 min. Similar effects were observed in rENaC-expressing oocytes. PMA decreased the amiloride-sensitive hENaC slope conductance (gNa) to 21.7 ± 7.2% (n = 6) of baseline values at 30 min. This decrease was similar to that previously reported for rENaC. This decrease of g Na was attributed to a decrease of membrane capacitance (C m), as well as the specific conductance (gm/Cm ). The effects on gm/Cm reached a plateau within 15 min, at ∼60% of baseline values. This decrease is likely due to the specific ability of PKC to inhibit ENaC. On the other hand, the decrease of Cm was unrelated to ENaC and is likely an effect of PKC on membrane trafficking, as it was observed in ENaC-expressing as well as control oocytes. At lower PMA concentrations (0.5 nM), smaller changes of Cm were observed in rENaC- and hENaC-expressing oocytes, and were preceded by larger changes of gm and by changes of gm/Cm, indicating specific effects on ENaC. These findings indicate that PKC exhibits multiple and specific effects on ENaC, as well as nonspecific effects on membrane trafficking. Moreover, these findings provide the electrophysiological basis for assessing channel-specific effects of PKC in the Xenopus oocyte expression system.
Keywords: epithelial Na+ channel, Xenopus oocytes, protein kinase C, impedance analysis, trafficking
INTRODUCTION
A variety of preparations have been used to investigate the regulation of epithelial Na+ channels by PKC. Purified channels have been studied after isolation and incorporation into planar lipid bilayers, or in isolated vesicle preparations. Native channels have been studied by patch clamp analysis, noise analysis, and impedance analysis. Different native epithelia as well as cultured epithelia have been used to study this regulation (for review, see Palmer 1992; Benos et al. 1995; Eaton et al. 1995; and Garty and Palmer 1997).
By far the majority of studies examining the effects of PKC on epithelial Na+ channel (ENaC) have used purified PKC itself or the phorbol ester PMA as a potent general activator of PKC. Ling and Eaton 1989 demonstrated by patch clamp analysis that PKC activation inhibits open channel density. Mohrmann et al. 1987 have shown that PKC stimulation causes inhibition of Na+ transport in LLC-PK1 cells. Silver et al. 1993 have demonstrated that activation of PKC via Ca2+-dependent mechanisms causes a decrease of Na+ channel activity in the rat cortical collecting duct. Similarly, Oh et al. 1993, from measurements on purified Na+ channels reconstituted into planar lipid bilayers, have confirmed these observations. These findings are contradictory to those of Civan et al. 1987, who reported a stimulation of Na+ transport in frog skin after the addition of phorbol ester, or other synthetic diacylglycerols, and to Rouch et al. 1993, who did not observe any effects of PKC stimulation on the rat cortical collecting duct. Recently, Els et al. 1998 reported a biphasic effect of PMA in the same epithelium, whereby variable and transient increases of Na+ transport in A6 epithelia and in frog skin were observed and were followed by sustained inhibition.
The mechanisms by which PKC affects epithelial Na+ channels have included changes of channel open probability (P o ), as well as channel density (NT) (see above references). This indicates that the potential presence of multiple effects of PKC on the Na+ channel. However, the specificity of these effects, especially those that involve NT or channel activity (NP o) are undetermined due to the lack of comparable studies on the same tissue in the absence of Na+ channel expression. This is an important factor to consider given the reported ability of PMA and presumably PKC to promote endocytosis (see Aballay et al. 1999). This may result in inhibition of membrane-bound transporters independent of whether they can interact with PKC (see Beron et al. 1997).
The effect of PKC on αβγ rat ENaC (rENaC) expressed in Xenopus oocytes was examined by Awayda et al. 1996. Activation of PKC by PMA or by direct injection of purified rat brain PKC caused inhibition of αβγ rENaC. However, the mechanisms of these effects and whether they are observed in other ENaC homologues are undetermined.
To determine the mechanisms of action and to assess the specific and nonspecific effects of PMA on ENaC, I used techniques of two-electrode voltage clamp and impedance analysis. The effects of PMA on both the membrane capacitance and conductance of both control and ENaC-expressing oocytes were examined. I also examined the effects of PMA on the voltage-induced activation. As reported by Palmer and Frindt 1996, this activation is an intrinsic property of the channel and is likely the result of a direct interaction of Vm with the native ENaCs.
I report that both rat and human ENaCs are inhibited by 100 nM PMA. This inhibition was accompanied by a decrease in the voltage-induced activation at −100 mV (ΔIV). The changes in this parameter may indicate a direct effect of PKC on ENaC. PMA also decreased Cm in both control and ENaC-expressing oocytes, indicating that a component of ENaC's inhibition by PKC is due to general membrane endocytosis. However, PMA caused additional changes of gm unrelated to changes of Cm, as evidenced by a decrease of the specific membrane conductance (gm/Cm). These changes indicate the presence of specific effects of PKC on ENaC.
PMA at a concentration of 0.5 nM caused a decrease of gm and g m/Cm irrespective of the effects on Cm, and irrespective of whether oocytes expressed rENaC or human ENaC (hENaC). Moreover, the effects on Cm in ENaC-expressing oocytes were slightly larger than those in control oocytes, indicating that PKC activation may also result in channel-specific trafficking events.
MATERIALS AND METHODS
Oocyte Isolation and Injection
Toads were obtained from Xenopus Express and were kept in dechlorinated tap water at 18°C. Conditions for oocyte removal, processing, injection, and cRNA synthesis were as previously described ( Awayda and Subramanyam 1998). Defolliculated Xenopus oocytes were injected with cRNAs for α, β, and γ rENaC or hENaC. Oocytes were recorded from 1–4 d after injection. Recording solution osmolarity was maintained at 200 mOsm. All recordings were performed at 19–21°C.
Dual Electrode Clamp
Whole-cell currents were recorded and analyzed as described by Awayda and Subramanyam 1998 using a two-electrode voltage clamp (TEV-200; Dagan Instrument). The bath was perfused with solution at 1.5–6 ml/min, or ∼1–4 chamber vol/min. As ENaC is not mechano-sensitive in oocytes ( Awayda and Subramanyam 1998), no differences were observed between these flow rates.
Whole-cell currents were recorded in oocytes held at 0 mV and pulsed for 500 ms from −100 to +40 mV in 20-mV increments. Amiloride was added at 10 μM at the end of each experiment. Slope conductance (gNa ) was calculated from the amiloride-sensitive currents at −100 and −80 mV. This conductance was calculated from the current values at the end of the 500-ms pulses, as described by Awayda et al. 1996. By convention, inward flow of cations is designated as inward current (negative current), and all voltages are reported with respect to ground or bath.
Analysis of the Voltage-activated Currents
Amiloride-sensitive currents in ENaC expressing oocytes were obtained by subtracting the currents remaining after 10 μM amiloride, which was added at the end (and sometimes at the beginning) of each experiment. The −100- and −80-mV voltage episodes were selected using the Fetchan subroutine in pCLAMP. The data between the start (usually the first 5 ms after the initial voltage change was discarded) and end of the −100- or −80-mV voltage episodes were chosen for the exponential fit. The current in each episode was fitted to a single exponential using the least squares minimization routine in Fetchan. Each fit resulted in three parameters: a time constant (τ), an initial current (I−100), and a magnitude of the exponential (ΔIV).
Impedance Analysis
Impedance analysis was also carried out using a two-electrode voltage clamp. A DC holding voltage of 0 mV was used. This clamp was connected to two digital signal processing boards via an interface consisting of anti-aliasing filters and programmable external gain amplifiers. Impedance spectroscopy was performed by simultaneously imposing 78 sine waves to the command input of the voltage clamp as described by Weber et al. 1999. Frequencies between 0.1 and 520 kHz were used. The resulting current and voltage records were sampled at 1.64 kHz, Fourier transformed, and used to calculate the real and imaginary components of the impedance. The resulting impedance was analyzed assuming that the oocyte membrane can be represented with an electrical equivalent circuit consisting of a parallel arrangement of Cm with Rm , which is described by the following equation:
 |
where Rs is the series resistance, and j, ω, Rm , and Cm have their usual or already defined meanings. Parameters were calculated by least squares minimization of the measured impedance to the above equation. As shown in the results, C m was frequency independent and the bandwidth for measuring this parameter was only limited by amplifier noise (at high frequency) and errors in measuring the impedance at very low frequencies. Thus, the C m at any particular frequency can be used as an index of oocyte membrane capacitance and, presumably, area.
Taking advantage of the frequency-independent nature of Cm, the impedance was measured at distinct frequencies that allowed the continuous calculation of Cm (every 15 s). A continuous voltage signal at 0.25 Hz was imposed and used to calculate the membrane slope conductance around a holding potential of 0 mV (gm), as described by Weber et al. 1999. This calculation was updated every 15 s. An additional voltage signal consisting of five distinct sinusoids at frequencies of 55, 110, 220, 293, and 440 Hz was input across the clamp. This procedure used the calculated value of gm, and allowed the continuous calculation of Cm at these distinct frequencies. The p–p magnitude of these sinusoids was <4 mV. This assured that the impedance was measured without large perturbations of the system and that measurements were carried out in a linear range of the current–voltage relationship. This was experimentally verified as the calculated resistance and capacitance were independent of frequency. In the present report, Cm is summarized at 55 or 110 Hz.
Impedance analysis was carried out using specially designed low-resistance electrodes with tips filled with 1% high-strength agarose in 3 M KCl. These electrodes improved the signal-to-noise ratio when measuring membrane impedance. Electrodes had a resistance in the range of 0.2–0.5 MΩ, and tip diameters of ∼10 μM. Electrodes were constructed from borosilicate glass that was pulled in three stages on a horizontal pipette puller (P87; Sutter Instruments, Co.). Electrode tips were broken to the desired diameter under a microscope and were filled with the aid of house vacuum with the melted agarose solution. Electrodes were coated with a low dielectric coefficient polystyrene insulator and were stored in a humidified jar until use. These jagged-tipped electrodes could be stored for a few weeks in these conditions, and were reused for multiple experiments.
Solutions and Chemicals
Solutions and chemicals were as described before ( Awayda and Subramanyam 1998). Amiloride was a gift from Merck-Sharp & Dohme. PMA and its inactive analogue MPMA (phorbol 12-myristate 13-acetate, 4-O-methyl) were obtained from Calbiochem Corp. As these reagents are relatively unstable in ambient air, all vials were stored under N2 for a period of <1 mo, after which they were discarded. All other chemicals were of the highest grade and were obtained from Sigma Chemical Co.
Statistical analysis was carried out using paired Student's t test. Except where noted, all data are summarized as mean ± SEM. Significance was determined at the 95% confidence levels (P < 0.05).
RESULTS
Effects of PMA on the Voltage-induced Channel Activation
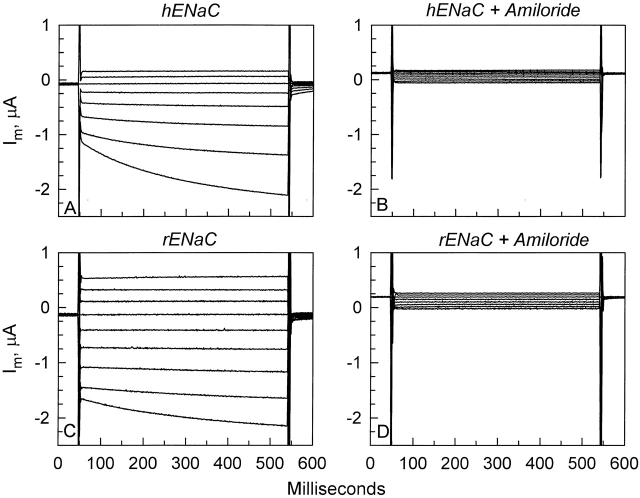
Oocytes expressing hENaC exhibited an appreciable activation by hyperpolarizing voltages (Fig. 1 A). This activation was most prominent at the largest hyperpolarizing voltage used (−100 mV). These voltage-activated currents were amiloride sensitive (Fig. 1 B), and were not observed in control oocytes or in oocytes expressing CFTR (data not shown). This activation was also observed in oocytes expressing the rat homologue; however, the extent of activation at −100 mV was much smaller than that observed in oocytes expressing the human homologue. Thus, these currents are ENaC specific and are attributed to a slow (hundreds of milliseconds) activation of hENaC and rENaC by hyperpolarizing voltages. This activation is likely a direct effect of voltage on channel gating, as previously described by Palmer and Frindt 1996 for the native channel in the cortical collecting tubule. The effects of PMA-induced PKC activation on this process are explored below.
Figure 1.
Representative whole-cell currents in oocytes expressing hENaC or rENaC. (A) Oocytes expressing hENaC exhibited an appreciable activation by hyperpolarizing voltages (the most pronounced activation was observed at −100 mV and is the most negative current shown). (B) This voltage-activated current is attributed to hENaC as it is blocked by 10 μM amiloride. (C) By comparison, this activation is markedly reduced in oocytes expressing rENaC. (D) The voltage-activated currents in these oocytes were also amiloride sensitive.
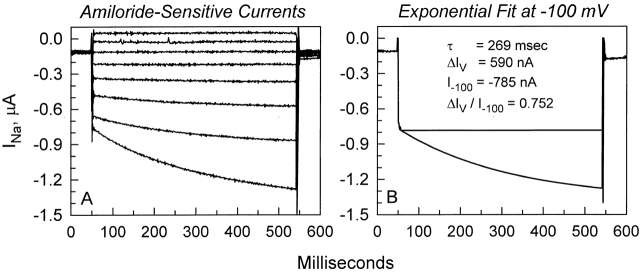
To better describe this voltage-dependent activation, the amiloride-sensitive whole-cell currents at −100 mV were calculated, and then fit with a single exponential as described in materials and methods. Shown in Fig. 2 is an example of fitting this current in a hENaC-expressing oocyte. In all cases, a single exponential was sufficient to describe this activation. In this group of hENaC-expressing oocytes (n = 6), τ, I −100, and ΔIV were 280 ± 7 ms, and −689 ± 78 and 556 ± 101 nA, respectively. The time constants were independent of expression levels; however, ΔI V was highly dependent on baseline current and, presumably, expression levels. This is indeed consistent with that expected if ΔI V was an intrinsic property of the channel itself. To normalize for differences in expression levels between oocytes, I calculated ΔI V/I−100. This ratio averaged 0.79 ± 0.08 and ranged from 0.60 to 0.98 (n = 6).
Figure 2.
Exponential fit of the voltage-activated current at −100 mV. (A) Whole-cell currents were obtained in the conventional manner by holding at 0 mV and immediately stepping the voltage from −100 to +40 mV in 20-mV increments for a period of ∼500 ms. (B) The current at −100 mV is fitted to a single exponential. The resulting exponential fit is superimposed on the data points. To correct for expression levels, values of ΔIV are normalized by dividing with I −100. In this example, it results in a ratio of 0.752.
As shown in Fig. 1, rENaC-expressing oocytes exhibited similar activation. However, the voltage-activated currents at −100 mV in these oocytes were sometimes too small for an accurate exponential fit. Nevertheless, where feasible, these currents could also be fit with a single exponential with similar time constants, but smaller ΔIV/I−100 to those observed in hENaC-expressing oocytes. Thus, a similar phenomenon occurs in both rENaC- and hENaC-expressing oocytes.
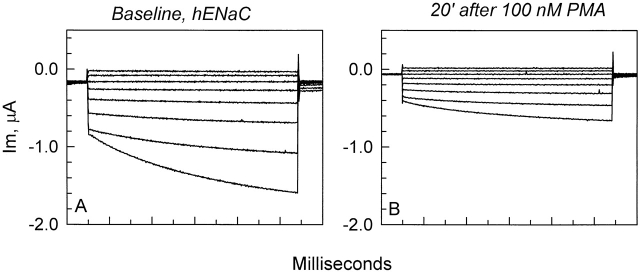
The effects of PKC stimulation on the voltage-activated current was examined in both rENaC- and hENaC-expressing oocytes. PMA-induced stimulation of PKC caused a decrease of ΔIV (see Fig. 3 for an example of the effect on hENaC-expressing oocytes). Qualitatively, the effects were similar in both groups of oocytes. However, owing to the much smaller voltage-dependent activation of rENaC, the summary of the effects of PMA on ΔIV was limited to hENaC-expressing oocytes.
Figure 3.
Representative example of the effects of 100 nM PMA on the current in hENaC-expressing oocytes. All currents are subtracted from the residual amiloride-insensitive currents. (A) Currents in the absence of PMA exhibited the voltage activation at hyperpolarizing voltages as described in Fig. 1 and Fig. 2 . (B) PMA caused an inhibition of the current at every voltage. The majority of this inhibition was observed within 15–20 min. Note that 100 nM PMA also inhibited the voltage-activated current described above in Fig. 1 and Fig. 2 .
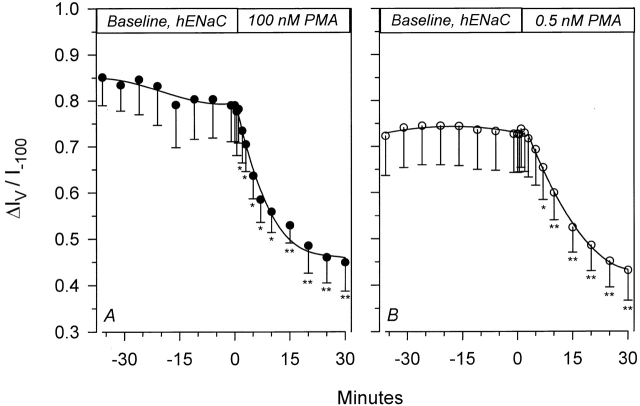
As shown in Fig. 4 A, stimulation of PKC by 100 nM PMA caused a decrease of voltage activation, and ΔIV decreased from 556 ± 101 to 125 ± 52 nA within 30 min. This resulted in a decrease of ΔIV/I−100. This inhibition reached a plateau at 57.1 ± 4.9% (n = 6) of baseline values within 15–20 min after the addition of 100 nM PMA. This effect occurred in the absence of any changes of τ, which remained at 275 ± 7 ms 30 min after the addition of PMA. A similar effect was also observed with a much lower PMA concentration. As shown in Fig. 4 B, a 30-min treatment with 0.5 nM PMA decreased ΔIV/I−100 from 0.727 ± 0.084 to 0.431 ± 0.065 (n = 6), with no effects on τ (280 ± 7 vs. 275 ± 7 ms). As previously mentioned, this voltage activation may reflect a direct effect of Vm on ENaC's gating, and may therefore represent an intrinsic property of the channel itself. Thus, inhibition of this activation by PKC implies changes of these intrinsic properties, presumably as a result of direct channel modification by mechanisms that may include phosphorylation.
Figure 4.
Time course of inhibition of hENaC's voltage-activated current by PMA. Voltage activation is calculated as described in materials and methods, and is normalized to I−100. Inhibition by 100 nM PMA (A) was similar to that observed with 0.5 nM PMA (B). n = 6 for each group of oocytes. *P < 0.05; **P < 0.01.
Effects of PMA on Slope Conductance in hENaC-expressing Oocytes
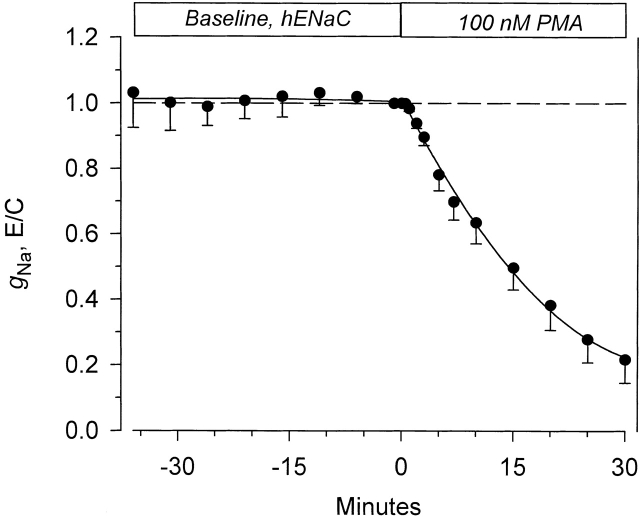
We have previously reported that 100 nM PMA inhibited the amiloride-sensitive slope conductance (gNa) in rENaC-expressing oocytes. It was not known whether PKC stimulation would exhibit a similar effect on hENaC. As shown in Fig. 3, 100 nM also inhibited the whole-cell currents at every voltage in addition to its effects on ΔIV at −100 mV. The time course of inhibition of gNa is shown in Fig. 5 . This conductance decreased by 78.3% within 30 min after the addition of PMA from 18.71 ± 2.41 to 4.16 ± 1.64 μS ( n = 6). This inhibition was similar to that previously reported for the rat homologue (see Awayda et al. 1996). Thus, high concentrations of PMA inhibit gNa and whole-cell currents in both rENaC- and hENaC-expressing oocytes. This indicated that other mechanisms must contribute to the stimulation observed by other investigators (see introduction) of ENaC with PMA.
Figure 5.
Time course of the effect of 100 nM PMA on the amiloride-sensitive slope conductance in hENaC-expressing oocytes. Amiloride-sensitive currents were calculated by subtracting the small residual currents after the addition of 10 μM amiloride at the end of each experiment. Slope conductance was calculated from the current at the end of the 500-ms pulse between a holding voltage of −100 and −80 mV (see materials and methods). PMA caused a marked decrease of gNa after a delay of ∼1–-2 min. Within 30 min, gNa decreased to ∼22% of baseline. This inhibition was similar to that previously reported for the conductance in rENaC-expressing oocytes ( n = 6).
It should be noted that the gNa was calculated at the end of the 500-ms voltage pulse and so it includes the voltage activation component described above. If the conductance were calculated from the currents within the first few milliseconds after the voltage pulse, then g Na between −100 and −80 mV would appear to be smaller than that between −80 and −60 mV due to the residual activation at −80 mV by the previous −100-mV pulse (see Fig. 1 and Fig. 3 ). Therefore, to avoid this pitfall, I calculated the gNa at the end of the pulse, where the contribution of voltage activation to the currents at −100 and −80 mV is similar. This procedure affects only gNa, and not the gm reported below, and serves to slightly underestimate (and not overestimate) the changes of the amiloride-sensitive slope conductance, as PMA caused a smaller decrease of ΔIV/I−100 than g Na.
The above-described effects of PMA on ΔIV are clearly ENaC specific. However, this inhibition cannot fully explain the decrease of g Na to below 22% of baseline values. Thus, additional mechanisms must contribute to this large decrease of gNa. The identity of these mechanisms and their specificity in ENaC-expressing versus control oocytes are undetermined. To address these issues, I used impedance analysis to examine the effects of various concentrations of PMA on membrane capacitance and conductance (Cm and gm) in control and ENaC-expressing oocytes. This technique can be used to discern trafficking events resulting in changes of membrane area and Cm .
Impedance Analysis
Impedance analysis has been extensively used to assess the resistive and capacitive properties of biological membranes. This technique is used with the assumption that the dielectric coefficient of biological membranes is relatively constant and results in the observation of a capacitance of ∼1 μF/cm2 planar area (Cole 1968). Complicating the issue of impedance analysis in epithelial preparations is that the measured impedance deviates from the ideal behavior expected from a combination of frequency-independent resistors and capacitors. This may be attributed to the presence of a more complicated electrical arrangement of cells that results in measuring impedance originating from the sum of the apical and basolateral membrane impedances in parallel with the shunt resistance. Alternatively, this has been recently attributed to the presence of dielectric dispersion at the apical membrane of some epithelia and results in the observation of a frequency-dependent capacitance ( Awayda et al. 1999). Recently, Weber et al. 1999 have reported that the impedance of control or CFTR-expressing oocytes can be described by frequency-independent parallel combination of a resistor and a capacitor. Thus, this simple system can be used to assess effects on Cm and gm without the additional complication of the appropriateness of the model used to analyze the measured impedance.
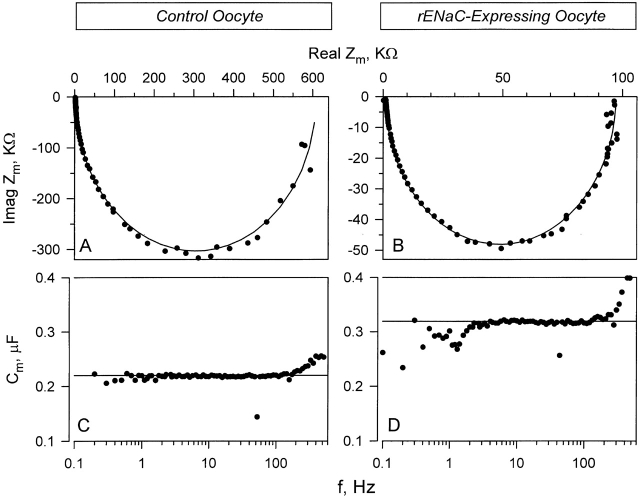
Impedance analysis was carried out in the frequency domain by imposing a series of superimposed 78 sinusoids in the bandwidth of 0.1–520 Hz as described in materials and methods. This resulted in an impedance spectrum that can be described by a single ideal semicircle when plotted on a Nyquist plot of real versus imaginary components of the impedance. As shown in Fig. 6A and Fig. B, this ideal behavior was observed in control as well as rENaC-expressing oocytes. This indicated the absence of dielectric dispersions (see Awayda et al. 1999). Indeed, C m is shown in Fig. 6C and Fig. D, and is frequency independent. This was observed irrespective of whether Cm was measured in control, rENaC-expressing, or hENaC-expressing (data not shown) oocytes. This indicated that ENaC does not directly contribute to the dispersions observed in other Na+-transporting epithelia.
Figure 6.
Impedance analysis in control and rENaC-expressing oocytes. (A) Representative example of the impedance in a control oocyte plotted using the Nyquist representation. (B) Example of the impedance in a rENaC-expressing oocyte. Note the difference in the scale. (C and D) The corresponding capacitance in the control and rENaC expressing oocyte, respectively. Similar results were observed in hENaC-expressing oocytes (data not shown). In all cases, the membrane impedance can be well fit with an equivalent circuit of a parallel combination of ideal frequency-independent resistor and capacitor.
The deviation of Cm observed in Fig. 6C and Fig. D, is only manifested at high and low frequencies. This deviation is opposite that expected from a frequency-dependent capacitance that actually increases with decreasing frequency (Awayda et al. 1999). This observed deviation is due to amplifier noise at high frequency and small slow changes of current in these oocytes at the lowest frequency. Moreover, the impedance at the lower and higher frequencies approaches Rm and Rs (membrane and series resistance), respectively, and, at these extremes, small errors in estimating these resistances result in larger errors of C m (see Weber et al. 1999). To avoid this pitfall, C m was continuously measured at five distinct frequencies.
Effects of 100 nM PMA on Cm and gm
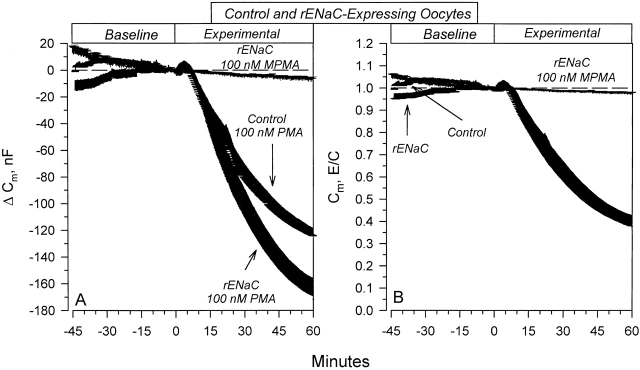
Baseline Cm averaged 215 ± 5 (n = 21) and 273 ± 6 (n = 30) nF in control and rENaC-expressing oocytes, respectively. Within minutes, PMA caused a small but consistent stimulation of the Cm in both control and rENaC-expressing oocytes (Fig. 7 A). This stimulation was transient in nature and Cm decreased to values below baseline within 7–8 min. This trend continued to 60 min, where Cm decreased by 119 ± 13 and 157 ± 14 nF in control and rENaC-expressing oocytes, respectively. These changes of Cm were specific to PMA's activation of PKC, as the inactive phorbol ester MPMA was without effects. Moreover, the differences in the effect of PMA on Cm between control and rENaC-expressing oocytes were not observed if the data were normalized to baseline values (Fig. 7 B). Indeed, 100 nM PMA decreased Cm by 58.6 ± 3.4% and 57.5 ± 2.1% in control and rENaC-expressing oocytes, respectively. Therefore, while the baseline Cm was elevated in ENaC-expressing oocytes, 100 nM PMA caused comparable changes in both control and ENaC-expressing oocytes. This indicated that the changes of Cm and presumably membrane area may be due to generalized membrane endocytosis unrelated to ENaC, making any specific effects of PKC on the Cm in ENaC-expressing oocytes difficult to resolve at this PMA concentration.
Figure 7.
Effects of 100 nM PMA on membrane capacitance. (A) Changes of Cm in control and rENaC-expressing oocytes. Note that the changes of C m were larger in rENaC-expressing oocytes. (B) Changes of C m summarized as E/C (experimental/baseline). Note that the percent change of Cm is the same in control and rENaC-expressing oocytes. This indicates that the baseline Cm is larger in rENaC-expressing oocytes. These effects were specific to PKC activation as the inactive phorbol ester, MPMA, was without effect. n = 7 for rENaC and control oocytes treated with PMA, and n = 5 for rENaC oocytes treated with MPMA.
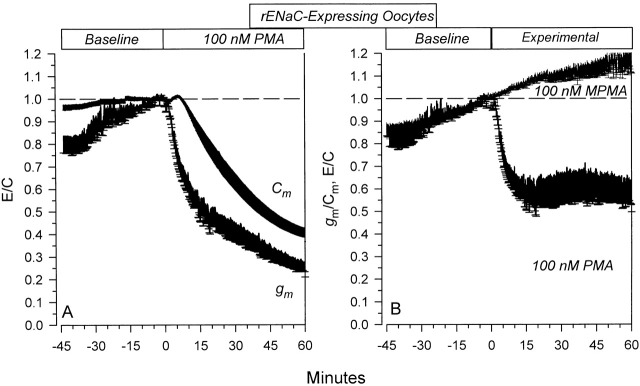
To address the issues of specific effects of PMA and presumably PKC on ENaC, I examined the time course of the changes of gm and compared those to the changes of Cm. gm averaged 16.23 ± 2.98 μs and decreased to 3.94 ± 1.65 μs ( n = 7) 60 min after 100 nM PMA. As shown in Fig. 8 A, this decrease occurred without the appearance of an initial transient stimulation. Moreover, this decrease of gm clearly preceded the decrease of Cm, whereby gm decreased by >46.4% during the first 15 min, while Cm decreased by only 11.7% during this period. This indicates the presence of specific effects on gm unrelated to changes of Cm. It should be noted that the gm and Cm in these experiments are calculated at a DC holding voltage of 0 mV, and therefore they lack any detectable contribution of the voltage-activated component observed at hyperpolarizing voltages. Thus, the effects of PMA on gm are completely dissociated from those on ΔIV reported above.
Figure 8.
Specific and nonspecific effects of 100 nM PMA on rENaC-expressing oocytes. (A) Time course of the effects of PMA on Cm and g m. The calculated gm represents the membrane slope conductance at 0 mV. Note that the changes of gm preceded the changes of Cm. (B) Data are summarized as specific conductance (gm/Cm). It is clear that PMA causes a rapid decrease of gm/Cm to constant values within 15 min. These effects were not observed with MPMA. n = 7 and 5 for PMA- and MPMA-treated oocytes, respectively.
To better describe these effects in the absence of the contribution of general membrane trafficking, I examined the time course of the changes of the specific conductance (gm/Cm). This parameter is calculated from the ratio of total conductance to total capacitance and is therefore unaffected by nonspecific changes of the background conductances in these oocytes.
As shown in Fig. 8 B, 100 nM PMA caused an appreciable decrease of gm/Cm. This decrease reached a relative plateau within 15 min at 60.1% of baseline values. Consistent with its lack of effects on Cm, MPMA did not cause any changes of the gm/Cm (Fig. 8 B). Indeed, the small upward drift in baseline during the control period was unaffected by the addition of MPMA and is clearly distinct from the decrease observed with PMA. Thus, the inhibition of ENaC by PMA is due to a combination of specific effects on the channel that are evident within the first 15 min of PKC stimulation and are described by the changes of g m/Cm, in addition to delayed nonspecific effects on ENaC that are the result of generalized membrane endocytosis that continue to 60 min, and are described by the changes of Cm in the absence of additional changes of gm/Cm.
It should be noted that the time course of the specific effects of 100 nM PMA on gm/Cm are similar to the time course of the effects of 100 nM PMA on ΔIV as described in Fig. 4 A. This provides additional indirect evidence that the specific effects of PKC on ENaC include a potential direct effect on the channel. To determine whether gm/Cm is also inhibited by 0.5 nM PMA, as observed in Fig. 4B for ΔIV, I examined the effects of this low PMA concentration on control and ENaC-expressing oocytes.
Effects of 0.5 nM PMA on Cm and gm
As evident above, 100 nM PMA may have been a saturating concentration as it caused massive and nonspecific membrane endocytosis. This may have masked any specific changes of Cm. To assess the presence of any ENaC-specific changes of Cm, and potential sensitivity differences between hENaC and rENaC, I used 0.5 nM PMA.
The Cm in rENaC-expressing oocytes responded in a variable fashion with PMA causing a sustained increase of Cm in four oocytes, and a sustained decreased in eight oocytes. The origin of this increase was unknown and points to the potential variability in the response of Cm to 0.5 nM PMA. However, this variability in the effect on Cm did not translate to variability in the effect on gm, indicating the lack of correlation between ENaC's inhibition and some or all of the changes of Cm. This provided justification for summarizing the data from all 12 oocytes, as described below.
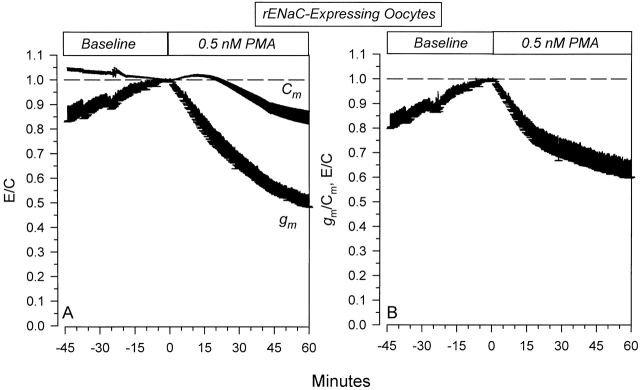
As shown in Fig. 9 A, 0.5 nM PMA caused a decrease of Cm to 82.0 ± 5.2% (n = 12) of baseline at 60 min. This decrease was much smaller than that observed with 100 nM PMA (see Fig. 7 and Fig. 8). On the other hand, gm decreased to 52.8 ± 4.6% (n = 12) of baseline at 60 min. These changes of gm clearly preceded those of Cm.
Figure 9.
Specific and nonspecific effects of 0.5 nM PMA on rENaC-expressing oocytes. (A) Time course of the effects on Cm and gm . As with 100 nM PMA, the changes of gm preceded those of Cm. (B) Data are summarized as gm/Cm and demonstrate the presence of specific effects of PMA (n = 12).
To assess the rENaC-specific effect of 0.5 nM PMA, I examined the time course of the changes of the specific conductance. As shown in Fig. 9 B, 0.5 nM PMA caused a decrease of g m/Cm to 66.7 ± 6.8% of baseline at 60 min. These data support the conclusion that low concentrations of PMA are still capable of specific inhibition of rENaC in a similar manner to that observed with the comparatively very high concentration of PMA (100 nM). As with the higher PMA concentration, the time course of the changes of g m/Cm was similar to that for the effects on ΔI V (see Fig. 4 B). This provided additional evidence that the changes of gm/Cm and ΔIV may be used as an index of the specific and potentially direct effects of PKC on ENaC.
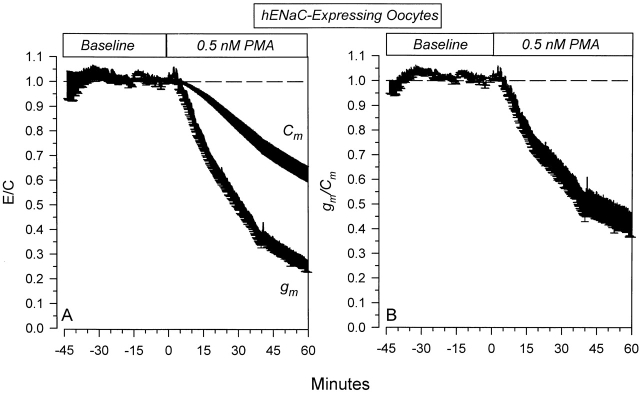
The effects of 0.5 nM PMA on hENaC expressing oocytes are shown in Fig. 10. Both Cm and gm were inhibited by 0.5 nM PMA. These effects were similar but larger than those observed in rENaC-expressing oocytes (Fig. 9). It is difficult to attribute this larger decrease of Cm to the expression of hENaC versus rENaC, as the effects on Cm in the oocytes in Fig. 9 was somewhat variable. In that respect, it also becomes difficult to conclude that 0.5 nM PMA causes larger changes of gm in hENaC-expressing oocytes. To address this issue, I examined the effects on gm/C m. This allows a comparison between the two groups of oocytes despite differences in their magnitude of Cm decrease. As shown in Fig. 10 B, the changes of the specific conductance were similar in time course, but larger in magnitude in the hENaC-expressing oocytes. This indicates that the rat and human isoforms behave in a similar manner to their regulation by PKC, but that the human isoform may exhibit a higher sensitivity to inhibition by a low dose of PMA.
Figure 10.
Specific and nonspecific effects of 0.5 nM PMA on hENaC-expressing oocytes. (A) Time course of the effects on Cm and gm . Note that the changes of Cm in this group of oocytes were larger than those observed in rENaC-expressing oocytes. Nevertheless, the changes of gm preceded and exceeded those of Cm, indicating the presence of specific inhibition of hENaC by 0.5 nM PMA. (B) This specific inhibition is clearly evident in the time course of the effects on gm/Cm. These data indicate that the human homolog behaves in a similar manner to the rat homolog. Moreover, hENaC may exhibit a higher sensitivity to inhibition by PMA (n = 5).
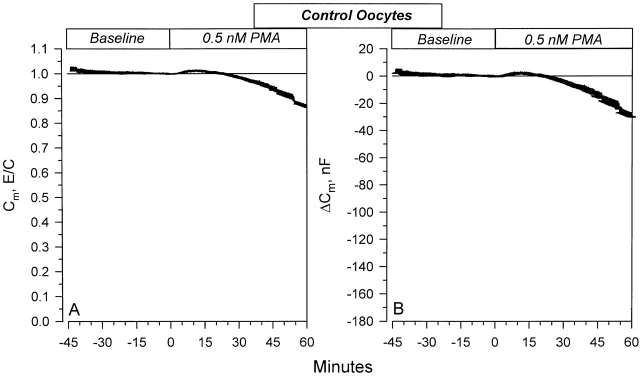
The specificity of the above observed changes of Cm with low concentrations of PMA was further assessed by examining the effects of 0.5 nM PMA on control oocytes. As shown in Fig. 11 , this concentration of PMA also caused changes of Cm. PMA caused a small transient increase of Cm in control oocytes. The Cm returned to values not different from baseline within 25 min, and decreased by 12.5 ± 1.1% at 60 min. These changes are different from those observed in ENaC-expressing oocytes (Fig. 9 and Fig. 10). While it is not possible to tell with high certainty, especially given the variability in the response to 0.5 nM PMA in the ENaC-expressing oocytes ( Fig. 9 and Fig. 10 ), these findings indicate that PKC activation may also induce ENaC-specific changes of Cm and, presumably, membrane area.
Figure 11.
Effects of 0.5 nM PMA on the Cm in control oocytes. A small initial transient stimulation of Cm is observed. This corresponded to a 1.5% increase at 13 min and resulted in an average increase of Cm by 3.1 nF. This increase returned to values not different from control at 25 min. The changes of Cm were smaller than those observed in ENaC-expressing oocytes in Fig. 9 and Fig. 10. Thus, activation of PKC by a low concentration of PMA indicates that a component of the effects of PKC on ENaC may involve specific channel trafficking ( n = 10).
DISCUSSION
The Xenopus oocyte expression system was used to study the regulation of ENaC by PKC. This system is ideal for the present approach as it provides a null control that lacks appreciable ENaC expression, in addition to providing a simple single membrane preparation with an electrical equivalent circuit that can be described by the parallel combination of an ideal resistor and an ideal frequency-independent capacitor. Activation of PKC with PMA was found to inhibit both the rat and the human epithelial Na+ channels. This inhibition was due to a combination of channel-specific effects that include channel trafficking, channel inhibition, and decreased voltage-dependent activation, and nonspecific effects that include general membrane endocytosis.
Impedance Analysis
Frequency domain impedance analysis of biological membranes is a powerful technique that yields information about membrane channels and their area. Historically, this technique has suffered from the observation that the measured impedance deviates from ideal behavior at low audio frequencies. Thus, the analysis of the measured impedance becomes highly model dependent, limiting the utility and enthusiasm for this technique. We have previously reported that the apical membrane capacitance in frog skin, a native Na+-absorbing electrically tight epithelium, is frequency dependent (Awayda et al. 1999). Thus, it is of considerable interest to document that this phenomenon is not dependent on ENaC, as the Cm was frequency independent in both control and ENaC-expressing oocytes (Fig. 6). The oocyte provides a simple electrical system where the measured impedance can be analyzed without extensive modeling of the nonideal behavior observed in epithelial preparations (see, for example, Awayda et al. 1999; Diamond and Machen 1983; Clausen et al. 1979). Moreover, membrane impedance can also be measured in the absence of ENaC expression. This is not feasible in native or cultured Na+-transporting epithelia.
Effects of PMA on Cm
High concentrations of PMA (100 nM) caused a small transient increase of Cm followed by a sustained large decrease. These changes of C m and presumably membrane area were observed regardless of whether oocytes were expressing ENaC. While these effects of PMA are nonspecific in terms of ENaC, they likely represent specific effects of PKC on membrane trafficking. The origins of this biphasic response are unknown; however, it is tempting to speculate that different components of this response may be attributed to individual PKC isoforms. Indeed, it is known that PKC is a collection of at least 10 different isoforms that are linked to different upstream and downstream cell-signaling pathways (Hanks and Hunter 1995). Each of these isoforms in turn transduces specific effects on cell and epithelial function in vivo and in vitro (see, for example, DeCoy et al. 1995; Wilborn and Schafer 1996; Aristimuno and Good 1997; Rosson et al. 1997; Chou et al. 1998), and may also transduce different effects on the Na+ channel itself.
In ENaC-expressing oocytes, 0.5 nM PMA was also capable of producing effects on Cm. These effects were markedly larger in hENaC-expressing oocytes than those observed in control oocytes. The differences between rENaC-expressing and control oocytes were not so pronounced; however, this may be attributed to the observed inherent variability in the response of Cm to 0.5 nM PMA. Nevertheless, these differences indicate the potential presence of ENaC-specific trafficking events.
In both high and low PMA, a component of membrane trafficking that is unrelated to ENaC but is presumably caused by PMA stimulation of PKC was found. These nonspecific effects exhibited a dose dependency and were smaller in the group treated with 0.5 nM PMA. It is expected that PKC may affect the activity or density of membrane-resident ion channels and transporters through this mechanism. These effects may become dominant in cases where PKC does not exhibit additional specific effects on these transporters. In this case, stimulation of PKC, even in the absence of specific interactions with these transporters, may alter membrane-bound channel activity or epithelial transport rates. The present findings may therefore provide a correlate for some of the conflicting observations, which include a PMA-induced stimulation of Na+-transport in some epithelia. This hypothesis remains to be tested in epithelia that respond to PMA with an increase of Na+ transport.
Effects of PMA on ΔIV
Palmer and Frindt 1996 have described a slow activation of ENaC with hyperpolarizing voltages in the rat cortical collecting tubule. These effects were observed in both cell attached and excised patches and argue for a direct effect of voltage on the channel. Similar effects have not been described for the cloned channel and may be attributed in part to the fact that this activation may not be as prominent among the different ENaC homologs. For example, while this activation is present in the rat homolog, it is very prominent only in the human homolog. Under our experimental conditions, this activation can be well fit with simple exponential kinetics and exhibits a time constant in the range of few hundred milliseconds. This is in contrast to the observations of the single channel behavior by Palmer and Frindt 1996, indicating a variable delay on the order of seconds before observing an effect of voltage. However, this may be attributed to the slow spontaneous ENaC gating that exhibits open and closed events on the order of seconds, which may sometimes cause significant delays in the observation of voltage activation if an obligatory open or closed state is present. Thus, while an indirect effect of voltage on ENaC cannot be ruled out, the rapidity of this effect and its similarity to that observed by Palmer and Frindt 1996 in cell-attached as well as in excised patches argue in favor of a direct effect of Vm on the membrane-bound channel.
Assuming that ΔIV is a property of the channel itself, this parameter may be used as a potential index of direct channel modification. A novel and intriguing finding was that PMA caused inhibition of this parameter. These changes occurred in the absence of appreciable effects on the time constant for voltage activation. It is known that ENaC is subject to phosphorylation by PKC ( Shimkets et al. 1998). It is tempting to speculate that PMA and presumably PKC may have altered ΔIV by phosphorylating certain serine or threonine residues on ENaC. In this case, ΔIV may provide the means of examining real-time channel phosphorylation by PKC. This hypothesis awaits additional experimental confirmation.
Effects of PMA on gm
Both high and low concentrations of PMA caused inhibition of ENaC. These effects on gm were a combination of specific effects of PKC on ENaC and nonspecific effects due to membrane endocytosis. To discriminate between these two, the effects of PMA on the specific conductance were determined. At 100 nM PMA gm/Cm rapidly decreased by ∼40% and reached a plateau within 15 min. This decrease is attributed to the additional ability of PMA, and presumably PKC, to inhibit ENaC unrelated to membrane trafficking. Moreover, the changes of C m during this initial 15-min period were minimal (<15%), and thus the errors in determining the magnitude of inhibition of gm by PKC are minimal.
Membrane conductance was also inhibited by low PMA concentrations. However, at these concentrations, the changes of gm were attributed to: (a) specific effects of PKC on gm, (b) specific effects of PKC on membrane trafficking in ENaC-expressing oocytes, and (c) nonspecific effects of PKC on membrane endocytosis. The nonspecific effects on membrane endocytosis are delayed with 0.5 nM PMA and are only evident after 25 min. Therefore, the decrease of gm in the initial 25 min is due to a combination of a and b above.
Summary
The phorbol ester PMA is universally used as a general activator of PKC. PMA activates different PKC isoforms in a dose-dependent manner. A quick review of the literature dealing with the effects of PMA on ion channels and transporters indicates that PMA inhibits these transporters and channels in the majority of the studies. While this may be attributed to the universal actions of PKC on channels and transporters, it may also be related to the ability of PKC to stimulate membrane endocytosis and cause a decrease in the density of any membrane-resident transporter. Indeed, such a hypothesis may find indirect support in the observation that the effects of PKC on some transporters and ion channels could not be prevented even after mutating specific consensus PKC-phosphorylating sites.
To address the issue of specific effects of PKC on a particular membrane-bound molecule requires the use of systems that provide a null control void of the molecule to be studied. This limits the experiments to the use of artificial systems such as lipid bilayers or heterologous expression systems. In the case of ENaC, the oocyte expression system is clearly superior to other systems owing to its feasibly and ability to produce a channel with similar if not identical properties to those in native epithelia. An additional advantage of this system is that its electrical equivalent circuit is simple as compared with epithelia, and allows the simple interpretation of biophysical techniques used to measure membrane area, such as impedance analysis.
Keeping this in mind, I used the oocyte expression system to describe the specific and nonspecific effects of PKC on ENaC. The protocols described in this report may serve as a guideline to distinguish specific from nonspecific effects of PKC, assuming that the present findings regarding the effects PKC can be extrapolated to other preparations.
Acknowledgments
I thank Dr. Bernard Rossier (University of Lausanne, Lausanne, Switzerland) and Dr. Mike Welsh (University of Iowa, Iowa City, IA) for the gift of rat and human ENaC subunits. I also thank Ms. Roxanne Reger for reading the manuscript.
This work was supported by a Grant-In-Aid from the Louisiana American Heart Association, and by a Louisiana Educational Quality Support Fund grant from the Louisiana Board of Regents.
Footnotes
Abbreviations used in this paper: ΔIV, magnitude of the ENaC current induced by abruptly clamping membrane potential to −100 mV; Cm, membrane capacitance; E/C, experimental divided by baseline values; ENaC, epithelial Na+ channel; gm, membrane slope conductance around 0 mV; gm/Cm, specific conductance; gNa , inward whole-cell amiloride-sensitive slope conductance (around −100 mV).
References
- Aballay A. , Stahl P.D. , Mayorga L.S. Phorbol ester promotes endocytosis by activating a factor involved in endosome fusion. J. Cell Sci. 1999 ;112:2549–2557 . doi: 10.1242/jcs.112.15.2549. [DOI] [PubMed] [Google Scholar]
- Aristimuno P.C. , Good D.W. PKC isoforms in rat medullary thick ascending limbselective activation of the δ-isoform by PGE2 . Am. J. Physiol. Renal Physiol. 1997 ;272:F624–F631 . doi: 10.1152/ajprenal.1997.272.5.F624. [DOI] [PubMed] [Google Scholar]
- Awayda M.S. , Ismailov I.I. , Berdiev B.K. , Fuller C.M. , Benos D.J. Protein kinase regulation of a cloned epithelial Na+ channel. J. Gen. Physiol. 1996 ;108:49–65 . doi: 10.1085/jgp.108.1.49. [DOI] [PMC free article] [PubMed] [Google Scholar]
- Awayda M.S. , Subramanyam M. Regulation of the epithelial Na+ channel by membrane tension. J. Gen. Physiol. 1998 ;112:97–111 . doi: 10.1085/jgp.112.2.97. [DOI] [PMC free article] [PubMed] [Google Scholar]
- Awayda M.S. , Van Driessche W. , Helman S.I. Frequency-dependent capacitance of the apical membrane of frog skin dielectric relaxation processes. Biophys. J. 1999 ;76:219–232 . doi: 10.1016/S0006-3495(99)77191-2. [DOI] [PMC free article] [PubMed] [Google Scholar]
- Benos D.J. , Awayda M.S. , Ismailov I.I. , Johnson J.P. Structure and function of amiloride sensitive Na+ channels. J. Membr. Biol. 1995 ;143:1–19 . doi: 10.1007/BF00232519. [DOI] [PubMed] [Google Scholar]
- Beron J. , Forster I. , Beguin P. , Geering K. , Verrey F. Phorbol 12-myristate 13-acetate down-regulates Na,K-ATPase independent of its protein kinase C sitedecrease in basolateral cell surface area. Mol. Biol. Cell. 1997 ;8:387–398 . doi: 10.1091/mbc.8.3.387. [DOI] [PMC free article] [PubMed] [Google Scholar]
- Chou C.-L. , Rapko S.I. , Knepper M.A. Phosphoinositide signaling in the rat inner medullary collecting duct. Am. J. Physiol. Renal Physiol. 1998 ;274:F564–F572 . doi: 10.1152/ajprenal.1998.274.3.F564. [DOI] [PubMed] [Google Scholar]
- Civan M.M. , Peterson-Yantorno K. , O'Brien T.G. Diacylglycerols stimulate short-circuit current across frog skin by increasing apical Na+ permeability. J. Membr. Biol. 1987 ;97:193–204 . doi: 10.1007/BF01869222. [DOI] [PubMed] [Google Scholar]
- Clausen C. , Lewis S.A. , Diamond J.M. Impedance analysis of a tight epithelium using a distributed resistance model. Biophys. J. 1979 ;26:291–318 . doi: 10.1016/S0006-3495(79)85250-9. [DOI] [PMC free article] [PubMed] [Google Scholar]
- Cole K.S. Membranes, Ions and Impulses 1968 . University of California Press; Berkeley, CA : pp. 569 pp [Google Scholar]
- DeCoy D.L. , Snapper J.R. , Breyer M.D. Anti-sense DNA down-regulates protein kinase C-ε and enhances vasopressin-stimulated Na+ absorption in rabbit cortical collecting duct. J. Clin. Invest. 1995 ;95:2749–2756 . doi: 10.1172/JCI117978. [DOI] [PMC free article] [PubMed] [Google Scholar]
- Diamond J.M. , Machen T.E. Impedance analysis in epithelia and the problem of gastric acid secretion. J. Membr. Biol. 1983 ;72:17–41 . doi: 10.1007/BF01870312. [DOI] [PubMed] [Google Scholar]
- Eaton D.C. , Becchetti A. , Ma H. , Ling B.N. Renal sodium channelsregulation and single channel properties . Kidney. Int. 1995 ;48:941–949 . doi: 10.1038/ki.1995.375. [DOI] [PubMed] [Google Scholar]
- Els W.J. , Liu X. , Helman S.I. Differential effects of phorbol ester (PMA) on blocker-sensitive ENaCs of frog skin and A6 epithelia. Am. J. Physiol. Cell Physiol. 1998 ;275:C120–C129 . doi: 10.1152/ajpcell.1998.275.1.C120. [DOI] [PubMed] [Google Scholar]
- Garty H. , Palmer L.G. Epithelial sodium channelsfunctions, structure, and regulation . Physiol. Rev. 1997 ;77:359–396 . doi: 10.1152/physrev.1997.77.2.359. [DOI] [PubMed] [Google Scholar]
- Hanks S.K. , Hunter T. Protein kinases 6. The eukaryotic protein kinase superfamily kinase (catalytic) domain structure and classification. FASEB J. 1995 ;9:576–596 . [PubMed] [Google Scholar]
- Ling B.N. , Eaton D.C. Effects of luminal Na+ on single Na+ channels in A6 cells, a regulatory role for protein kinase C. Am. J. Physiol. Renal Physiol. 1989 ;256:F1094–F2003 . doi: 10.1152/ajprenal.1989.256.6.F1094. [DOI] [PubMed] [Google Scholar]
- Mohrmann M. , Cantiello H.F. , Ausiello D.A. Inhibition of epithelial Na+ transport by atriopeptin, protein kinase C, and pertussis toxin. Am. J. Physiol. 1987 ;253:F372–F376 . doi: 10.1152/ajprenal.1987.253.2.F372. [DOI] [PubMed] [Google Scholar]
- Oh Y. , Smith P.R. , Bradford A.L. , Keaton D. , Benos D.J. Regulation by phosphorylation of purified epithelial Na+ channels in planar lipid bilayers. Am. J. Physiol. Cell Physiol. 1993 ;265:C85–C91 . doi: 10.1152/ajpcell.1993.265.1.C85. [DOI] [PubMed] [Google Scholar]
- Palmer L.G. Epithelial Na channelsfunction and diversity. Annu. Rev. Physiol. 1992 ;54:51–66 . doi: 10.1146/annurev.ph.54.030192.000411. [DOI] [PubMed] [Google Scholar]
- Palmer L.G. , Frindt G. Gating of Na channels in the rat cortical collecting tubule effects of voltage and membrane stretch. J. Gen. Physiol. 1996 ;107:35–45 . doi: 10.1085/jgp.107.1.35. [DOI] [PMC free article] [PubMed] [Google Scholar]
- Rouch A.J. , Chen L. , Kudo L.H. , Bell P.D. , Fowler B.C. , Corbitt B.D. , Schafer J.A. Intracellular Ca2+ and PKC activation do not inhibit Na + and water transport in the rat CCD. Am. J. Physiol. Renal Physiol. 1993 ;265:F569–F577 . doi: 10.1152/ajprenal.1993.265.4.F569. [DOI] [PubMed] [Google Scholar]
- Rosson D. , O'Brien T.G. , Kampherstein J.A. , Szallasi Z. , Bogi K. , Blumberg P.M. , Mullin J.M. Protein kinase C-alpha activity modulates transepithelial permeability and cell junctions in the LLC-PK1 epithelial cell line . J. Biol. Chem. 1997 ;272:14950–14953 . doi: 10.1074/jbc.272.23.14950. [DOI] [PubMed] [Google Scholar]
- Silver R.B. , Frindt G. , Windhager E.E. , Palmer L.G. Feedback regulation of Na channels in rat CCT. I. Effects of inhibition of the Na pump. Am. J. Physiol. Renal Physiol. 1993 ;264:F557–F564 . doi: 10.1152/ajprenal.1993.264.3.F557. [DOI] [PubMed] [Google Scholar]
- Shimkets R.A. , Lifton R. , Canessa C.M. In vivo phosphorylation of the epithelial sodium channel. Proc. Natl. Acad. Sci. USA. 1998 ;95:3301–3305 . doi: 10.1073/pnas.95.6.3301. [DOI] [PMC free article] [PubMed] [Google Scholar]
- Weber W.-M. , Cuppens H. , Cassiman J.-J. , Clauss W. , Van Driessche W. Capacitance measurements reveal different pathways for the activation of CFTR. Pflügers Arch. 1999 ;438:561–569 . doi: 10.1007/s004249900086. [DOI] [PubMed] [Google Scholar]
- Wilborn T.W. , Schafer J.A. Differential expression of PKC isoforms in fresh and cultured rabbit CCD. Am. J. Physiol. Renal Physiol. 1996 ;270:F766–F775 . doi: 10.1152/ajprenal.1996.270.5.F766. [DOI] [PubMed] [Google Scholar]


