

Abstract
The molecular architecture of the NH2 and COOH termini of the prokaryotic potassium channel KcsA has been determined using site-directed spin-labeling methods and paramagnetic resonance EPR spectroscopy. Cysteine mutants were generated (residues 5–24 and 121–160) and spin labeled, and the X-band CW EPR spectra were obtained from liposome-reconstituted channels at room temperature. Data on probe mobility (ΔHo−1), accessibility parameters (ΠO2 and ΠNiEdda), and inter-subunit spin-spin interaction (Ω) were used as structural constraints to build a three-dimensional folding model of these cytoplasmic domains from a set of simulated annealing and restrained molecular dynamics runs. 32 backbone structures were generated and averaged using fourfold symmetry, and a final mean structure was obtained from the eight lowest energy runs. Based on the present data, together with information from the KcsA crystal structure, a model for the three-dimensional fold of full-length KcsA was constructed. In this model, the NH2 terminus of KcsA forms an α-helix anchored at the membrane–water interface, while the COOH terminus forms a right-handed four-helix bundle that extend some 40–50 Å towards the cytoplasm. Functional analysis of COOH-terminal deletion constructs suggest that, while the COOH terminus does not play a substantial role in determining ion permeation properties, it exerts a modulatory role in the pH-dependent gating mechanism.
Keywords: KcsA, cytoplasmic domains, EPR spectroscopy, three-dimensional fold
INTRODUCTION
Our knowledge of ion channel function has advanced dramatically since the discovery of KcsA, a small prokaryotic K+ channel first identified in the gram-positive bacterium Streptomyces lividans (Schrempf et al. 1995). With only 160 residues, KcsA shares considerable similarity with the core or “pore domain” of voltage-dependent (Kv) channels. Its ability to express at high levels in Escherichia coli (Schrempf et al. 1995; Cortes and Perozo 1997; Heginbotham et al. 1997), as well as its remarkable oligomeric stability in detergents (Cortes and Perozo 1997; Heginbotham et al. 1997), paved the way to the breakthrough determination of its three-dimensional structure, recently solved by x-ray crystallographic methods (Doyle et al. 1998).
The KcsA crystal structure has led to an understanding of the physical basis of ion permeation and selectivity (Doyle et al. 1998; Jiang and MacKinnon 2000), and together with spectroscopic approaches it has also offered a glimpse into the molecular events underlying activation gating (Perozo et al. 1999). Ironically, functional understanding of this channel has lagged our current structural knowledge, since reliable functional studies in KcsA were made possible only after experiments with reconstituted KcsA showed that channel activity can be modulated by pH levels (Cuello et al. 1998). Under these conditions, KcsA displays all of the hallmarks of other well-characterized eukaryotic K+-selective channels, including high selectivity against Na+ (Cuello et al. 1998; Heginbotham et al. 1999) and block by Ba2+ and quaternary ammonium ions (Cuello et al. 1998; Heginbotham et al. 1999; Meuser et al. 1999). Reconstituted KcsA displays a predominant large conductance level (∼140 pS in 250 mM K+) with rectifying properties at large negative potentials (Cuello et al. 1998; Heginbotham et al. 1999; Meuser et al. 1999).
Gating mechanisms of eukaryotic channels are often subject to strict regulatory control by means of phosphorylation cascades, ligand binding, or direct interaction with other cytoplasmic proteins such as heterotrimeric G proteins (Wickman and Clapham 1995; Jonas and Kaczmarek 1996; Hilgemann 1997; Gray et al. 1998). In channels belonging to the voltage-dependent channel super-family, such regulatory mechanisms typically involve extensive cytoplasmic regions found at the NH2 and COOH termini end of the molecule. These cytoplasmic regions participate as modulators of channel function, determine homo- or heterosubunit tetramerization during folding and assembly, or help establish the specific targeting of channels to particular cellular regions (Sheng and Kim 1996). In prokaryotes, it is likely that many of the K+ channels identified from whole-genome sequencing projects will also be subject to regulatory control from the multiple signal transduction cascades found in bacteria and archaea (Bourret et al. 1991; Alex and Simon 1994; Goudreau and Stock 1998), although the true function of their cytoplasmic domains remains to be established.
In the current KcsA structure, features of the transmembrane and extracellular regions of the channel are clearly resolved (Doyle et al. 1998). However, due to a lack of defined electron density, and to the requirements imposed by the crystallization conditions that produced high quality crystals, no structural information exists on the cytoplasmic domains of this channel. These highly charged domains are likely to play a role in controlling or modulating KcsA gating, and could potentially influence the permeation properties of the open channel. Using site-directed spin labeling (SDSL) and electron paramagnetic resonance (EPR) spectroscopy, we have systematically probed regions in the NH2 and COOH termini of KcsA predicted to be soluble and exposed to the cytoplasm. EPR analysis of spin-labeled mutants yields three types of structural information: spin-label dynamics, solvent accessibility of the attached spin label, and inter-spin proximities. This multidimensional data set can be used to derive both global folding patterns and conformational changes in proteins (for reviews see Hubbell et al. 1998; Mchaourab and Perozo 2000). Using this data set, together with the known coordinates from the crystal structure, we have developed a backbone three-dimensional model of full-length KcsA to provide a structural basis for understanding activation gating in this channel.
MATERIALS AND METHODS
Mutagenesis, Expression, and Spin Labeling of KcsA
Cysteine mutants were generated for residues 5–24 and 121–160 in KcsA, covering most of the NH2- and COOH-terminal ends of the channel. Mutagenesis was performed by oligonucleotide mismatch site-directed mutagenesis using the Transformer kit (CLONTECH Laboratories, Inc.) and confirmed by dideoxy DNA sequencing. Mutant channels were expressed and purified as described (Cortes and Perozo 1997). In brief, the construct SKC1-pQE32 containing KcsA with the RGS-(4× His) epitope either at the NH2 or COOH-termini was used to transform E. coli XL-1 blue cells (Stratagene) using standard chemical methods. After protein expression was induced by addition of 1 mM IPTG, membranes were solubilized in PBS containing dodecyl maltoside at room temperature, spin-down at 100,000 g for 1 h, and purified with a Co2+-based metal-chelate chromatography resin (Talon resin; CLONTECH Laboratories, Inc.). Unless noted otherwise, the purified mutant protein was spin labeled overnight with methanethiosulfonate spin label (Toronto Research) at a 10:1 label/channel molar ratio and reconstituted at a 500:1 lipid/channel molar ratio by dilution in PBS (Cuello et al. 1998).
Rb Influx and Stability Assays
The functional state of individual spin-labeled mutants was assessed by measuring the extent of 86Rb+ influx into proteoliposomes containing KcsA, as previously described (Cuello et al. 1998). Each 86Rb+ uptake experiment was reported relative to that of unlabeled, wild-type KcsA in the presence and absence of 5 mM Ba2+, a known K+ channel blocker.
The effects of spin labeling on the oligomeric stability of the mutant channels were evaluated from the changes in the energetics of the tetramer-to-monomer transition during thermal denaturation according to Perozo et al. 1998. Destabilization ΔΔGs were derived from the temperature dependence of denaturation in the presence of SDS using simple gel-shift assays. The mid-point of the denaturation curve was obtained after numerically fitting a Boltzmann function to the data and corresponded to the melting temperature of the tetramer.
Liposome Patch-Clamp Recordings
Liposome-reconstituted KcsA was patch clamped following the method of Delcour et al. 1989, with some modifications. KcsA was reconstituted as above at protein-to-lipid rations varying from 1:1,000 to 1:10,000. The proteoliposome suspension was centrifuged for 1 h at 100,000 g, and the pellet, corresponding to 10 mg of lipids, was resuspended in 60 μl of rehydration buffer. Typically, three drops of the suspension were dried overnight in a desiccation chamber under vacuum for ∼24 h, at which time 20 μl of rehydration buffer were applied to each dried drop. Rehydration was allowed proceed for 5 h, yielding liposomes suitable for patch clamp. All patch-clamp measurements were done in symmetrical conditions: 200 mM KCl and MOPS buffer, pH 4.0, at room temperature. Single-channel currents were recorded with a Dagan 3900 patch clamp amplifier, and currents were sampled at 40 kHz with analogue filter set to 5 kHz (−3 dB). Pipette resistances were 5–10 MΩ.
EPR Spectroscopy and Data Analysis
X-band CW EPR spectra were obtained in a Bruker EMX spectrometer equipped with a loop-gap resonator under the following conditions: 2 mW incident power, 100 kHz modulation frequency, and 1 G modulation amplitude. Power saturation curves were obtained for each spin-labeled mutant after equilibration in N2, air (21% O2), and N2 in the presence of 10 mM Ni-Edda. Data were analyzed and converted to the accessibility parameter Π according to Farahbakhsh et al. 1992. To determine what effects, if any, would the presence of the 6× His tag have on the NH2-terminus data, some experiments were repeated using a construct containing the 6× His tag at the COOH-terminal end. We found no significant differences for the EPR-derived environmental parameters for the first six positions (5–10) in regards to mobility or solvent accessibility. The EPR-derived experimental data was obtained in duplicate for all tested residues.
Power spectra of residue-specific parameters were obtained by applying a discrete Fourier transform to a given data set (Cornette et al. 1987; Donnelly et al. 1994). To determine the location of the solvent-accessible side of a helix, the resultant vector from the sum of all Π values was calculated according to Eisenberg et al. 1984. The angle θ was obtained as the value of the resultant M(ω) evaluated at ω = 100°, taking an arbitrary residue as a reference point (θ = 0). Windowed periodicity analysis was carried out by calculating the periodicity index (αPI) parameter (Cornette et al. 1987) within a defined sliding window (seven to nine residues).
Structure Calculation
Simulated annealing and restrained energy minimization calculations were carried out using InsightII and Discover (Biosym/MSI), with the CVFF force field and a dielectric constant of 4. An extended polyalanine model was constructed and appended, as residues 120–160, on the last position of the crystal structure coordinates (residue 119; Doyle et al. 1998). The side chains of those residues showing reproducible intersubunit spin–spin interactions (see Fig. 4 B) were substituted for a single pseudo-atom representing the location of the unpaired electron in the nitroxide molecule. With a radius rβ = 3.5 Å, this nitroxide pseudo-atom had a volume similar to that of tyrosine, and its center of mass (r1-2) was located 5.5 Å from the Cα (the values for tyrosine are rβ = 3.05 and r1-2 = 3.82 Å). Intersubunit distances were estimated from a combination of two approaches. A convolution of a Lorentzian broadening function (Smirnov et al. 1996; Mchaourab et al. 1997) with the spectra of underlabeled channels was used to estimate the interspin distance range assuming that the major contributor to the broadening was the interaction between next-neighbor subunits. An alternative method was based on a calibration of the extent of the dipolar broadening at specific positions in the transmembrane regions of KcsA with their known intersubunit distances calculated from substituted pseudo-atoms in the crystal structure. A list of the consensus intersubunit distance ranges used to constrain the model is shown in Table . Each hydrogen bond was treated as four distance constraints, a C(i) and N(i+4), and three Cα-Cα (i + 3, i + 4, and i − 3). To maintain canonical secondary structure, target values were set to between 4 and 4.2 Å and between 5 and 6.5 Å.
Figure 4.
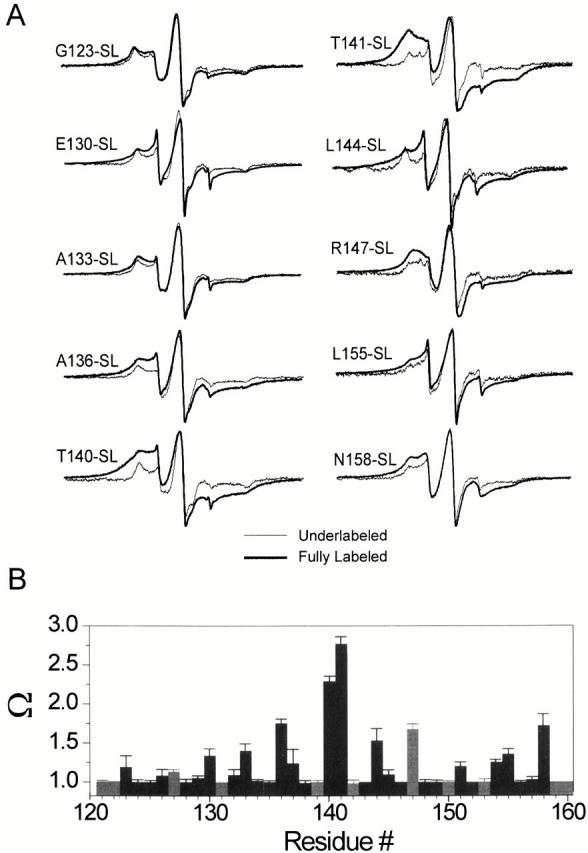
Intersubunit proximities and the distribution of spin–spin dipolar couplings at the COOH terminus of KcsA. (A) CW-EPR spectra of residues showing strong spin–spin interactions. A comparison is made between fully labeled channels (a maximum of four spin/channel), in red, and channels that show no spin–spin interaction by virtue of being underlabeled at a 1:10 label/channel molar ratio (so that on average they have 1 spin/channel), in black. (B) Spin–spin interaction parameter (Ω) calculated for the all residues of the COOH terminus. As the Ω parameter serves as a gross estimate of intersubunit proximity, this particular pattern of per-residue Ω has been taken to indicate the formation of a four-helix bundle. The gray bars represent charged residues.
Table 1.
Consensus Intersubunit Nitroxide Pseudo-atom Distance Constrains for Diagonally Related Subunits
| Residue position | Bounds | Classification |
|---|---|---|
| Å | ||
| 129 | 12–16 | Medium |
| 130 | 12–14 | Medium |
| 132 | 8–12 | Medium |
| 136 | 7–11 | Strong |
| 140 | 5–8 | Strong |
| 141 | 4–7 | Strong |
| 144 | 7–10 | Strong |
| 147 | 9–13 | Medium |
| 155 | 10–14 | Medium |
| 158 | 7–11 | Strong |
Distances were estimated from (a) a convolution of a Lorentzian broadening function (Smirnov et al. 1996; Mchaourab et al. 1997) with the spectra of underlabeled channels, and (b) from the extent of the known dipolar broadening at specific positions in the transmembrane regions of KcsA. The energy function used in calculating the COOH-terminal bundle has the following form:
Vij=12k ij d ij−d ij 0 2,
where k ijis a force constant, while d ij−d ij 0is the difference between the actual and target restraint intersubunit distances.
The initial model was then subjected to a series of minimization steps followed by SA/RMD in the absence of explicit fourfold symmetry. During this protocol, atoms corresponding to the crystal structure (residues 23–119) remained fixed, only contributing van der Waals contacts. Through the initial energy minimization step, the van der Waals interactions were scaled down to 10−6, and gradually increased to 1.0 over 1,500 steps. Simulated annealing was performed by applying 40 ps of molecular dynamics at 1,000°K, followed by cooling to 300°K over a 30-ps period (time step 1 fs), and subsequently subjected to energy minimization. The full-length KcsA model was assembled by attaching an α-helix corresponding to the NH2-terminal sequence to the first residue in the crystal structure (A23), the helix was tilted ∼14° relative to the membrane plane, as derived from membrane depth measurements (see Fig. 2 D). This was followed by a local annealing and minimization step that included only residues 20–24. The statistics of the final model set are summarized in Table . Data analyses, structure display, and figure drawing were carried out using InsightII (Biosym), MOLMOL (Koradi et al. 1996), and Grasp (Nicholls et al. 1991). Atomic coordinates have been deposited in the Protein Data Bank, with accession code 1F6G. The structural implications of the current model were further explored by analyzing the appearance of internal cavities (using the program HOLE; Smart et al. 1996) and by performing an initial electrostatic analysis in vacuo (we used the program Delphi [Nicholls et al. 1991], with all basic and acidic side chains ionized).
Figure 2.
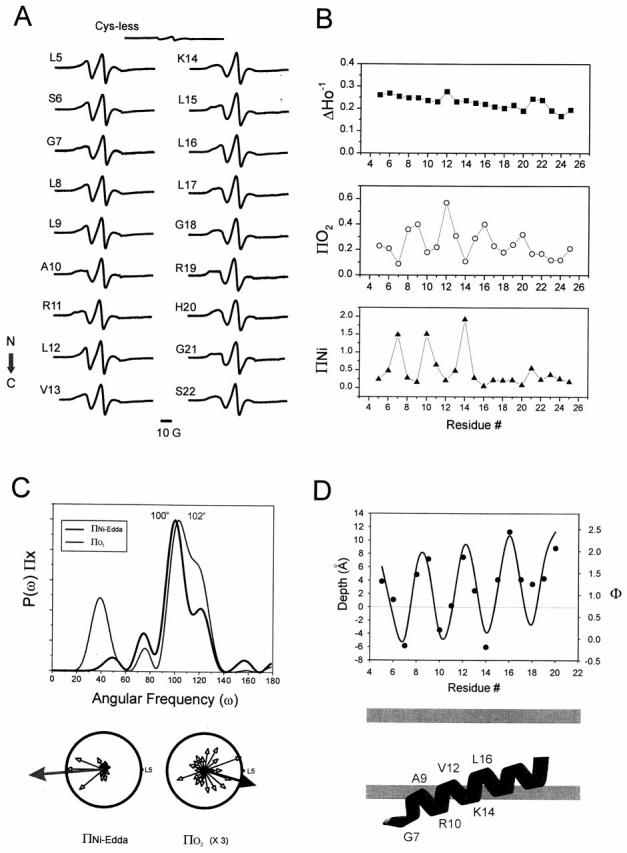
Site-directed spin labeling and structural analysis of the NH2-terminal end. (A) X-band CW-EPR spectra of spin-labeled NH2-terminal mutants reconstituted into asolectin liposomes. In all cases, spectra were obtained with a microwave power of 2 mW and field modulation of 1 G. Spectra are arranged sequentially from the NH2 to the COOH terminus of the segment, in the direction represented by the arrow. (B) Environmental parameter profiles: mobility parameter ΔHo−1 (▪), oxygen accessibility parameter ΠO2 (○), and NiEdda accessibility parameter ΠNiEdda (▴). (C) Fourier analysis of environmental profile data. (Top) Power spectra of the ΠO2 and ΠNiEdda profiles. Peak angular frequencies are 102° and 100°, corresponding to an α-helical structure contacting two distinct environments. Below, both ΠO2 and ΠNiEdda profiles have been plotted in a polar coordinate representation. A resultant vector was calculated for both parameter (ΠNiEdda, blue arrow) and O2 accessibility (ΠO2, red arrow) pointing to the direction of highest accessibility relative to residue L5. (D) Membrane immersion depth of NH2-terminus spin-labeled residues. Positive distances indicate immersion towards the center of the bilayers, relative to the membrane interface. These values have been calculated from a calibration curve of spin-labeled phospholipids following the equation Φ = ln[Π(O2)/Π(NiEdda)] = αD + C. Where Π(O2) and Π(NiEdda) are accessibility parameters for O2 and NiEdda, α is the slope D immersion depth, and C the intercept. Negative values have a very large uncertainty associated and are shown for reference purposes. The continuous curve was drawn according to a geometric model of an α-helix with a 1.5-Å pitch and an insertion angle of 14° relative to the membrane plane.
Table 2.
Structural Statistics and RMSDs for the Calculated Structures of the KcsA COOH Terminus
| Experimental restraints | ||
|---|---|---|
| Total (all subunits) | 438 | |
| Intrasubunit (hydrogen bonds) | 84 | |
| Intersubunits (dipolar coupling) | 15 | |
| Axial (imposed) | 3 | |
| Average rms deviation from distance restraints (Å) | 0.653 | |
| Ramachandran plot | ||
| Most favorable regions (%) | 71.3 | |
| Additional allowed regions (%) | 22.5 | |
| Average rms deviation of atomic coordinates | ||
| Backbone atoms only (Å) | 2.0 ± 0.74 | |
RESULTS
Overall Approach for Structure Determination
The underlying notion driving protein structural determinations using SDSL and EPR spectroscopy is that by obtaining a large number of structural measurements, qualitative in nature, and analyzing their patterns and spatial relations, global conclusions can be made regarding overall structure and conformation (Mchaourab and Perozo 2000). In the present study, the structural analysis of the cytoplasmic regions of KcsA was based on three types of data: dynamic information from individual spectral line shapes (Mchaourab et al. 1996), solvent accessibilities obtained from power saturation experiments (Subczynski and Hyde 1981; Altenbach et al. 1989), and intersubunit proximities derived from through-space dipole–dipole interactions (Rabenstein and Shin 1995; Hustedt et al. 1997; Mchaourab et al. 1997).
EPR spectral line shapes contain information about the motional freedom of the spin label and how it is affected by local steric restrictions. In the absence of a formal line shape analysis for each spectrum, the parameter ΔHo−1 (the inverse of the width of the central resonance line) has been successfully used as an empiric measure of probe mobility (Mchaourab et al. 1996). Additional information can be obtained by investigating differential accessibility of the spin label to broadening reagents of known polarities. Typically, two of such reagents are used, O2, which is highly soluble in the low dielectric of the membrane, and the water-soluble Ni(II) chelate complex NiEdda. Thus, while high O2 accessibility (ΠO2) is indicative of a residue exposed to the membrane, high NiEdda (ΠNiEdda) accessibility reflects exposure to the aqueous environment (Altenbach et al. 1989; Farahbakhsh et al. 1992). Dipole–dipole interactions are reflected in a general broadening of the spectrum, and the extent of this broadening can be used to estimate actual physical distances (Rabenstein and Shin 1995; Hustedt et al. 1997; Mchaourab et al. 1997). This unique pattern of proximities ultimately defines the three-dimensional fold of the protein.
Functional and Structural Consequences of Site-directed Spin Labeling
Individual cysteine mutants were prepared in a background containing a histidine tag at either end of the channel. In this study, unique cysteine mutations were introduced at positions 5–21 in the NH2 terminus of the channel, and residues 121–160 in its COOH terminus (Fig. 1 A). In most cases, cysteine mutants expressed at or near wild-type levels (residues 144 and 146 expressed at ∼50% of wild type); in all cases, mutants were purified as SDS-resistant tetramers and were stable at room temperature. This has been the case for the majority of cysteine mutants throughout the transmembrane segments of KcsA (Perozo et al. 1998), and is taken as an indication that overall, cysteine mutagenesis does not have major consequences in the structural integrity of this molecule.
Figure 1.
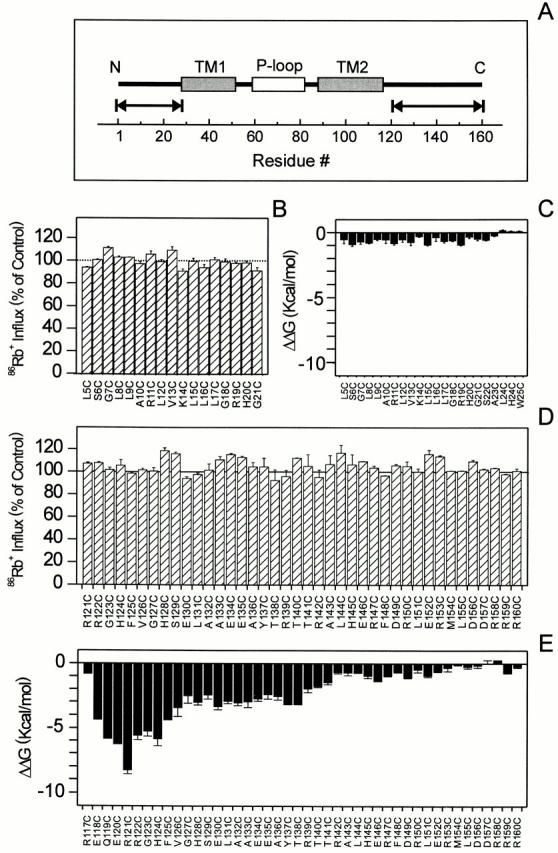
Functional and structural consequences of the site-directed mutagenesis of NH2 and COOH termini. (A) Linear representation of KcsA. The two transmembrane segments are depicted by gray blocks, while the selectivity filter is shown in white. The arrows indicate the location of individual Cysteine mutants. (B and D) Effects of spin labeling on KcsA-catalyzed ionic fluxes. Extent 86Rb+ influx assays of single cysteine mutants at pH 4.0 for NH2 and COOH termini. Values are shown as a percentage of wild-type fluxes. (C and E) Effects of spin labeling on the oligomeric stability of KcsA. A per-subunit destabilization energy was obtained from the following equation: ΔΔG = ΔTm (ΔHo/Tm°)/4, where ΔTm is the difference in the midpoint of the melting curve between wild-type (Tm°) and mutant (Tm*) KcsA, with ΔHo = 263 kcal mol−1, as described by Perozo et al. 1998.
A more quantitative analysis of the effects of attaching a spin label on each of the cysteine mutants was performed based on its effects on channel function and oligomeric stability. We have previously shown that macroscopic KcsA activity can be accurately estimated by measuring the extent of Ba2+-sensitive 86Rb+ influx at acidic pH (Cuello et al. 1998; Perozo et al. 1998). Results from these experiments on fully spin-labeled channels are shown in Fig. 1 B for NH2-terminal mutants, and in D for the COOH-terminal region. Interestingly, all of the tested mutants were found to be functional and, in most cases, the extent of their relative influx did not deviate >10% from that of the wild-type channel. This suggests that, under conditions that favor ion flux, there appears to be little or no functional penalty in attaching spin labels at the majority of residues along the cytoplasmic regions of KcsA.
The relative energies of destabilization due to the incorporation of the spin-label probe can be calculated from the characteristic melting temperature of the tetramer-to-monomer transition obtained from simple gel-shift assays in SDS PAGE (Perozo et al. 1998). This is shown in Fig. 1C and Fig. E, where the relative ΔΔGs of destabilization for NH2 and COOH termini, respectively, are plotted against residue number. Spin-labeling produces destabilization energies ≤1 kcal/mol per subunit in all tested residues along the NH2-terminal end of KcsA, which we take as having essentially the same oligomeric stability as wild-type KcsA. In contrast, residues at the COOH terminus of the channel exhibit three distinct behaviors according to their position along the sequence. Cysteine mutagenesis and spin labeling had little or no structural consequences at the far end of the COOH terminus (residues 142–160), with destabilization ΔΔGs at or near 1 kcal/mol per subunit. The midregion of the COOH terminus (residues 126–141) was moderately destabilized and had ΔΔGs ≤4 kcal/mol per subunit. The largest effects were observed at the end of the second transmembrane segment (TM2), with destabilization ΔΔGs up to 9 kcal/mol per subunit. The sensitivity of this segment of the molecule agrees with the effects on tetrameric stability upon COOH-terminal deletion (Perozo et al. 1999), and may suggest an important role in channel tetramerization. These results support the notion that the majority of the residues in the present mutant set are able to tolerate cysteine mutagenesis without major structural or functional effects, and thus can be used to derive structural information at least at the level of the backbone fold.
Structure of the NH2 Terminus
Examination of the spectral data set derived from the NH2 terminus reveals a remarkable similarity in the line shape of the different spin-labeled mutants (Fig. 2 A). This is reflected in a mobility profile showing very low contrast throughout the length of the segment (Fig. 2 B, top), with most of the ΔHo−1 values falling within the motional regime equivalent to that found on surface residues (Mchaourab et al. 1996). Nonetheless, the NH2 terminus also shows a slight but steady decrease in probe dynamics, starting from residue 5 until the point of initiation of the first transmembrane segment (TM1), near residues 22–24. This would imply that the region of the channel as a whole is not likely to participate in any tertiary or quaternary contacts, as it probably extends away from the bulk of the tetramer from its junction with TM1. The fact that there is no evidence of spin–spin coupling at any position along this segment, despite the presence of up to four spins per subunit, lends support to this notion. As control for all spectral determinations, we have reacted wild-type KcsA (cysteineless) with methanethiosulfonate spin label as with all of the cysteine mutants and the resulting spectra is shown in Fig. 2 A, top. As previously reported by Gross et al. 1999, we find that the nonspecific signal is only ∼5% of the total signal amplitude from the vast majority of positions.
Although a featureless mobility profile could be interpreted as an indication of a lack of secondary structure, O2 and NiEdda accessibility profiles for the NH2 terminus of KcsA reveal a strongly periodic behavior (Fig. 2 B, middle and bottom). Frequency analysis in Fourier space was used to extract the components of angular periodicity for both ΠO2 and ΠNiEdda accessibility profiles (Fig. 2 C). In each case, the power spectra showed the main frequency peaks to be at or near 100°, a clear indication of the α-helical nature of this segment. When the individual accessibility values were projected on a helical wheel, the resultant vectors for ΠO2 and ΠNiEdda were almost 180° out of phase (Fig. 2 C, bottom). The opposite orientations of these two accessibility moments strongly suggest that the NH2 terminus is an α-helix positioned at the lipid–water interface, and the sharp drop in NiEdda accessibility around residues 15 and 16 may suggest a point of full insertion into the membrane. We have calculated the approximate depths of insertion for each of the NH2-terminal residues from the ratio between ΠO2 and ΠNiEdda (Altenbach et al. 1994). This profile was fitted to a geometric model of a straight α-helix with a pitch of 1.5 Å and an insertion angle of ∼14° relative to the plane of the bilayer. This information allowed us to propose a specific topological model of the NH2 terminus relative to the membrane shown at the bottom of Fig. 2 D.
Structure of the COOH Terminus
In contrast to the NH2 Terminus, the COOH terminus of KcsA exhibits a wide range in the dynamic behavior of individual residues. Fig. 3 A shows the EPR spectral data set obtained from residues 121–160. *Spectra were obtained under conditions that ensured the absence of dipolar coupling (see below).
Figure 3.
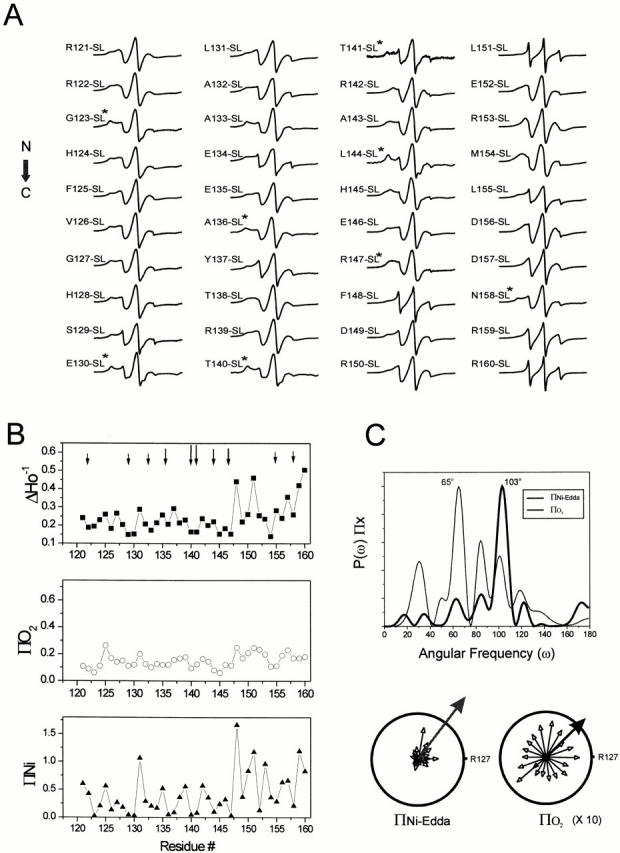
Site-directed spin-labeling and structural analysis of the COOH-terminal end. (A) CW-EPR spectra of reconstituted spin-labeled NH2-terminal mutants. Details are similar to those in Fig. 2 A. *Spectra have been obtained at underlabeling conditions so that on average there is one spin-label per tetramer. (B) Environmental parameter profiles: mobility parameter ΔHo−1 (▪), oxygen accessibility parameter ΠO2 (○), and NiEdda accessibility parameter ΠNiEdda (▴). Arrows indicate residues that show spin–spin interaction. (C) Fourier analysis of environmental profile data. The power spectra of the ΠO2 and ΠNiEdda profiles are shown (top), with peak angular frequencies of 65° and 103°. This corresponds, in the case of the ΠNiEdda profile, to a strong α-helical signal. A resultant vector was calculated for both parameters (ΠNiEdda, blue arrow) and O2 accessibility (ΠO2, red arrow) pointing to the direction of highest accessibility relative to residue R127.
The ΔHo−1 profile shows that the COOH terminus can be divided into two regions of different overall dynamics: a segment of low and intermediate mobility encompassing residues 121–147 and a highly dynamic region containing the last 13 residues of KcsA (Fig. 3 B, top). The presence of a relatively large number of motionally restricted positions along the entire length of the COOH terminus implies that this region of KcsA is involved in extensive intra- or intersubunit interactions. In fact, there is a clear correlation between the dynamic behavior of a given residue and its solvent accessibility. Analysis of the NiEdda accessibility profile (Fig. 3 B, bottom) reveals that the same set of residues displaying restricted mobility are also solvent inaccessible, as expected from protein regions that are not exposed to the aqueous milieu. Furthermore, residues with the highest motional freedom, at the end of the COOH terminus, have the highest NiEdda accessibilities. In contrast, the O2 accessibility profile is largely featureless and appears low throughout the entire segment (Fig. 3 B, middle).
Frequency analysis performed on the accessibility profiles reveals two different behaviors. On one hand, there is a strong α-helical periodicity in the COOH terminus ΠNiEdda profile, as derived from the dominant peak in the power spectrum of Fig. 3 C (thick line). The ΠO2 profile, on the other hand, displays a major peak at 65° with no significant components near the expected frequencies for α-helices or β-sheets. A likely explanation for this discrepancy is that the COOH terminus of KcsA may form a structure with crevasses or cavities large enough to allow free diffusion of O2, but not of NiEdda. Therefore, only the NiEdda accessibility profile has enough contrast to reveal structurally related periodicities. In effect, when individual accessibility moments are calculated (Fig. 3 C, bottom), the direction of the resultant vectors for ΠO2 and ΠNiEdda coincide.
Additional information about how this helical region may assemble in three dimensions comes from the study of the extent and distribution of spin–spin interactions. These interactions originate from trough-space dipolar coupling between the unpaired electrons, and reveal themselves as a Lorentzian-type broadening of the standard spectral line shape (Eaton and Eaton 1989). Fig. 4 A shows a comparison of spectra obtained from selected residues, either fully labeled (black traces) or under labeled at a 1:10 ratio spin-label:protein (red traces), so that on average there is only one spin label per channel. When fully labeled, a number of COOH-terminal residues show significant spin–spin interactions, with residues near the middle of the COOH terminus (T140, T141) displaying the largest broadening. In a tetrameric system like KcsA, these interactions can only take place from same-residue intersubunit interactions near the axis of symmetry. Consequently, this result can be taken as compelling evidence to suggest that the COOH terminus in KcsA forms a four-helix bundle, with likely fourfold symmetry.
The extent of inter-nitroxide spin–spin interactions is used as the primary data to obtain distance information in spin-labeled proteins. Current methods include convolution or deconvolution of the spectral broadening induced by the dipolar coupling (Rabenstein and Shin 1995; Mchaourab et al. 1997), or global analysis that includes explicit terms for the relative orientation of the spin labels (Hustedt et al. 1997). These methods are applicable only to pairs of spin labels, but because of the homotetrameric configuration of KcsA, distance determinations are the result of the geometric interaction between next-neighbor and diagonally related subunits. In the absence of more accurate methods to quantify distances in KcsA, a gross estimate of the extent of spin–spin coupling can be obtained from the Ω parameter, an operationally defined value calculated from the normalized amplitude ratio between the under-labeled and fully labeled spectra (Perozo et al. 1998). Spin-labeled positions in close proximity will have large Ω values, but as the interspin separation increases, the Ω parameter decreases to one (no spin–spin coupling). Fig. 4 B shows that the Ω profile of the COOH terminus presents a roughly pyramidal distribution, in which residues at the center of the 121–160-residue segment are closer to each other than residues at either end. This particular distribution of intersubunit proximities cannot be explained by a parallel arrangement of the helices in the bundle, and strongly suggests a definitive interhelical angle in which the narrowest point of the bundle is located at or near residue T141. Interestingly, there is a noticeable increase in the Ω values at the very end of the segment (particularly residue N158). Coupled with the existence of two distinct regions of mobility (Fig. 3 B), this finding suggests the presence of a separate intersubunit association at the end of the COOH terminus. Although each individual Ω value is an approximate estimate of intersubunit proximity, the unique pattern of proximities along the full set of COOH-terminal residues can be used to reliably determine an overall three-dimensional fold for this region of KcsA.
The Molecular Architecture of Full-Length KcsA
A more specific assignment of the α-helical components for both NH2 and COOH termini, was obtained from αPI plots shown in Fig. 5 A. The αPI is a weighted-area ratio of the α-helical frequency components (80°–120°) relative to the entire power spectrum, and for values ≥2, it defines statistically significant α-helical regions (Cornette et al. 1987). This approach allows for the unbiased assignment of secondary structure elements within a couple of residues (Rees et al. 1989), as previously shown in KcsA (Perozo et al. 1998). For the NH2 terminus, the αPI derived from the ΠO2 profile is significantly α-helical in most of the analyzed stretch, dropping below ∼2 in a short region next to the expected point of insertion to the first transmembrane segments TM1 (Fig. 5 A). For the COOH terminus, analysis of the ΠNiEdda profile reveals three α-helical regions joined by two nonhelical “linkers” regions of different length (Fig. 5 B). Additionally, when the periodicity index is computed specifically for frequencies associated with coiled-coil structures (100°–140°), a statistically significant helical region emerges at the end of the COOH-terminus. Prediction algorithms based on primary sequence (coils; Lupas et al. 1991) also reveal high coiled-coil propensity for the last 12 residues of the COOH terminus (data not shown). The final secondary structure assignment is shown in Fig. 5 C. The NH2 terminus is α-helical up to position 20 to 21, where a sort stretch of two to three residues connects to TM1. The COOH terminus contains three distinct helices: the first one is an extension of TM2 to position 122 to 123, the second one is at least 16 residues long, and the final one includes the last 8–10 residues of this domain.
Figure 5.

Secondary structure assignment and three-dimensional architecture from SA/RMD runs. (A) Windowed periodicity analysis of the O2 accessibility parameter (ΠO2) from residues at the NH2 terminus of KcsA. A nine-residue window was used to calculate the αPI (Cornette et al. 1987), and values ≥2 were taken as an indication of a statistically significant α-helix within the window. (B) Windowed periodicity analysis of the NiEdda accessibility parameter (ΠNiEdda) from residues at the COOH terminus of KcsA. Periodicities for standard α-helix (•) and coiled-coil helix (○) were analyzed as in A. Also shown is a plot of the α-coiled-coil propensity-calculated based on amino acid sequence according to the program COILS (Lupas et al. 1991). (C) Secondary structure assignment for the NH2- and COOH-terminal regions of KcsA. (D) Stereo representation of Cα diagrams of the eight lowest energy symmetric structures assembled from 32 independent SA/RMD runs of KcsA residues 23–160. Numbers signal the approximate location of specific residues. This picture was drawn using MOLMOL (Koradi et al. 1996).
To simplify our modeling, once assigned, secondary structure elements were considered essentially rigid and a pattern of proximity ranges among these secondary structure elements was estimated based on the location and extent of the intersubunit dipole–dipole interactions. This set of constraints was used to compute a number of three-dimensional folds using simulated annealing methods (SA/RMD; Nilges et al. 1988). Intrasubunit constraints were defined according to the hydrogen-bonding pattern from the assigned secondary structure elements (Fig. 5 C) and were given a high penalty value. Additionally, intersubunit constraints were imposed between identical pseudo-atom positions in each subunit, both for next-neighbor residues and for diagonally related residues. In all cases, the structures converged to a right-handed helical bundle with a shorter helix at the end of the COOH terminus, joined together by a relatively poorly defined six-residue loop. Individual monomers from the nonsymmetric structures were used to construct symmetric KcsA tetramers by imposing fourfold transformations. The eight lowest-energy structures are shown in Fig. 5 D. The average structure of the COOH-terminus monomer (residues 120–160) had a mean global backbone RMSD of 2.0 ± 0.74 Å, with >71% of the residues appearing in the most favored regions of the Ramachandran plot, as validated with PROCHECK (Laskowski et al. 1996; Table ). This compares well with the structural statistics of the membrane regions of KcsA, for which 74% of the residues are included in the most favored regions of the Ramachandran plot (Doyle et al. 1998).
After appending the NH2-terminal residues to the channel core (as modeled in Fig. 2 D), and replacing all COOH-terminal alanines and spin-label pseudo-atoms for wild-type side chains, a final full-length KcsA model was constructed by applying a global minimization step to the resulting aggregate structure. This differs from the standard SA/RMD approach (Nilges et al. 1988), but it seemed to us as a logical and unbiased approach, given the lack of specific side chain information derived from EPR experiments. Fig. 6 A shows this final average fold in the context of the lipid membrane. In agreement with the data, the COOH terminus forms a right-handed four-helix bundle, joined to the inner TM2 helix by a short flexible loop and flanked at its end by a loosely associated helical bundle that includes the last 10 residues of the molecule. The NH2 terminus forms an amphipathic α-helix at the membrane–water interface that protrudes away from the channel core, and does not interact with any other part of the channel (except perhaps near its insertion point to TM1). Direct mapping of the EPR data onto the accessible surface of the average structure (Fig. 6 B) demonstrates an excellent correspondence between the surface patterns of the mobility, accessibility, and proximity parameters with the proposed overall fold. In general, residues involved in quaternary contacts display low mobility and low solvent accessibility, while residues near the symmetry axis show extensive spin–spin interactions. Residues with the highest motional freedom at both extremes of the molecule also displayed the largest levels of NiEdda accessibility.
Figure 6.

The full-length structure of KcsA and its correlation with the EPR data. Ribbon diagram representation of the mean full-length KcsA structure in relation to the membrane bilayer. (B) EPR-derived structural data mapped onto KcsA solvent-accessible surface. (Top left) Probe mobility (ΔHo−1), (top right) spin–spin interaction (Ω), (bottom left) oxygen accessibility parameter (ΠO2), and (bottom right) NiEdda accessibility parameter (ΠNiEdda). For clarity, only two subunits are displayed.
To explore some of the implications of this model, we used the average structure (Fig. 6 A) to calculate molecular accessible surfaces and cavities, and to perform a simple electrostatic analysis of KcsA (not shown). In the present model, the internal cavity along full-length KcsA extends almost 100 Å along the axis of symmetry, as the COOH-terminal bundle is proposed to reach some 50 Å into the cytoplasm (Fig. 6 A). The inner surface of full-length KcsA (Smart et al. 1996), suggests the presence of a large, water-filled cavity immediately below the TM2 bundle constriction. This cavity is a consequence of the opposing orientations of the interhelical angles for TM2 and the COOH-terminal bundle and, because of the loose packing of the residues in the connecting loop, it is expected that it might be surrounded by a set of “windows”. These windows are not likely to present a diffusional barrier to hydrated ions and other small molecules, and therefore may represent part of the natural ion permeation path during ion conduction in KcsA.
An initial electrostatic analysis of the whole molecule indicates the presence of distinct regions of potential along the cytoplasmic surface of KcsA. The isopotential contours at ±1 kT/e reveals a complex interplay among the large number of charged residues present in both NH2 and COOH termini. There is a large positive potential that surrounds the channel precisely at the level of the membrane–water interface. This may suggest a role for the NH2 terminus in the physical anchoring of the channel to the membrane, since positive residues in this region could form ionic interactions with negatively charged lipids located at the inner leaflet of the bilayer. Closer inspection of the critical region that extends the α-helical conformation of TM2 beyond the current crystallographic model highlights the presence of a cluster of charged residues that include R117, E118, E120, R122, and H124 (Fig. 7 B, right). This cluster might form a complex intersubunit charge network, representing a prime candidate for the location of the putative “pH sensor” responsible for triggering channel openings at low pH. Clearly, because our present model is limited to backbone features, further experiments are needed to determine the precise role of these charged residues on pH-dependent activation.
Figure 7.

Functional consequences of COOH-terminal deletions. (A) Representative single-channel traces from full-length KcsA and chymotrypsin-truncated KcsA (Δ125) from reconstituted proteoliposomes. Stationary recordings were obtained at 80 mV in symmetric 200 mM K+, pH 4.0, and were filtered at 2 kHz. Calibration scales are 10 pA and 250 ms. (B) Single-channel I-V curves calculated for control (•) and Δ125 (○) channels. Single-channel conductances calculated from the slope around 0 mV are 100 and 102 pS. (C) Effect of progressive COOH-terminal deletions on the pH dependence of 86Rb+ influx. Error bars represent the SD and correspond to three to nine experiments. Individual curves were fitted to the Hill equation and the corresponding parameters for each truncation construct (apparent pKa and Hill coefficient, n) are plotted as a bar graph (right).
Functional Implications of COOH-terminal Deletions
Fig. 7 A clearly demonstrates that the COOH-terminal domain appears to have no significant influence on ion conduction in KcsA. At pH 4.0 and in symmetrical K+ solutions, deletion of most of the COOH-terminal end by chymotrypsin cut (Δ125) does not affect single-channel currents and appears to have minimal effects on dwell times (not shown). In 200 mM K+, single-channel conductances obtained from I-V relations (Fig. 7 B) were essentially identical (∼100 pS), although the I-V curve for the Δ125 channel flattens out at positive potentials. In the absence of the highly charged COOH terminus, this effect might be due to an increased sensitivity to blockers, or may even originate from changes in the local electrostatic field near the permeation pathway.
The role of the COOH terminus on pH-dependent gating was studied with three sequential deletion constructs: Δ140 (deletion to the middle of the helix bundle), Δ125 (deletion to the COOH-terminal linker), and Δ120 (deletion to the end of TM2). The pH dependence of 86Rb+ influx was analyzed for each deletion construct, as shown in Fig. 7 C. While construct Δ140 showed minimal effects on pH dependence and apparent pKa, further deletions revealed both a progressive shift in the apparent pKa towards higher pH and a decrease in the pH dependence of channel activation (empirically estimated from the Hill number). This behavior seems to correlate well with the dynamics of the different regions of the COOH-terminal bundle (Fig. 3 B). Although these results clearly point to a role of the COOH terminus in modulating pH-dependent gating (probably by stabilizing the closed state), all of the tested KcsA deletion constructs were able to fully close at pH 9.0, firmly demonstrating that the COOH-terminal end does not form part of the activation gate.
DISCUSSION
Using site-directed spin labeling and electron paramagnetic spectroscopic methods, we have derived the solution three-dimensional fold of the NH2- and COOH-terminal regions of the KcsA K+ channel embedded in a lipid bilayer. This information was used to propose a model of full-length KcsA in which the NH2 terminus of the channel is an interfacial helix stretching some 35–40 Å away from its transmembrane core, while the COOH-terminal end forms a helical bundle extending ∼40–50 Å into the cytoplasm.
Cytoplasmic helical bundles are emerging as a common structural motif in a number of ion channels and other signaling membrane proteins. Not counting the difference in the number of subunits, the present KcsA structure is reminiscent of the large-conductance mechanosensitive channel MscL found in a number of bacteria (Chang et al. 1998). As in KcsA, the MscL COOH-terminal structure forms a highly charged five-helix bundle. The function of this region remains largely unknown, as deletion experiments suggest that this domain does not seem to play a direct role in mechanosensitivity (Blount et al. 1996; Hase et al. 1997). A similar four-helix cytoplasmic bundle has also been reported recently for the bacterial chemotaxis receptor family (Kim et al. 1999). This cytoplasmic domain is linked directly to the second transmembrane segment of the receptor, serving as the basis for effector signaling to downstream proteins and as the target of modulation action through residue methylation (Falke et al. 1997). In eukaryotic Kv channels, although cytoplasmic domains form more complicated structures, the possible role of cytoplasmic helical bundles in Kv channels was recently highlighted by the finding that in Shaker channels, the T1 tetramerization domain can be functionally replaced with a structure reminiscent of the COOH terminus of KcsA, the simple four helix parallel coiled-coil GCN4-L1 (Zerangue et al. 2000).
Recent experiments have shown that deletion of the first 20 residues in KcsA is associated with a dramatic reduction in expression levels (Perozo et al. 1999; Cortes, D.M., and E. Perozo, unpublished observations). This may indicate that, as in other membrane proteins, the NH2 terminus of KcsA contains signaling information important for the correct folding and targeting of the channel in the inner membrane. However, in the absence of any additional experimental information, and given the fact that this domain does not appear to participate in major tertiary or quaternary contacts, it is difficult to unambiguously assign an additional functional role for this region of KcsA. In contrast, there is considerable evidence suggesting that the COOH-terminal domain plays an important role in gating. Deletion experiments have shown that proteolytic removal of most of the COOH terminus (Δ125–160) produces an increase in resting 86Rb+ fluxes at neutral pH with a simultaneous decrease in oligomeric stability, pointing to the importance of the COOH terminus in the stabilization of the closed state (Perozo et al. 1999).
The location and packing arrangement of the COOH-terminal bundle in the present full-length structure leads to important questions regarding the likely permeation path followed by ions in full-length KcsA. While the details of the possible pH-dependent conformational changes in these cytoplasmic domains remain to be established, it is clear that the predicted water-filled cavity and associated openings underneath the membrane-embedded channel core represent a potential entryway for ions into the transmembrane pore. Indeed, experiments shown in Fig. 7 A argue that the presence of the COOH-terminal end has no significant effect on the permeation properties of KcsA, and thus imply that the ion permeation path does not extend to the COOH-terminal bundle. Given that the current structure was obtained at neutral pH (and thus corresponds to the closed conformation of the channel; Cuello et al. 1998), it is likely that access of ions to this aqueous cavity will be further enhanced in the open state. Interestingly, a similar argument has recently been put forth for the ion permeation pathway in the acetylcholine receptor (Miyazawa et al. 1999) and for Shaker K+ channels (Gulbis et al. 2000).
Although originally considered extracellular (Cuello et al. 1998), recent electrophysiological evidence revealed that the “pH sensor” responsible for transducing proton binding into helix movement during gating in KcsA is indeed exposed to the cytoplasm (Heginbotham et al. 1999; Meuser et al. 1999). Considering that under physiological conditions intracellular pH levels are tightly regulated in most organisms, protons are not likely to serve as natural activators of KcsA. Thus, it is logical to suggest that, given its proposed overall fold and high charge density, the COOH terminus may serve as a receptor for a still unidentified cytoplasmic activator protein or ligand.
The fact that, even in the absence of the entire COOH terminus, KcsA is still able to gate in a pH-dependent manner points to a stretch of charges located at the end of TM2 as a potential site for the pH sensor of KcsA. COOH-terminal deletions appear to have only marginal effects on the pH dependence and apparent pKa of KcsA activation for most of the length of the bundle, yet significant changes in pH dependence do occur as the regions deleted approach the charge cluster at the end of TM2 (Δ120 and Δ125). While the current structure does not contain information regarding the orientation of specific side chains, the overall arrangement of the helices in this region suggests possible intersubunit electrostatic interactions that can be drastically affected by changes in pH or by binding of a specific charged ligand or lipid. Under these conditions, local rearrangements may propagate to the transmembrane regions of the molecule, triggering the types of gating-related movements seen for TM1 and TM2 (Perozo et al. 1999).
It is important to note that due to the particular data set used in the structure calculations, the accuracy of the present structure is limited in three important ways. Secondary structure assignment depends on the periodicity analysis of a finite stretch of sequence, which makes dealing with short segments of secondary structure problematic. Additionally, because of the fourfold symmetry of fully labeled channels, actual internitroxide distances cannot be computed and have been estimated only within approximate ranges. Finally, because all of the long-range constraints in the structure were derived from intersubunit interactions, the resolution along the membrane normal is limited, and this will affect the actual dimensions of the COOH-terminal bundle as well as the precise conformation of the loop linking TM2 and the COOH-terminal helix. While some of these caveats are intrinsic to the current SDSL approach, we have tried to minimize these problems by concentrating on “pattern analysis” and on the reliability of the individual measurements. In fact, the entire SDSL analysis of the COOH-terminal end was independently performed twice with essentially identical results. Slight differences in probe mobility and NiEdda accessibility produced no major changes in our proposed three-dimensional KcsA model, at least given the accuracy of the available data.
In spite of these limitations, the proposed fold offers a first glimpse at full-length KcsA, setting the stage for further experimental tests of specific predictions related to the physiological control of KcsA activity. Clearly, given the pattern of intersubunit spin–spin interactions in the linker region between the end of TM2 and the start of the COOH-terminal bundle, this is the least defined region in our model. Additional information derived from intrasubunit distance measurements or the determination of longer-range intersubunit distances (i.e., using pulsed EPR) will certainly help define the true conformation of this region. We expect that the use of SDSL and EPR spectroscopy to derive three-dimensional folds in oligomeric proteins will be further improved by calculating more precise distances from tandem dimer constructs and by including a potential term derived from EPR-derived solvent accessibility measurements as a restraint. This term can be applied as part of a refinement step once a family of structures has been generated using the present methods. Such approach might find a general use in structural dynamics studies of membrane proteins and other systems in which traditional structural methods are still difficult to apply.
Acknowledgments
We thank Drs. Robert Nakamoto and Pornthep Sompornpisut for critical reading of the manuscript, Dr. Boris Martinac for advice on liposome patch clamping, Drs. Yeon-Kyun Shin and Wenzhong Xiao for sharing SA/MD protocols, and the members of the Perozo lab (Y.-S. Liu, C. Ptak, A. Shen, and P. Sompornpisut) for insightful discussions.
This study was supported by the National Institutes of Health (grants GM54690 and GM57846) and the McKnight endowment fund for neuroscience.
Footnotes
Abbreviations used in this paper: EPR, paramagnetic resonance; Kv channel, voltage-dependent channel; αPI, periodicity index; SDSL, site-directed spin labeling; TM2, second transmembrane segment.
References
- Alex L.A., Simon M.I. Protein histidine kinases and signal transduction in prokaryotes and eukaryotes. Trends Genet. 1994;10:133–138. doi: 10.1016/0168-9525(94)90215-1. [DOI] [PubMed] [Google Scholar]
- Altenbach C., Flitsch S.L., Khorana H.G., Hubbell W.L. Structural studies on transmembrane proteins. 2. Spin labeling of bacteriorhodopsin mutants at unique cysteines. Biochemistry. 1989;28:7806–7812. doi: 10.1021/bi00445a042. [DOI] [PubMed] [Google Scholar]
- Altenbach C., Greenhalgh D.A., Khorana H.G., Hubbell W.L. A collision gradient method to determine the immersion depth of nitroxides in lipid bilayersapplication to spin-labeled mutants of bacteriorhodopsin. Proc. Natl. Acad. Sci. USA. 1994;91:1667–1671. doi: 10.1073/pnas.91.5.1667. [DOI] [PMC free article] [PubMed] [Google Scholar]
- Blount P., Sukharev S.I., Schroeder S.K., Nagle, Kung C. Single residue substitutions that change the gating properties of a mechanosensitive channel in Escherichia coli . Proc. Natl. Acad. Sci. USA. 1996;93:11652–11657. doi: 10.1073/pnas.93.21.11652. [DOI] [PMC free article] [PubMed] [Google Scholar]
- Bourret R.B., Borkovich K.A., Simon M.I. Signal transduction pathways involving protein phosphorylation in prokaryotes. Annu. Rev. Biochem. 1991;60:401–441. doi: 10.1146/annurev.bi.60.070191.002153. [DOI] [PubMed] [Google Scholar]
- Chang G., Spencer R.H., Lee A.T., Barclay M.T., Rees D.C. Structure of the MscL homolog from Mycobacterium tuberculosisa gated mechanosensitive ion channel. Science. 1998;282:2220–2226. doi: 10.1126/science.282.5397.2220. [DOI] [PubMed] [Google Scholar]
- Cornette J.L., Cease K.B., Margalit H., Spouge J.L., Berzofsky J.A., DeLisi C. Hydrophobicity scales and computational techniques for detecting amphipathic structures in proteins. J. Mol. Biol. 1987;195:659–685. doi: 10.1016/0022-2836(87)90189-6. [DOI] [PubMed] [Google Scholar]
- Cortes D.M., Perozo E. Structural dynamics of the Streptomyces lividans K+ channel (SKC1)oligomeric stoichiometry and stability. Biochemistry. 1997;36:10343–10352. doi: 10.1021/bi971018y. [DOI] [PubMed] [Google Scholar]
- Cuello L.G., Romero J.G., Cortes D.M., Perozo E. pH-Dependent gating in the Streptomyces lividans K+ channel. Biochemistry. 1998;37:3229–3236. doi: 10.1021/bi972997x. [DOI] [PubMed] [Google Scholar]
- Delcour A.H., Martinac B., Adler J., Kung C. Modified reconstitution method used in patch-clamp studies of Escherichia coli ion channels. Biophys. J. 1989;56:631–636. doi: 10.1016/S0006-3495(89)82710-9. [DOI] [PMC free article] [PubMed] [Google Scholar]
- Donnelly D., Overington J.P., Blundell T.L. The prediction and orientation of alpha-helices from sequence alignmentsthe combined use of environment-dependent substitution tables, Fourier transform methods and helix capping rules. Prot. Eng. 1994;7:645–653. doi: 10.1093/protein/7.5.645. [DOI] [PubMed] [Google Scholar]
- Doyle D.A., Cabral J.M., Pfuetzner R.A., Kuo A., Gulbis J.M., Cohen S.L., Chait B.T., MacKinnon R. The structure of the potassium channelmolecular basis of K+ conduction and selectivity. Science. 1998;280:69–77. doi: 10.1126/science.280.5360.69. [DOI] [PubMed] [Google Scholar]
- Eaton G.R., Eaton S.S. Resolved electron–electron spin–spin splittings in EPR spectra. In: Berliner, editor. Biological Magnetic Resonance. Vol. 8 L.J.A.R. Plenum Publishing Co; New York, NY: 1989. pp. 340–397. [Google Scholar]
- Eisenberg D., Weiss R.M., Terwilliger T.C. The hydrophobic moment detects periodicity in protein hydrophobicity. Proc. Natl. Acad. Sci. USA. 1984;81:140–144. doi: 10.1073/pnas.81.1.140. [DOI] [PMC free article] [PubMed] [Google Scholar]
- Falke J.J., Bass R.B., Butler S.L., Chervitz S.A., Danielson M.A. The two-component signaling pathway of bacterial chemotaxisa molecular view of signal transduction by receptors, kinases, and adaptation enzymes. Annu. Rev. Cell Dev. Biol. 1997;13:457–512. doi: 10.1146/annurev.cellbio.13.1.457. [DOI] [PMC free article] [PubMed] [Google Scholar]
- Farahbakhsh Z.T., Altenbach C., Hubbell W.L. Spin labeled cysteines as sensors for protein–lipid interaction and conformation in rhodopsin. Photochem. Photobiol. 1992;56:1019–1033. doi: 10.1111/j.1751-1097.1992.tb09725.x. [DOI] [PubMed] [Google Scholar]
- Goudreau P.N., Stock A.M. Signal transduction in bacteriamolecular mechanisms of stimulus-response coupling. Curr. Opin. Microbiol. 1998;1:160–169. doi: 10.1016/s1369-5274(98)80006-4. [DOI] [PubMed] [Google Scholar]
- Gray P.C., Scott J.D., Catterall W.A. Regulation of ion channels by cAMP-dependent protein kinase and A-kinase anchoring proteins. Curr. Opin. Neurobiol. 1998;8:330–334. doi: 10.1016/s0959-4388(98)80057-3. [DOI] [PubMed] [Google Scholar]
- Gross A., Columbus L., Hideg K., Altenbach C., Hubbell W.L. Structure of the KcsA potassium channel from Streptomyces lividansa site-directed spin labeling study of the second transmembrane segment. Biochemistry. 1999;38:10324–10335. doi: 10.1021/bi990856k. [DOI] [PubMed] [Google Scholar]
- Gulbis J.M., Zhou M., Mann S., MacKinnon R. Structure of the cytoplasmic b subunit-T1 assembly of voltage-dependent K+ channels. Science. 2000;289:123–127. doi: 10.1126/science.289.5476.123. [DOI] [PubMed] [Google Scholar]
- Hase C.C., Le Dain A.C., Martinac B. Molecular dissection of the large mechanosensitive ion channel (MscL) of E. colimutants with altered channel gating and pressure sensitivity. J. Membr. Biol. 1997;157:17–25. doi: 10.1007/s002329900212. [DOI] [PubMed] [Google Scholar]
- Heginbotham L., Odessey E., Miller C. Tetrameric stoichiometry of a prokaryotic K+ channel. Biochemistry. 1997;36:10335–10342. doi: 10.1021/bi970988i. [DOI] [PubMed] [Google Scholar]
- Heginbotham L., LeMasurier M., Kolmakova-Partensky L., Miller C. Single streptomyces lividans K+ channelsfunctional asymmetries and sidedness of proton activation. J. Gen. Physiol. 1999;114:551–560. doi: 10.1085/jgp.114.4.551. [DOI] [PMC free article] [PubMed] [Google Scholar]
- Hilgemann D.W. Cytoplasmic ATP-dependent regulation of ion transporters and channelsmechanisms and messengers. Annu. Rev. Physiol. 1997;59:193–220. doi: 10.1146/annurev.physiol.59.1.193. [DOI] [PubMed] [Google Scholar]
- Hubbell W.L., Gross A., Langen R., Lietzow M.A. Recent advances in site-directed spin labeling of proteins. Curr. Opin. Struct. Biol. 1998;8:649–656. doi: 10.1016/s0959-440x(98)80158-9. [DOI] [PubMed] [Google Scholar]
- Hustedt E.J., Smirnov A.I., Laub C.F., Cobb C.E., Beth A.H. Molecular distances from dipolar coupled spin-labels—the global analysis of multifrequency continuous wave electron paramagnetic resonance data. Biophys. J. 1997;72:1861–1877. doi: 10.1016/S0006-3495(97)78832-5. [DOI] [PMC free article] [PubMed] [Google Scholar]
- Jiang Y.X., MacKinnon R. The barium site in a potassium channel by x-ray crystallography. J. Gen. Physiol. 2000;115:269–272. doi: 10.1085/jgp.115.3.269. [DOI] [PMC free article] [PubMed] [Google Scholar]
- Jonas E.A., Kaczmarek L.K. Regulation of potassium channels by protein kinases. Curr. Opin. Neurobiol. 1996;6:318–323. doi: 10.1016/s0959-4388(96)80114-0. [DOI] [PubMed] [Google Scholar]
- Kim K.K., Yokota H., Kim S.H. Four-helical-bundle structure of the cytoplasmic domain of a serine chemotaxis receptor. Nature. 1999;400:787–792. doi: 10.1038/23512. [DOI] [PubMed] [Google Scholar]
- Koradi R., Billeter M., Wuthrich K. MOLMOLa program for display and analysis of macromolecular structures. J. Mol. Graph. 1996;14:51–55. doi: 10.1016/0263-7855(96)00009-4. [DOI] [PubMed] [Google Scholar]
- Laskowski R.A., Rullmannn J.A., MacArthur M.W., Kaptein R., Thornton J.M. AQUA and PROCHECK-NMRprograms for checking the quality of protein structures solved by NMR. J. Biomol. NMR. 1996;8:477–486. doi: 10.1007/BF00228148. [DOI] [PubMed] [Google Scholar]
- Lupas A., Van Dyke M., Stock J. Predicting coiled coils from protein sequences. Science. 1991;252:1162–1164. doi: 10.1126/science.252.5009.1162. [DOI] [PubMed] [Google Scholar]
- Mchaourab H., Perozo E. Determination of protein folds and conformational dynamics using spin-labeling EPR spectroscopy. In: Eaton G., Eaton S., Berliner L., editors. Distance Measurements in Biological EPR. Kluwer; New York, NY: 2000. pp. 185–247. [Google Scholar]
- Mchaourab H.S., Lietzow M.A., Hideg K., Hubbell W.L. Motion of spin-labeled side chains in T4 lysozyme. Correlation with protein structure and dynamics. Biochemistry. 1996;35:7692–7704. doi: 10.1021/bi960482k. [DOI] [PubMed] [Google Scholar]
- Mchaourab H.S., Oh K.J., Fang C.J., Hubbell W.L. Conformation of T4 lysozyme in solution. Hinge-bending motion and the substrate-induced conformational transition studied by site-directed spin labeling. Biochemistry. 1997;36:307–316. doi: 10.1021/bi962114m. [DOI] [PubMed] [Google Scholar]
- Meuser D., Splitt H., Wagner R., Schrempf H. Exploring the open pore of the potassium channel from Streptomyces lividans . FEBS Lett. 1999;462:447–452. doi: 10.1016/s0014-5793(99)01579-3. [DOI] [PubMed] [Google Scholar]
- Miyazawa A., Fujiyoshi Y., Stowell M., Unwin N. Nicotinic acetylcholine receptor at 4.6 Å resolutiontransverse tunnels in the channel wall. J. Mol. Biol. 1999;288:765–786. doi: 10.1006/jmbi.1999.2721. [DOI] [PubMed] [Google Scholar]
- Nicholls A., Sharp K.A., Honig B. Protein folding and associationinsights from the interfacial and thermodynamic properties of hydrocarbons. Proteins. 1991;11:281–296. doi: 10.1002/prot.340110407. [DOI] [PubMed] [Google Scholar]
- Nilges M., Clore G.M., Gronenborn A.M. Determination of three-dimensional structures of proteins from interproton distance data by dynamical simulated annealing from a random array of atoms. Circumventing problems associated with folding. FEBS Lett. 1988;239:129–136. doi: 10.1016/0014-5793(88)80559-3. [DOI] [PubMed] [Google Scholar]
- Perozo E., Cortes D.M., Cuello L.G. Structural rearrangements underlying K+-channel activation gating. Science. 1999;285:73–78. doi: 10.1126/science.285.5424.73. [DOI] [PubMed] [Google Scholar]
- Perozo E., Cuello L.G., Cortes D. Three-dimensional architecture and gating mechanism of a K+ channel studied by EPR spectroscopy. Nat. Struct. Biol. 1998;5:459–469. doi: 10.1038/nsb0698-459. [DOI] [PubMed] [Google Scholar]
- Rabenstein M.D., Shin Y.K. Determination of the distance between two spin labels attached to a macromolecule. Proc. Natl. Acad. Sci. USA. 1995;92:8239–8243. doi: 10.1073/pnas.92.18.8239. [DOI] [PMC free article] [PubMed] [Google Scholar]
- Rees D.C., DeAntonio L., Eisenberg D. Hydrophobic organization of membrane proteins. Science. 1989;245:510–513. doi: 10.1126/science.2667138. [DOI] [PubMed] [Google Scholar]
- Schrempf H., Schmidt O., Kummerlen R., Hinnah S., Muller D., Betzler M., Steinkamp T., Wagner R. A prokaryotic potassium ion channel with two predicted transmembrane segments from Streptomyces lividans . EMBO (Eur. Mol. Biol. Organ.) J. 1995;14:5170–5178. doi: 10.1002/j.1460-2075.1995.tb00201.x. [DOI] [PMC free article] [PubMed] [Google Scholar]
- Sheng M., Kim E. Ion channel associated proteins. Curr. Opin. Neurobiol. 1996;6:602–608. doi: 10.1016/s0959-4388(96)80091-2. [DOI] [PubMed] [Google Scholar]
- Smart O.S., Neduvelil J.G., Wang X., Wallace B.A., Sansom M.S. HOLEa program for the analysis of the pore dimensions of ion channel structural models. J. Mol. Graph. 1996;14:354–360. doi: 10.1016/s0263-7855(97)00009-x. [DOI] [PubMed] [Google Scholar]
- Smirnov A.I., Clarkson R.B., Belford R.L. EPR linewidth (T2) method to measure oxygen permeability of phospholipid bilayers and its use to study the effect of low ethanol concentrations. J. Magn. Reson. B. 1996;111:149–157. doi: 10.1006/jmrb.1996.0073. [DOI] [PubMed] [Google Scholar]
- Subczynski W.K., Hyde J.S. The diffusion-concentration product of oxygen in lipid bilayers using the spin-label T1 method. Biochim. Biophys. Acta. 1981;643:283–291. [PubMed] [Google Scholar]
- Wickman K.D., Clapham D.E. G-protein regulation of ion channels. Curr. Opin. Neurobiol. 1995;5:278–285. doi: 10.1016/0959-4388(95)80039-5. [DOI] [PubMed] [Google Scholar]
- Zerangue N., Jan Y.N., Jan L.Y. An artificial tetramerization domain restores efficient assembly of functional Shaker channels lacking T1. Proc. Natl. Acad. Sci. USA. 2000;97:3591–3595. doi: 10.1073/pnas.060016797. [DOI] [PMC free article] [PubMed] [Google Scholar]