

Abstract
The cardiac sarcolemmal Na-Ca exchanger (NCX) is allosterically regulated by [Ca]i such that when [Ca]i is low, NCX current (INCX) deactivates. In this study, we used membrane potential (Em) and INCX to control Ca entry into and Ca efflux from intact cardiac myocytes to investigate whether this allosteric regulation (Ca activation) occurs with [Ca]i in the physiological range. In the absence of Ca activation, the electrochemical effect of increasing [Ca]i would be to increase inward INCX (Ca efflux) and to decrease outward INCX. On the other hand, Ca activation would increase INCX in both directions. Thus, we attributed [Ca]i-dependent increases in outward INCX to allosteric regulation. Ca activation of INCX was observed in ferret myocytes but not in wild-type mouse myocytes, suggesting that Ca regulation of NCX may be species dependent. We also studied transgenic mouse myocytes overexpressing either normal canine NCX or this same canine NCX lacking Ca regulation (Δ680–685). Animals with the normal canine NCX transgene showed Ca activation, whereas animals with the mutant transgene did not, confirming the role of this region in the process. In native ferret cells and in mice with expressed canine NCX, allosteric regulation by Ca occurs under physiological conditions (KmCaAct = 125 ± 16 nM SEM ≈ resting [Ca]i). This, along with the observation that no delay was observed between measured [Ca]i and activation of INCX under our conditions, suggests that beat to beat changes in NCX function can occur in vivo. These changes in the INCX activation state may influence SR Ca load and resting [Ca]i, helping to fine tune Ca influx and efflux from cells under both normal and pathophysiological conditions. Our failure to observe Ca activation in mouse myocytes may be due to either the extent of Ca regulation or to a difference in KmCaAct from other species. Model predictions for Ca activation, on which our estimates of KmCaAct are based, confirm that Ca activation strongly influences outward INCX, explaining why it increases rather than declines with increasing [Ca]i.
Keywords: Na/Ca exchanger, cardiac electrophysiology, ferret, mouse, dog
INTRODUCTION
The cardiac sarcolemmal Na/Ca exchanger (NCX) is a reversible transporter that exchanges three (Reeves and Hale 1984; Kimura et al. 1987) or possibly four (Fujioka et al. 2000) Na for one Ca. Outward Na/Ca exchange current (INCX), or Ca influx, is electrochemically favored by low [Ca]i, high [Na]i, and depolarized membrane potentials. Inward INCX, or Ca efflux, is favored by the opposite conditions (Mullins 1979; Bers 1991). In addition to the electrochemical potential, which sets the direction of INCX, NCX is allosterically regulated by [Ca]i such that when [Ca]i is low, INCX deactivates (Miura and Kimura 1989). NCX proteins in this state do not contribute to INCX. Increasing [Ca]i can activate NCX, allowing INCX to flow.
Allosteric Ca binds at two acidic regions in the large cytoplasmic loop of the NCX, each containing three consecutive aspartic acid residues (D446–D448 and D498–D500; Matsuoka et al. 1995). The loop has been shown to bind Ca cooperatively (nHill ≈ 2) with a K1/2 ranging from 0.3 to 3 μM in vitro, depending on the concentration of Mg (0.2–5 mM, respectively; Levitsky et al. 1994). α-Chymotrypsin treatment eliminates Ca activation for outward (Hilgemann 1990; Hilgemann et al. 1992; Matsuoka et al. 1993) and inward INCX (Kappl and Hartung 1996) in giant membrane patches. Attempts to measure the affinity for Ca to the activating site of the NCX have given disparate results in different experimental conditions.
Miura and Kimura 1989, using intracellular perfusion to control [Ca]i, showed Ca-dependent activation of outward INCX in guinea pig myocytes. Outward INCX was fully activated at [Ca]i = 50 nM (below the normal resting [Ca] of ∼100 nM). Fang et al. 1998 measured Ca activation (KmCaAct = 44 nM, nHill = 1.6) of Na-dependent Ba influx in Chinese hamster ovary cells expressing bovine NCX, to assay INCX. Deletion of a large portion of the cytoplasmic loop (Δ241-680), which contains the putative Ca regulatory domain, eliminated variations in Ba influx with changing [Ca]i, supporting the study by Matsuoka et al. 1993. In contrast, Haworth and Goknur 1991 showed apparent activation of INCX at physiological [Ca]i. Field stimulation of 22Na-loaded rat myocyte suspensions resulted in increased Na pump–independent Na efflux. This suggests that the entry of physiologically relevant amounts of Ca through Ca channels can activate the NCX.
All measurements in giant excised patches so far have shown Ca-dependent regulation at physiological [Ca]i. In giant patches from guinea pig myocytes, Ca activation of outward INCX was seen with KmCaAct = 300–600 nM (Hilgemann et al. 1992). In patches from Xenopus oocytes expressing canine cardiac NCX, mutations of various residues within and near to the two acidic Ca regulatory regions increase KmCaAct from 0.4 μM to between 1.1 and 1.8 μM (Matsuoka et al. 1995). Approximately 180 amino acids downstream of the two acidic DDD segments, amino acids 680–685 (IIEESY in canine NCX1) are also important for Ca activation. Giant patches from transgenic mouse myocytes overexpressing a deletion mutant of these six residues (Δ680-685) show outward INCX, which is nearly fully activated at all [Ca]i (Maxwell et al. 1999).
In this study, we took advantage of the electrogenicity of the NCX to control Ca entry into and Ca efflux from intact cardiac myocytes to measure the effects of changing [Ca]i on INCX. Using solutions that were selective for INCX, we voltage-clamped single cells at +100 mV to bring Ca into the cell through outward INCX and at −100 mV to bring Ca out of the cell through inward INCX. By varying the depolarization duty factor (t+100 mV/total t), we were able to directly control [Ca]i, and at the same time observe the effects of changing [Ca]i on INCX. This study differs from earlier studies in that [Ca]i was dynamically controlled by a physiological process rather than being artificially clamped to particular values by exogenous buffering. Advantages of our study are as follows: measurements were made in the normal cellular environment; and dynamic changes in [Ca]i in the physiological range were examined.
We observed clear Ca activation of INCX in ferret myocytes, but did not detect appreciable regulation in wild-type (WT) mouse myocytes using the same protocols (in contrast to Maxwell et al. 1999). No delay was observed between the rise in [Ca]i and activation of INCX. We also studied mouse myocytes overexpressing normal canine NCX (Adachi-Akahane et al. 1997) and mouse myocytes overexpressing this same canine NCX lacking the Ca regulatory domain Δ680-685 (Maxwell et al. 1999). Animals with the normal canine NCX transgene showed Ca activation, whereas animals with the mutant transgene did not. Some of the results shown in this article were presented in abstract form (Weber et al. 1999, Weber et al. 2000).
MATERIALS AND METHODS
Cell Preparation
Cells were isolated using approved methods. Ferrets were anesthetized with sodium pentobarbital (50 mg/kg IP). Hearts were excised, rinsed in ice-cold 0 mM Ca Tyrode's solution, and placed on a Langendorf apparatus for retrograde constant flow (30–36 ml/min) perfusion of the coronary vasculature via the aorta at 37°C. The heart was perfused for 5 min with 0-mM Ca Tyrode's solution, after which an otherwise identical solution containing filtered collagenase (Yakult Corp. or Boehringer) as well as 10 μM Ca was perfused. When the heart was slightly flaccid to touch, enzyme activity was stopped by perfusion with 0-mM Ca Tyrode's solution containing BSA. Ventricles were removed from the apparatus, cut into ∼2-mm3 size pieces, and gently triturated. After washing in Ca-free solution at room temperature, cells were placed on laminin-coated perfusion chambers for recording. Cells were used within 6 h of isolation.
The preparation of mouse myocytes was modified to reduce the risk of ischemic damage to the hearts. Mice were anesthetized by inhalation with a mixture of 5% isoflurane and 95% O2. Each mouse was tracheotomized and mechanically ventilated. Upon opening the chest cavity, we injected cold high K cardioplegia solution into the vena cava and quickly excised the heart, which was subsequently transferred to a gravity-driven (80 mmHg) apparatus for perfusion at 37°C (flow rate ≈ 3 ml/min) and treated as above.
Fluorescent Measurement of [Ca]i
Perfusion chambers were mounted on a Nikon TMD epifluorescence microscope. Cells were loaded with 10 μM indo-1 AM, applied externally for 22 min at 23°C, or 100 μM K indo-1, applied through the pipet, in perforated patch and ruptured patch experiments, respectively. We allowed indo-1 AM to deesterify for 20 min before proceeding with [Ca]i measurements. Cells were excited at 365 ± 5 nm using a 75-W xenon arc lamp via epiillumination, and emitted fluorescence (405 ± 10 nm and 485 ± 10 nm) was recorded using photometers (PTI Corp.). For indo-1 AM experiments, a linear regression of autofluorescence at each wavelength versus two-dimensionally projected cell surface area for 10 unloaded cells of the same preparation was used to predict the background to be subtracted from the loaded signal for each cell studied, according to the particular cell's size. For K indo-1 experiments, the autofluorescence of the cell being studied was always recorded before patch rupture. The ratio (R) of emitted fluorescence at 405 nm to emitted fluorescence at 485 nm was converted to [Ca]i using the Grynkiewicz et al. 1985 equation: [Ca]i = K d β(R − Rmin)/(Rmax − R). Rmin (0.24), Rmax (2.91), and β (4.17) were determined, and K d was taken as 844 nm as described by Bassani et al. 1995. Cell contraction was apparent under visible light >650 nm provided by transillumination (which was deflected from the fluorescence detector pathway by a short pass dichroic mirror), and was simultaneously recorded using a video edge detection system. This served as an additional indicator of changes in [Ca]i.
In most mouse myocyte experiments, we used fluo-3 AM, since we were able to attain better Ca signals than with indo-1 AM or K indo-1. 5 μM fluo-3 AM was loaded until fluorescence was three or more times background (up to ∼45 min), and a comparable time was allowed for deesterification. In experiments using fluo-3, cells were excited at 480 ± 5 nm, and emission was recorded at 535 ± 20 nm. To convert nonratiometric signals into [Ca]i, the following pseudoratio equation was used (Cheng et al. 1993): [Ca]i = K d · R/((K d/[Ca]rest)+1 − R). R was taken as the emitted fluorescence divided by the resting emitted fluorescence, each after background subtraction. [Ca]rest was taken as 100 nM, and K d = 1,100 nM was used to calculate [Ca]i. In several experiments with indo-1 AM, when an ideal calibration was not available, we also treated background subtracted indo-1 ratios using the pseudoratio method. There was no apparent qualitative or quantitative difference in results which could be attributed to the different indicator methods used.
Solutions for Electrophysiological Recording
To eliminate any contribution of the SR to Ca handling, cells were pretreated for 10 min with 0Ca/0Na Tyrode's solution containing (in mM): 0.001 thapsigargin, 10 caffeine, 140 LiCl, 6 KCl, 1 MgCl2, 10 glucose, and 5 HEPES, pH 7.4 with LiOH. Patch electrodes (1–2 MΩ) were tip-dipped and backfilled with solution containing (in mM): 40 CsCl, 80 tetraethylammonium chloride (TEACl) 0.92 MgCl2, 10 HEPES, 10 NaCl, 5 MgATP, 0.3 LiGTP, and 0.1 K indo-1; pH was set to 7.2 with CsOH and free [Mg] was ∼0.5 mM. In some cases, we used aspartic acid and equimolar CsOH instead of the TEACl. For perforated patch experiments on cells loaded with indo-1 AM or fluo-3 AM, nucleotides and K indo-1 were omitted and 140 μg/ml amphotericin was added to the portion of solution used to backfill the electrodes. Cells were sealed in Tyrode's solution containing (in mM): 140 NaCl, 4 KCl, 10 glucose, 5 HEPES, and 1 MgCl2, with pH set to 7.4 using NaOH. External Ca was 1 mM in mouse and 2 mM in ferret experiments. After electrical access to the interior of the cell was attained, the external solution was switched to Tyrode's solution containing 4 mM CsCl instead of KCl. To secure the best possible voltage control, series resistance was compensated to the extent possible. Additionally, we applied capacitance transient cancellation either during the recording or analytically.
To better isolate INCX, we also used a combination of drugs to block unwanted sarcolemmal currents (20 μM nifedipine to block L-type Ca current, 30 μM niflumic acid to block Ca activated Cl current, and 4 μM N-acetylstrophanthidin to block the Na/K ATPase). We did not specifically block ICa(T); however, ICa(T) has not been observed in ferret ventricular myocytes (Yuan and Bers 1995). Further, any ICa(T) activated on depolarization to +100 mV would support only a negligible Ca influx (since Erev for Ca is near +100 mV) and would inactivate very quickly (Satin and Cribbs 2000).
Protocols
We designed our voltage protocol (see Fig. 2 C, bottom) to control [Ca]i and measure INCX at the same time. At the beginning of each recording, and again before any repetition of the protocol, cells were held at −100 mV for 3 min or more, to promote inward INCX (Ca extrusion) such that cells were initialized to low [Ca]i. Thereafter, repetitive pulses from −100 mV to +100 mV were applied to set the direction of INCX. Inward INCX, or Ca extrusion, was greatly favored at −100 mV, whereas the converse was true at +100 mV (positive to ENCX). Usually, the duration of each pulse was 100 ms, but by varying the duty factor, it was possible to control [Ca]i more specifically and to observe corresponding changes in inward and outward INCX magnitudes. For example, with 100 ms at +100 mV and 200 ms at –100 mV in Fig. 2 C (bottom) the duty factor was 0.33. In the four myocyte types studied, INCX was recorded with increasing [Ca]i, using alternating protocols like that shown in Fig. 2 C (bottom). The duty factor of the voltage protocol was chosen for each cell (0.25–0.67) to adjust net Ca entry into the cell in a range which would vary activation of INCX from minimal to maximal.
Figure 2.

Protocol used to show regulation of INCX by [Ca]i. K currents, ICl(Ca), ICa(L), Na/K pump, SR Ca pump blocked. (A) Current and contraction with application of alternating voltage clamp protocol in transgenic mouse myocyte overexpressing canine NCX1. B is the same as A, but with 10 mM Ni present. (C, top) Current in A minus current in B, which represents INCX. (C, bottom) Alternating voltage clamp protocol applied to the cell: +100 mV for 100 ms and −100 mV for 200 ms.
Qualification of Recorded Currents
To minimize any influence of leakage current, cells were selected where the resting current after initialization to low [Ca]i (above) was as low as possible. Under this condition, the state of activation for INCX and the driving force for inward INCX would both be minimized, and any residual inward current would be largely due to leak. INCX was taken as the current blocked by 10 mM Ni. In some cases, when it was not possible to apply Ni to the cell, the records were leak subtracted. For this purpose, we used the linear leak conductance (gleak) determined from the inward resting current of the initialized cell to determine Ileak at all Em (Ileak = gleak· Em). This method of leak subtraction would define the initial INCX at the lowest resting [Ca]i to be zero. This is reasonable, since as cells rest at −100 mV during initialization to low [Ca]i, INCX would be expected to approach equilibrium (where Em = ENCX = 3ENa − 2ECa). Some inward INCX will flow to oppose any slow Ca entry into cells (Coulombe et al. 1989), so that in steady state it is not likely to reach zero. Despite this, the actual INCX we measured by Ni subtraction in cells initialized at resting [Ca]i, was quite close to zero (see example in Fig. 2).
Simulations and Calculations
INCX was represented as the product of an electrochemical (ΔE) and an allosteric (Allo) factor. The ΔE factor is based on Equation IX-141 in Segel 1993, which describes the net reaction velocity (forward − backward) of the ping pong bi bi cyclic reaction scheme. We described the voltage dependence of the velocity in each direction using exponentials as defined by Mullins et al. (1979) and by Luo and Rudy 1994. Segel's equation was further simplified by assuming that the maximal flux is the same in both directions (Vmaxr = Vmaxf = Vmax) and by making the approximation that the NCX dissociation constants for Cai and Nai from catalytic sites are equivalent to the apparent Km for Cai and Nai transport by the NCX when other substrates are present at saturating concentrations (KmCai and KmNai). An instantaneous Hill equation for Ca binding to the regulatory site, and thus availability of the NCX, was used for the Allo factor as shown below:
 |
1 |
The Km values are the Na and Ca dissociation constants for intracellular (i) and extracellular (o) Na and Ca. η is the position of the energy barrier of the NCX in the membrane electric field, and ksat is a factor that controls the saturation of INCX at negative potentials. KmCaAct for each experiment was determined from curve fits of the INCX versus [Ca]i at +100 mV and −100 mV (Table ). During each voltage step, INCX and [Ca]i were averaged to obtain one data point for the fits, at a defined [Ca]i and voltage, resulting in 25–40 ([Ca]i, INCX) pairs per experiment. For the fits, Vmax and [Na]i were also allowed to vary between cells to account for cell to cell variation in INCX density and variations in the accuracy of [Na]i control by the pipet. Fixed parameters were as follows (and describe rabbit INCX data in Pogwizd et al. 1999): KmNao = 87.5 mM (Kimura et al. 1987), KmNai = 12.3 mM, KmCai = 0.0036 mM (Hilgemann et al. 1991), KmCao = 1.30 mM, ksat = 0.27, η = 0.35, T = 23°C, and nHill = 2. KmNao, KmCao, KmCai, and KmNai satisfy a Haldane relationship (i.e., VmaxfKmCaiKmNao 3 = VmaxrKmNai 3KmCao) with Vmaxr = Vmaxf = Vmax . nHill = 2 may represent Ca binding to two anionic segments of the NCX1 cytoplasmic loop (Levitsky et al. 1994), and Fang et al. 1998 found nHill = 1.6. An F test (criterion P value < 0.05) on the residual error variance was used to determine if the above equation with the allosteric factor fit the INCX versus [Ca]i relationship better than the same equation without the allosteric factor. The test statistic applied to each data set was F = (SS1 − SS2)(DF1 − DF2)/(SS2/DF2), where SS1, SS2, DF1, and DF2 are the sum-of-squared errors and degrees of freedom (number of observations − number of free parameters) for the fit without (1) and the fit with (2) the allosteric factor (GraphPad Prism v3.00; GraphPad Software[http://www.graphpad.com]).
Table 1.
Fit Parameters
| Units | Ferret | WT mouse | Mouse + canine NCX | Mouse + Δ680-685 | |
|---|---|---|---|---|---|
| KmCaAct | nM | 125 ± 16 | ND | 152 and 394 | ND |
| Vmax | A/F | 22.6 ± 5.3 | 4.4 ± 1.1 | 24.4 and 16.8 | 10.6 ± 4.1 |
| [Na]i | mM | 7.2 ± 0.5 | 9.9 ± 0.7 | 10.4 and 14.4 | 15.5 ± 1.2. |
Parameters (means ± SEM) for four cell types studied. KmCaAct = not determined (ND) in cell types when including it did not improve the fits. Fixed parameters are listed in materials and methods (see Simulations and Calculations).
Additionally, ferret data were simulated using the above equation for INCX with a simple model for all other nonblocked sources of Ca flux (sarcolemmal Ca pump, Ca background leak current) but no SR (Fig. 1). Ca background leak current was taken as ICabkg = GCabkg(Em − ECa) and the sarcolemmal Ca pump as Ipump = Imaxpump([Ca]i/([Ca]i + Kmpump)), with Kmpump = 0.5 μM and Imaxpump = 0.038 A/F). GCabkg was adjusted to maintain a resting [Ca]i of 100 nM at −100 mV (3.2 S/F). Membrane capacitance was set to the average value observed in ferret myocytes (Cm = 173 pF), and the cytoplasmic volume was calculated using the species-specific conversion factor 7.96 pF/pl (Satoh et al. 1996). [Ca]o and [Na]o were fixed at 2 and 140 mM, respectively. [Ca]i and [Na]i were allowed to vary, and were initialized at 0.1 and 7 mM, respectively. [Na]i = 7 mM (Table ) was chosen based on the averages of fits to the ferret data. The total [Ca] increment for each Δt was defined by the following equation:
 |
2 |
Figure 1.

Computer model of cardiac myocyte containing nonblocked sources of Ca flux, used in Fig. 8. Ca background leak current is defined by constant conductance and electrochemical driving force for Ca, Ca pump follows Michaelis-Menten kinetics, and INCX is defined by .
Table 2.
Simulation Parameters Used in Fig. 8
| Ca activation | No Ca activation | |
|---|---|---|
| KmCaAct* | 125 | NA |
| Vmax (A/F) | 22.6 | 13.7 |
| [Na]i ‡ | 7.16 | 7.10 |
| GCabkg (S/F) | 3.2 | 5.1 |
Parameters used in the computer simulation (Fig. 8) NA, not applicable. KmCaAct, Vmax, and [Na]i were based on fits to ferret data with and without the allosteric factor (Allo). GCabkg adjusted to give resting [Ca]i = 100 nM. Fixed parameters are listed in materials and methods (see Simulations and Calculations).
*Values are measured in nanomolar.
‡Values are measured in millimolar.
[Ca]total was converted to [Ca]i for every time step taking into account intrinsic cellular buffering (Hove-Madsen and Bers 1993) as well as buffering by indo-1:
 |
3 |
The [Na]i increment for each Δt was defined by the following equation:
 |
4 |
in which Volume was the myoplasmic volume.
Data Acquisition and Analysis
Currents, fluorescence signals, and contraction data were recorded using PClamp6.4 and PClamp8 software (Axon Instruments). Data were analyzed using customized software written in Microsoft Visual Basic 6 and Microsoft Visual Basic for Applications, using Gigasoft ProEssentials Scientific Graphing Routines (www.gigasoft.com). Curve fits of the data to the equation for INCX were performed using the Majestic™ (Logix Consulting, Inc.) add-in for Microsoft Excel. Means and standard deviations of curve fit parameters are presented.
RESULTS
As described in materials and methods, we blocked all currents other than INCX (including ICl(Ca), ICa(L), and the Na/K pump) as well as SR function. Thereafter, we regarded Ni-sensitive currents like that in Fig. 2 C as INCX. Thus, we have the fortunate situation that only INCX has the ability to bring Ca into and out of the cell. We control INCX directly using our voltage protocols.
Fig. 2 shows a representative record where the response to the same pulse protocol was recorded once in the absence (Fig. 2 A) and once in the presence (Fig. 2 B) of 10 mM Ni to reveal Ni-sensitive difference current, INCX (Fig. 2 C). With the Ni present, the current was relatively small and constant; correspondingly, the cell failed to contract with Ni present (compare bottom panels of Fig. 2A and Fig. B).
Fig. 2 C shows how we established that Ca activation occurred. In the absence of allosteric regulation, the electrochemical effect of increasing [Ca]i would be to increase inward INCX but to decrease outward INCX. Ca activation, on the other hand, would increase INCX in both directions. Thus, we looked closely for changes in outward INCX since allosteric regulation opposes electrochemical regulation. Increases in outward INCX can only be attributed to allosteric regulation.
Fig. 3 (top, Measured) shows an example of the fluo-3 [Ca]i signal measured from a mouse myocyte overexpressing canine NCX1 superimposed with a prediction of [Ca]i based on integration of the recorded INCX (Fig. 3 top, Predicted). In this example, the duty factor of outward versus inward INCX was 25% (Fig. 3, bottom). As represented by the first term of , we calculated cumulative [Ca]total from the integrated INCX, using the fixed 3:1 Na/Ca INCX stoichiometry, and estimated myoplasmic volume (34 pl, based on 13.0 pF/pl cytosol for rat; Satoh et al. 1996). We used a standard cytosolic Ca buffering relationship (Hove-Madsen and Bers 1993; ) to solve for [Ca]i at each time point (Fig. 3 top, Predicted). The prediction corresponds reasonably well with [Ca]i measured using fluo-3. This provides additional support that the currents we were measuring are indeed INCX.
Figure 3.

(Top) [Ca]i predicted using integral of INCX compares well with [Ca]i measured using fluo-3; mouse overexpressing normal canine NCX1. Total Ca (defined by ) was converted to [Ca]i using . (Middle) INCX measured in absence of Ni and leak subtracted. (Bottom) Voltage protocol.
Fig. 4 A is an example record from a ferret myocyte (n = 22) that shows direct evidence of Ca activation at physiological [Ca]i. Notice that the magnitude of outward and inward INCX both increase with rising [Ca]i. The increase in outward INCX represents Ca activation. It is not due to the change in electrochemical potential because increasing [Ca]i decreases the driving force for allosteric Ca influx via outward INCX. The increase in inward INCX represents the combined electrochemical and allosteric effects of increasing [Ca]i.
Figure 4.

Examples of INCX in response to voltage protocol for four cell types studied. (A) Ferret myocyte showed Ca activation of INCX (top, Ni-sensitive INCX; bottom, [Ca]i measured using indo-1). (B) WT mouse myocyte. INCX did not show Ca activation (top, Ni-sensitive INCX; bottom, [Ca]i measured using fluo-3). (C) Mouse myocyte overexpressing canine NCX1 showed Ca activation of INCX (from top to bottom: Ni-subtracted INCX, percent contraction, and [Ca]i measured using fluo-3). (D) Mouse myocyte overexpressing Δ680-685 canine NCX1 did not show Ca activation (from top to bottom: leak-subtracted INCX, percent contraction, and [Ca]i measured using fluo-3).
Fig. 4 B shows an example record made with the same protocol from a WT mouse myocyte (n = 10). Of the 10 records obtained from WT mouse myocytes, only one appeared to show any sign of allosteric Ca regulation (an increase of outward INCX). In 9/10 experiments, the outward INCX decreased. As expected from the purely electrochemical effects of increasing [Ca]i, the inward INCX increased, although not dramatically in mice (see Fig. 7). Notably, mouse myocytes generally showed less inward INCX when compared with ferret (see Fig. 6). Fig. 4 C shows the response of a mouse myocyte overexpressing canine NCX1 to the alternating pulse protocol (n = 7). There were dramatic increases in both outward and inward INCX, which, as we noted above, is strong evidence of allosteric Ca regulation. Fig. 4 D illustrates the same protocol applied to a mouse myocyte overexpressing the Δ680-685 mutant of canine NCX1 (n = 8). Deleting these amino acids clearly eliminated the increase in outward INCX we attribute to allosteric Ca regulation. In every experiment, outward INCX decreased similarly as in WT mouse myocytes. Again, inward INCX still increased because of electrochemical considerations.
Figure 7.

Among the four preparations studied, only those with Ca activation of INCX showed increasing outward and dramatically increasing inward INCX with increasing [Ca]i. (Top) Outward INCX at +100 mV; (bottom) inward INCX at −100 mV. Currents are taken as the difference between the first pulse (at low [Ca]i) and the last pulse (at high [Ca]i). Data are means ± SEM.
Figure 6.

Magnitudes of INCX at high [Ca]i for the four NCX types studied. (Top) Outward INCX at +100 mV; (bottom) inward INCX at −100 mV. Data are means ± SEM of the currents recorded during the final pulses of the corresponding alternating protocols.
In Fig. 3, the outward and inward currents decline considerably during respective individual pulses. Such declines in the outward direction were minimal in most of our data (see examples in Fig. 4), especially in ferret myocytes. We attribute these declines to transient changes in [Ca]i and [Na]i during the overall increase in [Ca]i in a protocol (see Fig. 8). Declines in inward INCX were also pronounced in mouse myocytes expressing canine NCX, and this may be attributable to the combined effects of [Ca]i acting at allosteric and transport sites.
Figure 8.

Computer simulations based on model in Fig. 1. (A, bold trace) INCX with Ca activation (, KmCaAct = 125 nM). Both outward and inward INCX grow as [Ca]i increases in response to alternating protocol. (B) Outward INCX during single pulses, early (a) and late (b) of A. (C, thin trace) INCX ( with allosteric factor omitted). Without Ca activation, outward INCX declines slightly while inward INCX increases less dramatically. (D) [Na]i time course for pulses B (a and b). (E) [Ca]i time course with (bold trace) and without (thin trace) Ca activation. (F) [Ca]i time course for pulses B (a and b). (G) Voltage protocol was identical for all simulations. (H) Voltage for pulses B (a and b). In all simulations, Ca background leak density (GCabkg) was adjusted to give initial resting [Ca]i = 100 nM at −100 mV. Simulation parameters based on fits to the ferret data are given in Table . Other parameters not based on our experiments are given in materials and methods.
Data like those of Fig. 4 of each experiment where [Ca]i was measured were fit to with and without the allosteric factor. Fig. 5 A shows fits of INCX versus [Ca]i for all the ferret myocytes where [Ca]i was measured (14/22). As noted in materials and methods, each of the individual data points for the fit (symbols) was defined by INCX and [Ca]i time averaged over the duration of a particular voltage step. For the purpose of displaying the data only, INCX is shown normalized to its values at high [Ca]i. For ferret (and mouse + canine NCX1), the fit to with the allosteric term was better in every case (P < 0.05 by F test described in materials and methods). Km for allosteric Ca regulation was close to [Ca]rest (Ferret KmCaAct = 125 ± 16 nM SEM). In contrast, data from the 6 (out of 10) WT mouse myocytes where [Ca]i was available were not fit better (or even as well) with the allosteric factor, with the exception of one cell, in which KmCaAct was 49 nM, well below physiological [Ca]i (data not shown). Both fits of INCX versus [Ca]i in mice expressing canine NCX1 were better with the allosteric term (KmCaAct = 158 or 418 nM, n = 2; data not shown). Since WT mouse myocytes do not show Ca activation over the range of [Ca]i studied (Fig. 4), the situation is simplified, and we can attribute the observed allosteric regulation to purely canine NCX1. Fig. 5 B shows fits of INCX versus [Ca]i in the Δ680-685 mice where [Ca]i was available (3/8). None of these fits was improved by including the allosteric factor, verifying that amino acids 680–685 play a role in Ca regulation of canine NCX1 expressed in mouse myocytes. Fit parameters for the four cell types studied are shown in Table .
Figure 5.

INCX versus [Ca]i fit to . (A) Solid lines show outward and inward INCX predicted from fits to the ferret data including the allosteric factor (KmCaAct = 125 nM). Data of all 14 cells were less well fit (P < 0.05) when the allosteric factor was not included. (B) Solid lines show outward and inward INCX predicted from fits to data of mouse myocytes overexpressing Δ680-685 canine NCX1 without the allosteric factor. Including the allosteric factor did not improve the fits. Each symbol in A and B represents time-averaged INCX during a particular voltage step at the corresponding averaged [Ca]i. For clarity, the figure shows data normalized to the fit predictions at [Ca]i = 500 nM in A and [Ca]i = 1,000 nM in B.
Fig. 6 shows the magnitudes of INCX at high [Ca]i for the four myocyte types studied. INCX at +100 mV was larger in ferret than WT mouse (2.47 vs. 1.48 A/F), but was increased three- to fourfold in transgenic mice (6.90 and 5.23 A/F). Where measured directly, the maximum [Ca]i attained was (mean ± SEM [in nM]): 257 ± 73 in WT mouse (n = 6); 254 ± 36 in ferret (n = 14); and, in accordance with the larger INCX, 861 and 765 in two mouse cells overexpressing canine NCX1, and 1,357 ± 613 in mouse overexpressing canine NCX1 Δ680-685 (n = 3). The severalfold larger outward INCX seen for both transgenic mouse models in this figure confirm the expected overexpression of canine NCX in comparison to NCX of WT mouse and ferret. Allosteric activation is nearly complete at these high [Ca]i, and so this factor has no influence here. The change of the electrochemical factor with increasing [Ca]i does not contribute to the increase of outward INCX (in fact, this factor decreases slightly; see Fig. 10). Thus, the large outward INCX in the transgenic mice is evidence of upregulation of INCX.
Figure 10.
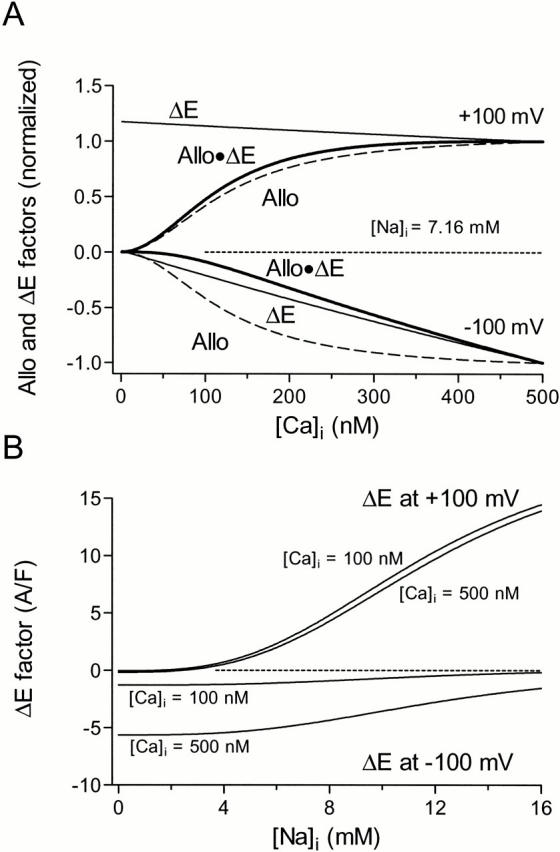
Allosteric (Allo) and electrochemical (ΔE) contributions to ferret INCX (see ). (A) In the outward direction, the increase of INCX is dominantly due to the Allo factor, whereas in the inward direction, the Allo factor and ΔE factors both contribute. Factors have been normalized to their values at [Ca]i = 500 nM. (B) Effects of [Na]i on variations in ΔE at [Ca]i = 100 and 500 nM. In the outward direction, changes in [Na]i and [Ca]i contribute approximately equally to changing ΔE, however, ΔE in the inward direction is dominated by changes in [Ca]i. ΔE not normalized here.
Fig. 7 shows summary data for the increment of INCX with increasing [Ca]i in all four NCX types studied. In the outward direction, INCX increased in ferret and in mouse myocytes expressing canine NCX1, but decreased in WT mouse and in mouse myocytes expressing the Δ680-685 deletion mutant of canine NCX1. Inward INCX always increased with increasing [Ca]i, as would be expected even in the absence of Ca activation because of the increased inward electrochemical driving force, but the largest increases were in the ferret and the mouse overexpressing normal canine NCX1. These are the two preparations where Ca activation would be expected to cause additional increase in INCX beyond the electrochemical component.
We have shown in Fig. 7 the absolute increment in INCX density without normalization to the initial INCX density. In all cases, we attempted to choose a voltage protocol that brought INCX to a maximally activated state. Accordingly, we did not adjust these data for the particular amount of [Ca]i increase. Thus, in this summary figure, we were able to include experiments where we did not record [Ca]i, as long as we had contraction records consistent with large increases in [Ca]i.
Fig. 8 A shows simulated INCX in response to our alternating voltage protocol (Fig. 8 G) as predicted using , with allosteric Ca regulation included (KmCaAct = 125 nM). Fig. 8 E (bold trace) shows [Ca]i as defined by . Vmax and [Na]i were determined from fits of the ferret data (Fig. 5 A) with the Ca regulatory term (Table ). Fig. 8 (B, D, F, and H) shows INCX, [Na]i, [Ca]i, and Em, respectively, for an early and late pulse of Fig. 8 A. Note that during the first few pulses, the outward INCX increased during 100 ms at +100 mV (because of allosteric activation; Fig. 8 B, a). However during later pulses, outward INCX was relatively flat, and even started to decline slightly (Fig. 8 B, b). This is explained by a 71-μM decrease in [Na]i (Fig. 8 D) and a corresponding 132- nM increase in [Ca]i (Fig. 8 F), resulting in decreases in ΔE of 4 and 3%, respectively, while this decline in ΔE was countered almost exactly by a 7% increase in allosteric factor over the same increase in [Ca]i. This spectrum of behavior reflects reasonably well the behavior of INCX recorded experimentally where allosteric regulation was apparent (Fig. 2 C and Fig. 4A and Fig. C).
Fig. 8 C shows the same simulation for INCX without Ca regulation, and the corresponding [Ca]i is shown in Fig. 8 E (thin trace). Vmax and [Na]i were determined from fits of the ferret data without the Ca regulatory term (Table ). There is a decline in the outward INCX envelope when no allosteric regulation is considered (by 8.8%) and this matches the observations in WT mouse and mouse overexpressing Δ680-685 canine NCX1 (Fig. 4B and Fig. D). This decline is due to the electrochemical effect of the rising [Ca]i and declining [Na]i, as described above, which in this case (unlike Fig. 8 A), are not offset by an increasing allosteric factor. Thus, the simple model provides a reasonable description of both the current envelope, and also describes changes within individual pulses.
To test how rapidly Ca activation of outward INCX occurs, we induced a rapid and steady-state increase in [Ca]i from ∼100 nM to ∼1 μM (Fig. 9). In this case, thapsigargin was omitted and the SR was preloaded with Ca by outward INCX. Depolarization from −100 to +100 mV caused an initial slow rise in [Ca]i and outward INCX. Abrupt exposure to 10 mM caffeine induced a rapid rise in [Ca]i (τ = 61 ms), and this caused a nearly parallel increase in outward INCX (τ = 40 ms) without any appreciable time lag. Although this does not define an explicit time constant for INCX activation, it makes our simplifying assumption of instantaneous regulation reasonable. Moreover, the rapidity of activation of Na/Ca exchange suggests that regulation may occur on a beat to beat basis.
Figure 9.

Rapid time course of development of Ca activation in ferret myocyte. Caffeine was applied at +100 mV to cause rapid increase in [Ca]i. There was no apparent delay between the activation of outward INCX and the rise in [Ca]i. Solutions were identical to those described in materials and methods, but pretreatment with thapsigargin- and caffeine-containing solutions was omitted.
DISCUSSION
We have examined intact cardiac myocytes from four different sources (WT ferret and WT mouse, as well as two transgenic mouse models) for allosteric Ca regulation of INCX at physiological [Ca]i. We used a protocol in which the activating Ca was alternately brought into the cell via outward INCX at +100 mV, and extruded via inward INCX at −100 mV (Fig. 2). By varying the periods at ±100 mV (in the range of 100–300 ms), we were able to control and measure the rate of growth in [Ca]i while simultaneously measuring both inward and outward INCX. In ferret myocytes, the outward and inward INCX both increased with increasing [Ca]i (Fig. 4 and Fig. 7). We attribute the increasing outward INCX to Ca activation, which has predominance over the reduction in electrochemical gradient for Ca to enter the cell. The electrochemical gradient would otherwise decrease outward INCX. In contrast to the increase in outward INCX that we always saw in ferret myocytes, WT mouse outward INCX decreased in all but 1 out of 10 experiments (although inward INCX still increased; Fig. 4 B and 7). Additionally, in the absence of Ca activation, inward INCX increased to a smaller extent (Fig. 7, mouse versus ferret).
We also investigated allosteric Ca regulation in mouse myocytes overexpressing canine NCX1 (Fig. 4 B). The rationale behind experiments with transgenic mice was two-fold. First, we wanted to determine if canine NCX overexpressed in mice would show allosteric regulation like the ferret NCX. Fig. 4 B and 7 illustrate that outward INCX did increase with increasing [Ca]i, indicating that canine NCX has similar Ca activation properties to ferret NCX (for outward INCX, ΔINCX/final INCX represented an increase of 38 ± 12% SEM [n = 7] in canine versus 41 ± 4% SEM [n = 22] in ferret). Second, since mutant canine NCX lacked Ca-dependent regulation of outward INCX in giant membrane patch studies (Maxwell et al. 1999), a comparison of INCX between these two types of transgenic myocytes overexpressing canine NCX should help verify that the increase in outward INCX was due to allosteric regulation and not some other process. Fig. 4 D, 5 B, and 7 show that deletion of this putative Ca regulatory region eliminated the increase in outward INCX in our protocol. This deletion made the canine INCX look very much like WT mouse INCX, with the exception that its magnitude was severalfold larger (Fig. 6).
Fig. 10 A shows how the predicted allosteric activation (Allo) and electrochemical factors (ΔE) in would contribute to increasing outward and inward INCX (Allo · ΔE) as [Ca]i increases up to 500 nM. In the outward direction, INCX is largely dominated by the Allo factor, whereas in the inward direction, the Allo factor and ΔE factors both contribute. For this figure, the [Ca]i-dependent allosteric and electrochemical factors in were predicted using the averages of the respective parameters fit to the 14 sets of ferret data, and are shown normalized to their values at 500 nM [Ca]i. From the predictions, we can infer the respective experimentally observed final values of [Ca]i the relative contributions of allosteric activation and electrochemical driving force. In ferrets, outward INCX increased by 67% from its initial value as [Ca]i rose from 115 ± 9 nM (SEM) to 254 ± 36 nM (SEM). This was mainly due to a 75% increase in the allosteric factor, offset slightly by a 4% decrease in the electrochemical factor (1.75 × 0.96 = 1.67). Inward INCX in ferret increased by 283% with this [Ca]i increase. The allosteric factor increased by the same 75%, but in this case it was complemented by a 119% increase in the electrochemical factor, resulting in the final effect (1.75 × 2.19 = 3.83). Thus, the allosteric and electrochemical factors contribute nearly equally to the increase in inward INCX recorded in ferret.
Fig. 10 B shows the effects of [Na]i on the electrochemical factor of at [Ca]i = 100 and 500 nM. Changes in [Na]i (in the millimolar range) are not expected to occur rapidly, but species-dependent variations in [Na]i do occur. [Na]i appears to be substantially elevated in mouse myocytes relative to nonmurids (7.2 in rabbit and 12.7 in rat [Shattock and Bers 1989]; 14-17 mM in mouse [Yao et al. 1998]). This is also suggested by the results of our fits (Table ), and this may account for the small inward INCX in mouse (Fig. 4, B–D, and Fig. 6).
Our simulations (Fig. 8) also predict that INCX drives micromolar changes in [Na]i within pulses during our oscillatory protocols. Referring to outward INCX, during the final 100-ms pulse to +100 mV in Fig. 8 B, b, declining [Na]i (Fig. 8 D) and increasing [Ca]i (Fig. 8 F) contribute about equally to declines in ΔE (see results), and this, combined with allosteric activation by Ca, results in the relatively flat current during the pulse. However, the relatively flat relationship between ΔE and [Na]i for inward INCX (Fig. 10 B), coupled with the steep dependence of inward INCX on [Ca]i, at −100 mV makes inward INCX relatively insensitive to changing [Na]i. Changing [Na]i alone, within the range observed in Fig. 8, causes less than a 1% decline in inward INCX, and almost all of the within-pulse changes in inward INCX are due to changing [Ca]i, acting either electrochemically or allosterically.
Measurement of INCX
There is no inhibitor that is selective for INCX without affecting other currents; accordingly, we approached this problem by blocking all currents other than INCX with their appropriate inhibitors (as well as by ion substitution). We took INCX as either the difference current before versus after applying Ni or the current remaining after analytical leak subtraction. Two additional observations support the idea that the currents we recorded are INCX. Fig. 6 shows that INCX is indeed larger in the NCX overexpressing myocytes compared with INCX in WT mouse myocytes (compare raw currents in Fig. 4 B with those in Fig. 2 and Fig. 4C and Fig. D). Further, the time course of [Ca]i calculated using INCX and known cytosolic buffering characteristics () predicted the measured [Ca]i rather well (Fig. 3).
Nonselective Ca-activated currents have been reported in ventricular myocytes (Colquhoun et al. 1981) at micromolar [Ca]i. In rabbits (Schlotthauer and Bers 2000), virtually all current evoked by Ca release was INCX and/or Ca-activated Cl current. In ferret (Ginsburg et al. 1998), all Ca-activated inward current is abolished by the replacement of Nao with Li (which should still allow this nonselective current to flow). Furthermore, in the present experiments, Ni blocked both outward and inward INCX, but is not expected to inhibit Ca-activated nonselective cation current (Niggli 1989).
Comparison to Earlier Studies
We have shown for the first time allosteric regulation in intact myocytes at physiological [Ca]i, and under conditions where the NCX is able to dynamically control [Ca]i. Miura and Kimura 1989, in intact guinea pig myocytes, showed Ca regulation with [Ca]i artificially held well below the normal resting [Ca]i (KmCaAct = 22 nM). They found a steep Ca dependence (nHill = 3.7) and concluded that INCX was maximally activated when [Ca]i reached 50 nM. A similar low KmCaAct, 44 nM (nHill = 1.6), was found by Fang et al. 1998 for the bovine cardiac NCX expressed in Chinese hamster ovary cells. Maxwell et al. 1999 showed Ca activation of WT mouse NCX in giant membrane patches between 0 and 3 μM (but no values were obtained between 0 and 1 μM [Ca]). It is conceivable that our failure to observe Ca regulation of WT mouse INCX (as described by Maxwell et al. 1999) is due to a low intrinsic KmCaAct in mouse (comparable to the 22–44 nM values above), and lower than we observe in the ferret or dog NCX; i.e., mouse NCX may be fully activated at diastolic [Ca]i of 100 nM. Indeed, the only WT mouse myocyte whose INCX versus [Ca]i fit was actually improved with the Ca regulatory term, showed activation with an apparent KmCaAct = 49 nM. At 100 nM resting [Ca]i, this would imply 82% activation (for nHill = 2 or 95% for nHill = 4), in contrast to 39% activation at 100 nM [Ca]i in the ferret (for nHill = 2). Thus, since we did not explore subphysiological [Ca]i, intrinsic Ca regulation in the mouse could have escaped our detection. On the other hand, this made mouse myocytes a convenient background in which to study transgenic overexpression of canine NCX with respect to Ca regulation at physiological [Ca]i (since the endogenous mouse NCX may always be fully activated).
Our KmCaAct, 125 nM in the ferret, although only somewhat larger numerically, would result in maximal sensitivity of INCX to changes in [Ca]i near [Ca]rest. The disparity between previous results and ours, as well as our finding of a functional difference between the ferret and WT mouse, indicate that there are species and/or preparation-dependent differences in the regulation of INCX by [Ca]i. For example, EGTA can increase the apparent [Ca] dependence of NCX in sarcolemmal vesicles (Trosper and Philipson 1984), which could have produced underestimates of KmCaAct in earlier work. An interesting side point is that the NCX of Drosophila melanogaster, calx, although regulated by [Ca]i in the 100-nM range, shows inactivation, not activation, with increasing [Ca]i (Hryshko et al. 1996).
Species dependency does not explain why Hilgemann et al. 1992 observed KmCaAct to be 0.3–0.6 μM in giant excised patches, 10 times higher than Miura and Kimura 1989 reported, and 2 to 4 times as high as our value. Both studies used guinea pig myocytes. Either preparation, Ca buffering, or washout of other factors might explain these differences. Our study differs from all previous approaches, not only in using intact myocytes, which probably retain key regulatory components, but also in allowing dynamic [Ca]i regulation.
We have noted (Fig. 8) that [Na]i and [Ca]i can vary transiently during the overall increase of [Ca]i in our protocol, possibly explaining the declines in INCX within pulses (Fig. 3). In connection with these variations, subsarcolemmal [Ca] may have reached higher values than our fluorescence-based [Ca]i measurements indicated. Then, we would have underestimated KmCaAct. However, we fit KmCaAct using only ferret data, and these data had very little within-pulse INCX variation.
Physiological Relevance
A reduction in INCX at low [Ca]i may limit the ability of outward INCX to trigger SR Ca release during the upstroke of an action potential (Noble et al. 1991). During diastole, deactivation of inward INCX may help maintain the SR Ca load by shifting the Ca flux balance away from sarcolemmal Ca extrusion and towards the SR. Deactivation of INCX may help prevent resting [Ca]i from going much below threshold for myofilament activation (Fabiato 1983). Additionally, the probability of [Ca]i to trigger SR Ca release is a steep function that depends on the square of local [Ca]i near the ryanodine receptors (Santana et al. 1996; Cheng et al. 1996). Thus, small variations in NCX activity may fine tune resting [Ca]i and, in doing so, may help to define the threshold necessary for Ca to trigger the opening of the SR release channels (Litwin et al. 1998). Finally, since NCX normally works to extrude Ca as [Ca]i increases, Ca activation may reduce the likelihood of Ca overload (unless [Na]i gets very high).
We have assumed a stoichiometry of 3:1 Na:Ca in this paper (Reeves and Hale 1984; Kimura et al. 1987), however, Fujioka et al. 2000 recently reported a stoichiometry closer to 4:1 Na/Ca, so that for every net charge transferred by the flow of INCX, 1/2 Ca ion rather than 1 Ca ion is transferred in the opposite direction. A 4:1 NCX would tend to draw [Ca]i to 130 pM at Erest rather than 38 nM for a 3:1 NCX (−80 mV, 10 mM [Na]i, 140 mM [Na]o, 2 mM [Ca]o, 37°C). In the prediction of Fig. 3, a 4:1 stoichiometry would also reduce the Ca flux inferred from INCX by a factor of 2 and leave it insufficient to explain Δ[Ca]i. Although further evaluation of the proposed 4:1 stoichiometry is needed, if true, then deactivation of INCX at low [Ca]i would be even more crucial to prevent diastolic [Ca]i from falling far too low.
If mean [Ca]i is elevated, as may occur at high heart rates or during heart failure (Gwathmey et al. 1987), the average state of NCX activity may be elevated. If this is the case, and the NCX functions predominantly in the Ca efflux mode, Ca activation may serve as a negative feedback mechanism that helps to prevent Ca overload and spontaneous SR Ca release. On the other hand, since INCX is thought to be a major component of the transient inward current (Fedida et al. 1987; Lipp and Pott 1988; Schlotthauer and Bers 2000), Ca activation may actually promote delayed afterdepolarizations with spontaneous SR release. Furthermore, if [Na]i rises to high enough levels (e.g., submembrane space or digitalis toxicity), Ca influx is favored electrochemically and, in this case, Ca activation could worsen Ca overload.
Model
We chose to fit an instantaneous model because experiments in intact cells do not allow the fast homogenous cytoplasmic solution changes needed to study the dynamics of Ca activation precisely. There may be a lag between the [Ca] in the vicinity of the NCX and the bulk [Ca]i measured by fluorescent indicators (Trafford et al. 1995), which is not included in our model. Since we cannot distinguish spatial and temporal [Ca]i heterogeneities from activation kinetics, we have chosen to model Ca activation as an instantaneous process. Our simulation of the ferret data (Fig. 8) with allosteric Ca regulation modeled in this manner matched well with the characteristic growing outward envelope of INCX and also with changes during individual pulses. Furthermore, we found no delay in activation of INCX when a rapid release of SR Ca was used to cause [Ca]i to increase from 100 to >1 μM (Fig. 9). This might be related to Baazov et al. 1999, who found very rapid activation, although Kappl and Hartung 1996 indicated an activation time constant of 620 ms. Rapid activation, along with KmCaAct = 125 nM, suggests that variation in Ca activation might be relevant in beat-to-beat regulation of INCX. Indeed, the [Ca]i dependence of inward INCX reflects a composite of both KmCai and KmCaAct, and the apparent linearity often reported may be serendipitous.
The primary aim of this study was to determine if allosteric regulation of the NCX played a role in the intact cell under conditions where [Ca]i changed within a physiological range. We conclude that allosteric Ca-dependent activation of INCX occurs in ferret myocytes and in mouse myocytes overexpressing dog NCX1. We also confirm that amino acids 680–685 are important for Ca regulation, since regulation did not occur in mouse myocytes overexpressing canine NCX1 lacking this region. Under our experimental conditions and [Ca]i range, Ca activation did not occur in WT mouse myocytes (contrast Maxwell et al. 1999). Although this lack of Ca regulation in the WT mouse may be condition-dependent, we speculate that it may be due to species differences in amino acid sequences within NCX1. Although NCX1 is ∼99% identical between mouse and dog, a difference does occur within the 680–685 region (IIEESY in dog versus IIQESY in mouse; Nicoll et al. 1990; Nicoll and Philipson 1991).
Acknowledgments
We thank Dr. Donald W. Hilgemann for stimulating discussions and Drs. Jeanne Nerbonne, Weinong Guo, and Haodong Xu for their help with our development of mouse myocyte preparations. We also thank Steve Scaglione and Sarah Wimbiscus for their help with the ferret myocyte isolations.
This work was supported by the National Institutes of Health grants R01HL-30077DMB, R01-HL64098DMB, R01-HL48509KDP, and AHA Fellowship 0010180ZCRW.
Footnotes
Abbreviations used in this paper: INCX, NCX current; NCX, Na/Ca exchanger, WT, wild-type.
References
- Adachi-Akahane S., Lu L., Li Z., Frank J.S., Philipson K.D., Morad M. Calcium signaling in transgenic mice overexpressing cardiac Na+/Ca2+ exchanger. J. Gen. Physiol. 1997;109:717–729. doi: 10.1085/jgp.109.6.717. [DOI] [PMC free article] [PubMed] [Google Scholar]
- Baazov D., Wang Z., Khananshvili D. Time-resolved monitoring of electrogenic Na+-Ca2+ exchange in the isolated cardiac sarcolemma vesicles by using a rapid-response fluorescent probe. Biochemistry. 1999;38:1435–1445. doi: 10.1021/bi981429u. [DOI] [PubMed] [Google Scholar]
- Bassani J.W.M., Bassani R.A., Bers D.M. Calibration of indo-1 and resting intracellular [Ca]i in intact rabbit cardiac myocytes. Biophys. J. 1995;68:1453–1460. doi: 10.1016/S0006-3495(95)80318-8. [DOI] [PMC free article] [PubMed] [Google Scholar]
- Bers D.M. Excitation-contraction coupling and cardiac contractile force 1991. Kluwer Academic Publishers; The Netherlands: pp. 258 pp [Google Scholar]
- Cheng H., Lederer W.J., Cannell M.B. Calcium sparkselementary events underlying excitation-contraction coupling in heart muscle. Science. 1993;262:740–744. doi: 10.1126/science.8235594. [DOI] [PubMed] [Google Scholar]
- Cheng H., Lederer M.R., Lederer W.J., Cannell M.B. Calcium sparks and [Ca2+]i waves in cardiac myocytes. Am. J. Physiol. 1996;270:C148–C159. doi: 10.1152/ajpcell.1996.270.1.C148. [DOI] [PubMed] [Google Scholar]
- Colquhoun D., Neher E., Reuter H., Stevens C.F. Inward current channels activated by intracellular Ca in cultured cardiac cells. Nature. 1981;294:752–754. doi: 10.1038/294752a0. [DOI] [PubMed] [Google Scholar]
- Coulombe A., Lefevre I.A., Baro I., Coraboeuf E. Barium- and calcium-permeable channels open at negative membrane potentials in rat ventricular myocytes. J. Membr. Biol. 1989;111:57–67. doi: 10.1007/BF01869209. [DOI] [PubMed] [Google Scholar]
- Fabiato A. Calcium-induced release of calcium from the cardiac sarcoplasmic reticulum. Am. J. Physiol. 1983;245:C1–C14. doi: 10.1152/ajpcell.1983.245.1.C1. [DOI] [PubMed] [Google Scholar]
- Fang Yu, Condrescu M., Reeves J.P. Regulation of the Na+/Ca2+ exchange activity by cytosolic Ca in transfected Chinese hamster ovary cells. Am. J. Physiol. 1998;275:C50–C55. doi: 10.1152/ajpcell.1998.275.1.C50. [DOI] [PubMed] [Google Scholar]
- Fedida D., Noble D., Rankin A.C., Spindler A.J. The arrhythmogenic transient inward current iti and related contraction in isolated guinea-pig ventricular myocytes. J. Physiol. 1987;392:523–542. doi: 10.1113/jphysiol.1987.sp016795. [DOI] [PMC free article] [PubMed] [Google Scholar]
- Fujioka Y., Komeda M., Matsuoka S. Stoichiometry of Na+-Ca2+ exchange in inside-out patches excised from guinea-pig ventricular myocytes. J. Physiol. 2000;523:339–351. doi: 10.1111/j.1469-7793.2000.t01-2-00339.x. [DOI] [PMC free article] [PubMed] [Google Scholar]
- Ginsburg K.S., Weber C.R., Bers D.M. Control of maximum sarcoplasmic reticulum Ca load in intact ferret ventricular myocytes. Effects of thapsigargin and isoproterenol. J. Gen. Physiol. 1998;111:491–504. doi: 10.1085/jgp.111.4.491. [DOI] [PMC free article] [PubMed] [Google Scholar]
- Grynkiewicz G., Poenie M., Tsien R.Y. A new generation of Ca indicators with greatly improved fluorescence properties. J. Biol. Chem. 1985;260:3440–3450. [PubMed] [Google Scholar]
- Gwathmey J.K., Copelas L., MacKinnon R., Schoen F.J., Feldman M.D., Grossman W., Morgan J.P. Abnormal intracellular calcium handling in myocardium from patients with end-stage heart failure. Circ. Res. 1987;61:70–76. doi: 10.1161/01.res.61.1.70. [DOI] [PubMed] [Google Scholar]
- Haworth R.A., Goknur A.B. Control of the Na-Ca exchanger in isolated heart cells. II. Beat-dependent activation in normal cells by intracellular calcium. Circ. Res. 1991;69:1514–1524. doi: 10.1161/01.res.69.6.1514. [DOI] [PubMed] [Google Scholar]
- Hilgemann D.W. Regulation and deregulation of cardiac Na+-Ca2+ exchange in giant excised sarcolemmal membrane patches. Nature. 1990;344:242–245. doi: 10.1038/344242a0. [DOI] [PubMed] [Google Scholar]
- Hilgemann D.W., Collins A., Cash D.P. Cardiac Na+-Ca2+ exchange system in giant membrane patches. Annu. NY Acad. Sci. 1991;639:127–139. doi: 10.1111/j.1749-6632.1991.tb17296.x. [DOI] [PubMed] [Google Scholar]
- Hilgemann D.W., Collins A., Matsuoka S. Steady state and dynamic properties of cardiac sodium-calcium exchangesecondary modulation by cytoplasmic calcium and ATP. J. Gen. Physiol. 1992;100:933–961. doi: 10.1085/jgp.100.6.933. [DOI] [PMC free article] [PubMed] [Google Scholar]
- Hove-Madsen L., Bers D.M. Passive Ca buffering and SR Ca uptake in permeabilized rabbit ventricular myocytes. Am. J. Physiol. 1993;264:C677–C686. doi: 10.1152/ajpcell.1993.264.3.C677. [DOI] [PubMed] [Google Scholar]
- Hryshko L., Matsuoka S., Nicoll D.A., Weiss J.N., Schwarz E.M., Benzer S., Philipson K.D. Anomalous regulation of the Drosophila Na+-Ca2+ exchanger by Ca2+ . J. Gen. Physiol. 1996;108:67–74. doi: 10.1085/jgp.108.1.67. [DOI] [PMC free article] [PubMed] [Google Scholar]
- Kappl M., Hartung K. Rapid charge translocation by the cardiac Na+-Ca2+ exchanger after a Ca concentration jump. Biophys. J. 1996;71:2473–2485. doi: 10.1016/S0006-3495(96)79441-9. [DOI] [PMC free article] [PubMed] [Google Scholar]
- Kimura J., Miyamae S., Noma A. Identification of sodium-calcium exchange current in single ventricular cells of guinea-pig. J. Physiol. 1987;384:199–222. doi: 10.1113/jphysiol.1987.sp016450. [DOI] [PMC free article] [PubMed] [Google Scholar]
- Levitsky D.O., Nicoll D.A., Philipson K.D. Identification of the high affinity Ca-binding domain of the cardiac Na+-Ca2+ exchanger. J. Biol. Chem. 1994;269:22847–22852. [PubMed] [Google Scholar]
- Lipp P., Pott L. Transient inward current in guinea-pig atrial myocytes reflects a change of sodium-calcium exchange current. J. Physiol. 1988;397:601–630. doi: 10.1113/jphysiol.1988.sp017021. [DOI] [PMC free article] [PubMed] [Google Scholar]
- Litwin S.E., Li J., Bridge J.H.B. Na-Ca exchange and the trigger for sarcoplasmic reticulum Ca releasestudies in adult rabbit ventricular myocytes. Biophys. J. 1998;75:359–371. doi: 10.1016/S0006-3495(98)77520-4. [DOI] [PMC free article] [PubMed] [Google Scholar]
- Luo C.-H., Rudy Y. A dynamic model of the cardiac ventricular action potentialI. simulations of ionic currents and concentration changes. Circ. Res. 1994;74:1071–1096. doi: 10.1161/01.res.74.6.1071. [DOI] [PubMed] [Google Scholar]
- Matsuoka S., Nicoll D.A., Reilly R.F., Hilgemann D.W., Philipson K.D. Initial localization of regulatory regions of the cardiac sarcolemmal Na+-Ca2+ exchanger. Proc. Natl. Acad. Sci. USA. 1993;90:3870–3874. doi: 10.1073/pnas.90.9.3870. [DOI] [PMC free article] [PubMed] [Google Scholar]
- Matsuoka S., Nicoll D.A., Hryshko L.V., Levitsky D.O., Weiss J.N., Philipson K.D. Regulation of the cardiac Na+-Ca2+ exchanger by Camutational analysis of the Ca binding domain. J. Gen. Physiol. 1995;105:403–420. doi: 10.1085/jgp.105.3.403. [DOI] [PMC free article] [PubMed] [Google Scholar]
- Maxwell K., Scott J., Omelchenko A., Lukas A., Lu L., Lu Y., Hnatowich M., Philipson K.D., Hryshko L.V. Functional role of ionic regulation of Na+/Ca2+ exchange assessed in transgenic mouse hearts. Am J. Physiol. 1999;277:H2212–H2221. doi: 10.1152/ajpheart.1999.277.6.H2212. [DOI] [PubMed] [Google Scholar]
- Miura Y., Kimura J. Sodium-calcium exchange currentdependence on internal Ca and Na and competitive binding of external Na and Ca. J. Gen. Physiol. 1989;93:1129–1145. doi: 10.1085/jgp.93.6.1129. [DOI] [PMC free article] [PubMed] [Google Scholar]
- Mullins L.J. The generation of electric currents in cardiac fibers by Na/Ca exchange. Am. J. Physiol. 1979;236:C103–C110. doi: 10.1152/ajpcell.1979.236.3.C103. [DOI] [PubMed] [Google Scholar]
- Nicoll D.A., Philipson K.D. Molecular studies of the cardiac sarcolemmal sodium-calcium exchanger. Annu. NY Acad. Sci. 1991;639:181–188. doi: 10.1111/j.1749-6632.1991.tb17305.x. [DOI] [PubMed] [Google Scholar]
- Nicoll D.A., Longoni S., Philipson K.D. Molecular cloning and functional expression of the cardiac sarcolemmal Na+-Ca2+ exchanger. Science. 1990;250:562–565. doi: 10.1126/science.1700476. [DOI] [PubMed] [Google Scholar]
- Niggli E. Strontium-induced creep currents associated with tonic contractions in cardiac myocytes isolated from guinea-pigs. J. Physiol. 1989;414:549–568. doi: 10.1113/jphysiol.1989.sp017703. [DOI] [PMC free article] [PubMed] [Google Scholar]
- Noble D., Noble S.J., Bett G.C.L., Earm Y.E., Ho W.K., So I.K. The role of sodium-calcium exchange during the cardiac action potential. Proc. Natl. Acad. Sci. USA. 1991;639:334–353. doi: 10.1111/j.1749-6632.1991.tb17323.x. [DOI] [PubMed] [Google Scholar]
- Pogwizd S.M., Qi M., Yuan W.-L., Samarel A.M., Bers D.M. Upregulation of Na/Ca exchanger expression and function in an arrhythmogenic rabbit model of heart failure. Circ. Res. 1999;85:1009–1019. doi: 10.1161/01.res.85.11.1009. [DOI] [PubMed] [Google Scholar]
- Reeves J.P., Hale C.C. The stoichiometry of the cardiac sodium-calcium exchange system. J. Biol Chem. 1984;259:7733–7739. [PubMed] [Google Scholar]
- Santana L.F., Cheng H., Gomez A.M., Cannell M.B., Lederer W.J. Relation between the sarcolemmal Ca2+ current and Ca2+ sparks and local control theories for cardiac excitation-contraction coupling. Circ. Res. 1996;78:166–171. doi: 10.1161/01.res.78.1.166. [DOI] [PubMed] [Google Scholar]
- Satin J., Cribbs L.L. Identification of a T-type Ca2+ channel isoform in murine atrial myocytes (AT-1 cells) Circ. Res. 2000;86:636–642. doi: 10.1161/01.res.86.6.636. [DOI] [PubMed] [Google Scholar]
- Satoh H., Delbridge L.M., Blatter L.A., Bers D.M. Surface:volume relationship in cardiac myocytes studied with confocal microscopy and membrane capacitance measurementsspecies-dependence and developmental effects. Biophys. J. 1996;70:1494–1504. doi: 10.1016/S0006-3495(96)79711-4. [DOI] [PMC free article] [PubMed] [Google Scholar]
- Schlotthauer K., Bers D.M. Sarcoplasmic reticulum Ca2+ release causes myocyte depolarizationunderlying mechanism and threshold for triggered action potentials. Circ. Res. 2000;87:774–780. doi: 10.1161/01.res.87.9.774. [DOI] [PubMed] [Google Scholar]
- Segel I.H. Enzyme Kinetics. Behavior and Analysis of Rapid Equilibrium and Steady-state Enzyme Systems 1993. John Wiley & Sons, Inc; New York: pp. 957 pp [Google Scholar]
- Shattock M.J., Bers D.M. Rat vs. rabbit ventricleCa flux and intracellular Na assessed by ion-selective microelectrodes. Am. J. Physiol. 1989;256:C813–C822. doi: 10.1152/ajpcell.1989.256.4.C813. [DOI] [PubMed] [Google Scholar]
- Trafford A.W., Díaz M.E., O'Neill S.C., Eisner D.A. Comparison of subsarcolemmal and bulk calcium concentration during spontaneous calcium release in rat ventricular myocytes. J. Physiol. 1995;488:577–586. doi: 10.1113/jphysiol.1995.sp020991. [DOI] [PMC free article] [PubMed] [Google Scholar]
- Trosper T.L., Philipson K.D. Stimulatory effect of calcium chelators on Na+-Ca2+ exchange in cardiac sarcolemmal vesicles. Cell Calcium. 1984;5:211–222. doi: 10.1016/0143-4160(84)90037-x. [DOI] [PubMed] [Google Scholar]
- Weber C.R., Ginsburg K.S., Bers D.M. Calcium activation of the sodium calcium exchanger in intact cardiac myocytes Biophys. J 76 1999. A299(Abstr.) [Google Scholar]
- Weber C.R., Ginsburg K.S., Bers D.M., Philipson K.D. Calcium activation of Na/Ca exchanger in mouse myocytes overexpressing canine NCX1 Biophys. J 78 2000. 53A(Abstr.) [Google Scholar]
- Yao A., Su Z., Nonaka A., Zubair I., Lu L., Philipson K.D., Bridge J.H., Barry W.H. Effects of overexpression of the Na+-Ca2+ exchanger on [Ca2+]i transients in murine ventricular myocytes. Circ. Res. 1998;82:657–665. doi: 10.1161/01.res.82.6.657. [DOI] [PubMed] [Google Scholar]
- Yuan W., Bers D.M. Protein kinase inhibitor H-89 reverses forskolin stimulation of cardiac L-type calcium current. Am. J. Physiol. 1995;268:C651–C659. doi: 10.1152/ajpcell.1995.268.3.C651. [DOI] [PubMed] [Google Scholar]