

Abstract
HERG encodes an inwardly-rectifying potassium channel that plays an important role in repolarization of the cardiac action potential. Inward rectification of HERG channels results from rapid and voltage-dependent inactivation gating, combined with very slow activation gating. We asked whether the voltage sensor is implicated in the unusual properties of HERG gating: does the voltage sensor move slowly to account for slow activation and deactivation, or could the voltage sensor move rapidly to account for the rapid kinetics and intrinsic voltage dependence of inactivation? To probe voltage sensor movement, we used a fluorescence technique to examine conformational changes near the positively charged S4 region. Fluorescent probes attached to three different residues on the NH2-terminal end of the S4 region (E518C, E519C, and L520C) reported both fast and slow voltage-dependent changes in fluorescence. The slow changes in fluorescence correlated strongly with activation gating, suggesting that the slow activation gating of HERG results from slow voltage sensor movement. The fast changes in fluorescence showed voltage dependence and kinetics similar to inactivation gating, though these fluorescence signals were not affected by external tetraethylammonium blockade or mutations that alter inactivation. A working model with two types of voltage sensor movement is proposed as a framework for understanding HERG channel gating and the fluorescence signals.
Keywords: ion channel gating, fluorescence, activation gating, inactivation gating
INTRODUCTION
The human ether-à-go-go related gene (HERG)* K+ channel is one of the myriad of ion channels responsible for generating the cardiac action potential. HERG codes for a voltage-activated potassium channel that is especially important during the repolarization phase of the action potential (Curran et al., 1995; Sanguinetti et al., 1995; Trudeau et al., 1995). Current through this channel is thought to correspond to a potassium current previously studied in myocytes, named IKr (Shibasaki, 1987; Sanguinetti and Jurkiewicz, 1990; Sanguinetti et al., 1995).
The hydropathy plot for the HERG protein suggests that this channel resembles the Shaker potassium channel; both have a six transmembrane region subunit structure with a highly charged fourth transmembrane segment. Despite this similarity, HERG channels behave very differently from Shaker channels: HERG behaves like an inward rectifier rather than an outward rectifier (Sanguinetti et al., 1995; Trudeau et al., 1995). This anomalous behavior is due to the unusual kinetics of HERG gating, with slow activation gating and fast inactivation gating. During depolarization, HERG channels slowly activate then rapidly inactivate, resulting in little outward current; during subsequent hyperpolarization, channels recover rapidly from inactivation but deactivate slowly, resulting in a large inward current.
The fast inactivation mechanism of HERG channels resembles the C-type inactivation mechanism observed in Shaker potassium channels (Schönherr and Heinemann, 1996; Smith et al., 1996). C-type inactivation results from a constriction of the outer mouth of the pore that occludes the flow of potassium ions (Choi et al., 1991; Hoshi et al., 1991; Yellen et al., 1994; Liu et al., 1996). This process occurs slowly over several hundred milliseconds and is not intrinsically voltage-dependent. HERG inactivation also appears to result from a conformational change at the outer mouth of the pore; however, HERG inactivation is very fast, occurring in milliseconds, and it is intrinsically voltage-dependent. In voltage-gated sodium and potassium channels, the apparent voltage dependence of inactivation derives not from an intrinsic voltage dependence of inactivation but rather from its coupling to voltage-dependent activation. This cannot be the case for HERG because activation is much slower than inactivation.
What molecular mechanisms underlie the voltage-dependent gating of HERG channels? The voltage dependence of this family of potassium channels has long been attributed to the highly charged fourth transmembrane segment (S4). Experiments on Shaker potassium channels show that the S4 region moves rapidly in response to voltage and that channel activation follows this movement (Larsson et al., 1996; Mannuzzu et al., 1996; Cha and Bezanilla, 1997). Assuming that the S4 region is at least partly responsible for the voltage-dependent gating of HERG channels, we asked how movement of the HERG S4 region relates to gating. Perhaps, the voltage sensor moves slowly, and this accounts for the slow activation and deactivation kinetics. Alternatively, the voltage sensor might move rapidly, and the transitions after voltage sensor movement that lead to channel opening are slow. If the voltage sensor were to move quickly, this movement might also account for the voltage dependence of inactivation.
We sought to answer this question using fluorescence measurements to monitor S4 movement in HERG (Mannuzzu et al., 1996; Cha and Bezanilla, 1997; Mannuzzu and Isacoff, 2000). A cysteine engineered into the channel is covalently labeled with a fluorescent probe, and changes in the fluorescence of the attached probe are then monitored as the voltage is changed using a cut-open oocyte voltage clamp. These changes in fluorescence are believed to reflect conformational changes that occur in the region of the protein near the probe. In Shaker, such fluorescence changes correlate with S4 movement as monitored by gating currents.
We studied three consecutive positions in HERG at the NH2-terminal end of the S4 region on the external side of the channel. Although these positions are located next to one another, each revealed a very different fluorescence profile. The measured fluorescence changes have both fast and slow components. The slow component correlates well with both the kinetics and voltage dependence of activation gating, and the fast component bears similarity to the kinetics and voltage dependence of inactivation. The results suggest that a slow conformational change occurs near the S4 region of HERG, which could account for the slow activation observed in HERG.
MATERIALS AND METHODS
Molecular Biology and Channel Expression
The cDNA encoding wild-type HERG was subcloned between the EcoRI and the HindIII restriction sites in the pGEMHE expression vector. pGEMHE, provided by Emily Liman (University of Southern California, Los Angeles, CA), was constructed by subcloning the 3′ and 5′ untranslated regions of the Xenopus β-globin gene in the pGEM3Z expression vector (Liman et al., 1992). HERG mutants were constructed using an oligonucleotide-directed mutagenesis method, and all mutants were sequenced to confirm mutation. The NH2-terminal deletion mutant, HERG Δ2–137, was provided by Roderick MacKinnon (Rockefeller University, New York, NY).
cRNA was transcribed using the T7 mMessage machine kit (Ambion). 50–100 nL of cRNA was injected into each Xenopus oocyte, and experiments were performed 1–7 d after injection. Oocytes were incubated in the following solution: 98 mM NaCl, 2 mM KCl, 1.8 mM CaCl2, 1.0 mM MgCl2, 10 mM HEPES, 50 U/ml penicillin, and 50 μg/ml streptomycin, pH 7.6.
Labeling Oocytes
For labeling, oocytes were incubated in a depolarizing solution containing 100 mM KCl, 1.8 mM CaCl2, 1.0 mM MgCl2, 10 mM HEPES and 5 μM tetramethylrhodamine-5-maleimide (Molecular Probes) at pH 7.6 for 30 min. The solution was cooled on ice before and during labeling.
Treatment of Oocytes before Recording
We encountered a persistent problem while recording from Xenopus oocytes expressing HERG channels, which we had never observed while recording from HEK cells expressing HERG. During depolarization to −10 mV, the outward current increases to a seemingly steady-state level, and then it suddenly increases again to a new steady-state level. This was observed at depolarizations between about −20 and 40 mV and not at greater depolarizations. When this effect was seen during the depolarizing step, the tail current decay upon hyperpolarization was greatly slowed. The severity of this problem varied widely between batches of oocytes, but it was consistent enough to prevent accurate recordings of the kinetics of both current and fluorescence traces. This problem was never observed in recordings from Xenopus oocytes expressing the HERG “inactivation removed” mutant (G628C:G631C).
We suspected that this effect was due to potassium accumulation on the external side of the membrane during the course of depolarization; the accumulation somehow interferes with channel gating and/or voltage-clamping of the membrane to produce the time-dependent changes in the measured current. Potassium accumulation can occur easily in oocytes because the membrane has numerous invaginations. If the currents are large or sustained over a long period of time, significant potassium accumulation may occur in the small spaces created by invaginations of the membrane. We found that incubating the labeled oocytes in a hypoosmotic solution (50% ND96) for 20–30 min before recording eliminated the effect. Presumably pre-swelling the oocytes in this solution smooths the surface of the membrane sufficiently to reduce potassium accumulation. Unless otherwise noted, we performed all physiological measurements in a solution containing 10 mM KCl, 88 mM NaCl, 1.8 mM CaCl2, 1.0 mM MgCl2, and 10 mM HEPES, pH 7.6.
Data Acquisition and Analysis
Ionic currents and fluorescence measurements were acquired with a Digidata 1200A board (Axon Instruments, Inc.) interfaced to a Pentium-based PC using pClamp7 software (Axon Instruments, Inc.). Currents and fluorescence were simultaneously acquired in two different channels of the Digidata 1200A; both current and fluorescence data were filtered at 0.2–1 kHz and digitized at 0.5–10 kHz. Fluorescence data were filtered using an 8-pole Bessel filter (Frequency Devices).
All analysis was performed using pClamp7 software. Some traces have been additionally filtered for display. Exponential fits were done using Chebyshev minimization. Because the baseline fluorescence decreases during recording due to photobleaching of the fluorophore, all fluorescence traces have been corrected for bleaching. In every experiment, the fluorescence change at a constant potential (generally the holding potential) was measured and fit to a single or double exponential. This fit was subtracted from all traces collected from the oocyte.
Fluorescence Setup
The fluorescence setup is modeled after that used by Cha and Bezanilla (1997). The IM-35 Zeiss microscope (Carl Zeiss, Inc.) houses most of the optics. The light source is a 150-W tungsten-halogen lamp powered by a 6542A DC power supply (Hewlett-Packard); the output of the lamp is controlled by a TTL triggered shutter (Vincent Associates) to minimize photobleaching of the fluorescent probe. Incoming light is filtered with a 525RDF45 excitation filter (Omega Optical) and transmitted through a 560DRLP dichroic mirror. Light transmitted through the excitation filter is focused with a 20× objective, numerical aperture of 0.5 (Spindler and Hoyer), into a fiber optic cable (FSUS780800920; Polymicron Technologies) 760 μm in diameter and numerical aperture of 0.66. The 0.75-m cable extends from ∼1 cm above the microscope objective to ∼0.5 cm above the oocyte. Light collected from the oocyte through the fiber optic is transmitted through the dichroic mirror then filtered with a 565EFLP emission filter. Light exiting through the camera port on the microscope is focused with two lenses, focal lengths 40 mm and 6 mm, (Edmund Scientific) onto a photodiode (model PIN020A; UDT Sensors); both the lenses and the photodiode are mounted directly on the camera port of the microscope. Output from the photodiode is amplified by an Axopatch 200B amplifier (Axon Instruments, Inc.).
Voltage-clamp of the oocyte membrane was performed using a Dagan CA-1B cut-open oocyte clamp (Dagan Corporation, Minneapolis, MN). The bottom of the upper chamber was painted with black India ink to assure that the emitted fluorescence was coming only from the cap of the oocyte where currents are recorded. To gain electrical and chemical access to the inside of the oocyte the membrane facing the bottom chamber was permeabilized with 0.5% saponin.
RESULTS
Unlabeled and Labeled Cysteine Mutants Gate Almost Normally
To investigate the role of S4 in HERG activation and inactivation, we studied the fluorescence of three HERG cysteine mutants covalently labeled with a fluorescent dye, tetramethylrhodamine maleimide (TMRM). These three mutant sites (E518C, E519C, and L520C) are located on the NH2-terminal end of the S4 region on the external side of the channel, as shown in Fig. 1 A. For comparison, Fig. 1 B shows the amino acid sequence of both HERG and Shaker near the S4 region, with the three HERG residues studied here underlined. The underlined residues in the Shaker sequence indicate sites that have been studied previously using this fluorescence approach (Mannuzzu et al., 1996; Cha and Bezanilla, 1997, 1998; Loots and Isacoff, 1998). Fluorescence changes measured from probes attached to these sites in the Shaker channel correlate with movement of the S4 region, as assayed by gating currents and ionic current.
Figure 1.

Location of HERG cysteine mutants. (A) Putative transmembrane topology of a single subunit of the HERG potassium channel. Mutations are located at the end of the S3-S4 linker nearest to the S4 segment, shown by the cartoon dye molecule at the top. (B) Amino acid sequence of the S4 region for HERG and the Shaker potassium channel. Positively charged residues are shown in bold. The underlined residues in the HERG sequence were individually mutated to cysteines and labeled with a fluorescent probe for further study. The underlined residues in the Shaker sequence have been studied previously using this fluorescence technique (Mannuzzu et al., 1996; Cha and Bezanilla, 1997, 1998; Loots and Isacoff, 1998).
Before studying the fluorescence of probes attached to these introduced cysteines, we characterized the gating of the mutant channels before and after reaction with TMRM. The general behavior of all three HERG mutants both before and after modification with TMRM is similar to the behavior of wild-type HERG, although some differences in gating can be noted. The g-V and the steady-state inactivation-voltage (h∞) relationships are shown in Table I. All three mutations decrease the slope of the g-V relationship; the largest decrease is seen in E518C (zδ decreases by 1.6 equivalent charges). Modification by TMRM generally shifts the midpoint of the g-V negative by 5–10 mV; modification also decreases the slope of the g-V for L520C by ∼20%. Mutation has little effect on the h∞ curves for E520C and E519C, but the h∞ curve of E518C is shifted to slightly more positive voltages. Wild-type HERG channels treated with TMRM showed no voltage-dependent changes in fluorescence (unpublished results); therefore, it is unlikely that the observed fluorescence changes are from TMRM labeling of native cysteines in other regions of the channel.
TABLE I.
Gating Parameters for Mutant and Modified Channels
| Midpoint | zδ | n | |
|---|---|---|---|
| g-V: | |||
| Wild type | −17.6 ± 0.7 | 3.6 ± 0.2 | 7 |
| E518C | −21.4 ± 1.6 | 2.0 ± 0.1 | 3 |
| E518C-TMRM | −30.2 ± 2.2 | 2.2 ± 0.2 | 5 |
| E519C | −15.4 ± 3.0 | 2.6 ± 0.1 | 6 |
| E519C-TMRM | −20.6 ± 1.3 | 2.3 ± 0.1 | 6 |
| L520C | −15.0 ± 0.8 | 3.1 ± 0.1 | 4 |
| L520C-TMRM | −25.6 ± 2.4 | 2.4 ± 0.1 | 7 |
| Steady-state Inactivation-V (h∞): |
|||
| Wild type | −96.4 ± 4.1 | 0.7 ± 0.1 | 5 |
| E518C | −76.0 | 1.1 | 1 |
| E518C-TMRM | −75.4 ± 5.9 | 0.9 ± 0.1 | 3 |
| E519C | −79.7 ± 3.4 | 0.9 ± 0.1 | 3 |
| E519C-TMRM | −90.9 ± 3.0 | 0.7 ± 0.1 | 3 |
| L520C | −95.8 ± 3.3 | 0.8 ± 0.1 | 3 |
| L520C-TMRM | −98.7 ± 8.3 | 0.7 ± 0.1 | 2 |
(g-V) To obtain these values currents from Xenopus oocytes expressing each construct were recorded in response to 2-s voltage steps to potentials ranging from −90 to 70 mV followed by a step to −110 mV. Plots for each experiment were fit to a Boltzmann function, and the average midpoint and slope (zδ) are shown with standard errors. n is the number of experiments for each construct. To obtain the g-V curve, the peak current during the hyperpolarizing step was plotted against the voltage of the depolarizing step. (h∞) The steady-state inactivation as a function of voltage for each mutant was plotted using the protocol described in Fig. 7.
Fluorescence Signals in Response to a Single Voltage Step Contain Fast and Slow Components
Fig. 2 shows simultaneous measurements of fluorescence and ionic current for the three labeled cysteine mutants in response to a 1-s voltage step to 30 mV. Although the labeled residues are adjacent to one another, they exhibit very different fluorescence signals. The fluorescence signals recorded from E518C-TMRM and E519C-TMRM are markedly biphasic. The two components of the signal have very different time courses (fast and slow), and the fluorescence changes occur in different directions (increase and decrease). On depolarization, the fluorescence signal from E518C-TMRM reveals a small, rapid decrease followed by a slow increase to a steady-state level; upon hyperpolarization, the fluorescence rapidly decreases and then slowly increases to a steady-state level. The fluorescence signal for E519C-TMRM has fast and slow components similar to E518C-TMRM, although the relative magnitude of the components is quite different. The magnitude of the rapid decrease on depolarization is much greater in fluorescence traces recorded from E519C-TMRM. Curiously, for both mutants, the fluorescence changes in response to both depolarizing and hyperpolarizing voltage steps are in the same direction (a fast decrease followed by a slow increase). In contrast to E518C and E519C, fluorescent probes attached to L520C (the position closest to the S4 region) exhibit fluorescence changes with only a slow component. The fluorescence decreases slowly upon depolarization and increases slowly upon hyperpolarization.
Figure 2.

Fluorescence signals and current simultaneously recorded in response to a single voltage step from oocytes expressing E518C, E519C, or L520C and treated with TMRM. In each recording, the membrane was held at −90 mV, depolarized to 30 mV for 1 s, and then stepped to −110 mV.
The Slow Component of the Fluorescence in L520C-TMRM Is Correlated with Activation Gating
We used L520C-TMRM to focus on the properties of this slow component of the fluorescence signal. In Fig. 3 , the kinetics of the activating and deactivating current are compared with the kinetics of the fluorescence changes for L520C-TMRM. Because the outward current during depolarization was very small, we measured the kinetics of activation by plotting the development of the tail current over time (Fig. 3, top left panel, envelope of tails protocol). The activation kinetics closely match the kinetics of the fluorescence during depolarization (Fig. 3, solid line, bottom panel). A similar comparison for deactivation is shown on the right side of Fig. 3. The deactivating tail current (dashed line) has two components measuring ∼80 and ∼330 ms. The faster component (thick gray line) is larger in magnitude, comprising 83% of the total current, and it closely follows the kinetics of the fluorescence change upon hyperpolarization.1
Figure 3.

L520C-TMRM fluorescence signals during channel activation and deactivation. (top left) Currents resulting from an envelope of tails protocol (voltage records shown below); oocytes were depolarized from −90 to +30 mV for varying durations, and then hyperpolarized to −110 mV. The time course of the peak inward tails reveals the time course of activation during the depolarizing step. (top right) Deactivating tail current measured at −110 mV after a 2-s depolarization to +30 mV. (bottom) The kinetics of the fluorescence are compared with the kinetics of activation and deactivation. From a holding potential of −90 mV, the membrane was depolarized to +30 mV for 2 s, and then stepped to −110 mV. The fluorescence trace is unaveraged. The solid gray line at left plots the kinetics of activation as measured by currents resulting from the envelope of tails protocol (top left); the peak tail current upon hyperpolarization to −110 mV is plotted as a function of time (τ = 84 ms). The thin solid line at right shows the deactivating tail current from the top right panel, scaled to the magnitude of the fluorescence change. This tail current was best fit with two exponentials; the faster component (τ = 83 ms) comprises 83% of the total magnitude, and the slower component (τ = 334 ms) makes up the remaining 17%. The solid gray line at right plots only the faster of the two components, scaled to match the fluorescence. For comparison, τF on depolarization = 67 ms and τF on hyperpolarization = 88 ms.
To provide additional evidence for the relationship between the slow fluorescence and activation gating, we used an NH2-terminal deletion mutant that speeds the rate of deactivation (Schönherr and Heinemann, 1996; Spector et al., 1996; Wang et al., 1998). The NH2-terminal deletion combined with L520C-TMRM (giving L520C:Δ2–137-TMRM) shows both the predicted faster deactivation and correspondingly faster kinetics of fluorescence on hyperpolarization (Fig. 5) . Little change occurs in the channel opening kinetics or in the fluorescence signal during depolarization (unpublished results).
Figure 5.
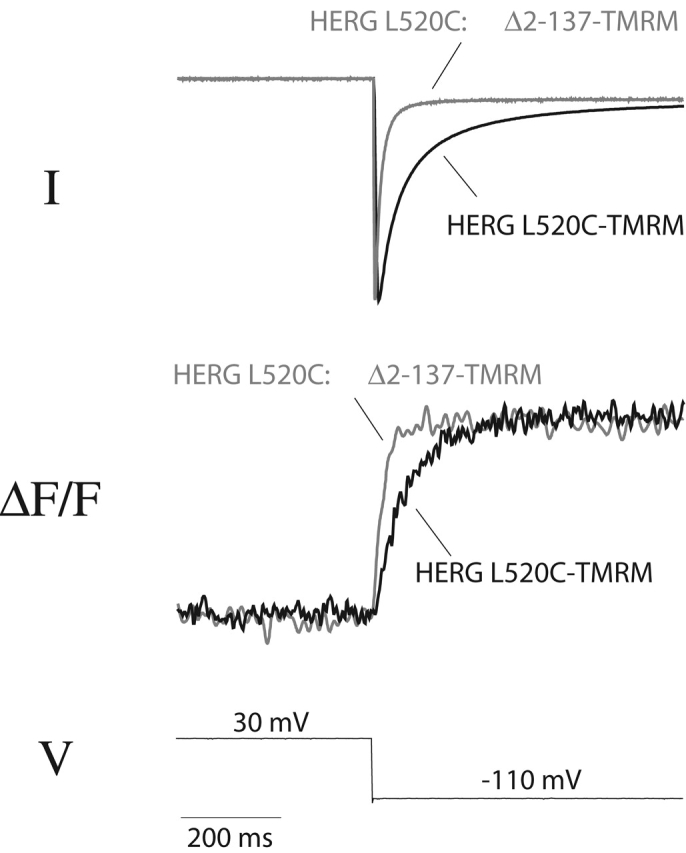
An NH2-terminal deletion produces similar effects on deactivation and the fluorescence signal of L520C-TMRM. Current traces (top) and fluorescence signals (middle) recorded from oocytes expressing L520C-TMRM and L520C:Δ2–137-TMRM. Channel deactivation is monitored after a prolonged step to +30 mV (2 s for L520C-TMRM; 1 s for L520C:Δ2–137-TMRM).
A Fast Component of Fluorescence in E519C-TMRM and E518C-TMRM Tracks Inactivation
The fast fluorescence changes seen with E519C-TMRM and E518C-TMRM upon hyperpolarization are particularly interesting because they occur while rapid voltage-dependent recovery from inactivation is observed. We compared the kinetics of the current and fluorescence signals, both during recovery from inactivation and during reinactivation (Fig. 6) , using a three-step protocol (Smith et al., 1996). After a long depolarizing step to activate and inactivate the channels, a brief hyperpolarization allows recovery from inactivation and a second depolarizing step produces reinactivation. Fig. 6 (bottom panels) shows fluorescence traces (thin solid line) and the current traces (thick solid line) scaled to match the magnitude of the fluorescence changes. For E519C-TMRM, the kinetics of the current and fluorescence traces are very similar both during recovery from inactivation and during reinactivation. The current shown for E518C-TMRM slightly leads the fluorescence signal during recovery from inactivation and slightly lags the fluorescence signal during reinactivation.
Figure 6.

Kinetics of the fast fluorescence changes for E519C-TMRM and E518C-TMRM parallel the kinetics of channel gating during recovery from and re-onset of inactivation. (top) Fluorescence changes and current recorded from oocytes expressing 519C-TMRM (left) or 518C-TMRM (right) during a three-step voltage protocol. The 519C-TMRM trace is the average of 10 recordings acquired at a sampling rate of 1 kHz; the 518C-TMRM trace is the average of 20 recordings acquired at a sampling rate of 10 kHz. (bottom) The fluorescence traces shown on an expanded time scale. Solid black lines show the current trace scaled to correspond to the magnitude of the fluorescence. Each segment of the pulse protocol was scaled independently to allow for a comparison of the kinetics.
The voltage dependence of the fast component of the fluorescence is compared with the steady-state inactivation-voltage relationship for E519C-TMRM and E518C-TMRM in Fig. 7 . Fig. 7 A shows the protocol used to determine the steady-state inactivation-voltage curve for each mutant. During an initial 1-s depolarization, channels activate and then rapidly inactivate. During the brief hyperpolarizing pulse, channels recover from inactivation, and the degree of recovery depends on the voltage of the pulse. The membrane is stepped to a constant potential (0 mV) to allow outward current to flow through the open channels. The magnitude of the outward current immediately after the second depolarizing step (arrow) reflects the number of open channels at the end of the previous brief pulse or, in other words, the fraction of channels that have recovered from inactivation during the brief pulse. Fig. 7 B shows a plot of the current at the arrow as a function of voltage (Fig. 7 B, open circles). The current falls off at negative potentials because the channels also begin to deactivate during the 30-ms pulse; however, we can correct the current magnitude for the amount of deactivation at each voltage. We fit deactivating tail currents with an exponential function and then back-extrapolated the fit to the beginning of the hyperpolarizing pulse. Assuming that deactivation and recovery from inactivation occur independently, we estimated the fraction of channels that deactivate during a 30-ms pulse from the extrapolated fit and increased the outward current (at the arrow) accordingly. The corrected data (Fig. 7 B, closed circles) are well fit by a Boltzmann function, from which we estimate the voltage dependence of HERG inactivation (zδ = 0.75 e0; Vmid = −93 mV).
Figure 7.
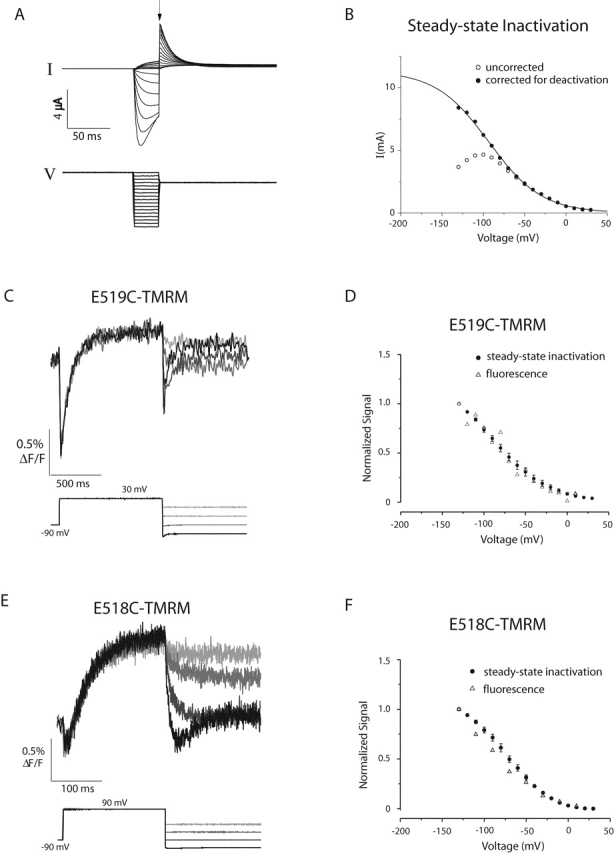
The voltage dependence of steady-state inactivation compared with the voltage dependence of the fast fluorescence change measured for 519C-TMRM and 518C-TMRM. (A) Protocol used to determine the voltage dependence of inactivation. Oocytes injected with wild-type HERG were depolarized to 30 mV for 1 s, briefly hyperpolarized to voltages ranging from −130 to 10 mV for 30 ms and stepped to 0 mV for 300 ms. (B) Open circles represent the current measured immediately after the second depolarizing step to 0 mV (A, arrow) as a function of voltage. Currents decrease at negative potentials due to deactivation during the 30 ms pulse. The current after correction for deactivation (see results) is shown by the closed circles. (C) Fluorescence signals reported by E519C-TMRM in response to a tail current protocol; the membrane was depolarized to 30 mV for 1 s from a holding potential of −90 mV, then stepped to potentials varying from −130 to −10 mV in 40-mV steps. Each trace is the average of 10 recordings acquired at a sampling rate of 1 kHz. (D) Voltage dependence for the fast fluorescence change (ΔF) on hyperpolarization, normalized to the maximum observed ΔF (closed circles). Fluorescence signals measured during the second voltage step were fit with either a single or double exponential to obtain the magnitude of the initial fast change in fluorescence upon hyperpolarization. The average steady-state inactivation-voltage curve for E519C-TMRM is also shown (open circles, n = 3) normalized to a maximum value of 1. Steady-state inactivation-voltage curves were constructed as described for B. (E) Fluorescence signals reported by E518C-TMRM in response to a tail current protocol; the membrane was depolarized to 90 mV for 200 ms from a holding potential of −90 mV, and then stepped to potentials varying from −130 to −10 mV in 40-mV steps. Each trace is the average of 20 recordings acquired at a sampling rate of 10 kHz. (F) Voltage dependence for the fast fluorescence signal of E518C-TMRM, together with the steady-state inactivation curve (both determined as for D). Throughout, the error bars indicate SEM.
To obtain the magnitude of the initial fast change in fluorescence upon hyperpolarization, the fluorescence measured during hyperpolarizing voltage steps (Fig. 7, C and E) was fit with either a single or double exponential function. The magnitude of the fast component of the fluorescence signal (open triangles) as well as the steady-state inactivation (closed circles) are plotted as a function of voltage for E519C-TMRM and E518C-TMRM (Fig. 7, D and F, respectively). We find that the voltage dependence of the fast fluorescence change on hyperpolarization is similar to the voltage dependence of inactivation for both E519C-TMRM and E518C-TMRM.
The caveat for these comparisons is that none of the curves has reached a plateau by −130 mV. Our ability to measure the steady-state inactivation-voltage curve was compromised at more negative voltages by the inability to correct reliably for deactivation; as the decaying tail currents get faster, the correction becomes more prone to error (Fig. 7, A and B). The fluorescence magnitudes shown in these curves were determined by fitting the fluorescence with an exponential function. At very negative potentials, it is difficult to separate the kinetic components of the fluorescence because the rates are faster and the difference between components is less pronounced than at positive potentials.
Manipulations that Alter HERG Inactivation Do Not Alter Fluorescence Changes
Application of external TEA slows the kinetics of HERG inactivation, as though channels cannot inactivate when TEA is bound (Smith et al., 1996). We examined the effect of 50 mM TEA on the fluorescence measured during the second depolarizing pulse of a three-step protocol. Fig. 8 A shows that although TEA has a large effect on the kinetics of inactivation, the kinetics of the fluorescence are unchanged. We also measured the fluorescence of E519C in the presence of a double mutation (G628C:G631C) that effectively removes HERG inactivation (Smith et al., 1996).
Figure 8.

Modulation of inactivation does not affect fast fluorescence changes. (A) External TEA slows inactivation but has no effect on the fluorescence signal of E518C-TMRM. After a short hyperpolarizing step to produce recovery, a second depolarizing step elicits rapid reinactivation; both ionic current and fluorescence are monitored before and after application of 50 mM external TEA. For comparison, the fluorescence traces for each condition were shifted to the same level at the end of the first depolarizing pulse; the current traces are simply overlaid. (B) Fluorescence and current traces measured from oocytes expressing E519C:G628C:G631C-TMRM in response to a three-step protocol. Inactivation is eliminated, but the fluorescence signal is similar to E519C-TMRM in Fig. 6 A. The external solution contained 2 mM KCl and 98 mM NaCl.
To assure that there was no fluorescence signal resulting from labeling of the cysteines located at positions 628 and 631, we recorded the fluorescence of the double mutant G628C:G631C without E519C after treatment with TMRM. No voltage-dependent fluorescence changes were observed from the double mutant (unpublished results), which is consistent with the possibility that these two cysteines may form a disulfide bonded pair. Such a disulfide is structurally reasonable, as judged from the KcsA crystal structure (Doyle et al., 1998).
Fig. 8 B shows the current and fluorescence measured from E519C:G628C:G631C-TMRM. The current trace confirms that inactivation has been removed; the outward current is large compared with the inward current, and during the second depolarization, we observe no inactivation. The fluorescence trace is unaffected by the removal of inactivation; all components of the fluorescence seen with E519C-TMRM are observed in the inactivation removed mutant. This result is similar to the results found upon application of TEA; modulating inactivation has no effect on the fluorescence signal.
At first glance, these results seem to rule out the possibility that the fluorescence change is associated with the inactivation. Indeed, they do imply that the fast fluorescence changes cannot simply be reporting inactivation gating itself (i.e., the movement that results in occlusion of the pore). But it remains possible that the fluorescence signal reports a movement of the voltage sensor that is coupled to inactivation.
Even if the coupling between the voltage sensor and inactivation gating at the pore is not very strict, manipulations of the pore should alter the behavior of S4 (and thus the fluorescence signal) under some conditions, if the two are functionally connected. In the presence of TEA, the h∞ curve is shifted to the right of the control curve by ∼20 mV (unpublished results), which is consistent with the idea that TEA stabilizes the noninactivated state. If there is coupling, this shift also should be reflected as a shift in the voltage dependence of the fluorescence signal, but it would be difficult to measure this convincingly because of the potential errors introduced by noise, by separating the multiple kinetic components in the fluorescence signal, and by the need to correct for deactivation.
The Fast Component of Fluorescence Seen on Initial Depolarization Is Faster than any Observable Gating
To examine the fast component of the fluorescence signal seen upon the initial depolarization (from rest) in greater detail, we applied a short depolarizing pulse and measured the response from E519C-TMRM (Fig. 9 A). The fluorescence decreases rapidly on depolarization and increases rapidly on hyperpolarization. These changes are extremely fast: they occur in the millisecond after the membrane potential is changed, while the capacity transient is still settling. The fact that the fluorescence changes are so fast raises the possibility that this component may simply be a direct electrochromic effect of the voltage on the dye (Loew et al., 1985). In other words, a change in voltage may cause a very fast electronic rearrangement in the dye molecule, and this rearrangement could alter the fluorescence output.
Figure 9.

Properties of fast fluorescence change after depolarization recorded from E519C-TMRM. (A) Fluorescence and current traces recorded from E519C-TMRM during a 20 ms voltage pulse to 30 mV. The dashed line indicates approximately the end of the capacity transient observed in the current trace upon depolarization. (B) Voltage dependence of the fast fluorescence change observed upon depolarization for E519C-TMRM. Fluorescence changes recorded during a series of voltage steps 150 ms in duration ranging from −130 mV to 110 mV. (C) Plot of the fluorescence 5 ms after depolarization (B, arrow); each point is an average of 10 data points from the fluorescence trace at each voltage. The points were fit with a Boltzmann function (Vmid = 15.6 mV, and zδ = 0.75 e0).
This component of the fluorescence is weakly voltage-dependent; Fig. 9 B shows the fluorescence resulting from a family of short voltage pulses. A plot of the fluorescence immediately after depolarization (arrow) as a function of voltage is shown in Fig. 9 C. The shallow voltage dependence of this fluorescence component is reminiscent of the voltage dependence of steady-state inactivation; however, the midpoint of the fluorescence-voltage relationship (∼15 mV) is much more positive than the midpoint of the steady-state inactivation-voltage curve (−90 mV).
A Different Fluorophore Reports Opposite Fluorescence Signals but with the Same Kinetics
To examine how the measured changes in fluorescence depend on the covalently attached dye, we measured fluorescence changes reported by a different fluorescent probe, Oregon green 488 maleimide (OG). TMRM and OG are both derived from rhodamine; however, the dyes differ in total charge. TMRM has a net charge of 0 (with a delocalized positive charge at the tricyclic end), and OG has a net charge of −2. Fig. 10 shows fluorescence signals from E519C-TMRM and E519C-OG resulting from a single 1-s voltage step to 30 mV. Although the TMRM and OG signals are grossly different (with fluorescence changes in opposite directions), the kinetic components have the same time constants over a range of voltages (unpublished results).
Figure 10.
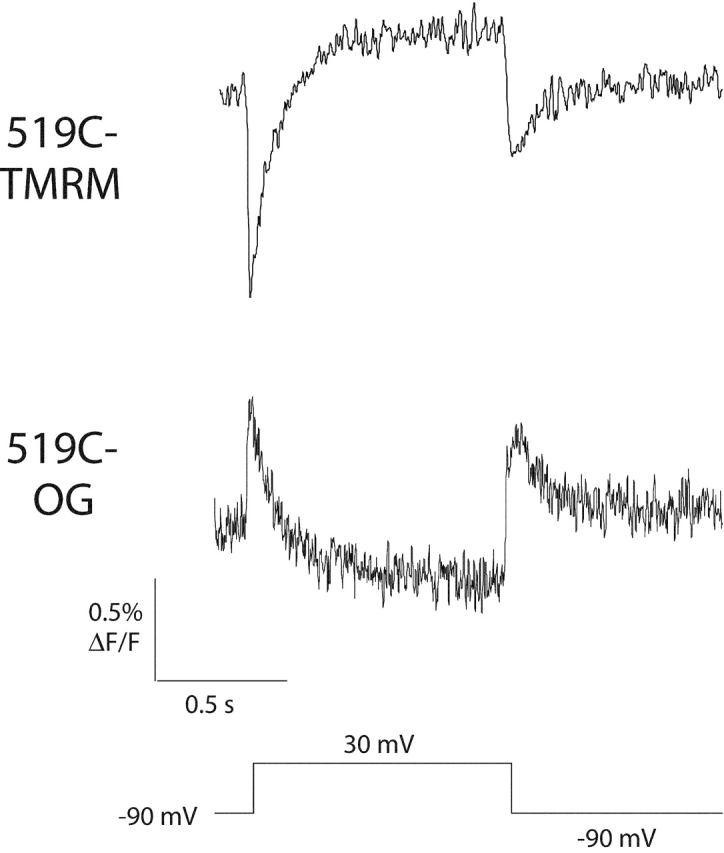
Fluorescence traces recorded from oocytes expressing 519C labeled with TMRM or Oregon green (OG). Fluorescence changes were measured in response to a 1-s voltage step to 30 mV followed by a hyperpolarizing step to −90 mV.
Cha and Bezanilla (1997)(1998) pointed out that one possible source of fluorescence signals is quenching of the dye fluorescence by another nearby dye molecule. Our results with Oregon green argue against the idea that the fluorescence changes seen in this work on HERG arise from such self-quenching of dye molecules. Self-quenching should produce a decrease in fluorescence regardless of the dye, but the same conformational changes that produce a decrease in TMRM fluorescence produce an increase in OG fluorescence (and vice versa).
DISCUSSION
Fluorescence Changes Reported near the S4 Region Have Both Fast and Slow Components
HERG channels activate and deactivate slowly but inactivate very rapidly, producing inward rectification. These unique features of HERG gating led us to inquire about the nature of movements occurring near the voltage sensor of HERG channels. To study how S4 movement relates to HERG gating, we recorded voltage-dependent fluorescence changes from probes attached to three different sites located on the NH2-terminal end of the S4 segment of HERG. Although the sites of attachment were adjacent to one another, the fluorescence changes recorded from the three mutants were quite different. All three reported slow fluorescence changes, and two of the three (E518C-TMRM and E519C-TMRM) also reported fast fluorescence changes.
The Slow Fluorescence Change and Activation Gating
In support of the idea that the slow fluorescence changes relate to HERG activation gating, we found that the kinetics of the slow fluorescence change observed in all three mutants are very similar to the unusually slow kinetics of activation and deactivation in HERG. The fluorescence changes reported by L520C-TMRM have only a slow component and, therefore, provide the most direct comparison between the slow fluorescence and activation gating. The steady-state voltage dependence for the slow fluorescence of L520C-TMRM is almost identical to the g-V relationship. Furthermore, if we modulate deactivation gating by deleting a portion of the NH2 terminus of the protein (L520C:Δ2–137), the kinetics of the slow fluorescence changes are modulated in parallel with deactivation. Both deactivation and the decline of fluorescence during deactivation are speeded by deletion of the NH2 terminus.
What is the precise relationship between the slow fluorescence and activation gating? There are two obvious possibilities: (1) either the slow fluorescence reflects S4 movements that underlie HERG activation gating, or (2) the probe is able to sense conformational changes occurring in or near the pore and, thus, simply reports the opening and closing of the pore. We were not able to find a clear distinction between gating of current flow and the slow fluorescence changes reported by these mutants. Both the kinetics and voltage dependence of the slow fluorescence changes are essentially identical to the kinetics and voltage dependence of activation and deactivation. This observation in itself does not eliminate the possibility that the fluorescence is reporting movements of the voltage sensor. A separation between the g-V and F-V relationships is not a necessary consequence of coupled S4 movement and channel opening. In Shaker K+ channels a shift between the g-V and F-V curves results from relatively independent movements of the individual S4 segments and the requirement that all S4 segments move for the channel to open. However, if the S4 segments were to move in a cooperative or concerted way, there need not be any voltage separation between S4 movement and opening.
The main argument favoring the idea that our fluorescent probes monitor S4 movement rather than pore gating is based on their location, by analogy with Shaker channels. Fluorescence changes from residues at an analogous position in Shaker track gating charge movement and not opening, whereas fluorescence changes from residues in the outer mouth of the pore are more closely related to ionic conductance and presumably opening and closing of the pore (Cha and Bezanilla, 1997).
If indeed the slow fluorescence changes reflect movement of the S4 region, then for HERG K+ channels, S4 movement is the rate limiting step in activation and deactivation. Any steps that occur after S4 moves must be fast in comparison. This result can be contrasted with the slow opening of the Shaker mutant, Shaker ILT (Smith-Maxwell et al., 1998a,b). In that case, most gating charge moves quickly (Ledwell and Aldrich, 1999), but the final cooperative step of opening is slow.
Fast Changes in Fluorescence Associated with Inactivation
In addition to the slow fluorescence signal associated with activation, E518C-TMRM and E519C-TMRM reported fast changes in fluorescence that shared some properties with inactivation gating. During both the recovery from inactivation and the reinactivation after a subsequent depolarizing step, the fast component of the fluorescence signal matches the kinetics of inactivation gating. At many voltages, it was difficult to separate the fast and slow components, and neither the steady-state level of inactivation recovery nor the magnitude of the fast fluorescence signal showed clear saturation at the most negative voltages we were able to measure. But, in the range of our measurements, there was generally good agreement between the two.
Although the properties of these fast fluorescence signals are similar to the properties of inactivation, we could not show a causal link between the two. The fast fluorescence changes were not altered by application of 50 mM external TEA or by complete removal of inactivation through mutations at the outer mouth of the pore. As discussed in the results, this rules out the possibility that the fluorescence is simply reporting the closure of the pore. Rather than supposing that the correspondence between these signals and inactivation gating is simply a coincidence, we hypothesize that the fluorescence reports a fast movement of the voltage sensor that drives the inactivation process (but whose coupling is sufficiently loose that the voltage sensor movement persists when inactivation gating is disrupted).
Fast Fluorescence on Initial Depolarization
A fast fluorescence decrease on the initial depolarization from rest is observed both for E518C-TMRM and E519C-TMRM, although the magnitude of this component is much greater in E519C-TMRM. The most noticeable property of this component is its extremely fast kinetics; it occurs almost immediately after the voltage across the membrane changes, during the capacity transient seen in the current. Does this fast fluorescence change reflect a very fast movement of the protein, or is this fluorescence change unrelated to protein movement? This very fast fluorescence decrease could be due to an electrochromic effect, a change in the properties of the dye itself resulting from the change in voltage across the membrane. If so, it is interesting that there is no reciprocal fast fluorescence increase upon hyperpolarization, after activation of the channels occurs. This might indicate that E519C-TMRM senses the transmembrane voltage at rest, but during activation it moves to a position that is insensitive to the electric field across the membrane. In other words, the magnitude of the electrochromic effect would be state-dependent. Also, the fast effect of voltage on the fluorescence is notably nonlinear. As shown in Fig. 9, no fast fluorescence change is seen when the membrane is hyperpolarized from −70 to −130 mV, but a significant change is measured when the membrane is depolarized by the same amount (a step from −70 to −10 mV). In addition, the magnitude of the fast fluorescence changes begins to saturate at very positive membrane potentials (above 110 mV).
Because of the state dependence and nonlinearity, it seems likely that this fast fluorescence decrease on initial depolarization reports a movement of the channel protein. Could this signal (like the fast signal seen with voltage changes after channels have activated) be related to inactivation? As noted above, the fast changes in fluorescence upon initial depolarization have a weak voltage dependence similar to the voltage dependence of inactivation, but the midpoint of the fluorescence signal is shifted by ∼100 mV to the right (Fig. 9). This might be explained if the fast voltage sensor movement that drives inactivation is much more difficult to achieve (i.e., requires more depolarization) in nonactivated channels, compared with activated channels.
Modeling Ionic Currents and Fluorescence Changes
Although our analysis of each component of the fluorescence signal includes a fair amount of uncertainty, we can make all of the conclusions seem more plausible by considering an overall model for channel gating that incorporates the fluorescence signals. Generally, ion channel behavior is described using multi-state kinetic models. Given the number of states the channel can exist in, the connectivity of the states, the rates of transitions between states and the conductance of each state, we can simulate the ionic current through a population of channels in response to changes in voltage. These simulations are compared with real ionic current data to assess the validity of the kinetic model. Although extremely useful for modeling channel behavior, ionic current measurements are limited by the fact that they only reveal transitions to or from the open state of the channel. Ionic current measurements cannot directly reveal transitions occurring between nonconducting states. In theory, fluorescence changes can directly reflect conformational changes occurring in the channel protein regardless of the state of the pore; therefore, measurements of fluorescence changes are potentially useful for constructing and testing kinetic models for channel behavior.
In the case of HERG channels, we observe very different fluorescence changes from the three mutants. We can begin to organize these data by supposing that the conformational changes underlying the fluorescence changes are the same for all three mutants. In other words, the gating behavior of all the mutants is described by the same set of state-occupancy functions (which vary with voltage and time). The time course of the fluorescence signal for each mutant is a linear combination of these state-occupancy functions, weighted by the fluorescence coefficient for each state. It is the differences in these fluorescence coefficients for different sites of dye attachment that produce the distinctive fluorescence signals for each mutant.
The Oregon green data in Fig. 10 illustrates this idea. The fluorescence measured from E519C-OG has the same kinetic components as the fluorescence measured from E519C-TMRM, but the fluorescence changes from the two dyes occur in opposite directions. Both dyes sense transitions among the various conformational states, but each dye has a unique set of fluorescence coefficients (magnitudes) to describe the states.
A Plausible Model to Account for Both Gating and the Fluorescence Signals
Based on this idea, we constructed two models for the states of the voltage sensor (Fig. 11) in which each state represents a conformation of the protein sensed by the mutants. The four state models we present were the simplest models capable of giving plausible fits to our data. Model A and Model B resemble models of Class E and Class D, respectively, from Zagotta et al. (1994).
Figure 11.

Two four-state models to describe fluorescence changes observed in HERG. Model A has two voltage dependent transitions, one fast (q → Q) and one slow (r → R). The shaded boxes show relative magnitudes of the fluorescence coefficients used to describe fluorescence changes observed for each mutant. Model B has three sequential voltage dependent transitions.
Model A (Fig. 11) supposes that there are two principal types of conformational motion of the voltage sensor, q ↔ Q and r ↔ R, which are distinct but coupled. The q ↔ Q transitions are fast, and the r ↔ R transitions are slow. Overall, the conformation of the voltage sensor consists of four states, with each possible combination of q/Q and r/R. The magnitude of the fluorescence in each state is represented by a coefficient, and the total fluorescence is given by the sum of the four coefficients weighted by the occupancy of each state. Each mutant is assigned a different set of coefficients, but they all use the same conformational model.
According to Model A, during a depolarizing pulse, most channels move rapidly from state qr to state Qr, and then slowly to QR. During a hyperpolarizing pulse, they move from QR to qR, and then to qr. The data, interpreted using this model, would suggest that E518C-TMRM does not sense the transition between qr and Qr as well as E519C-TMRM, since the magnitude of the fast fluorescence change upon depolarization reported by E518C-TMRM is much less than that reported by E519C-TMRM. The data also would suggest that L520C-TMRM can sense only the slow transitions. A comparison of measured fluorescence changes and simulated fluorescence changes using Model A is shown in Fig. 12 A. The simulated traces capture the general features of the measured fluorescence changes, although some disparities between the two are evident (see Table II for the parameters of the fit to Model A).
Figure 12.
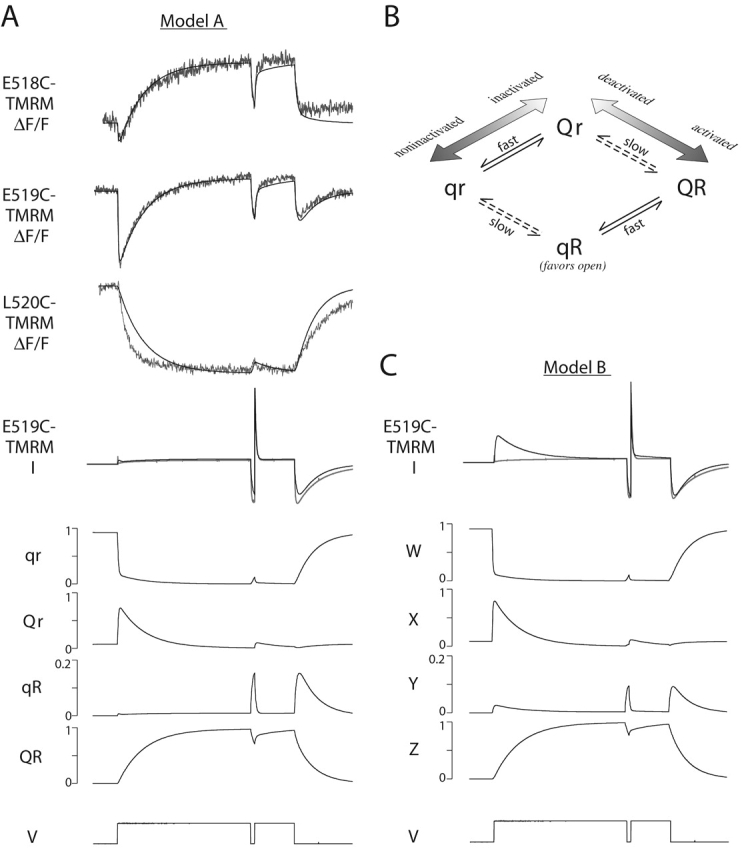
Simulations of fluorescence and current data using Model A and Model B. (A, top) Simulated fluorescence and current traces (black lines) from Model A are overlaid on fluorescence and current traces recorded during a three-step protocol (gray lines) from oocytes expressing E518C, E519C, or L520C and labeled with TMRM. (bottom) Simulation of the occupancy of each state in Model A as a function of time during a three-step protocol. Simulations of fluorescence changes, current and state occupancies used the parameters shown in Table II. The kinetic parameters from fitting E519C-TMRM data were used for all simulations; only the fluorescence coefficients were varied to simulate E518C-TMRM and L520C-TMRM fluorescence data (Table II). (B) Description of Model A showing a likely relationship between states of the voltage sensor and gating states of the pore (i.e., closed, open, and inactivated). (C, top) Simulated current trace (black line) from Model B is overlaid on the recorded current trace (gray line). (bottom) Simulation of the occupancy of each state in Model B as a function of time during a three-step protocol. Simulations of current and state occupancies used the parameters shown in Table III. Simulations of fluorescence data using Model B (Table III) are nearly identical to those shown in A for Model A.
TABLE II.
Parameters for Fit with Model A
| Transition | Kinetic Parameter |
E-519C- TMRM |
|
|---|---|---|---|
| qr → Qr | k0 | 63 | |
| zδ | 0.70 | ||
| Qr → qr | k0 | 35 | |
| zδ | −0.16 | ||
| qr → qR | k0 | 0.54 | |
| zδ | 1.4 | ||
| qR → qr | k0 | 1.5 | |
| zδ | −0.87 | ||
| Qr → QR | k0 | 0.75 | |
| zδ | 1.7 | ||
| QR → Qr | k0 | 0.092 | |
| zδ | −0.51 | ||
| qR → QR | k0 | 81 | |
| zδ | 0.33 | ||
| QR → qR | k0 | 2.1 | |
| zδ | −0.53 | ||
| State | F coefficient E518C-TMRM |
F coefficient E519C-TMRM |
F coefficient L520C-TMRM |
| qr | 0 | 0 | 0 |
| Qr | −0.16 | −0.40 | 0 |
| qR | −1.0 | −1.0 | −1.0 |
| QR | 0.32 | 0.031 | −1.0 |
Parameters of Model A fit to E519C-TMRM fluorescence data. A total of 15 fluorescence traces recorded from one oocyte expressing E519C and labeled with TMRM were used to constrain fits to Model A (one three-step protocol recorded during depolarizing steps to 30 mV, holding potential −90 mV; six traces recorded during a family of depolarizing voltage steps ranging from −70 to 30 mV; eight traces recorded during a tail current protocol, voltage steps ranging from −130 to 10 mV after a 1-s depolarization to 30 mV). Fits of the data were obtained using least-squares minimization in SCOP. All transitions were assumed to be voltage-dependent; rate constants were assumed to have an exponential dependence on voltage given by k = k0 · exp(zδFV/RT). k0 has units of s−1, and zδ is given in eo charges. The program used 16 free parameters to find the best fit. Three kinetic parameters were fixed to maintain detailed balances and to insure that the total charge moved in parallel transitions was the same. In addition, one of the fluorescence coefficients was fixed. Fluorescence coefficients shown for E518C-TMRM and L520C-TMRM were obtained by varying only the fluorescence coefficients from the fit to E519C-TMRM data, to give the best fit to fluorescence traces recorded during a three-step protocol (depolarizing steps to 30 mV and holding potential of −90 mV) from oocytes expressing E518C or L520C and labeled with TMRM.
In the model, there are two types of transitions, one fast and one slow. Given what we know about HERG gating, we assume that the slow transitions (r ↔ R) are between conformations of the voltage sensor that favor the activated state and those that favor the deactivated state (i.e., they affect primarily the activation gate). On the other hand, the fast transitions (q ↔ Q) are between conformations that favor the inactivated and the noninactivated state, i.e., they affect the inactivation gate. Fig. 12 B illustrates this possibility.
In this scenario, the fast change in fluorescence during depolarization (transition qr to Qr) biases the channel to inactivate while the voltage sensor is in state r (thus, favoring the deactivated state as the fast transition occurs). The fast change in fluorescence during hyperpolarization (transition QR to qR) biases the channel to recover from inactivation while the voltage sensor is in state R (while the activated state is favored). If the transition between r and R somehow changes the way the fast transition between q and Q occurs, then the energy required to move from state qr to Qr may be larger than the energy required to move from QR to qR. If this were the case, we would expect to see a shift in the midpoints between the two parallel fast transitions, given that in a simple two state model with voltage dependence, the midpoint of the voltage dependence reflects the energy difference between the two states. With respect to the data, the fast transition qr → Qr yields the fast F-V curve measured upon initial depolarization from rest (Fig. 9). The transition QR → qR yields the fast F-V curve upon hyperpolarization, and this corresponds to the h∞ curve (Fig. 7, D and F). Thus, it is possible that the shift measured between these curves reflects a difference in energy between the qr → Qr and the QR → qR transitions of the voltage sensor. Fits to the fluorescence data using Model A (Fig. 12 and Table II) support this idea. Optimal fits of the fluorescence data predict an energy difference of −0.57 kT between states qr and Qr and an energy difference of −3.7 kT between states qR and QR. Assuming zδ = 0.87, this would predict a 91-mV rightward shift between the fast F-V curve upon depolarization and the fast F-V curve upon hyperpolarization.
Note that in Model A, parallel transitions do not have parallel changes in fluorescence (e.g., transition qr → qR produces a decrease in fluorescence, but transition Qr → QR produces an increase in fluorescence). Although the q ↔ Q transition and the r ↔ R transition are independent from one another, the combination of the two transitions within Model A creates four unique states, each of which can have unique dye-quenching properties.
We examined the occupancy of each state in Model A during a simulated three step voltage protocol (Fig. 12 A). The occupancy of state qR is similar to the occupancy of the open state of HERG during a three-step protocol. If we simply assume that the occupancy of state qR is proportional to the occupancy of the open state, we can simulate the current through HERG channels. Fig. 12A compares the current measured from HERG 519C-TMRM with the simulated current from Model A. Again, the simulated data captures the general features of the measured current.
However, state qR and the open state probably are not simply proportional as assumed in the current simulation in Fig. 12. We can differentially alter inactivation gating and the fast fluorescence signal suggesting that the state of the voltage sensor and the gating state of the pore (i.e., closed, open, inactivated) are not strictly coupled, so it would be more accurate to suppose that state qR of the voltage sensor biases the gating of the pore in favor of the open state. Because the pore and the voltage sensor are physically distinct, such a distinction seems reasonable.
An Alternative Linear State Model
Model A includes four transitions: two parallel, fast transitions and two parallel, slow transitions. However, a linear, sequential model can describe the fluorescence data equally well. The second model (Model B, Fig. 11) treats the two fast changes in fluorescence as two separate conformational changes occurring near the voltage sensor. To move from state W to state Z, the first fast transition (W → X) must take place before the slow transition (X → Y) can occur, and the second fast transition (Y → Z) can occur only after the slow transition is complete.
As with Model A, each “state” of the voltage sensor is assigned a fluorescence, and the total measured fluorescence is a sum of the fluorescence in each state weighted by the probability of being in each. During depolarization of E519C-TMRM, we observe a fast decrease in fluorescence resulting from the transition W → X, followed by a slow increase in fluorescence to state Z. State Y is only transiently populated because the transition Y → Z is much faster than X → Y. However, upon hyperpolarization, we can observe the fast Z → Y transition followed by a slow increase to state W. In this instance, state X is only transiently populated. Model B assumes three sequential transitions. From what we know about HERG gating, we might assume that the first transition favors a second closed state, the second favors the open state, and the third favors the inactivated state.
Simulations of the fluorescence data using Model B are nearly identical to those shown in Fig. 12 A for Model A (Table III, parameters of fit to Model B). Fig. 12 C shows that the state occupancies for the four states in Model B are similar to the state occupancies of the four states in Model A. The principal difference occurs between the occupancies of state Y and state qR; initially, state Y has a greater probability of being populated during a depolarizing step relative to state qR. This difference does not compromise Model B's ability to simulate the fluorescence recordings; however, no linear combination of the state occupancies resulting from fits to Model B neatly resembles the occupancy of the open state of HERG. The occupancy of state Y bears the closest resemblance to the occupancy of the open state of HERG. If we assume the occupancy of state Y is proportional to the occupancy of the open state, we can simulate the current through HERG channels during a three step protocol (Fig. 12 C, top panel). Simulation of the current trace using Model B does not follow the recorded current trace nearly as well as the current simulation using Model A.
TABLE III.
Parameters for Fit with Model B
| Transition | Kinetic Parameter |
E519C- TMRM |
|
|---|---|---|---|
| W → X | k0 | 110 | |
| zδ | 0.47 | ||
| X → W | k0 | 43 | |
| zδ | −0.45 | ||
| X → Y | k0 | 0.91 | |
| zδ | 1.6 | ||
| Y → X | k0 | 9.0 | |
| zδ | −0.54 | ||
| Y → Z | k0 | 92 | |
| zδ | 0.51 | ||
| Z → Y | k0 | 1.3 | |
| zδ | −0.58 | ||
| State | F coefficient E518C-TMRM |
F coefficient E519C-TMRM |
F coefficient E520C-TMRM |
| W | 0 | 0 | 0 |
| X | −0.065 | −0.22 | 0 |
| Y | −1.0 | −1.0 | −1.0 |
| Z | 0.21 | 0.017 | −1.0 |
Parameters of Model B fit to E519C-TMRM fluorescence data. A total of 15 fluorescence traces recorded from E519C-TMRM (described in Table II) were used to constrain fits to Model B. Fits of the data were obtained using least-squares minimization in SCOP. All transitions were assumed to be voltage-dependent; rate constants were assumed to have an exponential dependence on voltage given by k = k0 · exp(zδFV/RT). k0 has units of s−1, and zδ is given in eo charges. The program used 15 free parameters to find the best fit. One of the fluorescence coefficients was fixed during fitting. Fluorescence coefficients shown for E518C-TMRM and L520C-TMRM were obtained by varying only the fluorescence coefficients from the fit to E519C-TMRM data to give the best fit to fluorescence traces recorded during a three-step protocol (depolarizing steps to 30 mV and holding potential of −90 mV) from oocytes expressing E518C or L520C and labeled with TMRM.
Both scenarios shown in Fig. 11 can account for the general properties of the fluorescence changes observed from HERG. Due to a slight difference in the state occupancies between the two models, Model A predicts the current through open HERG channels more closely than Model B. Otherwise simulations of the fluorescence data are virtually identical. Conceptually, the difference between the two models is that in Model A, the two fast transitions occur in parallel to one another and can be viewed as basically the same conformational change (although the amount of energy required for the fast change between q and Q may vary depending on whether channels are in state r or R). In Model B, each component of the fluorescence (two fast and one slow) is treated as a separate transition and hence a separate conformational change. As a result of these differences in Model A, channels can travel on one of two paths to reach state QR from rest at qr: one path moves through state Qr, and the other through state qR. Upon depolarization, most channels move from qr → Qr → QR, and a small fraction move through state qR; upon hyperpolarization most channels move from QR → qR → qr, and a small fraction move through state Qr. In Model B, channels must traverse both intermediate states X and Y to move between the endpoints, W and Z. Also, Model A requires only two types of voltage-dependent transitions, but Model B requires three.
Gating Currents in HERG
If movement of the S4 region associated with HERG activation gating is indeed slow, then the corresponding gating current should be very slow and small. Perhaps for this reason, we have not observed nonlinear capacitive currents that are convincingly associated with HERG activation gating, either in HEK293 cells or in oocytes. We have observed small, nonlinear capacitive currents resulting from short depolarizing steps (10 ms); however, calculations of the total charge moved (Q) based on these currents shows that Q does not saturate even at depolarizations of +70 mV. This suggests that they are not related to activation gating. They may, however, be related to the fast fluorescence change, which does not saturate until depolarizations of over +110 mV are applied (Fig. 9).
In general, the fluorescence approach used here is advantageous for measuring slow movements of a voltage sensor. Because the fluorescence of a probe is a state function (rather than a change-of-state function, like gating current), it can report on slower conformational changes for which gating current measurements would fail. The disadvantage, of course, is the difficulty in saying definitively that these conformational changes involve charge movement.
Nature of the Physical Changes in the Voltage Sensor
Experiments on Shaker potassium channels have suggested that charge movement (as assayed by gating currents) and conformational changes near the S4 region (as assayed by cysteine modification experiments) occur in more than one step (Baker et al., 1998; Sorensen et al., 2000). Many different physical situations could account for these steps. For instance, one movement could be a translocation of the S4 segment across the membrane, and the other could be a twist or tilt of S4. Several experiments on Shaker suggest that charged residues in the S2 segment also play a role in the voltage dependence of gating (Papazian et al., 1995; Planells-Cases et al., 1995; Seoh et al., 1996); negatively charged residues in S2 may help stabilize the positive charges in S4 within the membrane, or S2 itself could move in response to voltage. It is possible that movement of the S2 segment could account for one (or more) of the conformational changes occurring in the voltage sensor.
Conclusions
Our results show that fluorescence changes measured from residues near the S4 region of HERG have both fast and slow components. These data suggest that both fast and slow conformational changes may occur near the S4 region during HERG gating. The properties of the slow component of the fluorescence strongly correlate with activation gating and provide support for the idea that the unusually slow activation kinetics observed in HERG may be attributed to slow voltage sensor movement. Although we cannot definitely associate the various fluorescence states with gating states of the pore, we can use the data to suggest a framework to describe voltage-dependent HERG gating.
Figure 4.
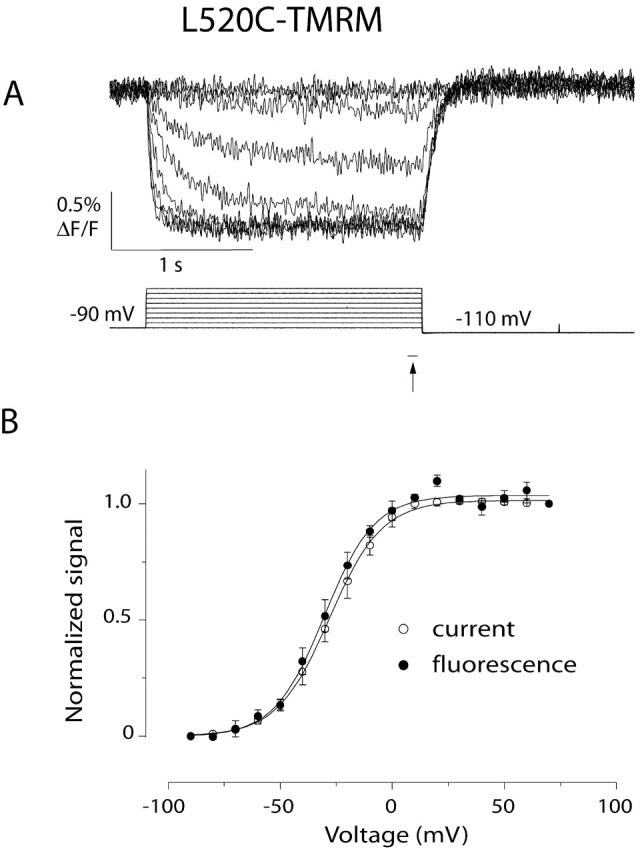
Voltage dependence of the current and the slow fluorescence change reported by L520C-TMRM. (A) Fluorescence changes measured during 2-s voltage steps ranging from −90 to 70 mV. The holding potential is −90 mV; the membrane is hyperpolarized to −110 mV after depolarization. (B) Voltage dependence of the fluorescence at the end of a 2-s voltage pulse (closed circles, indicated by the arrow in A). The F-V curve shown is an average of six normalized F-V curves. Each point in an individual F-V curve represents the average of the last 20 data points during depolarization. The average, normalized g-V relationship measured during the same experiments is plotted for comparison (open circles, n = 6). Each g-V relationship was constructed as described for Table I. Error bars denote the standard error. The curves shown are Boltzmann fits of each dataset (for F-V, Vmid = −30 mV, and zδ = 2.3 e0; for g-V, Vmid = −28 mV, and zδ = 2.2 e0).
Acknowledgments
We thank Brad Rothberg for many useful discussions and for modifying his data analysis programs to fit and simulate fluorescence data. We are grateful to Francisco Bezanilla and Albert Cha for advice on acquiring and evaluating fluorescence data, and to Rod MacKinnon for sharing the HERG Δ2-137 clone with us. We also thank Miguel Holmgren, Donato del Camino, Ki Soon Shin, and Sarah Webster for many useful discussions.
This work was supported by a grant to G. Yellen from the National Institutes of Health (HL57383).
Footnotes
Abbreviations used in this paper: HERG, human ether-à-go-go related gene; TMRM, tetramethylrhodamine maleimide.
In many experiments, fits of the current and the fluorescence reveal that activation is slightly slower than the slow fluorescence and that deactivation is slightly faster than the fluorescence (by up to ∼20%). This discrepancy may be due to a difference in the activation and deactivation kinetics of labeled and unlabeled channels. The fluorescence is reporting changes that occur exclusively in labeled channels, but the current reports the kinetics of both labeled and unlabeled channels. For all three mutants, the g-V relationship of labeled channels is shifted 5–10 mV to the left of the g-V of unlabeled channels, and this slight shift may account for the slight difference between the fluorescence and current kinetics. Over a range of voltages, the steady-state fluorescence-voltage relationship (F-V; Fig. 4, closed circles) and the g-V relationship (Fig. 4, open circles) are nearly identical.
References
- Baker, O.S., H.P. Larsson, L.M. Mannuzzu, and E.Y. Isacoff. 1998. Three transmembrane conformations and sequence-dependent displacement of the S4 domain in Shaker K+ channel gating. Neuron. 20:1283–1294. [DOI] [PubMed] [Google Scholar]
- Cha, A., and F. Bezanilla. 1997. Characterizing voltage-dependent conformational changes in the Shaker K+ channel with fluorescence. Neuron. 19:1127–1140. [DOI] [PubMed] [Google Scholar]
- Cha, A., and F. Bezanilla. 1998. Structural implications of fluorescence quenching in the Shaker K+ channel. J. Gen. Physiol. 112:391–408. [DOI] [PMC free article] [PubMed] [Google Scholar]
- Choi, K.L., R.W. Aldrich, and G. Yellen. 1991. Tetraethylammonium blockade distinguishes two inactivation mechanisms in voltage-activated K+ channels. Proc. Natl. Acad. Sci. USA. 88:5092–5095. [DOI] [PMC free article] [PubMed] [Google Scholar]
- Curran, M.E., I. Splawski, K.W. Timothy, G.M. Vincent, E.D. Green, and M.T. Keating. 1995. A molecular basis for cardiac arrhythmia: HERG mutations cause long QT syndrome. Cell. 80:795–803. [DOI] [PubMed] [Google Scholar]
- Doyle, D.A., J.M. Cabral, R.A. Pfuetzner, A. Kuo, J. Gulbis, S. Cohen, B.T. Chait, and R. MacKinnon. 1998. The structure of the potassium channel: molecular basis of potassium conduction and selectivity. Science. 280:69–77. [DOI] [PubMed] [Google Scholar]
- Hoshi, T., W.N. Zagotta, and R.W. Aldrich. 1991. Two types of inactivation in Shaker K+ channels: Effects of alterations in the carboxy-terminal region. Neuron. 7:547–556. [DOI] [PubMed] [Google Scholar]
- Larsson, H.P., O.S. Baker, D.S. Dhillon, and E.Y. Isacoff. 1996. Transmembrane movement of the Shaker K+ channel S4. Neuron. 16:387–397. [DOI] [PubMed] [Google Scholar]
- Ledwell, J.L., and R.W. Aldrich. 1999. Mutations in the S4 region isolate the final voltage-dependent cooperative step in potassium channel activation. J. Gen. Physiol. 113:389–414. [DOI] [PMC free article] [PubMed] [Google Scholar]
- Liman, E.R., J. Tytgat, and P. Hess. 1992. Subunit stoichiometry of a mammalian K+ channel determined by construction of multimeric cDNAs. Neuron. 9:861–871. [DOI] [PubMed] [Google Scholar]
- Liu, Y., M.E. Jurman, and G. Yellen. 1996. Dynamic rearrangement of the outer mouth of a K+ channel during gating. Neuron. 16:859–867. [DOI] [PubMed] [Google Scholar]
- Loew, L.M., L.B. Cohen, B.M. Salzberg, A.L. Obaid, and F. Bezanilla. 1985. Charge-shift probes of membrane potential. Characterization of aminostyrylpyridinium dyes on the squid giant axon. Biophys. J. 47:71–77. [DOI] [PMC free article] [PubMed] [Google Scholar]
- Loots, E., and E.Y. Isacoff. 1998. Protein rearrangements underlying slow inactivation of the Shaker K+ channel. J. Gen. Physiol. 112:377–389. [DOI] [PMC free article] [PubMed] [Google Scholar]
- Mannuzzu, L.M., and E.Y. Isacoff. 2000. Independence and cooperativity in rearrangements of a potassium channel voltage sensor revealed by single subunit fluorescence. J. Gen. Physiol. 115:257–268. [DOI] [PMC free article] [PubMed] [Google Scholar]
- Mannuzzu, L.M., M.M. Moronne, and E.Y. Isacoff. 1996. Direct physical measure of conformational rearrangement underlying potassium channel gating. Science. 271:213–216. [DOI] [PubMed] [Google Scholar]
- Papazian, D.M., X.M. Shao, S.-A. Seoh, A.F. Mock, Y. Huang, and D.H. Wainstock. 1995. Electrostatic interactions of S4 voltage sensor in Shaker K+ channel. Neuron. 14:1293–1301. [DOI] [PubMed] [Google Scholar]
- Planells-Cases, R., A.V. Ferrer-Montiel, C.D. Patten, and M. Montal. 1995. Mutation of conserved negatively charged residues in the S2 and S3 transmembrane segments of a mammalian K+ channel selectively modulates channel gating. Proc. Natl. Acad. Sci. USA. 92:9422–9426. [DOI] [PMC free article] [PubMed] [Google Scholar]
- Sanguinetti, M.C., and N.K. Jurkiewicz. 1990. Two components of cardiac delayed rectifier K+ current: differential sensitivity to block by class III antiarrhythmic agents. J. Gen. Physiol. 96:195–215. [DOI] [PMC free article] [PubMed] [Google Scholar]
- Sanguinetti, M.C., C. Jiang, M.E. Curran, and M.T. Keating. 1995. A mechanistic link between an inherited and an acquired cardiac arrhythmia: HERG encodes the IKr potassium channel. Cell. 81:299–307. [DOI] [PubMed] [Google Scholar]
- Schönherr, R., and S.H. Heinemann. 1996. Molecular determinants for activation and inactivation of HERG, a human inward rectifier potassium channel. J. Physiol. 493:635–642. [DOI] [PMC free article] [PubMed] [Google Scholar]
- Seoh, S.A., D. Sigg, D.M. Papazian, and F. Bezanilla. 1996. Voltage-sensing residues in the S2 and S4 segments of the Shaker K+ channel. Neuron. 16:1159–1167. [DOI] [PubMed] [Google Scholar]
- Shibasaki, T. 1987. Conductance and kinetics of delayed rectifier potassium channels in nodal cells of the rabbit heart. J. Physiol. 387:227–250. [DOI] [PMC free article] [PubMed] [Google Scholar]
- Smith-Maxwell, C.J., J.L. Ledwell, and R.W. Aldrich. 1998. a. Role of the S4 in cooperativity of voltage-dependent potassium channel activation. J. Gen. Physiol. 111:399–420. [DOI] [PMC free article] [PubMed] [Google Scholar]
- Smith-Maxwell, C.J., J.L. Ledwell, and R.W. Aldrich. 1998. b. Uncharged S4 residues and cooperativity in voltage-dependent potassium channel activation. J. Gen. Physiol. 111:421–439. [DOI] [PMC free article] [PubMed] [Google Scholar]
- Smith, P.L., T. Baukrowitz, and G. Yellen. 1996. The inward rectification mechanism of the HERG cardiac potassium channel. Nature. 379:833–836. [DOI] [PubMed] [Google Scholar]
- Sorensen, J.B., A. Cha, R. Latorre, E. Rosenman, and F. Bezanilla. 2000. Deletion of the S3-S4 linker in the Shaker potassium channel reveals two quenching groups near the outside of S4. J. Gen. Physiol. 115:209–222. [DOI] [PMC free article] [PubMed] [Google Scholar]
- Spector, P.S., M.E. Curran, A.R. Zou, and M.C. Sanguinetti. 1996. Fast inactivation causes rectification of the IKr channel. J. Gen. Physiol. 107:611–619. [DOI] [PMC free article] [PubMed] [Google Scholar]
- Trudeau, M.C., J.W. Warmke, B. Ganetzky, and G.A. Robertson. 1995. HERG, a human inward rectifier in the voltage-gated potassium channel family. Science. 269:92–95. [DOI] [PubMed] [Google Scholar]
- Wang, J., M.C. Trudeau, A.M. Zappia, and G.A. Robertson. 1998. Regulation of deactivation by an amino terminal domain in human ether-a-go-go-related gene potassium channels. J. Gen. Physiol. 112:637–647. [DOI] [PMC free article] [PubMed] [Google Scholar]
- Yellen, G., D. Sodickson, T.-Y. Chen, and M.E. Jurman. 1994. An engineered cysteine in the external mouth of a K+ channel allows inactivation to be modulated by metal binding. Biophys. J. 66:1068–1075. [DOI] [PMC free article] [PubMed] [Google Scholar]
- Zagotta, W.N., T. Hoshi, and R.W. Aldrich. 1994. Shaker potassium channel gating. III: Evaluation of kinetic models for activation. J. Gen. Physiol. 103:321–362. [DOI] [PMC free article] [PubMed] [Google Scholar]