

Abstract
The dihydropyridine receptor (DHPR), normally a voltage-dependent calcium channel, functions in skeletal muscle essentially as a voltage sensor, triggering intracellular calcium release for excitation-contraction coupling. In addition to this fast calcium release, via ryanodine receptor (RYR) channels, depolarization of skeletal myotubes evokes slow calcium waves, unrelated to contraction, that involve the cell nucleus (Jaimovich, E., R. Reyes, J.L. Liberona, and J.A. Powell. 2000. Am. J. Physiol. Cell Physiol. 278:C998–C1010). We tested the hypothesis that DHPR may also be the voltage sensor for these slow calcium signals. In cultures of primary rat myotubes, 10 μM nifedipine (a DHPR inhibitor) completely blocked the slow calcium (fluo-3-fluorescence) transient after 47 mM K+ depolarization and only partially reduced the fast Ca2+ signal. Dysgenic myotubes from the GLT cell line, which do not express the α1 subunit of the DHPR, did not show either type of calcium transient following depolarization. After transfection of the α1 DNA into the GLT cells, K+ depolarization induced slow calcium transients that were similar to those present in normal C2C12 and normal NLT cell lines. Slow calcium transients in transfected cells were blocked by nifedipine as well as by the G protein inhibitor, pertussis toxin, but not by ryanodine, the RYR inhibitor. Since slow Ca2+ transients appear to be mediated by IP3, we measured the increase of IP3 mass after K+ depolarization. The IP3 transient seen in control cells was inhibited by nifedipine and was absent in nontransfected dysgenic cells, but α1-transfected cells recovered the depolarization-induced IP3 transient. In normal myotubes, 10 μM nifedipine, but not ryanodine, inhibited c-jun and c-fos mRNA increase after K+ depolarization. These results suggest a role for DHPR-mediated calcium signals in regulation of early gene expression. A model of excitation-transcription coupling is presented in which both G proteins and IP3 appear as important downstream mediators after sensing of depolarization by DHPR.
Keywords: dysgenic cells, gene expression, calcium waves, inositol trisphosphate, excitation transcription
INTRODUCTION
Among subcellular and molecular elements that play a key role in the excitation-contraction (E-C)* coupling process in skeletal muscle, the dihydropyridine receptor (DHPR) has a unique function. A Ca2+ L-Type channel, present in a variety of tissues (Triggle and Janis, 1987; Melzer et al., 1995), this molecule functions as a voltage sensor as well as a Ca2+ conducting channel, the former function being essential to E-C coupling (Rios and Brum, 1987; Tanabe et al., 1988; for review see Dolphin, 1999). The DHPR was the first L-type Ca2+ channel to be purified (Takahashi et al., 1987), taking advantage of its high concentration on the T tubules (Fosset et al., 1983). This receptor is composed of several subunits that include the dihydropyridine receptor α1 subunit, which is the main pore forming subunit (Dolphin, 1999), the α2 glycosylated subunit, the δ subunit (linked by a disulfide bond with an α2 subunit), and the β and the γ subunits (Dolphin, 1999).
High [K+]o triggers a transient increase in tension in skeletal muscle (Hodgkin and Horowicz, 1960) and probably reflects the physiological excitation contraction-coupling of skeletal muscle. Ca2+ transients, evoked in rat myotubes after the rise in [K+]o, can be analyzed in terms of two kinetically different components, a fast and a slow component (Jaimovich and Rojas, 1994; Jaimovich et al., 2000). In terms of nifedipine (a classical L-type calcium channel inhibitor) sensitivity, the fast component appears partly nifedipine insensitive, and the slow component appears nifedipine-sensitive (Jaimovich and Rojas, 1994). One of the models that emerged from these results is that the fast Ca2+ component, less sensitive to nifedipine, could account for the [Ca2+]i fast rise involved in the E-C coupling process, whereas the slow one appears to be mediated by inositol 1,4,5-trisphospate (IP3) receptors and could be relevant to the rise in nucleoplasmic Ca2+, which is probably involved in gene transcription (Jaimovich et al., 2000; Estrada et al., 2001; Powell et al., 2001).
Based on the evidence mentioned above, we postulate that the α1 subunit of the DHPR is needed for the generation of the slow [Ca2+]i component after a depolarization evoked by high potassium in skeletal myotubes. To test our hypothesis, we evaluated the effect of both nifedipine and blockers of intracellular signals on both the fast and slow Ca2+ components evoked by the depolarization stimulus of primary skeletal muscle cells, NLT cells (from normal mice), C2C12 cells, and GLT (dysgenic cell line lacking the α1 subunit of the DHPR) as well as GLT α1 subunit–transfected cells. Dysgenic muscle lacks E-C coupling (Powell, 1990) as a result of a mutated and thus nonfunctional α1 subunit (Tanabe et al., 1988). We also tested the capability of potassium depolarization to induce a transient increase of IP3 mass in dysgenic cell lines. Finally, the effect of nifedipine on early gene expression in primary myotubes was also tested.
Results suggest that after a depolarizing stimulus in skeletal muscle cells, the α1 subunit of the DHPR is responsible for the generation of the IP3 mass transient, the slow Ca2+ increase (most probably through a G protein), and for the increase in transcription of both the c-jun and c-fos gene.
MATERIALS AND METHODS
Primary Cell Cultures
Primary cultures of rat skeletal muscle cells were prepared according to protocols established previously (Jaimovich and Rojas, 1994). Briefly, neonatal muscle tissue from hind limbs was dissected, minced, and treated with collagenase for 15 min at 37°C. The suspension was filtered through lens tissue paper followed by a 41-μm pore diameter nytex filter and then spun down at low speed. Cells were plated on round (1 cm in diameter) gelatin-coated glass coverslips in dishes at a density of 3.5 × 10⁵ cells per 35-mm culture dish. Culture medium was F12:DMEM plus 10% bovine serum and 2.5% FBS, 100 U/ml penicillin, and 10 μg/ml streptomycin (growth medium, GM). To arrest fibroblast growth, cytosine arabinoside (5 μM) was added for 24 h 2 d after plating. At day 4, cultures were treated with primary culture differentiation medium [F12:DMEM (1:1) plus 1.5% FBS and 10% bovine serum]. Culture medium was then changed every 3 d. F12:DMEM medium, bovine serum, and FBS were from GIBCO BRL. Cytosine arabinoside, penicillin, and streptomycin were from Sigma-Aldrich.
Cell Lines and Transfection
We used the mutant mouse cell line GLT (muscular dysGenic, mdg/mdg, line transfected with the Large T antigen), and the wild-type cell line NLT, prepared from dysgenic and normal cultures, respectively (Powell et al., 1996). The α1 DNA (named pJCAC6) used for the transfections was constructed from the α1 plasmid pCAC6 (a generous gift of T. Tanabe, National Institute for Physiological Sciences, Okazaki, Japan), incorporated into the vector pJB20, which was recovered from a plasmid pCMVtsTAg (provided by L. Roman, Johns Hopkins University). Cells were allowed to grow to 50–80% confluency in the presence of GM. Once the cells had reached appropriate confluence, the medium was changed to a differentiation medium DM (F12:DMEM, 2% horse serum) to induce cell differentiation and fusion to yield multinucleated myotubes. GLT cells were transfected using a modification of the Ca2+ phosphate method (Graham and Van der Eb, 1973). Briefly, the cells were allowed to grow to 50–80% confluence and then were incubated with the transfection solution containing 5 mg/ml of the plasmid pJCAC6 with the α1S (skeletal) subunit incorporated previously. When we refer to the α1 subunit, we always mean the α1S subunit since that is the isoform present in skeletal muscle. As a control, we also used the pJB20 plasmid without the α1 subunit (that we called pJB20+NEO) containing the genes for the ampicilin and neomycin resistance. DNA solutions contained a final concentration of 10 mg DNA/ml, 125 nM CaCl2, 140 mM NaCl, 0.75 mM sodium phosphate, and 20 mM PIPES, pH 6.95. The DNA solution was added drop by drop to the cell cultures and the cells were maintained in the transfection solution for 24 h. Later, the cells were washed and incubated for 24 h in GM, containing 100–200 mg/ml of neomycin (Calbiochem-Novabiochem Corp.) for transfected cell selection. Colonies of growing cells were isolated and a permanently transfected new cell line was obtained.
Immunocytochemistry and Western Blot Analysis
GLT, GLT pJCAC6+α1, and GLT pB20+NEO transfected cells were washed and then fixed with 100% methanol at -20°C for 20 min and later treated with a blocking solution of 1% bovine serum albumin in PBS for 0.5 h. The cells were incubated with the primary monoclonal antibody, anti-α1 DHPR (at 1:200 and 1:100) (Chemicon) overnight at 4°C. We bound the cells with the secondary antibody, TRITC conjugated goat anti-mouse (1:200) for 2 h at room temperature. Cells were mounted and observed in a confocal microscope (Carl Zeiss MicroImaging, Inc. 135-M LSM Microsystems, UACI, Facultad de Medicina, Universidad de Chile, Santiago, Chile). The images reproduced herein were manipulated in Adobe Photoshop™ to improve clarity; no data were added or deleted by those adjustments.
For Western blots, cells were incubated in 60-mm dishes under differentiating conditions. Cells were solubilized at 4°C in 0.1 ml of lysis buffer containing 50 mM Tris-HCl pH 7.4, 150 mM NaCl, 1 mM EDTA, 1% NP-40, 5 mM Na3VO4, 20 mM NaF, 0.2 mM AEBSF, 1 mM benzamidine, 10 μg/ml leupeptin, 1 μg/ml aprotinin, and 1 μM pepstatin. After incubation on ice for 20 min, cells were scraped from the dishes, sonicated for 1 min and left on ice for 30 min. Nuclear and cellular debris was removed by microcentrifugation at 17,000 g for 20 min. The protein concentration of the supernatants was determined by using BSA as the standard. Aliquots of lysates were suspended in Laemmli buffer; proteins were resolved in 10% SDS-polyacrilamide gels and transferred to nitrocellulose membranes. Primary antibody incubations of anti-α1 DHPR (1:200) and anti-β tubulin (1:200, to control for loading), were performed at 4°C overnight. After incubation with HRP-conjugated secondary antibodies (1:200) for 1.5 h, membranes were developed by enhanced chemiluminescence.
Intracellular Calcium and Digital Image Processing
For intracellular calcium measurements at the single cell level, the myoblasts were cultured on glass coverslips to 80% confluence and then differentiated into myotubes. Calcium images were obtained from myotubes that had been previously loaded with the calcium sensitive fluorescent dye fluo-3-acetoximethylester (fluo-3 a.m.; Molecular Probes, Eugene) using an inverted confocal microscope (Carl Zeiss MicroImaging, Inc., Axiovert 135 M-LSM Microsystems). Alternatively, we observed calcium transients with an epifluorescence microscope (Olympus T041) coupled to a CCD cooled camera and a computer with acquisition and image processing software (Spectra Source MCD600 and Windbl, respectively).
Myotubes were washed three times with Krebs buffer (145 mM NaCl, 5 mM KCl, 2.6 mM CaCl2, 1 mM MgCl2, 10 mM HEPES-Na, 5.6 mM glucose, pH 7.4) to remove serum, and loaded with 5.4 μM fluo-3 (coming from a stock in pluronic acid-DMSO 20%) for 30 min at room temperature. After loading, myotubes were washed and used within 2 h. The coverslips were mounted in a 1 ml capacity chamber and placed on the microscope for fluorescence measurements. After excitation with a 488-nm wavelength argon laser beam or filter system, the fluorescence images were collected every 0.4–2.0 s and analyzed frame by frame with the data acquisition program of the equipment. A PlanApo 60× (NA 1.4) objective lens was used. In most of the acquisitions, the image dimension was 512 × 120 pixels. Intracellular calcium was expressed as a percentage of fluorescence intensity relative to basal fluorescence (a value stable for at least 5 min in resting conditions). The increase in fluorescence intensity of fluo-3 is proportional to the rise in intracellular calcium level (Minta et al., 1989).
Elimination of out-of-focus fluorescence was performed using both the “no-neighbors” deconvolution algorithm and Castleman's PSF (point spread function) theoretical model as described previously (Estrada et al., 2000). To quantify fluorescence, the summed pixel intensity was calculated on the area delimited by a contour (for “adaptive contour” method, see Estrada et al., 2000). To avoid the possible interference by either cell movement or changes in the cell volume, the area of the fluorescent cell was determined by image analysis algorithms and then a binary mask was created. This was compared with the bright-field image (Estrada et al., 2000).
Measurements of IP3 Mass Changes in Response to High External Potassium
Myotubes were rinsed and preincubated at room temperature for 20 min in a “resting solution” of the following composition (in mM): 58 NaCl, 4.7 KCl, 3 CaCl2, 1.2 MgSO4, 0.5 EDTA, 60 LiCl, 10 glucose, and 20 HEPES, pH 7.4. Next, the cells were stimulated by replacing this solution with 47 mM potassium solution (substituting K+ for Na+). The reaction was stopped, at the times indicated (see Figs. 2 and 7), by rapid aspiration of the stimulating solution, addition of 0.8 M ice-cold perchloric acid, and freezing with liquid nitrogen. Samples were allowed to thaw and cell debris was spun down for protein determination (Hartree, 1972). The supernatant was neutralized with a solution of 2 M KOH, 0.1 M 2-[N-morpholinoethanesulfonic] acid, and 15 mM ethylenediaminetetraacetic acid (EDTA). The neutralized extracts were kept frozen until required for IP3 determination. IP3 mass measurements were performed by radio-receptor assay (Liberona et al., 1998). Briefly, a crude rat cerebellum membrane preparation was obtained after homogenization in 50 mM Tris-HCl pH 7.7, 1 mM EDTA, 2 mM β-mercaptoethanol, and centrifugation at 20,000 g for 15 min. This procedure was repeated three times, and the final pellet was suspended in the same solution plus 0.3 M sucrose and then frozen at −80°C until use. The membrane preparation was calibrated for IP3 binding with 1.6 nM 3H-IP3 (D-[2-3H]-myo-inositol 1,4,5-trisphosphate), specific activity 21.0 Ci/mmol (DuPont, NEN, MA) and 2–120 nM cold IP3 (Sigma-Aldrich); the sample analysis was performed in a similar way but an aliquot of the neutralized supernatant was added instead of cold IP3. 3H-IP3 radioactivity remaining bound to the cerebellar membranes was measured in a Beckman LS-6000TA liquid scintillation spectrometer (Beckman Instruments Corp.).
Figure 2.

Effect of extracellular calcium, G protein, and calcium intracellular stores on the depolarization-evoked calcium signals in primary muscle cultures. (A) Relative fluorescence variation in an ROI after depolarization of a cell incubated in an external medium with no added calcium and 0.5 mM EGTA. Both fast and slow calcium signals are similar to control signals in normal calcium (see text for statistical analysis). (B) Time course of relative fluorescence after potassium depolarization in a cell previously incubated with 1 μg/ml pertussis toxin. Under this condition, an absence of a slow calcium transient was observed. Note that in most cases (e.g., Fig. 1 C, and Fig. 2 A) Ca2+ levels do not return completely to basal levels after the end of the slow transient peak. (C) Series of relative fluorescence analysis in independent cells after the addition of ryanodine (20 μM); after potassium depolarization in cells pretreated for 15–30 min with ryanodine (20 μM); or nifedipine (10 μM) plus ryanodine (20 μM) and after thapsigargin addition in ryanodine- plus nifedipine-treated cells.
Figure 7.
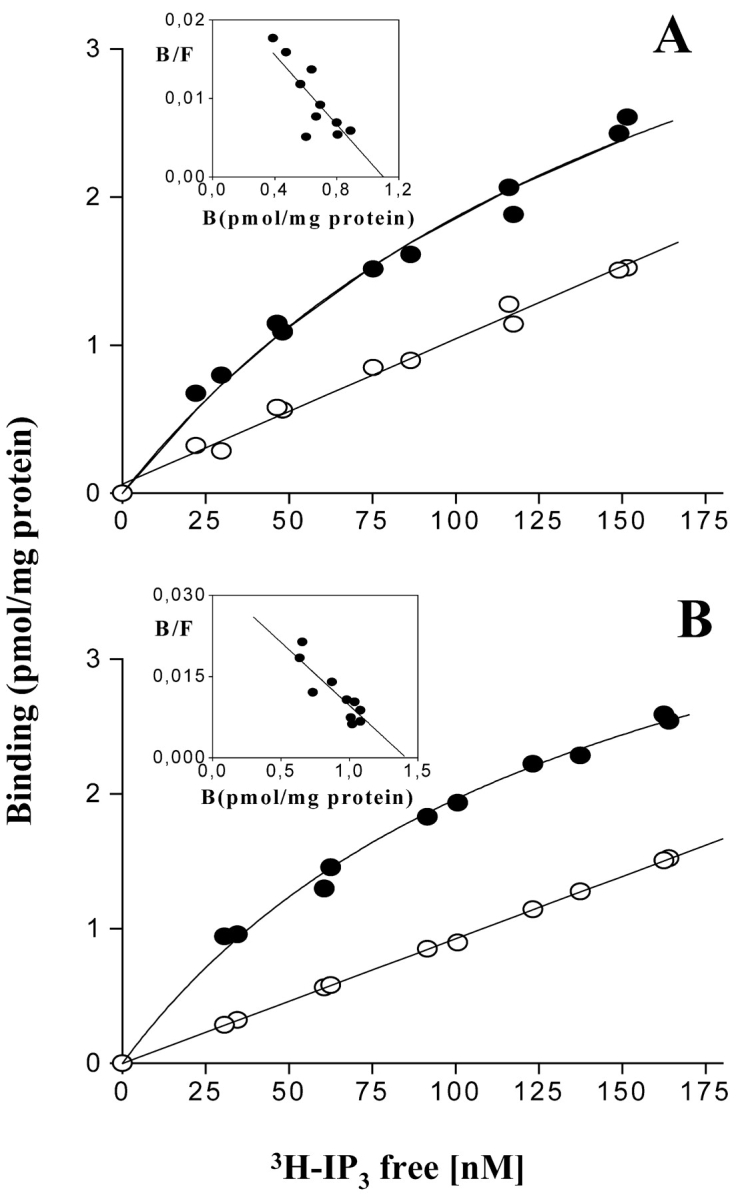
Binding at equilibrium of 3H-IP3 to control and dysgenic cell homogenates. Confluent plates from (A) control cells and (B) dysgenic cells were washed three times with PBS, homogenized, and incubated in the presence of 3H-IP3 (10–200 nM) for 30–40 min. Total binding (filled circles) and nonspecific binding in the presence of 2 μM of IP3 (open circles) are indicated. Each experimental point represents the mean of three independent measurements. The Eadie-Scatchard analysis (inset) describes a single family of receptors in both cases with K d = 41.02 ± 9.90 nM and Bmax = 1.10 ± 0.12 pmol/mg protein for control cells and K d = 41.12 ± 12.03 nM, Bmax = 1.42 ± 0.15 pmol/mg protein for dysgenic cells.
Binding of 3H-IP3
The radioligand binding assay for 3H-IP3 was as described by Liberona et al. (1998). Briefly, homogenized fractions from confluent plates of control and dysgenic mouse cell lines, 5–7 d after withdrawal of serum, were washed three times with PBS and homogenized with a Dounce homogenizer. They were then incubated in a medium that contained 50 mM Tris-HCl pH 8.4, 1 mM EDTA, 1 mM 2-mercaptoethanol, and different concentrations (10–200 nM) of 3H-IP3 800–1000 cpm/pmol, at 4°C for 30 min. After incubation each reaction was stopped by centrifugation at 10,000 g for 10 min (Heraus Biofuge 15R). The supernatant was aspirated, and the pellets were washed with PBS and dissolved in NaOH (1 M) to measure radioactivity. Nonspecific binding was determined in the presence of 2 μM IP3 (Sigma-Aldrich).
Northern Blot Analysis
Total cellular RNA was isolated by the guanidinium isothiocyanate method (Chomczynski and Sacchi, 1987). Samples (15–20 μg) were electrophoresed on 1% agarose-formaldehyde gels, transferred by capillary blotting onto nylon membranes and immobilized by photocrosslinking. Blots were prehybridized for 1 h at 42°C in a buffer containing 50% deionized formamide, SSPE 5× SDS 1% and salmon sperm DNA, 125 μg/ml. Hybridizations with 108 cpm/ml 32P-labeled cDNA probes were performed at 42°C overnight in the same solution. The membranes were washed once with SSPE 2×/SDS 0.1% solution for 5 min, once with SSPE 0.2 X/SDS 0.1% for 5 min and twice with SSPE 0.1×/SDS 0.1% at 68°C for 15 min before being exposed to an autoradiographic film. After autoradiography, bands were quantified by densitometry using an NIH IMAGE program. Ethidium bromide stains of gels before transfer and reprobing of blots with a glyceraldehyde 3-phosphate dehydrogenase (GAPDH) probe, confirmed the integrity of the RNA samples and documented equivalent loading of each lane in gels used for the analysis.
cDNA probes, rat c-fos cDNA, 2.1 K bp, subcloned into EcoRI sites of pSP65 and rat c-jun cDNA, 1.8 K bp, subcloned into the EcoRI site of p-Gem-4 (a gift from Dr. Tom Curran, Children's Research Hospital), were propagated in electrocompetent E. coli DH 5 α cells. Purified plasmids were digested with EcoRI and the products were labeled with (α32P)-dATP by the random primer Klenow enzyme method.
Semiquantitative RT-PCR
cDNA was amplified using c-fos or c-jun primers and the DNA concentration was normalized to GAPDH expression. PCR amplification was maintained in the exponential phase for each product. c-fos primers: 5′-AGGCCGACTCCTTCTCCAGCAT-3′ (sense), 5′-CAGATAGCTGCTCTACTTTGC-3′ (antisense), corresponding to bases 235–533; c-jun primers: 5′-GCGCCGCCGGAGAACCTCTGTC-3′(sense), 5′-CAGCTCCGGCGACGCCAGCTTG-3′ (antisense), corresponding to bases 577–1227 (Hamaya et al., 2000).
RESULTS
Effect of Nifedipine on the Depolarization-evoked Calcium Waves in Primary Culture Skeletal Muscle Cells
As described previously (Jaimovich et al., 2000), high potassium depolarization evoked both a fast and a slow calcium rise in primary rat myotubes loaded with fluo-3 a.m. (the fast one starting immediately after solution change and lasting up to 2 s and the slow one starting 3–4 s after depolarization and lasting >10 s, (Fig. 1, A and C) . Fig. 1, A and C, show a typical effect of high potassium solution (47 mM K+) on intracellular calcium in primary myotubes; the effect consists of a fast increase of fluo-3 fluorescence in the entire cell, followed by a slow transient. The slow calcium wave has an important component in the nuclear region and, in the example shown, it spreads along the myotubes (Fig. 1 A). This response has been described in rat (Jaimovich and Rojas, 1994; Jaimovich et al., 2000) and mouse (Powell et al., 2001) skeletal muscle cells. On the other hand, in the presence of 10 μM of the DHPR calcium channel blocker nifedipine, added 15–60 min before depolarization, we observed that the evoked calcium wave has only a fast component (Fig. 1, B and D), reduced in amplitude, but with the same kinetics as those observed in control cells (Fig. 1 A). The reduced fast transient as that illustrated in Fig. 1 A was seen in 35% of cells; no signal at all was seen in the rest of cells tested. In contrast, we did not observe the slow calcium wave in any of the experiments done (n = 17) under these conditions. Shorter (2–5 min) incubation times with nifedipine resulted in partial inhibition and delayed onset of the slow Ca2+ signal (unpublished data). The analysis of a selected region of interest (ROI) in the sequence of images obtained after the depolarizing stimulus clearly shows a reduced fast calcium signal and the complete absence of the slow depolarization–evoked calcium wave in the presence of nifedipine added previously (Fig. 1 D). To minimize Ca2+ entry into myotubes through voltage-sensitive channels as well as through store-operated channels (Ma et al., 2000), experiments were performed in cells incubated for a short period (<2 min) in an external solution in which Ca2+ was replaced by magnesium and 0.5 mM EGTA was added. Under these conditions, the calcium concentration of the medium measured with calcium electrodes is <10−7 M. In 14 independent experiments, each of the calcium transients was clearly visible (e.g., Fig. 2 A) and, although the delay shown here was especially large, the spatial and temporal pattern of those signals was similar to those obtained in normal external calcium (Fig. 1 C). The delay period for the onset of the slow calcium signal was 4.4 ± 1.6 s and the time to peak was 11.9 ± 3.6 s (n = 11) in conditions of normal external calcium. These values did not differ significantly from those obtained under calcium-free conditions (5.3 ± 2.5 s and 12.6 ± 3.3 s, respectively, n = 7). We can conclude, then, that under normal conditions, calcium entry contributes little or nothing to the slow calcium transients. To test the possible involvement of a G protein in this signal, we tested the effect of pertussis toxin on depolarization-induced calcium transients; incubation of myotubes with 1 μg/ml pertussis toxin, also completely blocked the slow calcium transient, leaving the fast transient intact (Fig. 2 B) in nine out of nine experiments. It is interesting to note that in most cases (e.g., Fig. 1, C and D, and Fig. 2 E), Ca2+ levels do not return completely to basal levels after the end of the slow transient peak.
Figure 1.
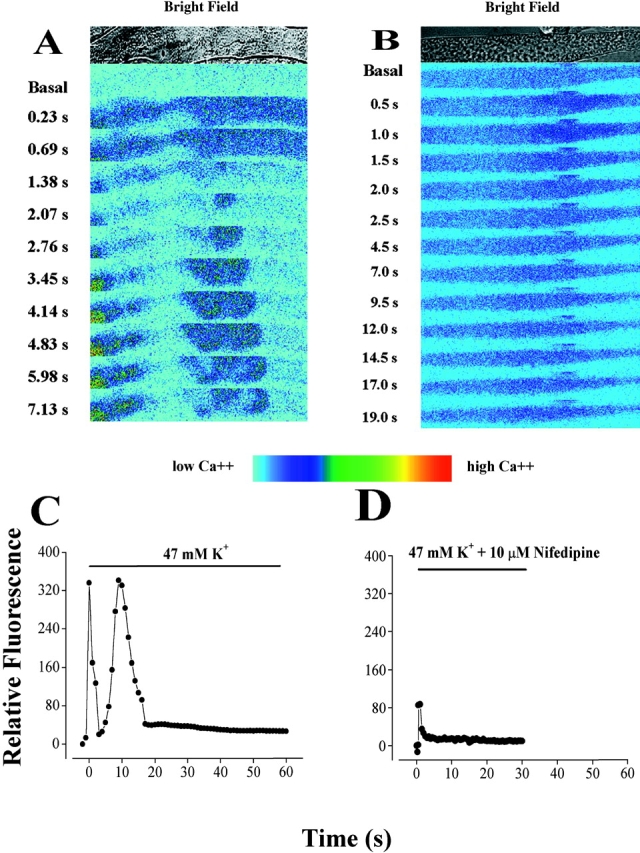
Effect of nifedipine on the depolarization-evoked calcium signals in primary muscle cultures. (A) Transmitted light image (top) and series of fluo-3 fluorescence images during a depolarization in primary cultured myotubes with a high potassium solution (47 mM) at the times indicated. In all experiments, the depolarization evoked a fast calcium transient (0.23–1.38 s), in this case, followed by a slow calcium transient (starting at 2.07 s). Note the brightly filled circle at the left of the frames (3.45–7.13 s) that most likely represents the calcium increase in a nucleus. Bar, 20 μm. (B) Transmitted light image (top) and series of fluo-3 fluorescence images during a depolarization with a high potassium (47 mM) solution at the times indicated in a myotube previously treated (20 min) with the Ca2+ channel blocker, nifedipine (10 μM), in the presence of 5 mM EGTA. The depolarization evoked a reduced fast calcium signal (0.5–1.5 s) whose time course was similar to what we observed in control myotubes. However, we did not observe the slow calcium signals in any of the 17 independent experiments done. Bar, 20 μm. (C) Relative fluorescence variation in a region of interest (ROI) during a depolarization stimulus shows both fast and slow calcium signals as found in 85% of the experiments analyzed. These data are taken from traces of a myotube, different from, but under the same conditions as, the one shown in A. (D) Relative fluorescence variation in a region of interest (ROI) during the depolarization evoked stimulus in a myotube previously (20 min) treated with 10 μM nifedipine. These data are taken from the images shown in B. No slow calcium transient was evident, whether the selected ROI was nuclear or cytosolic. Significantly, however, a reduced fast calcium signal (as shown) was observed in 35% of the experiments analyzed.
To determine whether the slow calcium is or is not a consequence of the first response we preincubated myotubes for 15–30 min with high concentrations (20 μM) of ryanodine. Under these conditions the fast calcium transient was completely inhibited, leaving a slow calcium transient with altered kinetics after potassium-induced depolarization in a free calcium external solution (Fig. 2 C and Jaimovich et al., 2000), indicating that the slow calcium transient is not a consequence of the first calcium fast response; under the latter conditions, nifedipine also blocked the slow transient (n = 11) and no signal was elicited (Fig. 2 C). In cells treated under the latter condition, i.e., pretreatment with ryanodine plus nifedipine, the addition of thapsigargin generates an intracellular calcium increase (Fig. 2 C), demonstrating that calcium could still be released from intracellular pools after ryanodine treatment. This evidence rules out a role for the fast calcium transient in the onset of the nifedipine-sensitive slow wave.
Both Nifedipine and Pertussis Toxin Inhibit the K+-induced IP3 Increase
As shown previously (Jaimovich et al., 2000), slow calcium transients appear as a consequence of a depolarization-induced increase in the mass of IP3. The effect of 47 mM potassium depolarization on the IP3 levels in primary rat myotubes at different times is depicted in Fig. 3 . Potassium induced a 4–5-fold transient increase in the IP3 mass (Fig. 3 B, filled circles); this increase was initially fast (Jaimovich et al., 2000) with an early (<5 s) rise and a later component that reached a maximum 20–30 s after stimulation in normal myotubes; the increase was followed by a slow decrease and after 180 s, little or no difference was detected when IP3 mass was compared with the nonstimulated control condition. A similar result was obtained when the experiment was performed in the absence of extracellular calcium (Fig. 3 A). In this case, as measurements were made at time intervals as short as 2 s, a biphasic rise in the mass of IP3 appears evident, as has been described in normal calcium conditions (Jaimovich et al., 2000). After an initial fast increase up to 2 s, IP3 concentration drops significantly (P < 0.004, n = 4) at 5 s then increases again significantly after 10 s (P < 0.0002, n = 4).
Figure 3.
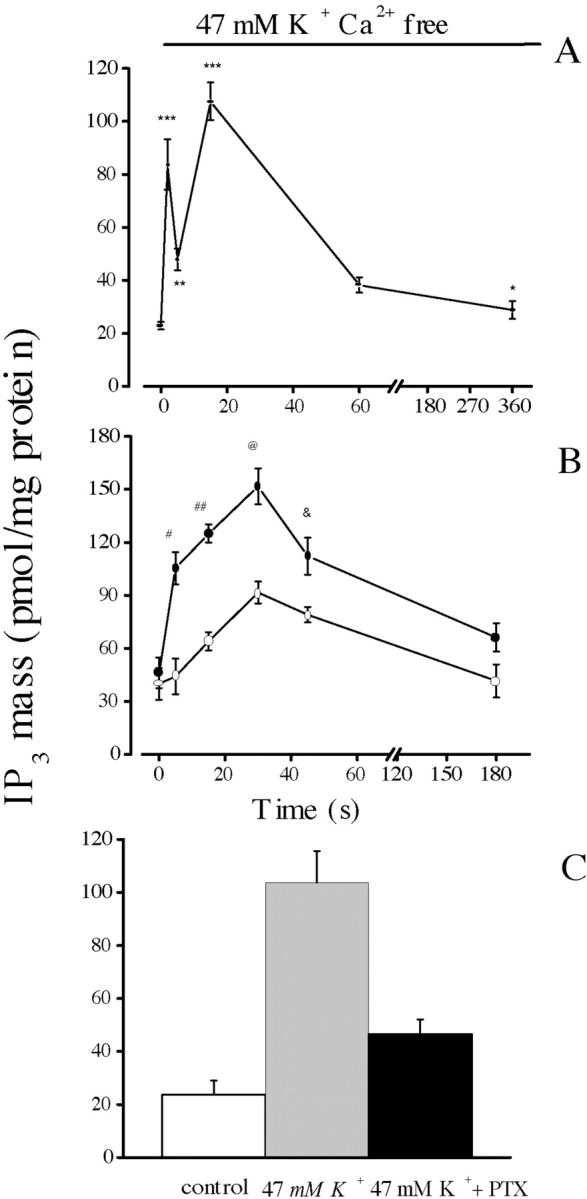
Effect of nifedipine on IP3 mass changes following K+ depolarization in primary muscle cultures. Confluent plates of myotubes were washed three times with PBS and incubated during the times indicated with 47 mM K+, both in the presence (B and C) and in the absence (A) of extracellular calcium. The mass of IP3 in the extract was measured by radioreceptor assay. (A) Time course for the increase in the mass of IP3 in the absence of external calcium. The biphasic nature (an early fast and a later slower component) of the increase is clearer here than in B because measurements were made at shorter time intervals (2.0 s) during the onset of the transient. Values were expressed as the mean ± SD of at least three different samples from the same experiment. Paired t-tests were performed (**, P < 0.0006 [n = 4]; ***, P < 0.0004 [n = 4]) comparing each point with value at t = 0. (B) Samples incubated in the absence (filled circles) or in the presence (open circles) of 10 μM nifedipine. Note the slow kinetics of the transient increase in IP3 mass in the presence of nifedipine. Values were expressed as the mean ± SD of at least three different samples from a single experiment done in duplicate, for control and in the presence of nifedipine. Thus, these two curves can be directly compared. Paired t tests, comparing each point were performed (#, P < 0.0002 [n = 4] at t = 5 s; ##, P < 0.0001 [n = 4] at t = 15 s; @, P < 0.0005 [n = 3] at t = 30 s; &, P < 0.0047 [n = 3] at t = 45 s). (C) Mean values for control and depolarized cells after 15 s of high potassium exposure both in the absence and in the presence of 10 μM pertussis toxin. Error bars represent SD.
In cells previously incubated with 10 μM nifedipine, there is no depolarization-evoked IP3 mass increase at 5 s (Fig. 3 B, open circles; compare with the control, filled circles). Kinetically, the fast rise in IP3 mass that occurs over the first 5 s appears completely inhibited. At later times, IP3 mass slowly increases, remaining significantly lower than in untreated cells up to 50 s. The later increase suggests the presence of a second component, less sensitive to the drug. The effect of pertussis toxin was studied after 15 min of K+ depolarization; the increase in the mass of IP3 induced by this treatment was clearly inhibited in cells previously incubated with PTX (Fig. 3 C). Relative inhibition (75%) was similar to that obtained with nifedipine (Fig. 2 B).
Immunodetection of the α1s Subunit in the GLT-α1–transfected Cells
To better evaluate the role of DHPR in this signal pathway, we transfected dysgenic GLT cells that do not express the α1 subunit of the DHPR (Powell et al., 1996) with the α1 subunit–containing construct. To evaluate the presence and location of the α1-transfected skeletal subunit in fixed and permeabilized GLT cells, we used a monoclonal antibody against the α1 subunit (Fig. 4) . The results clearly show the presence of this subunit in GLT-α1–transfected cells (Fig. 4, A and B). In these cells DHPRs are found in a punctate pattern, probably representing clusters located at peripheral couplings and perhaps some in early T-tubules, as well as in a diffuse pattern representing the untargeted molecules in the cytosol (Fig. 4, A and B), as has been reported elsewhere using the same antibody (Flucher et al., 2000). DHPRs are located at the T-tubule membrane at triads in both adult skeletal muscle (Jorgensen et al., 1989) and in developing myotubes (Flucher et al., 1990). Peripheral couplings (surface membrane–SR cisternae), however, are more common in young cells and cultured cell line myotubes (unpublished data and Felder et al., 2002) such as the cells shown here. The series of confocal sections (Fig. 4 B) shows an uneven and diffuse distribution in the cytosol. There was no α1-positive reactivity in untransfected GLT cells or in cells transfected with the pJCAC6+NEO plasmid (Fig. 4, C and D). These results were confirmed by Western blot analysis of cell homogenates (Fig. 4 E, representative of seven independent experiments). DHPR was completely absent in GLT cells, whereas it was clearly evident in both NLT normal cells and in GLT-α1–transfected cells. β-tubulin was used as a marker for protein loading, the amount loaded for both GLT- and GLT-α1–transfected cells was 10-fold that for NLT cells. This result suggests that although transfection was successful, transfected cells express less α1 subunit than normal cells.
Figure 4.

Immuno-detection of the α1 skeletal subunit of the DHPR in GLT-α1–transfected cells. Cells were fixed and incubated with an anti-α1 subunit of DHPR antibody (see materials and methods) and a rhodamine-conjugated secondary antibody. GLT-α1–transfected (A and B) cells are shown as both a projected reconstruction (A, Bar = 25 μm) or a series of confocal sections (B, Bar = 20 μm). The pattern of distribution of this subunit is punctate, especially near the surface (in A, small white dots and in B, at levels of 3.5, 4.0, and 4.5 μm) that most likely represent peripheral couplings. Some staining is found diffusely within the cytosol. Untransfected (C, Bar = 30 μm) and mock-transfected GLT cells (GLT-NEO) (D, Bar = 30 μm) were also evaluated for the presence and location of the α1 subunit of the DHPR. No reactivity above background was observed in either the untransfected or mock-transfected cells (C and D). The brightest optical sections were chosen from each sample. E. Western blots for the anti-α1 subunit of DHPR (top) in cell homogenates of GLT-α1–transfected cells, untransfected GLTs, and control NLT cells. The bottom panel shows immunoreactivity for anti–β-tubulin, a marker for protein loading. Note that the amount of protein loaded for NLT cells is one tenth of the amount needed for a similar reactivity for GLT-α1–transfected cells.
Calcium Transients in the Dysgenic Cell Lines GLT and in the GLT-α1(Skeletal) Subunit–transfected Cells
We evaluated the possible presence of depolarization-evoked calcium signals in GLT cells, incubated in the absence of extra cellular calcium, loaded with fluo-3 a.m., and detected neither a fast nor a slow calcium wave (Fig. 5 A) under conditions similar to those of Fig. 1. To evaluate the effect of the α1 subunit of the dihydropyridine receptor on the slow, depolarization-evoked, calcium wave, we tested the effect of potassium depolarization in transfected GLT cells. In GLT cells transfected with the pJCAC6+α1 plasmid and placed in a calcium-free solution (0.5 mM EGTA), depolarization evoked a slow transient rise in intracellular calcium (Figs. 5 B and 4 D). No initial, fast calcium transient was evident in these cells. GLT cells transfected with a plasmid without the α1 subunit (pJB20+NEO) show no intracellular calcium rise after K+ depolarization (Fig. 5 C). For comparison, a calcium transient evoked by potassium depolarization in normal NLT cells is also shown (Fig. 5 E). Although some NLT cells display a fast calcium transient (unpublished data), in many of them the fast component was not evident (Fig. 5 E). It is interesting to note that in those cells that do not exhibit a fast transient, the slow calcium transient was slower than that of primary culture.
Figure 5.

Depolarization-evoked calcium signals in GLT and GLT-α1 subunit–transfected cell lines. (A) Series of fluo-3 fluorescence images during the depolarization with a high potassium solution (47 mM) at the times indicated in nontransfected GLT dysgenic cells. These cells showed no fast or slow calcium signals (Bar = 10 μm). (B) Series of fluo-3 fluorescence images during a depolarization with a high potassium solution at the times indicated in GLT dysgenic cell lines transfected with the plasmid containing the α1 subunit of the DHPR. In contrast to what we observed in GLT myotubes and in the mock-transfected cells (GLT-NEO), we observed a slow depolarization-evoked calcium signal. Note that the slow transient (documented in D) lasts even longer than the one from primary cultures shown in Figs. 1 C and 2 A). Bar = 20 μm. (C) Relative fluorescence variation in an ROI during potassium depolarization at the time indicated in GLT cells. (D) Relative florescence in an ROI in GLT cells transfected with the α1 subunit. (E) Relative fluorescence variation in an ROI during potassium depolarization at the times indicated in control NLT cells.
Effect of Nifedipine and Ryanodine on GLT-α1–transfected Cells
The ROI analysis for the calcium fluorescence in GLT-α1–transfected cells (Fig. 6 A) clearly shows a slow calcium transient (filled triangles) that was completely blocked by the action of (10 μM) nifedipine (filled circles). These results thus suggest that activity of the nifedipine-sensitive α1 subunit of the DHPR is necessary for the slow calcium wave generated after a depolarizing stimulus in the α1-transfected cells.
Figure 6.
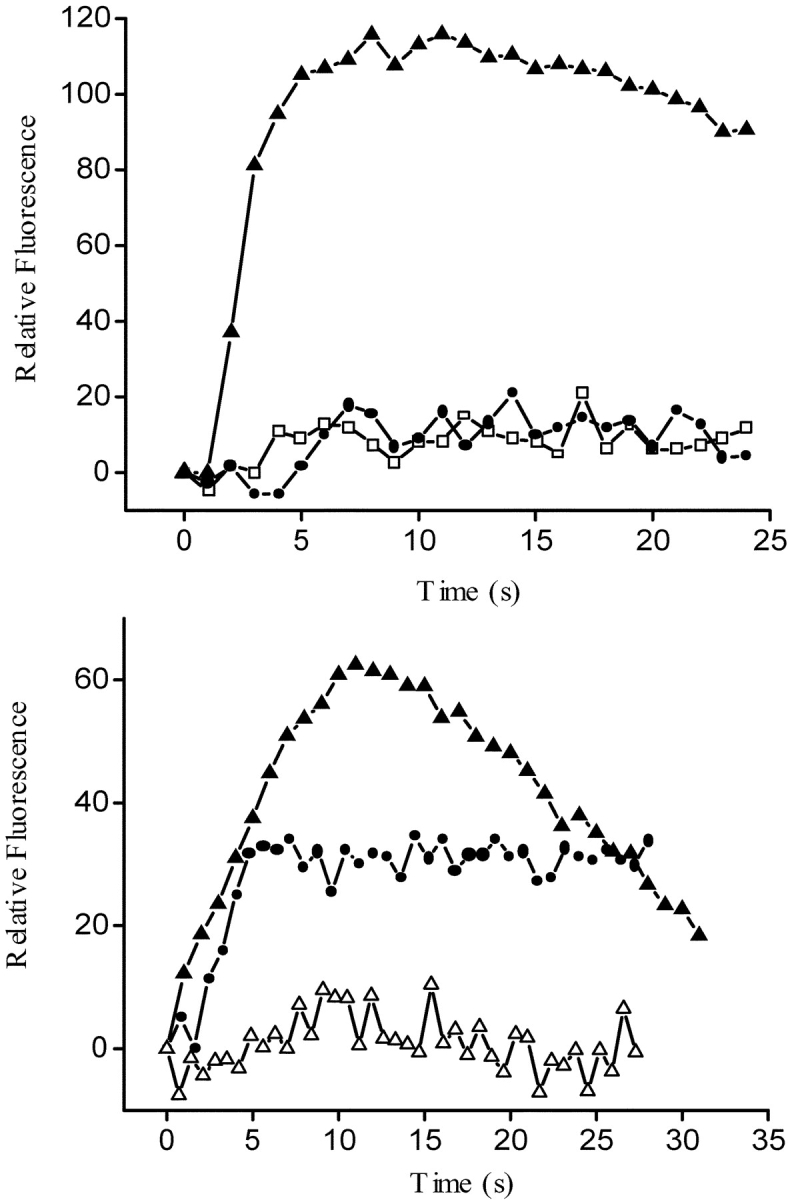
Fluo-3 relative fluorescence variation in an ROI from GLT cells: GLT-NEO, GLT-α1, and GLT-α1 in the presence of nifedipine and ryanodine. (A) Relative fluorescence variation in an ROI during the depolarization-evoked stimulus (47mM K+) in previously fluo-3 a.m.–loaded GLT cells. Mock-transfected GLT (open squares); GLT-α1–transfected (filled triangles), and GLT-α1–transfected cells plus nifedipine (filled circles). (B) Relative fluorescence variation in an ROI during the depolarization evoked stimulus (47 mM K+) in previously fluo-3 a.m.–loaded GLT cells: GLT-α1–transfected, (filled triangles), GLT-α1–transfected cells plus ryanodine (10 μM) (filled circles), and GLT-α1–transfected cells plus nifedipine and ryanodine (open triangles). All these experiments were carried in the presence of 0.5 mM EGTA to reduce any Ca2+ entry from the medium.
In the presence of 10 μM ryanodine (Fig. 6 B), the fast calcium transient was completely abolished in normal cells (Jaimovich et al., 2000; Estrada et al., 2001). To eliminate any effect of this RYR-mediated calcium release on the slow calcium transient, we incubated GLT-α1–transfected cells with 10 μM ryanodine for 20 min before potassium depolarization; under these conditions (Fig. 6 B, filled circles), the slow calcium transient was still present, somewhat reduced and longer lasting as described for other normal cells (Estrada et al., 2001). This signal was completely abolished when preincubation media contained both ryanodine and nifedipine (open triangles).
IP3 Receptors
When studying IP3-dependent calcium signals in cells lacking functional DHPRs, it is important to confirm expression of IP3Rs in these cells. To establish the presence and amount of IP3Rs in GLT cells, IP3R [3H]-IP3 binding was determined in a whole homogenate of both the dysgenic cell line and its normal counterpart. A specific binding curve for [3H]-IP3, characterized by a good fit to a (saturating) hyperbolic function, was found in both control and dysgenic cell lines (Fig. 7) . The analysis for the specific binding component was fit to a line, indicating a single family of receptors, with roughly equivalent maximal binding capacity. Similar K ds were found in control and dysgenic cells, 41.02 ± 9.9 nM and 41.12 ± 12.0, respectively, and the total of IP3 receptors (Bmax), 1.10 ± 0.12 and 1.42 ± 0.15 pmol/mg protein, respectively, do not represent an important difference. Therefore, differences in calcium transients are not attributable to differences in IP3Rs.
K+-induced IP3 Rise in Normal, Dysgenic, and Transfected Myotubes
Fig. 8 compares the K+-induced IP3 rise between the NLT normal myogenic cell line and its dysgenic counterpart, both transfected and nontransfected GLT cell lines. It can be clearly seen that the control cell line (filled diamonds) responded to the stimulus with an IP3 elevation that resembles that of primary cultures (Fig. 3), whereas the dysgenic cells, lacking the voltage sensor α1 subunit of the DHPR, were unable to respond (filled circles). The presence of DHPRs as voltage sensors thus seems to be a requirement for a voltage-elicited IP3 rise. When the time course of IP3 mass change was measured in GLT-α1 transfected cells (open circles), the early phase of the transient rise was recovered, whereas there was a difference in the later part of the curve when compared with that of the NLT cells.
Figure 8.

IP3 mass changes upon KCl depolarization in NLT (filled diamonds and dotted lines), GLT (filled circles), and GLT-α1–transfected (open circles) cells. Confluent plates of cells were washed three times with PBS, and were incubated for the times indicated in 47 mM K+. The mass of IP3 in the extract once neutralized was measured by radioreceptor assay. Values were expressed as the mean ± SD of at least three independent experiments. Paired t tests were performed. **, P < 0.05 (n = 4); ***, P < 0.001 (n = 4).
Effect of Nifedipine and Ryanodine on Early Gene Expression in Cultured Rat Myotubes
We have previously determined that high K+-induced depolarization of rat skeletal muscle in culture increases mRNA levels of the early genes c-fos and c-jun (Carrasco et al., 2000). The increase is about twofold for both early genes, and is transient with a maximal up-regulation ∼15 min after depolarization. These results have been obtained both in the presence and in the absence of extracellular calcium. We tested the effect of nifedipine on the early genes c-fos and c-jun up-regulation (Fig. 9 A). Results from four to five experiments show that 10 μM nifedipine significantly inhibited the increase in both c-fos and c-jun mRNA levels after depolarization in rat primary myotubes. On the other hand, 20 μM ryanodine, a concentration that completely blocks the fast calcium transient but does not inhibit the slow calcium signal (Fig. 2 C), has no effect on the depolarization-induced increase in early gene mRNA. (Fig. 9 B). These experiments strongly suggest that the slow calcium transient, but not the fast one, is involved in early gene expression.
Figure 9.
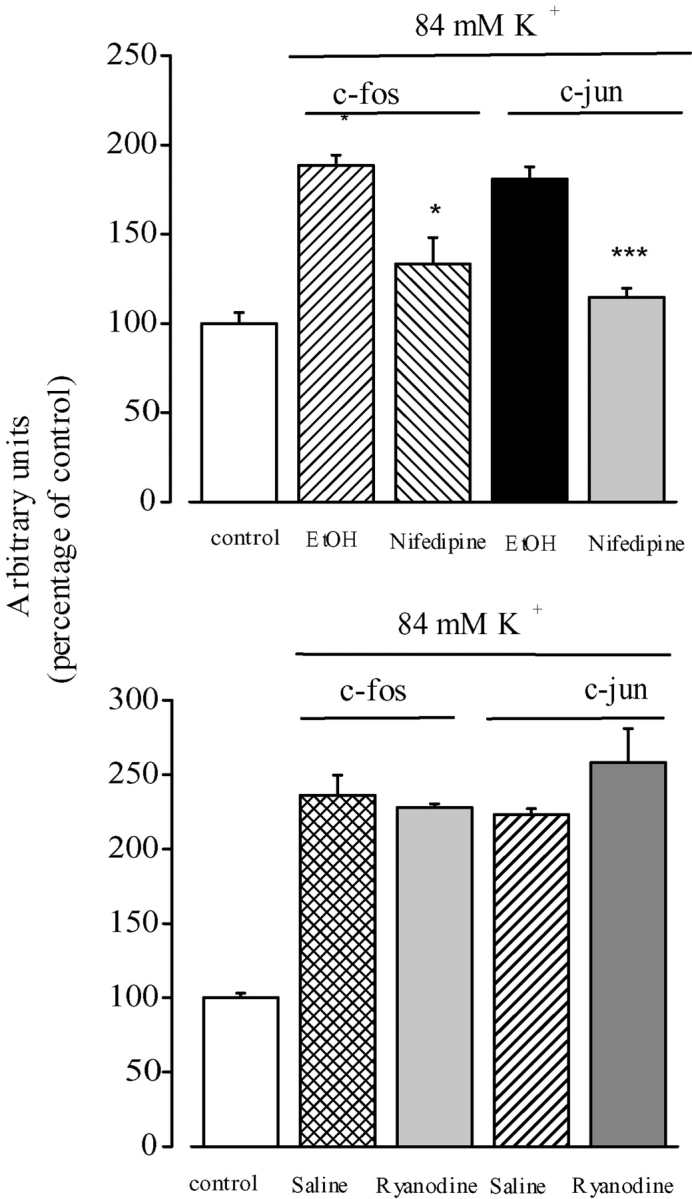
Nifedipine inhibits K+ depolarization–induced increases in c-fos and c-jun transcription. (A) Myotubes were pretreated for 30 min with ethanol (vehicle for nifedipine) or with 10 μM nifedipine under resting conditions and depolarized with 84 mM potassium in a medium containing ethanol or nifedipine. The levels of c-fos and c-jun mRNAs were determined by Northern blot analysis of RT-PCR products. The results from both methods were normalized to GAPDH expression and presented as mean ± SE (n = 4–5) of the fold-induction effect of depolarization with respect to the control (no depolarization). (B) Myotubes were pretreated for 30 min with 20 μM ryanodine and depolarized in the presence of ryanodine. The levels of c-fos and c-jun mRNAs were determined in three experiments by RT-PCR. The results obtained at 15 min of exposure to high potassium in both cases are presented. Paired t tests were performed. *, P < 0.05; ***, P < 0.001.
DISCUSSION
We have provided evidence of a role for dihydropyridine receptors in the generation of slow calcium transients, IP3 production, and early gene expression in skeletal muscle cells. This would be a function unexpected for a voltage-dependent ion channel, i.e., to directly trigger an intracellular-signaling cascade independently of ion permeation (Jaimovich et al., 2000). However, it is known that in skeletal muscle, DHPRs have a unique function as voltage sensors that interact with RYRs releasing calcium needed for muscle contraction, and this function does not require calcium permeation through the DHPR channel. (Tanabe et al., 1988). We have previously described how membrane depolarization triggers calcium transients in both rat and mice myotubes. These transients can be dissociated into two kinetically distinct components, fast and slow (Jaimovich and Rojas, 1994; Jaimovich et al., 2000; Estrada et al., 2001; Powell et al., 2001). The fast component is related to E-C coupling and the slow component appears to be involved in the regulation of gene transcription. We have shown in this report that the slow component is highly sensitive to the dihydropyridine drug nifedipine and that increased expression of early gene mRNAs is also sensitive to the same drug.
Indications of a role for DHPRs in slow calcium signals come from work using a ratiometric calcium dye and measuring depolarization-induced calcium changes (Jaimovich and Rojas, 1994). In this situation involving living cells, we had to use prolonged incubation with relatively large concentrations of nifedipine since the apparent dissociation constants differ between isolated membranes and intact cells, either isolated muscle fibers (reviewed by Rios and Pizarro, 1991) or cultured muscle cells (Cognard et al., 1990). This apparent difference has been explained both as a result of differences in the time of diffusion of the drug to internal receptor sites (Valdivia and Coronado, 1990) and as differences in affinity between different states of the channel-receptor, since binding occurs to the inactivated state of the channel (Pauwels et al., 1987; Cognard et al., 1990; Rios and Pizarro, 1991).
The present study, using both primary cultured myotubes and a cell line obtained from dysgenic mice lacking the α1 subunit of the DHPR and its α1 subunit–transfected counterpart, clearly defines a role for DHPRs in eliciting an early rise in IP3 mass, a delayed calcium transient and up-regulation of early genes.
Dysgenic cells do not show spontaneous or evoked contractions in response to potassium depolarization, nor do they show calcium transients (except for those depending on calcium entry, not detectable under our conditions). Differences in calcium transients between GLTs and normal cells are not attributable to differences in IP3Rs since both the amount of receptor and the affinity for IP3 appear to be normal in the GLT cells. All other muscle cells tested so far, including dyspedic cells that lack expression of RYRs (Estrada et al., 2001), do show IP3-dependent calcium transients upon depolarization. In fact, these cells, which possess DHPRs but lack RYRs, show the slow calcium transient and lack the fast E-C–coupling transient. The fact that the GLT, dysgenic line is the sole cultured muscle cell line that so far has failed to respond to high potassium with an increase in either calcium or IP3, strongly suggests that this signal is mediated by DHPR.
The link between depolarization of the surface membrane and contraction (which implies calcium release) can be restored with the transfection of cDNA for the α1 subunit of DHPR, as was described earlier by Tanabe et al. (1988) for primary cultures. After transfection with the α1 subunit of the DHPR, we were able to restore the capacity of GLT cells to respond to potassium depolarization with both an increase in IP3 mass and a slow increase in intracellular calcium. This calcium increase was not attributable to calcium entry since we performed experiments in the absence of external calcium. This treatment also precludes an effect via store-operated channels, as that described for other IP3-dependent processes (Ma et al., 2000). We must conclude then, that potassium depolarization was able to induce calcium release from intracellular stores in these cells.
The main molecular entity responsible for calcium release was not RYRs; the kinetics of the calcium signals were too slow (>5 s), compared with the fast signal (lasting up to 2 s) involving RYRs. Furthermore, ryanodine was not able to block the slow calcium signal, although it may alter its time course. We have recently demonstrated (Estrada et al., 2001) that slow calcium signals are the consequence of IP3 receptor activation; RYRs do have a role in the kinetics of the slow calcium signals but it has not been studied in detail. The molecular entity responsible for the slow calcium transient is the IP3R as shown by the following evidence: (a) kinetics of the early increase in IP3 are compatible with such a role, (b) inhibition of PLC blocks Ca2+ transients (Powell et al., 2001), (c) inhibition of IP3Rs blocks Ca2+ transients as well (Estrada et al., 2001; Powell et al., 2001) and (d) inhibition by both nifedipine and pertussis toxin of these processes. The signals we see in transfected GLT cells correspond to the slow, IP3 dependent calcium transients; they last longer than slow signals seen in primary cultures but are similar to those present in either 1B5 cells (which lack RYRs) or in ryanodine treated C2C12 cells (Estrada et al., 2001). They are also similar to those seen in poorly differentiated NLT cells. The fact that transfected cells lack the fast calcium transient (associated with RYR channel calcium release) together with the lack of significant effect of ryanodine on the slow calcium transients, suggests that RYRs are probably not yet fully expressed in GLT cells under the conditions we used. GLT cells do express RYRs but these receptors appear to be among the latest proteins to be synthesized and adequately targeted after differentiation in cell lines and do not appear until several days after IP3 receptors are functionally expressed (Liberona et al., 1997). Interestingly, cells that either lack RYRs or have these receptors inhibited, display long lasting slow calcium signals like those of transfected GLT cells (Fig. 4 B); these data reinforce the idea of a role for RYRs in the kinetics of this signal (Estrada et al., 2001).
The fact that we could recover both slow calcium transients and IP3 transients after transfection strongly favors the idea that these processes are connected. The kinetics of the IP3 rise are complex (Jaimovich et al., 2000). A fast component precedes the calcium rise (Fig. 3, A and B) and is compatible with diffusion of IP3 to its receptors being the trigger for calcium release. In fact, we have shown that inhibition of PLC, the enzyme that produces IP3, also inhibits slow calcium transients (Estrada et al., 2001, Powell et al., 2001). In addition there is a delayed component of the IP3 rise (Figs. 2 and 7) that appears to be less sensitive to nifedipine, and that reaches a maximum ∼30 s after depolarization. This component thus seems not to be linked to the slow calcium rise we are studying. We do not know the function for this delayed component and it may be related to longer lasting (30–40 s “shoulder” and steady-state) calcium increases of variable magnitude (Fig. 1, bottom traces) seen in some cells, that we have not studied in detail. It is interesting to note that transfection of the α1 subunit of DHPR to GLT cells restores the fast IP3 rise but not the slow one (Fig. 7), suggesting that “fast” and “slow” IP3 transients may originate via different mechanisms and affect different calcium pools.
How is the dihydropyridine receptor capable of activating PLC? Certainly such a mechanism is important and deserves further studies. The fact that pertussis toxin was able to block both calcium and IP3 transients suggests that a protein of the Gi type, directly or indirectly linked to DHPRs, is involved. Since the αi subunit of G proteins has not been described to interact with PLC, it is possible that interaction occurs either indirectly, via a third protein or through an interaction of the β γ subunit of the Gi protein with PLC.
The fact that early gene up-regulation was inhibited in the presence of nifedipine strongly suggests a calcium-mediated link between electrical activity (membrane potential) and early gene regulation in skeletal muscle cells. Nifedipine as well as other L-type calcium channel blockers were recently shown to inhibit both differentiation and gene expression in a myogenic cell line (Porter et al., 2002). Because ryanodine concentrations known to block the fast calcium transient (Jaimovich et al., 2000) did not affect early gene mRNA levels, we can rule out a role of the fast calcium transient related to excitation-contraction coupling in this phenomenon. The current results certainly favor the idea that membrane potential is one of the triggers of processes regulating gene expression in muscle cells, and the first step in this cascade is likely to be a conformational change in the voltage sensor, DHPR.
Our mechanistic model then (Fig. 10) proposes that a voltage-dependent conformational change of the DHPR is linked to activation of a G-protein (β γ subunit?) and subsequent activation of PLC. IP3 will diffuse toward IP3Rs located both in certain regions of the sarcoplasmic reticulum and in the nuclear envelope (Powell et al., 2001), releasing calcium that will not be involved in muscle contraction but will be capable of eliciting both ERKs and CREB phosphorylation and of promoting transcription of immediate early genes.
Figure 10.

Schematic description of receptors and pathways known to be involved in IP3-generated calcium signals and early gene regulation in muscle cells. The signaling pathway begins at the DHPR located in the T-tubule membrane; a heterotrimeric G protein with a Gi type subunit is proposed to interact with DHPR and to activate PLC to produce IP3 and DAG. IP3 will diffuse into the cytosol and reach IP3Rs located both at the SR membrane and at the nuclear envelope. Calcium release will occur independently into both cytosol and nucleoplasm and several calcium-dependent mechanisms will be activated. ERKs 1/2 will be phosphorylated in the cytosol and phosphorylated CREB (P-CREB) will increase inside the nucleus. Transcription of early genes such as c-jun will increase after P-CREB activation of a CRE box located upstream. All of the above steps are based on published data. Roles for the Ras-raf pathway upstream of ERKs and for PKC, activated by DAG as nuclear coactivator of CREB are postulated based on inhibition experiments (unpublished data). Red arrows denote activation and blue arrows indicate release.
Acknowledgments
We are grateful to Raúl Caviedes and Alejandra Espinoza for help with cell cultures. We thank Chun Lei, Smith College, for the construction of the DNA α1 used for transfection. We are grateful to Dr. Dany Adams, Smith College, MA, for a critical reading of the manuscript.
Financed by FONDECYT 8980010 (E. Jaimovich and M.A. Carrasco), 2001 (R. Araya) and FONDAP 15010006. R. Araya thanks to Comisión Nacional de Investigación Científica y Tecnológica (CONICYT) for a graduate student fellowship, by the Blakeslee Fund of Smith College.
Olaf Andersen served as editor.
Footnotes
Abbreviations used in this paper: DAG, diacyl-glycerol; DHPR, dihydropyridine receptor; E-C, excitation-contraction; GAPDH, glyceraldehyde 3-phosphate dehydrogenase; GM, growth medium; IP3Rs, inositol 1,4,5-trisphosphate receptors; IP3, inositol 1,4,5-trisphosphate.
References
- Carrasco, M.A., N. Riveros, J. Ríos, and E. Jaimovich. 2000. Expression of early genes in K+-depolarized rat myotubes in primary culture. J. Physiol. 523P:100P. [Google Scholar]
- Chomczynski, P., and N. Sacchi. 1987. Single-step method of RNA isolation by acid guanidinium thiocyanate-phenol-chloroform extraction. Anal. Biochem. 162:156–159. [DOI] [PubMed] [Google Scholar]
- Cognard, C., M. Rivet, and G. Raymond. 1990. The blockade of excitation/contraction coupling by nifedipine in patch-clamped rat skeletal muscle cells in culture. Pflugers Arch. 416:98–105. [DOI] [PubMed] [Google Scholar]
- Dolphin, A.C. 1999. L-Type calcium channel modulation. Adv. Second Messenger Phosphoprotein Res. 33:153–177. [DOI] [PubMed] [Google Scholar]
- Estrada, M., J.C. Cárdenas, J.L. Liberona, M.A. Carrasco, G.A. Mignery, P.D. Allen, and E. Jaimovich. 2001. Calcium transients in 1B5 myotubes lacking ryanodine receptors are related to inositol trisphosphate receptors. J. Biol. Chem. 276:22868–22874. [DOI] [PubMed] [Google Scholar]
- Estrada, M., J.L. Liberona, M. Miranda, and E. Jaimovich. 2000. Aldosterone- and testosterone-mediated intracellular calcium response in skeletal muscle cell cultures. Am. J. Physiol. Endocrinol. Metab. 279:E132–E139. [DOI] [PubMed] [Google Scholar]
- Flucher, B.E., M.E. Morton, S.C. Froehner, and M.P. Daniels. 1990. Localization of the α1 and α2 subunits of the dihydropyridine receptor and ankyrin in skeletal muscle triads. Neuron. 5:339–351. [DOI] [PubMed] [Google Scholar]
- Flucher, B.E., N. Kasielke, and M. Grabner. 2000. The triad targeting signal of the skeletal muscle calcium channel is localized in the COOH terminus of the α1s subunit. J. Cell Biol. 151:467–477. [DOI] [PMC free article] [PubMed] [Google Scholar]
- Fosset, M., E. Jaimovich, E. Delpont, and M. Lazdunski. 1983. 3[H] nitrendipine receptors in skeletal muscle. J. Biol. Chem. 258:6086–6092. [PubMed] [Google Scholar]
- Felder, E., F. Protasi, R. Hirsch, C. Franzini-Armstrong, and P.D. Allen. 2002. Morphology and molecular composition of sarcoplasmic reticulum surface junctions in the absence of DHPR and RYR in mouse skeletal muscle. Biophys. J. 82:3144–3149. [DOI] [PMC free article] [PubMed] [Google Scholar]
- Graham, F.L., and A.J. Van der Eb. 1973. A new technique for the assay of infectivity of human adenovirus 5 DNA. Virology. 52:456–467. [DOI] [PubMed] [Google Scholar]
- Hamaya, Y., T. Takeda, S. Dohi, S. Nakashima, and Y. Nozawa. 2000. The effects of pentobarbital, isoflurane, and propofol on immediate-early gene expression in the vital organs of the rat. Anesth. Analg. 90:1177–1183. [DOI] [PubMed] [Google Scholar]
- Hartree, E.F. 1972. Determination of protein: a modification of the Lowry method that gives a linear photometric response. Anal. Biochem. 48:422–427. [DOI] [PubMed] [Google Scholar]
- Hodgkin, A.L., and P. Horowicz. 1960. Potassium contractures in single muscle fibers. J. Physiol. 153:386–403. [DOI] [PMC free article] [PubMed] [Google Scholar]
- Jaimovich, E., and E. Rojas. 1994. Intracellular Ca2+ transients induced by high external K+ and tetracaine in cultured rat myotubes. Cell Calcium. 15:356–368. [DOI] [PubMed] [Google Scholar]
- Jaimovich, E., R. Reyes, J.L. Liberona, and J.A. Powell. 2000. IP3 receptors, IP3 transients and nucleus-associated calcium signals in cultured skeletal muscle. Am. J. Physiol. Cell Physiol. 278:C998–C1010. [DOI] [PubMed] [Google Scholar]
- Jorgensen, A.O., A.C.Y. Shen, W. Arnold, A.T. Leung, and K.P. Campbell. 1989. Subcellular distribution of the 1,4-dihydropyridine receptor in rabbit skeletal muscle in situ: an immunofluorescence and immunocolloidal gold-labeling study. J. Cell Biol. 109:135–147. [DOI] [PMC free article] [PubMed] [Google Scholar]
- Liberona, J.L., P. Caviedes, S. Tascón, J. Hidalgo, J.R. Giglio, S.V. Sampaio, R. Caviedes, and E. Jaimovich. 1997. Expression of ion channels during differentiation of a human skeletal cell line. J. Muscle Res. Cell Motil. 18:587–598. [DOI] [PubMed] [Google Scholar]
- Liberona, J.L., J.A. Powell, S. Shenoi, L. Petherbridge, R. Caviedes, and E. Jaimovich. 1998. Differences in both IP3 mass and IP3 receptors between normal and dystrophic skeletal muscle cell lines. Muscle Nerve. 21:902–909. [DOI] [PubMed] [Google Scholar]
- Ma, H.T., R.L Patterson, D.V. van Rossum, L. Birnbaumer, K. Mikoshiba, and D.L. Gill. 2000. Requirement of the inositol trisphosphate receptor for activation of store-operated Ca2+ channels. Science. 287:1647–1651. [DOI] [PubMed] [Google Scholar]
- Melzer, W., A. Hermann-Frank, and H.C. Lüttgau. 1995. The role of Ca2+ ions in excitation-contraction coupling of skeletal muscle fibres. Biochim. Biophys. Acta. 1241:59–116. [DOI] [PubMed] [Google Scholar]
- Minta, A., J.P.Y. Kao, and R.Y. Tsien. 1989. Fluorescent indicators for cytosolic calcium based on rhodamine and fluorescent chromophores. J. Biol. Chem. 264:8171–8178. [PubMed] [Google Scholar]
- Pauwels, P.J., H.P. van Assouw, and J.E. Leysen. 1987. Depolarization of chick myotubes triggers the appearance of (+)-[3H]PN 200-110-binding sites. Mol. Pharmacol. 32:785–791. [PubMed] [Google Scholar]
- Porter, J.A., R.F. Makuck, and S.A. Rivkees. 2002. Reduction in intracellular calcium levels inhibits myoblast differentiation. J. Biol. Chem. 277:28942–28947. [DOI] [PubMed] [Google Scholar]
- Powell, J.A., L. Petherbridge, and B.E. Flucher. 1996. Formation of triads without the dihydropyridine receptor α subunits in cell lines from dysgenic skeletal muscle. J. Cell Biol. 134:375–387. [DOI] [PMC free article] [PubMed] [Google Scholar]
- Powell, J.A., M.A. Carrasco, D.S. Adams, B. Drouet, J. Rios, M. Muller, M. Estrada, and E. Jaimovich. 2001. IP3 receptor function and localization in myotubes: an unexplored Ca2+ signaling pathway in skeletal muscle. J. Cell Sci. 114:3673–3683. [DOI] [PubMed] [Google Scholar]
- Powell, J.A. 1990. Muscular dysgenesis: a model system for studying skeletal muscle development. FASEB J. 4:2798–2808. [DOI] [PubMed] [Google Scholar]
- Rios, E., and G. Brum. 1987. Involvement of dihydropyridine receptors in excitation contraction coupling in skeletal muscle. Nature. 325:717–720. [DOI] [PubMed] [Google Scholar]
- Rios, E., and G. Pizarro. 1991. Voltage sensor for excitation-contraction coupling in skeletal muscle. Physiol. Rev. 71:849–908. [DOI] [PubMed] [Google Scholar]
- Tanabe, T., K.G. Beam, J.A. Powell, and S. Numa. 1988. Restoration of excitation contraction coupling and slow current in dysgenic muscle by dihydropyridine receptor complementary DNA. Nature. 336:134–139. [DOI] [PubMed] [Google Scholar]
- Takahashi, M., M.J. Seagar, J.F. Jones, B.F. Reber, and W.A. Caterall. 1987. Subunit structure of dihydropyridine-sensitive calcium channels from skeletal muscle. Proc. Natl. Acad. Sci. USA. 84:5478–5482. [DOI] [PMC free article] [PubMed] [Google Scholar]
- Triggle, D.J., and R.A. Janis. 1987. Calcium channel ligands. Annu. Rev. Pharmacol. Toxicol. 27:347–369. [DOI] [PubMed] [Google Scholar]
- Valdivia, H.H., and R. Coronado. 1990. Internal and external effects of dihydropyridines in the calcium channel of skeletal muscle. J. Gen. Physiol. 95:1–27. [DOI] [PMC free article] [PubMed] [Google Scholar]