

Abstract
Spark mass, the volume integral of ΔF/F, was investigated theoretically and with simulations. These studies show that the amount of Ca2+ bound to fluo-3 is proportional to mass times the total concentration of fluo-3 ([fluo-3T]); the proportionality constant depends on resting Ca2+ concentration ([Ca2+]R). In the simulation of a Ca2+ spark in an intact frog fiber with [fluo-3T] = 100 μM, fluo-3 captures approximately one-fourth of the Ca2+ released from the sarcoplasmic reticulum (SR). Since mass in cut fibers is several times that in intact fibers, both with similar values of [fluo-3T] and [Ca2+]R, it seems likely that SR Ca2+ release is larger in cut fiber sparks or that fluo-3 is able to capture a larger fraction of the released Ca2+ in cut fibers, perhaps because of reduced intrinsic Ca2+ buffering. Computer simulations were used to identify these and other factors that may underlie the differences in mass and other properties of sparks in intact and cut fibers. Our spark model, which successfully simulates calcium sparks in intact fibers, was modified to reflect the conditions of cut fiber measurements. The results show that, if the protein Ca2+-buffering power of myoplasm is the same as that in intact fibers, the Ca2+ source flux underlying a spark in cut fibers is 5–10 times that in intact fibers. Smaller source fluxes are required for less buffer. In the extreme case in which Ca2+ binding to troponin is zero, the source flux needs to be 3–5 times that in intact fibers. An increased Ca2+ source flux could arise from an increase in Ca2+ flux through one ryanodine receptor (RYR) or an increase in the number of active RYRs per spark, or both. These results indicate that the gating of RYRs, or their apparent single channel Ca2+ flux, is different in frog cut fibers—and, perhaps, in other disrupted preparations—than in intact fibers.
Keywords: spark mass, ryanodine receptors, excitation-contraction coupling, frog muscle
INTRODUCTION
Ca2+ sparks are brief, localized increases in fluorescence that can be detected in confocal images of muscle fibers that contain a Ca2+ indicator such as fluo-3 (Cheng et al., 1993; Tsugorka et al., 1995; Klein et al., 1996). These fluorescence signals are driven by local increases in the concentration of myoplasmic free calcium ([Ca2+]) that result from the flux of Ca2+ from the SR into the myoplasm through one or more RYRs, the Ca2+ release channels of the SR.
In frog skeletal muscle, voltage-activated Ca2+ sparks differ substantially in intact and cut fibers. For example, the average values of decay time constant, full duration at half maximum (FDHM),* full width at half maximum (FWHM), and spark mass are 1.5- to threefold larger in cut fibers than in intact fibers (Table VII of Hollingworth et al., 2001; see also Table II below). The largest difference is for mass.
The first part of this article describes some of the properties of spark mass, which is defined as the volume integral of ΔF/F. These studies show that the amount of Ca2+ bound to fluo-3 is proportional to mass times the total concentration of fluo-3 ([fluo-3T]), with a proportionality constant that depends on [Ca2+]R. In an intact fiber simulation with [fluo-3T] = 100 μM and [Ca2+]R = 50 nM (the values that apply to intact fibers; Hollingworth et al., 2001), fluo-3 captures approximately one-fourth of the Ca2+ released during a spark. Since mass in cut fibers is several times that in intact fibers, whereas [fluo-3T] and [Ca2+]R are similar, it seems likely that SR Ca2+ release is larger in cut fiber sparks or that fluo-3 is able to capture a larger fraction of the released Ca2+, perhaps because of reduced intrinsic Ca2+ buffering in cut fibers. Other factors, however, may contribute to the differences in spark properties, including the microscope point-spread function (PSF), the ionic composition of the myoplasmic solution, and the procedures used for spark analysis.
The second part of this article describes computer modeling that helps identify the factors that underlie the differences between intact and cut fiber sparks. The spark model of Baylor et al. (2002), which successfully simulates sparks in intact fibers, was modified to mimic the conditions encountered in the cut fiber experiments. The new simulations show that the source flux required for sparks in cut fibers is 3–10 times that in intact fibers; the exact factor depends on the concentrations of [Ca2+]R and the myoplasmic Ca2+ buffering proteins such as troponin. Such an increase in Ca2+ source flux could arise from an increase in Ca2+ flux through one RYR or an increase in the number of active RYRs per spark, or both. In either case, it seems clear that the gating of RYRs, or their apparent single channel Ca2+ flux, is different in frog cut fibers—and, perhaps, in other disrupted preparations—than in frog intact fibers.
Some of the results have appeared in abstract form (Baylor et al., 2003; Chandler et al., 2003).
MATERIALS AND METHODS
Measurement of Sparks in Intact Fibers
Intact single fibers were dissected from leg muscles of R. pipiens, microinjected with the membrane-impermeant form of fluo-3, and studied at 18 ± 1°C with a laser-scanning confocal microscope. Fluorescence x-t images were obtained with pixel separations of 0.20 μm in x and 2.048 ms in t. The average [fluo-3T] at the optical site was 0.1 mM. This and other information are given in Hollingworth et al. (2001).
Simulation of Sparks in Intact Fibers
Calculations were made with spark model 2 of Baylor et al. (2002). In brief, the myoplasm is assumed to be isotropic, with its constituents distributed homogeneously in the resting state. For computational purposes, the myoplasmic volume is divided into 101 spherically symmetric compartments that are centered at the source of Ca2+ release and extend to 5 μm from the source. A spark occurs when a brief flux of Ca2+ enters the innermost compartment, a sphere of radius 25 nm. The model is used to calculate, for different times and radial distances from the source, the concentration of myoplasmic-free Ca2+, the concentrations of the Ca2+-free and Ca2+-bound forms of the major intrinsic myoplasmic Ca2+ buffers (troponin, ATP, parvalbumin, and the SR Ca2+ pump), and the concentrations of the Ca2+-free and Ca2+-bound forms of fluo-3.
The model considers four different forms of fluo-3: Fluo (Ca2+-free, protein-free fluo-3), PrFluo (Ca2+-free, protein-bound fluo-3), CaFluo (Ca2+-bound, protein-free fluo-3), and CaPrFluo (Ca2+-bound, protein-bound fluo-3). The total concentration of Ca2+-bound fluo-3, denoted by [Cafluo-3], is given by
 |
(1) |
CaFluo and CaPrFluo are strongly fluorescent with the same relative intensity (Harkins et al., 1993), denoted by Fmax, whereas Fluo and PrFluo are weakly fluorescent. To allow for the fluorescence of Ca2+-free indicator, it is useful to introduce a derived fluo-3 concentration variable, [FFluo], defined by
 |
(2) |
Fmin/Fmax and F′min/Fmax represent, respectively, the fluorescence intensities of Fluo and PrFluo divided by that of CaFluo or CaPrFluo; their values are 0.005 and 0.01, respectively (Harkins et al., 1993). According to Eq. 2, [FFluo] represents the concentration of CaFluo (or CaPrFluo) that has the same fluorescence as the mixture of CaFluo, CaPrFluo, Fluo, and PrFluo. The value of [FFluo]R is proportional to [fluo-3T]. The proportionality constant is equal to 0.0422 for [Ca2+]R = 50 nM, 0.0608 for [Ca2+]R = 80 nM, and 0.0728 for [Ca2+]R = 100 nM.
ΔF/F is calculated by convolving Δ[FFluo]/[FFluo]R with the microscope PSF. In general, Δ denotes a change in a variable and subscript R denotes its resting value. The values of the FWHM of the PSF are 0.2 μm in x and y and 0.5 μm in z, the same as those measured in the confocal microscope used in the intact fiber experiments (Hollingworth et al., 2001). This model with a Ca2+ source flux of 2.5 pA for 4.6 ms provides a good description of Ca2+ sparks in intact fibers (Baylor et al., 2002).
Simulation of Sparks in Cut Fibers
The model described above for intact fibers was modified to simulate Ca2+ sparks in cut fibers. Table I lists the differences between the intact and cut fiber simulation conditions (columns 2 and 3, respectively). The information for intact fibers was taken from Hollingworth et al. (2001). The information for cut fibers was taken from experiments in the Schneider laboratory. These experiments were selected for comparison because sparks in the Schneider laboratory and ours were analyzed with similar functions in space and time (Klein et al., 1997; Lacampagne et al., 1999; see below).
TABLE I.
Factors That May Contribute to Ca2+ Spark Differences in Intact and Cut Fibers
| 1 | 2 | 3 | |
|---|---|---|---|
| Factor | Intact fibers | Cut fibers | |
| A. Fiber conditions | |||
| 1. Temperature (°C) | 18 | 22 | |
| 2. Sarcomere length (μm) | 3.0 | 3.6 | |
| 3. Resting free [Ca2+] (μM) | 0.05 | 0.08 | |
| 4. Resting free [Mg2+] (μM) | 1,000 | 650 | |
| 5. Total [ATP] (μM) | 8,000 | 5,000 | |
| 6. Total [EGTA] (μM) | 0 | 100 | |
| 7. Total [troponin regulatory sites] (μM) | 360 | 432 | |
| 8. [Fluo-3T] (μM) | 100 | 100 | |
| B. Microscope PSF | |||
| FWHM of microscope PSF: x, y, z (μm) | 0.2, 0.2, 0.5 | 0.5, 0.5, 1.0 | |
| C. Procedures for spark analysis | See materials and methods | ||
For the cut fiber simulations, model 2 of Baylor et al. (2002) was modified to incorporate the differences between columns 2 and 3. To adjust for temperature, the diffusion constants and reaction rate constants in the intact fiber model were scaled by the factors 1.11 and 1.32, respectively (corresponding to Q10s of 1.3 and 2.0, respectively). To adjust for sarcomere length, the concentration of the troponin regulatory sites in the intact fiber model was scaled by the factor 1.2 (the ratio of the sarcomere lengths); this scaling reflects the expected constancy of fiber volume with changes in sarcomere length and the close proximity of the troponin molecules to the SR Ca2+ release sites. The association and dissociation rate constants for Ca2+'s reaction with EGTA were 3.79 × 10⁶ M−1 s−1 and 1.42 s−1, respectively (22°C, pH = 7.0; Pape et al., 1995). The value of resting free [Mg2+] in cut fibers is based on Lacampagne et al. (1998). The other information for cut fibers is based on Lacampagne et al. (1996)(1999) and a personal communication with Dr. M.F. Schneider.
Simulation of Noisy Sparks
Noisy sparks were simulated with the aid of a random number generator to mimic the known sources of noise and variability in the measurements (Baylor et al., 2002). These include photon and instrumentation noise as well as variability that arises from random displacements of the scan line relative to the spark source and random offsets in the time of data sampling relative to the time of spark onset.
Procedures for Spark Analysis in Intact Fibers
The analysis of an intact fiber spark, both experimental and simulated, followed procedures described in Hollingworth et al. (2001). Briefly, a 3 × 3 smoothed x-t image was formed from the original ΔF/F x-t image and an autodetection program was used to tentatively identify a spark as a contiguous region with peak ΔF/F ≥ 0.3. The unsmoothed ΔF/F image was then used to form a ΔF/F vs. t waveform as the average of the three time lines at x0 − 0.2 μm, x0, and x0 + 0.2 μm; x0 denotes the spatial center of the spark determined by the autodetection program. This waveform was least-squares fitted with Eq. 1 of Hollingworth et al. (2001), which is based on the corrected version of Eq. 2 of Lacampagne et al. (1999). This equation assumes that ΔF/F vs. t starts abruptly, rises exponentially toward a maximum value, then terminates abruptly and decays exponentially to a baseline offset. The fit determines the 0–100% rise time, time of peak (denoted t2), peak amplitude, decay time constant, and FDHM. Then, a ΔF/F vs. x waveform was obtained from the unsmoothed ΔF/F image as an average of two line scans, just before and just after t2. This waveform was least-squares fitted with a Gaussian function with baseline offset (Eq. 2 of Hollingworth et al., 2001; see also Klein et al., 1997) to determine FWHM at time of peak ΔF/F. Spark mass at time of peak ΔF/F was estimated with Eq. 8 of Hollingworth et al. (2001):
 |
(3) |
in which Me denotes estimated mass. Eq. 3 was derived on the assumption that ΔF/F can be represented as a product of three individual and identical gaussian functions in x, y, and z. Although this condition does not strictly hold in spark experiments, Eq. 3 provides a useful estimate of mass, as shown below in Figs. 2 and 3 and associated text.
Figure 2.
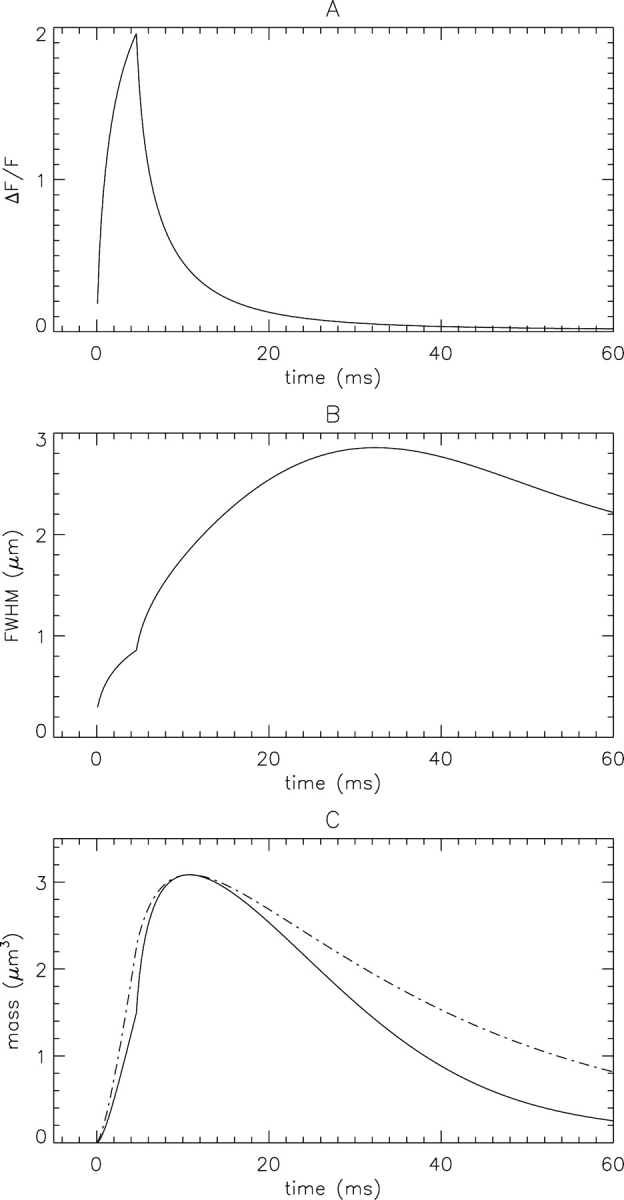
Temporal waveforms used to estimate spark mass. ΔF/F (A) and FWHM (B) at the source, obtained from fits of a gaussian function (Eq. 2 of Hollingworth et al., 2001) to single line scans of ΔF/F vs. x at times ≥ 0.1 ms. (C) The continuous curve is Me(t) calculated with Eq. 3 from the curves in A and B. The dashed curve is M(t) (the curve in Fig. 1 B) scaled by the factor 0.850.
Figure 3.
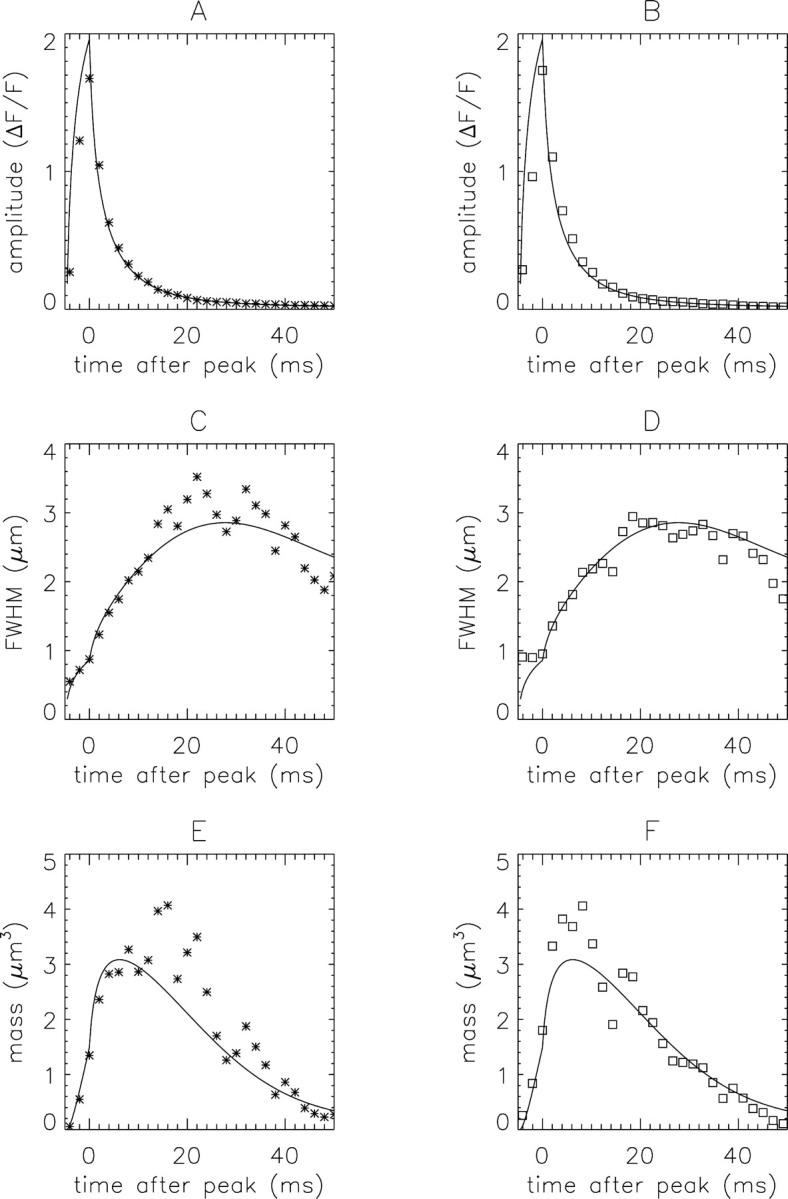
Comparison of simulated and measured spark data (asterisks and open squares, respectively) used for the estimation of spark mass. Each dataset was obtained from an averaged x-t image formed from 179 in-focus sparks. Prior to averaging, the sparks were aligned in time, based on the estimated time of peak, and in space, based on the estimated spatial center of the spark (Hollingworth et al., 2001). The pixel separations in x and t were 0.20 μm and 2 ms for the simulated noisy images and 0.20 μm and 2.048 ms for the measured images. (A and B) The symbols show ΔF/F at the spark center, as estimated from fits of a gaussian function to ΔF/F vs. x at different times. For the fits, the spatial data were averaged from 1, 3, or 9 lines in x (t ≤ 20 ms, 20 < t ≤ 40 ms, and t > 40 ms, respectively). (C and D) The symbols show the values of FWHM estimated from the fits in panels A and B. (E and F) The values of Me (symbols) were calculated with Eq. 3 from the corresponding values of ΔF/F (A and B) and FWHM (C and D). The continuous curves are identical to the continuous curves in the corresponding panels of Fig. 2 time-shifted by −4.6 ms.
Sparks were excluded from the analysis if the fitted parameters did not satisfy the broad acceptance criteria described in Hollingworth et al. (2001). With the standard model for intact fiber sparks, these criteria exclude <1% of the simulated sparks.
Procedures for Spark Analysis in Cut Fibers
The analysis of a simulated cut fiber spark followed procedures described in Klein et al. (1997), in Lacampagne et al. (1999), and in a personal communication with Dr. M.F. Schneider. It started with the autodetection routine used for intact fibers. A possible spark, with an initial estimate of x0, was identified in the 3 × 3 smoothed image. An initial ΔF/F vs. t waveform was formed from the smoothed image as the average of the three time lines at x0 − 0.2 μm, x0, and x0 + 0.2 μm. The time of peak of this waveform was used as the initial estimate of t2. A ΔF/F vs. x waveform was then formed from the 3 × 3 smoothed image as the average of the three line scans at t2 − 2 ms, t2, and t2 + 2 ms and was fitted with a gaussian function (Eq. 2 of Hollingworth et al., 2001) to determine FWHM and the final estimate of x0. Finally, a ΔF/F vs. t waveform was obtained from the unsmoothed x-t image as an average of seven time lines at x0, x0 ± 0.2 μm, x0 ± 0.4 μm, and x0 ± 0.6 μm. This waveform was fitted with Eq. 1 of Hollingworth et al. (2001) to determine 0–100% rise time, peak amplitude, decay time constant, and FDHM. Analyzed sparks were accepted if peak amplitude satisfied ΔF/F ≥ 0.4 (Lacampagne et al., 1999) and the other morphological parameters satisfied the broad acceptance criteria described in Hollingworth et al. (2001).
Spark Mass and its Equivalence to the Volume Integral of Δ[FFluo]/[FFluo]R
ΔF/F is given by the convolution of Δ[FFluo]/[FFluo]R with the microscope PSF,
 |
(4) |
and mass (M) is defined as the volume integral of ΔF/F,
 |
(5) |
By changing the order of integration with respect to x′, y′, z′ and x, y, z, and using the fact that the volume integral of PSF equals 1, M can be written
 |
(6) |
Eq. 6 shows that M is equal to the increase in the total normalized amount of FFluo and that this equality does not depend on the spatial resolution of the confocal microscope. The equality holds for any PSF that is continuous in x, y, and z. Because the absolute value of Δ[CaFluo] + Δ[CaPrFluo] is much greater than the absolute value of 0.005 · Δ[Fluo] + 0.01 · Δ[PrFluo], Δ[FFluo] is approximately equal to Δ[Cafluo-3], and
 |
(7) |
Eq. 7 shows that the total amount of Ca2+ captured by fluo-3 is approximately equal to M(t) · [FFluo]R.
Statistics
For each set of noisy-spark simulations in Tables IV, V, and VII, sufficient sparks were generated to give 3,176 sparks for inclusion in the analysis. This number is the same as that in the measurements of Hollingworth et al. (2001) and in the simulations of Baylor et al. (2002). Values of the morphological parameters are reported as mean ± SEM. The statistical significance of a difference between means was evaluated with Student's two-tailed t test at P < 0.05.
TABLE IV.
Properties of Simulated Noisy Ca2+ Sparks in Cut Fibers at Three Concentrations of Troponin and Two Values of [Ca2+]R (Ca2+ Source Flux = 2.5 pA × 4.6 ms)
| 1 | 2 | 3 | 4 | 5 | 6 | 7 |
|---|---|---|---|---|---|---|
| Variables | ||||||
| [Troponin regulatory sites] (μM) | 432 | 216 | 0 | 432 | 216 | 0 |
| [Ca2+]R (nM) | 80 | 80 | 80 | 50 | 50 | 50 |
| Parameters | ||||||
| Peak amplitude at the Ca2+ source (ΔF/F) | 0.522 | 0.591 | 0.681 | 0.741 | 0.832 | 0.948 |
| Distance D (μm) | 0.358 ± 0.003 | 0.393 ± 0.003 | 0.443 ± 0.004 | 0.455 ± 0.004 | 0.496 ± 0.004 | 0.542 ± 0.004 |
| 0–100% rise time (ms) | 4.206 ± 0.028 | 4.223 ± 0.027 | 4.212 ± 0.026 | 4.343 ± 0.027 | 4.354 ± 0.026 | 4.348 ± 0.025 |
| Peak amplitude (ΔF/F) | 0.493 ± 0.001 | 0.516 ± 0.002 | 0.547 ± 0.002 | 0.560 ± 0.002 | 0.589 ± 0.002 | 0.630 ± 0.003 |
| Decay time constant (ms) | 5.173 ± 0.042 | 5.203 ± 0.041 | 5.086 ± 0.038 | 5.851 ± 0.042 | 5.670 ± 0.039 | 5.461 ± 0.036 |
| FDHM (ms) | 6.443 ± 0.032 | 6.403 ± 0.030 | 6.253 ± 0.028 | 6.994 ± 0.032 | 6.825 ± 0.030 | 6.612 ± 0.027 |
| FWHM (μm) | 1.317 ± 0.006 | 1.343 ± 0.006 | 1.383 ± 0.006 | 1.345 ± 0.005 | 1.378 ± 0.006 | 1.419 ± 0.005 |
| Spark mass (μm3) | 1.649 ± 0.029 | 1.774 ± 0.028 | 2.046 ± 0.036 | 1.877 ± 0.030 | 2.094 ± 0.032 | 2.368 ± 0.029 |
Mean ± SEM values are for 3,176 noisy sparks. The PSF and analysis procedures for cut fibers were used (Table I, column 3). Column 2 was simulated with the standard conditions for cut fibers; in columns 3–7, the concentration of the troponin regulatory sites and [Ca2+]R were varied as indicated. The amplitude criterion for spark acceptance was ΔF/F ≥ 0.4. Here and in Tables V and VII, spark mass was evaluated in each individual simulation. Consequently, the mean value of mass listed in the bottom row is somewhat different from the value obtained with Eq. 3 from the mean values of ΔF/F and FWHM.
TABLE V.
Properties of Simulated Noisy Ca2+ Sparks in Cut Fibers at Three Concentrations of Troponin and Two Values of [Ca2+]R (Variable Ca2+ Source Fluxes)
| 1 | 2 | 3 | 4 | 5 | 6 | 7 |
|---|---|---|---|---|---|---|
| Variables | ||||||
| [Troponin regulatory sites] (μM) | 432 | 216 | 0 | 432 | 216 | 0 |
| [Ca2+]R (nM) | 80 | 80 | 80 | 50 | 50 | 50 |
| Ca2+ source flux (pA) | 23 | 16 | 12 | 13 | 10 | 8 |
| Parameters | ||||||
| Peak amplitude at the Ca2+ source (ΔF/F) | 3.125 | 2.751 | 2.612 | 2.962 | 2.739 | 2.658 |
| Distance D (μm) | 0.996 ± 0.006 | 0.926 ± 0.006 | 0.917 ± 0.006 | 0.921 ± 0.006 | 0.895 ± 0.006 | 0.890 ± 0.006 |
| 0–100% rise time (ms) | 5.290 ± 0.036 | 5.136 ± 0.032 | 5.041 ± 0.030 | 5.189 ± 0.033 | 5.091 ± 0.031 | 4.958 ± 0.029 |
| Peak amplitude (ΔF/F) | 1.053 ± 0.011 | 1.060 ± 0.011 | 1.055 ± 0.011 | 1.060 ± 0.011 | 1.047 ± 0.011 | 1.054 ± 0.011 |
| Decay time constant (ms) | 10.443 ± 0.055 | 9.014 ± 0.049 | 8.050 ± 0.044 | 9.309 ± 0.050 | 8.263 ± 0.045 | 7.504 ± 0.042 |
| FDHM (ms) | 12.322 ± 0.066 | 10.239 ± 0.049 | 9.046 ± 0.039 | 10.730 ± 0.053 | 9.455 ± 0.043 | 8.559 ± 0.036 |
| FWHM (μm) | 1.718 ± 0.005 | 1.691 ± 0.005 | 1.701 ± 0.005 | 1.645 ± 0.005 | 1.637 ± 0.005 | 1.645 ± 0.005 |
| Spark mass (μm3) | 5.858 ± 0.044 | 5.659 ± 0.043 | 5.777 ± 0.045 | 5.157 ± 0.039 | 5.080 ± 0.039 | 5.209 ± 0.041 |
TABLE VII.
Properties of Simulated Noisy Ca2+ Sparks in Cut Fibers with an Increase in Diffusion Constants and an Increase in Myoplasmic Water Volume
| 1 | 2 | 3 | 4 | 5 | 6 | 7 |
|---|---|---|---|---|---|---|
| Variables | ||||||
| [Troponin regulatory sites] (μM) | 309 | 154 | 0 | 309 | 154 | 0 |
| [Ca2+]R (nM) | 80 | 80 | 80 | 50 | 50 | 50 |
| Ca2+ source flux (pA) | 22 | 18 | 14 | 13 | 11 | 9 |
| Parameters | ||||||
| Peak amplitude at the Ca2+ source (ΔF/F) | 2.909 | 2.793 | 2.619 | 2.866 | 2.770 | 2.631 |
| Distance D (μm) | 1.071 ± 0.007 | 1.063 ± 0.007 | 1.047 ± 0.007 | 1.027 ± 0.007 | 1.017 ± 0.007 | 1.003 ± 0.007 |
| 0–100% rise time (ms) | 4.895 ± 0.030 | 4.872 ± 0.029 | 4.782 ± 0.028 | 4.851 ± 0.029 | 4.777 ± 0.027 | 4.684 ± 0.026 |
| Peak amplitude (ΔF/F) | 1.057 ± 0.011 | 1.056 ± 0.011 | 1.041 ± 0.011 | 1.044 ± 0.011 | 1.050 ± 0.011 | 1.040 ± 0.011 |
| Decay time constant (ms) | 8.627 ± 0.050 | 7.934 ± 0.046 | 7.173 ± 0.042 | 7.883 ± 0.046 | 7.258 ± 0.042 | 6.619 ± 0.039 |
| FDHM (ms) | 9.961 ± 0.052 | 9.054 ± 0.043 | 8.199 ± 0.036 | 9.070 ± 0.043 | 8.367 ± 0.037 | 7.711 ± 0.033 |
| FWHM (μm) | 1.976 ± 0.007 | 1.989 ± 0.007 | 1.990 ± 0.007 | 1.910 ± 0.007 | 1.907 ± 0.007 | 1.916 ± 0.007 |
| Spark mass (μm3) | 8.866 ± 0.067 | 9.090 ± 0.069 | 9.067 ± 0.071 | 7.949 ± 0.063 | 8.004 ± 0.062 | 8.128 ± 0.067 |
This table is similar to Table V except that all diffusion constants in the model were multiplied by 1.3 and the concentrations of protein binding sites were divided by 1.4. As a result, the standard concentration of the troponin regulatory sites was 309 μM (=432/1.4 μM) (see first row under Variables). The concentrations of the other protein binding sites were: Ca2+/Mg2+ sites on parvalbumin, 1,071 μM; Ca2+ binding sites on the SR Ca2+ pump, 181 μM; sites for fluo-3 binding on protein, 2,143 μM. [Mg2+]R and the total concentrations of ATP and EGTA were the same as in Table I, column 3; the concentration of fluo-3 was at its standard value (100 μM).
RESULTS
The first part of this article describes simulations and measurements of spark mass in intact muscle fibers of frog. The most accurate estimates of mass are made when the scan line intersects the source of Ca2+ release. Experimentally, such “in focus” sparks, if elicited by depolarization, have the following average morphological properties: 0–100% rise time, ∼3.9 ms; peak ΔF/F, ∼1.9; decay time constant, ∼4.4 ms; FDHM, ∼5.5 ms; FWHM (measured at the time of peak ΔF/F), ∼1.0 μm (18°C, Table VII of Baylor et al., 2002; see also Fig. 3, B and D, described below). These and other properties of measured sparks in intact fibers are well simulated with spark model 2 of Baylor et al. (2002) with a Ca2+ source flux of 2.5 pA for 4.6 ms and [fluo-3T] = 100 μM. Except where noted, these conditions were used for the calculations.
Spark Mass Equals the Volume Integral of Δ[FFluo]/[FFluo]R
Fig. 1 A shows the time course of ΔF/F at the Ca2+ source for a standard noise-free simulated spark. The peak amplitude is 2.14 and the time of peak is 4.6 ms, the same as the flux duration. Fig. 1 B shows two nearly identical curves. One is the time course of “true” mass, M(t), calculated from its definition (Eq. 5). The other is the time course of the volume integral of Δ[FFluo]/[FFluo]R, which is equal to spark mass (Eq. 6); this equality does not depend on the spatial distribution of Δ[FFluo]/[FFluo]R or on the microscope PSF (see materials and methods). As expected from the theory, the two curves in Fig. 1 B are indistinguishable. At the time of peak ΔF/F (4.6 ms), the value of mass is 2.64 μm3. Although the Ca2+ source flux ceases at 4.6 ms, M(t) continues to increase; it reaches its peak value, 3.63 μm3, at 10.8 ms, 6.2 ms after the peak ΔF/F. The lag between cessation of Ca2+ release and the peak of mass arises from kinetic delays in the reactions between Ca2+ and fluo-3 in the myoplasmic environment (Harkins et al., 1993; Baylor and Hollingworth, 1998; Hollingworth et al., 2000). After 10.8 ms, mass decreases as Ca2+ dissociates from fluo-3 and is captured by parvalbumin and the SR Ca2+ pump.
Figure 1.
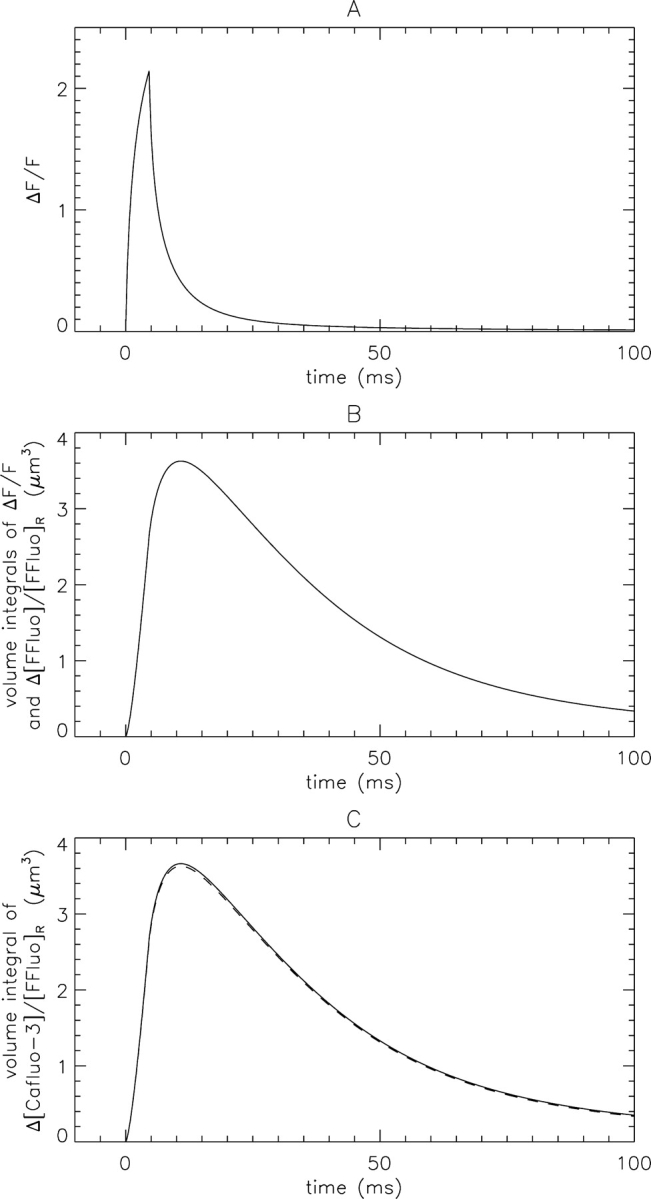
Calculated waveforms of a noise-free spark (Ca2+ flux = 2.5 pA × 4.6 ms beginning at time = 0). (A) Time course of ΔF/F at the source (x = y = z = 0). (B) Spark mass calculated from its definition (Eq. 5) and from an equivalent relation (Eq. 6). (C) The continuous curve is the volume integral of Δ[Cafluo-3]/[FFluo]R. The dashed curve is the mass curve from B.
The Volume Integral of Δ[Cafluo-3]/[FFluo]R ≈ Spark Mass
The continuous curve in Fig. 1 C shows the volume integral of Δ[Cafluo-3]/[FFluo]R. This is proportional to the amount of Ca2+ that is captured by fluo-3, which provides a lower limit of the amount of Ca2+ released during a spark. The peak value of the continuous curve in Fig. 1 C (3.66 μm3) times the value of [FFluo]R (4.22 μM at [Ca2+]R = 50 nM; see materials and methods) indicates that 9,312 Ca2+ ions are captured by fluo-3 (3.66 μm3 × 4.22 μM = 1.546 × 10⁻²⁰ moles). This represents ∼26% of the 35,888 Ca2+ ions that are released into the myoplasm by the 2.5 pA × 4.6 ms Ca2+ flux. The capture of about one-fourth of the released Ca2+ by fluo-3 indicates that the buffering action of 100 μM fluo-3 is not negligible during a spark.
The dashed curve in Fig. 1 C shows M(t). According to Eq. 7, which is illustrated by the similarity of the dashed and continuous curves in Fig. 1 C, the volume integral of Δ[Cafluo-3] is expected to be approximately equal to M(t) times [FFluo]R. The peak value of M(t) (3.63 μm3) times [FFluo]R (4.22 μM) gives 9,236 for the number of Ca2+ ions captured by fluo-3, which is 0.99 times the actual value.
Use of Eq. 3 to Estimate Spark Mass
Although spark mass depends on the spatial spread of ΔF/F in three dimensions, its value can be estimated with Eq. 3 from the spatial spread in the x direction only. Fig. 2 shows noise-free calculations that illustrate the estimation of spark mass (Me). Fig. 2, A and B, shows the time courses of ΔF/F and FWHM, respectively, at the source; these were obtained from fits of a gaussian function to the waveform of ΔF/F vs. x at different times t. The curve in Fig. 2 A differs slightly from that in Fig. 1 A, which is the actual temporal waveform of ΔF/F at the source. This difference arises because ΔF/F vs. x is not an exact gaussian function, either in the simulations or in the measurements (Fig. 9, B and E, of Baylor et al., 2002). In spite of this, the ΔF/F vs. t waveforms in Figs. 1 A and 2 A have similar peak amplitudes, the same time of peak (4.6 ms, which is the time at which the Ca2+ source flux terminates), and very similar overall time courses.
The continuous curve in Fig. 2 C shows Me(t), which was calculated with Eq. 3 from the curves in Fig. 2, A and B. The dashed curve is M(t) from Fig. 1 B, scaled by the factor 0.85 (the ratio of the peak amplitude of Me(t) to that of M(t)). This factor is different from unity because ΔF/F vs. x is not an exact gaussian function and because the microscope PSF, and consequently ΔF/F, is not symmetrical in x, y, and z (Table I B, column 2). As shown in Fig. 2 C, M(t) and Me(t) have identical times of peak (10.8 ms) but somewhat different overall time courses. This comparison shows that Eq. 3 is expected to give reasonable approximations of peak M(t) and of the time of peak M(t) for an in-focus spark. The approximation is less good, however, at the time of peak ΔF/F, where estimates of mass are frequently made.
Time Course of Mass in Simulated Noisy Sparks and in Sparks in Intact Fibers
Fig. 3 shows simulated data (asterisks) and measured data (open squares); 0 ms denotes the estimated time of peak ΔF/F. Each set of data was obtained from an average of 179 in-focus sparks, defined as the largest 10% of sparks with peak amplitude ΔF/F ≥ 0.7. Noise and variability were included in the simulated data to mimic the measurements (see materials and methods). Fig. 3 also shows the continuous curves from Fig. 2 time-shifted by −4.6 ms so that 0 ms corresponds to the time of peak ΔF/F. Fig. 3, A and B, show the time course of ΔF/F and Fig. 3, C and D, show FWHM. Both the simulated and measured values of FWHM become noisy after 12 ms; this occurs because ΔF/F becomes small and the noise in ΔF/F vs. x makes the gaussian fits less reliable. The simulated data in these panels are in reasonable agreement with the measured data, and, within the noise, both sets of data lie close to the curves, at least out to ∼40 ms.
Fig. 3, E and F, show Me(t). In both datasets, the time of peak mass is similar to that of the curve, 6.2 ms, consistent with the idea that, within the noise in the data, the kinetic delays in the reactions between Ca2+ and fluo-3 in myoplasm are adequately simulated with the model. After 12 ms, the values of mass become less reliable because of the noise in FWHM.
The simulations and measurements in Figs. 1–3 indicate that Eq. 3 provides reasonable estimates of the peak mass and time of peak mass of an in-focus spark.
Dependence of Simulated Spark Mass on the Amount of Ca2+ Released
Noise-free simulations of sparks at the source of Ca2+ flux were also used to study the dependence of M and Me on the total amount of SR Ca2+ released during a spark. Ca2+ release was varied by changing either the amplitude or the duration of the source flux. Fig. 4 shows mass at the time of peak ΔF/F (A) and at the time of peak true mass (B) plotted against the amount of Ca2+ released. For releases up to ∼30 fC, both true mass (filled symbols) and estimated mass (open symbols) vary approximately linearly with the amount of Ca2+ released. In both panels, the slope of the line fitted to estimated mass (dashed line) is smaller than that fitted to true mass (continuous line). The ratio of the slopes (dashed divided by continuous) is 0.545 in A and 0.832 in B. These simulations show that, for the range of Ca2+ releases considered, both the true and estimated mass of an in-focus spark are approximately proportional to the amount of SR Ca2+ released, with a proportionality constant that is smaller at the time of peak ΔF/F than at the time of peak mass. The proportionality constant for peak true mass (slope of the continuous line in Fig. 4 B) corresponds to the capture of 24.9% of the Ca2+ released from the SR by fluo-3 ([fluo-3T] = 100 μM).
Figure 4.

Spark mass (ordinate) vs. total SR Ca2+ release (expressed in fC = pA × ms), from simulations such as that illustrated in Figs. 1 and 2. M (filled symbols) and Me (open symbols) were evaluated at the time of peak ΔF/F (A) and of peak M (B). Squares were obtained with the standard Ca2+ source flux (2.5 pA × 4.6 ms); triangles were obtained with a flux amplitude of 2.5 pA and durations of 2, 3, 6, 8, 10, and 12 ms; circles were obtained with a flux duration of 4.6 ms and amplitudes of 2, 3, 4, 5, and 6 pA. The curves show least-squares fits of lines that intersect the origin. The slopes of the lines are 0.1335 and 0.2450 (A) and 0.2515 and 0.3023 (B).
Simulations of Sparks in Cut Fibers
Table II gives the average values of spark morphological parameters in intact fibers studied by us and in cut fibers studied in the Schneider laboratory; both laboratories use essentially identical functions to analyze sparks in space and time (Klein et al., 1997; Lacampagne et al., 1999; see materials and methods). Since the mean values of spark amplitude are similar in intact and cut fibers (0.99 and 1.05, respectively), the underlying Ca2+ source fluxes might also be expected to be similar in the two preparations. This turns out not to be the case, however, as is suggested by the larger value of spark mass in cut fibers and the association of spark mass with the amount of Ca2+ captured by fluo-3 that is described above. According to Eq. 7, at the time of peak ΔF/F, the amount of Ca2+ bound to fluo-3 during a cut fiber spark would be expected to be 4–5 times that in intact fibers (threefold increase in mass times 0.0608/0.0422, the ratio of the values of [FFluo]R for the values of [Ca2+]R and [fluo-3T] given in Table I). The simulations in the following sections elucidate the dependence of mean spark amplitude on Ca2+ source strength and other parameters.
TABLE II.
Values of Morphological Parameters Reported for Voltage-activated Ca2+ Sparks in Intact and Cut Fibers
| 1 | 2 | 3 |
|---|---|---|
| Parameters | Intact fibers | Cut fibers |
| 0–100% rise time (ms) | 4.4 ± 0.1 | 4.7 ± 0.1 |
| Peak amplitude (ΔF/F) | 0.99 ± 0.01 | 1.05 ± 0.03 |
| Decay time constant (ms) | 4.9 ± 0.1 | 8.5 ± 0.4 |
| FDHM (ms) | 6.3 ± 0.1 | 14.8 ± 0.3 |
| FWHM (μm) | 1.05 ± 0.01 | 1.51 ± 0.10 |
| Spark mass (μm3) | 1.38 | 4.36 |
Mean ± SEM values for intact fibers were measured at 18°C (Table VII of Hollingworth et al., 2001; amplitude criterion for spark acceptance, ΔF/F ≥ 0.5). Cut fiber values were measured at 22°C (Lacampagne et al., 1996, 1999; amplitude criterion, ΔF/F ≥ 0.4–0.5). Mass was calculated from the mean values of peak amplitude and FWHM with Eq. 3.
Effects of Fiber Conditions, Microscope PSF, and Analysis Procedures on Properties of Noise-free Sparks at the Ca2+ Source
Fig. 5 A shows the temporal waveforms of five sparks simulated with a Ca2+ source flux of 2.5 pA for 4.6 ms and with the scan line through the Ca2+ source. Trace a shows ΔF/F at x = 0 for the standard simulation conditions used for intact fiber sparks (Table I, column 2). Trace b shows ΔF/F from this same simulation but averaged at three spatial locations (x = −0.2, 0, and 0.2 μm), as is done in the analysis of sparks in intact fibers. Its amplitude is smaller than that of a because the values of ΔF/F at x = ±0.2 μm are smaller than that at x = 0. Both a and b were calculated with the PSF used for the experiments on intact fibers.
Figure 5.

Spark profiles in time (A) and space (B) from noise-free simulations at the Ca2+ source. Traces a–e were used to obtain the morphological parameters given in Table III, columns 2–6, respectively. See “Variables” in Table III for fiber conditions, PSF values, and analysis procedures used in these simulations.
Trace c is similar to b except that the broader PSF from the cut fiber experiments was used (Table I B, column 3). This decreased the peak value of ΔF/F from 1.808 in b to 1.040 in c. This shows that the difference in spatial resolution of the confocal microscopes used for the intact and cut fiber experiments is expected to make an almost twofold difference in the peak value of ΔF/F near the scan line. Trace d was calculated with the same cut fiber PSF used for c but with the cut fiber analysis procedures described in materials and methods. The difference between traces c and d is caused by the different number of spatial locations used for averaging the temporal waveforms: three in c (as used for intact fiber sparks) and seven in d (as used for cut fiber sparks).
Trace e was obtained in the same manner as trace d except that cut fiber conditions were used for the simulations (Table I A, column 3). The smaller amplitude of trace e is due mainly to the increase in [Ca]R from 50 to 80 nM. This increases the resting concentration of Ca2+-bound fluo-3 and hence resting fluorescence; as a result, a smaller ΔF/F signal is produced for a given Ca2+ flux (e.g., Jiang et al., 1999; Baylor et al., 2002).
The peak ΔF/F amplitudes in Fig. 5 A progressively decrease from a to e. Trace b, with a peak value of 1.808, represents the temporal waveform of a noise-free simulated intact fiber spark with the scan line through the Ca2+ source. Trace e, with a peak value of 0.522, is the comparable waveform for a cut fiber spark. These simulations show that, with a Ca2+ source flux of 2.5 pA for 4.6 ms and with the line scan through the Ca2+ source, a spark measured in a cut fiber is expected to have an amplitude that is ∼0.3 times that in an intact fiber.
Fig. 5 B shows the spatial waveforms of ΔF/F that accompany the traces in A. All waveforms in B have been scaled to a peak amplitude of unity to facilitate the comparison of the spatial spread of the sparks. The FWHMs of the waveforms progressively increase from 0.740 μm in a to 1.177 μm in d; waveforms in d and e are indistinguishable.
Additional information about the simulations in Fig. 5 is given in Table III , columns 2–6. From the intact fiber simulation of column 3 to the cut fiber simulation of column 6, there is a 71% reduction in peak amplitude, an 18% increase in FDHM, a 39% increase in FWHM, and a 23% reduction in spark mass.
TABLE III.
Variation of Ca2+ Spark Properties with Different Fiber Conditions, Microscope PSF, and Procedures for Spark Analysis (Ca2+ Source Flux = 2.5 pA × 4.6 ms)
| 1 | 2 | 3 | 4 | 5 | 6 |
|---|---|---|---|---|---|
| Traces in Fig. 1 | a | b | c | d | e |
| Variables | |||||
| Fiber conditions | intact | intact | intact | intact | cut |
| PSF FWHM: x, y, z (μm) | 0.2, 0.2, 0.5 | 0.2, 0.2, 0.5 | 0.5, 0.5, 1.0 | 0.5, 0.5, 1.0 | 0.5, 0.5, 1.0 |
| Analysis procedures | single line scan | intact | intact | cut | cut |
| Parameters | |||||
| 0–100% rise time (ms) | 4.60 | 4.60 | 4.60 | 4.60 | 4.60 |
| Peak amplitude (ΔF/F) | 2.144 | 1.808 | 1.040 | 0.781 | 0.522 |
| FDHM (ms) | 5.150 | 5.359 | 6.353 | 7.151 | 6.238 |
| FWHM (μm) | 0.740 | 0.844 | 1.095 | 1.177 | 1.172 |
| Spark mass (μm3) | 1.05 | 1.31 | 1.65 | 1.54 | 1.01 |
Parameter values were obtained directly from noise-free x-t waveforms centered at the Ca2+ source (Fig. 1) without the use of fitted functions. Fiber conditions and PSFs (intact and cut) are specified in Table I, A and B. In the analysis procedure in column 2, a single time line at x = 0 was used for ΔF/F vs. t and a single line scan at the peak was used for ΔF/F vs. x. The analysis procedures for intact and cut fibers in columns 3–6 are described in materials and methods.
Simulation of Noisy Sparks in Cut Fibers (Ca2+ Source Flux = 2.5 pA × 4.6 ms)
To further compare our spark simulations with the cut fiber measurements, noisy sparks were simulated and then were analyzed with the cut fiber procedures described in materials and methods. Table IV , column 2, shows the mean values of the morphological parameters obtained from 3,176 noisy sparks simulated with the conditions used for trace e in Fig. 5 and Table III, column 6, as described in Table I, column 3. In these simulations, the average value of D (the distance between the scan line and the spark source in the y-z plane) was 0.358 μm. The mean values of spark amplitude and mass (0.493 and 1.649 μm3, respectively) are much smaller than the measured values (1.05 and 4.36 μm3, respectively; Table II, column 3). In contrast, the simulated value of FWHM (1.317 μm) is close to the measured value (1.51 μm). These noisy simulations confirm that, if the values of the variables in Table I, column 3, apply to cut fibers, a Ca2+ source flux of 2.5 pA is too small to account for the amplitude and some of the other properties of sparks in cut fibers.
Simulations with Reduced Concentrations of Troponin (Ca2+ Source Flux = 2.5 pA × 4.6 ms)
Although the divalent cation binding sites on parvalbumin appear to be present at an approximately normal concentration in cut fibers (Irving et al., 1989), the Ca2+ regulatory sites on troponin may bind less Ca2+ than the sites in intact fibers (Melzer et al., 1986; Pape et al., 1995). To explore this possibility, noisy sparks were simulated with reduced troponin concentrations. The associated reduction in Ca2+ buffering would be expected to produce a larger spark amplitude for a given Ca2+ flux. Table IV, columns 3 and 4, show results for troponin concentrations of 0.5 and 0 times the standard value, respectively. These reductions produce only small increases in the mean values of spark amplitude and mass. Thus, even without Ca2+ binding to troponin, large differences remain between the amplitude and other parameters of these simulated sparks and measured sparks.
Simulations with Reduced [Ca2+]R (Ca2+ Source Flux = 2.5 pA × 4.6 ms)
Although the value of [Ca2+]R in cut fibers appears to be larger than that in intact fibers (Hollingworth et al., 2001; see also discussion), it was nonetheless of interest to determine the effect of reducing [Ca2+]R from 80 to 50 nM, the standard value used for spark simulations in intact fibers (Table I). This reduction is expected to reduce resting F and therefore increase ΔF/F for a given Ca2+ flux. Table IV, columns 5–7, are similar to columns 2–4 except that [Ca2+]R = 50 nM. Even without troponin (column 7), the mean values of spark amplitude and mass (0.630 and 2.368 μm3, respectively) are substantially smaller than those of the measurements (1.05 and 4.36 μm3, respectively).
Our conclusion from the results in Table IV is that a Ca2+ flux of 2.5 pA is too small to account for the amplitude and some of the other properties of sparks in cut fibers.
Simulation of Noisy Sparks in Cut Fibers with Mean ΔF/F ≈1.05 (Ca2+ Source Flux > 2.5 pA for 4.6 ms)
Table V shows results similar to those in Table IV except that, for each simulation condition, the Ca2+ flux amplitude was increased in units of 1 pA until average ΔF/F was ∼1.05, similar to that of the cut fiber measurements. In these simulations, sparks that satisfy the criterion ΔF/F ≥ 0.4 can be detected farther from the source so that the average values of D in Table V are substantially larger than those in Table IV. The values of the other parameters in Table V, columns 2–7, are broadly consistent with the experimental results in Table II, column 3. Consequently, none of the six combinations of [troponin] and [Ca2+]R can be definitely ruled out. As expected, the largest Ca2+ flux (23 pA, column 2) occurs with the standard values of [troponin] and [Ca2+]R, and the smallest flux (8 pA, column 7) occurs with [troponin] = 0 and [Ca2+]R = 50 nM. Even the 8 pA value is more than three times that required for the simulation of sparks in intact fibers, 2.5 pA.
Tables IV and V give the values of Ca2+ source flux and peak ΔF/F at the source for the six simulation conditions, columns 2–7. In each case, the relative increase in ΔF/F is smaller than the relative increase in the source flux. This indicates that the relation between ΔF/F at the source and source flux is convex (has a slope that decreases with increasing flux), perhaps due to factors such as the saturation of fluo-3 by Ca2+ near the source. The relation between mean ΔF/F and ΔF/F at the source is also convex. This occurs, as mentioned above, because, as source flux is increased, sparks that satisfy a fixed detection criterion such as ΔF/F ≥ 0.4 are detected farther from the source, as evidenced by an increase in the value of D. These distant sparks, of small amplitude, make a progressively larger contribution to the mean value of ΔF/F as the source flux is increased. As a result, the relation between mean ΔF/F and ΔF/F at the source is convex.
Simulations with Increased Myoplasmic Diffusion Constants and Increased Myoplasmic Water Volume
Table VI shows the apparent diffusion constants of six indicator dyes studied in cut fibers in the Chandler laboratory and in intact fibers in the Baylor laboratory. On average, apparent diffusion constants in cut fibers are ∼1.3 times those in intact fibers (Table VI, column 4). A possible explanation, which is supported by the measurements of Irving et al. (1987), is that the myoplasmic water volume is increased in cut fibers compared with intact fibers. These authors measured intrinsic birefringence (optical retardation per unit path length, which primarily reflects the birefringence of myosin) in both intact and cut fibers and found that cut fibers, on average, have values that are ∼0.85 times those in intact fibers. This suggests that the optical path length in cut fibers is 1/0.85 times that in intact fibers, and that myoplasmic water volume is increased according to the factor 1.4 (≈1/0.852). An increase in water volume would be expected to reduce the viscosity of myoplasm and, thus, to increase the actual diffusion constants of all diffusible myoplasmic constituents (including the indicator dyes). An increase in water volume would also be expected to dilute the concentrations of poorly diffusible myoplasmic constituents of high molecular weight, such as soluble and structural proteins, to which indicator molecules readily bind (e.g., Konishi et al., 1988; Kurebayashi et al., 1993). This reduction in concentration of binding sites would be expected to further increase the apparent diffusion constants of the indicators.
TABLE VI.
Apparent Diffusion Constants of Indicator Dyes in Intact and Cut Fibers (16°C)
| 1 | 2 | 3 | 4 |
|---|---|---|---|
| Apparent diffusion constant (10−6 cm2 s−1)
|
|||
| Indicator | Intact fibers | Cut fibers | Intact fibers/cut fibers |
| Arsenazo III | 0.12a | 0.22e | 1.83 |
| Antipyrylazo III | 0.21a | 0.24f | 1.14 |
| Phenol Red | 0.37b | 0.41g | 1.11 |
| PDAA | 0.98c | 1.07h | 1.09 |
| TMX | 0.97c | 1.20i | 1.24 |
| Fura-2 | 0.36d | 0.45j | 1.25 |
| Mean ± SEM | 1.28 ± 0.11 | ||
The apparent diffusion constants (columns 2 and 3) have been referred to 16°C based on the temperature of the original measurements (16–17°C for intact fibers; 13–18°C for cut fibers) and a Q10 of 1.3. Column 4 is the ratio of column 2 to column 3.
To investigate these possibilities, simulations similar to those in Table V, columns 2–7, were performed with two modifications: the diffusion constants in the model were multiplied by 1.3 and the concentrations of binding sites on myoplasmic proteins were divided by 1.4; these sites are the Ca2+ regulatory sites on troponin, the Ca2+ transport sites on the SR Ca2+ pump, the Ca2+/Mg2+ sites on parvalbumin, and the binding sites for fluo-3 on (unspecified) protein molecules (Baylor et al., 2002). Table VII , columns 2–7, give the results. The Ca2+ source fluxes in Table VII are all very similar to the corresponding fluxes in Table V (ranges, 9–22 pA and 8–23 pA, respectively). One noticeable difference in the morphological parameters is that the values of FWHM and spark mass in Table VII are 15–18% and 51–61% larger, respectively, than those in Table V and those in Table II, column 3. Since the values in Table V and Table II, column 3, are in good agreement, the assumptions underlying the simulations of Table VII may be less accurate than those of Table V.
Each of the two modifications used for Table VII was also tested separately. With the concentrations of the protein binding sites left unchanged but with the diffusion constants of the myoplasmic constituents increased by the factor 1.3, the Ca2+ fluxes required for these simulations ranged from 10 to 26 pA (not shown). When the diffusions constants were left unchanged and the concentrations of the protein binding sites were divided by the factor 1.4, the Ca2+ fluxes ranged from 7 to 18 pA (not shown). In both types of simulations, the increases in FWHM and spark mass were somewhat less marked than those in Table VII. For the first type of simulation, the increases in FWHM and mass were, respectively, 8–10% and 25–31% larger than the corresponding values in Table V; for the second type, the increases were 5–7% and 14–24%, respectively. These simulations, and those in Table VII, do not change the conclusion that Ca2+ sparks in cut fibers require a Ca2+ source flux that is 3–10-fold larger than that required in intact fibers.
DISCUSSION
General Properties of Spark Mass
This article shows that spark mass, defined as the volume integral of ΔF/F, is equal to the volume integral of Δ[FFluo]/[FFluo]R and that this equality does not depend on the PSF of the confocal microscope or on the spatial distribution of Δ[FFluo]. Furthermore, the amount of Ca2+ captured by fluo-3 is expected to be approximately equal to the product of mass and [FFluo]R. Simulations with the intact fiber model described by Baylor et al. (2002) show that fluo-3 captures about one-fourth of the Ca2+ released during a spark ([fluo-3T] = 100 μM). The time of maximal capture occurs 6.2 ms after that of peak ΔF/F, owing to kinetic delays in the reactions between Ca2+ and fluo-3 in the myoplasmic environment. Although spark mass depends on the values of ΔF/F in x, y, and z, the simulations show that, with the laser scan line positioned near the source of Ca2+ release, a reasonable estimate of spark mass can be obtained with Eq. 3 from the values of ΔF/F and FWHM obtained from the ΔF/F vs. x waveform. This method is believed to be more reliable than those used previously to estimate mass (next sections).
Signal Mass in Nonmuscle Cells
The concept of signal mass was introduced by Sun et al. (1998), who studied Ca2+ signaling events (“blips” and “puffs”) mediated by inositol-tris-phosphate in oocytes injected with the fluorescent Ca2+ indicator Oregon green 488 Bapta-1. Signal mass (the volume integral of ΔF/F) was estimated from ΔF/F vs. x with a method that is different from that used in this article. During blips (the smallest resolved events, ΔF/F ≈ 0.25), signal mass increased at about the same time as ΔF/F or shortly thereafter, and peak mass (∼5 μm3) was reached ≥15 ms after peak ΔF/F (Fig. 4 C of Sun et al., 1998). During puffs (larger events, ΔF/F ≈ 1–2), the peak value of mass was an order of magnitude larger (∼80 μm3) and it occurred ≥ 100 ms after the peak of ΔF/F (Fig. 4 D of Sun et al., 1998). The delay from peak ΔF/F to peak mass was attributed to a continued but diminished flux of Ca2+ into the cytoplasm.
Thus, the peak values of mass in oocytes are either comparable to, or many times larger than, that estimated for an averaged in-focus spark in frog intact muscle fibers (5–100 μm3 compared with ∼3.8 μm3) and the lag between peak ΔF/F and peak mass in oocytes is at least several times larger than that in intact muscle fibers (≥15 ms and ≥100 ms compared with ∼6 ms). Some of the lag in oocytes is likely due to kinetic delays in the reactions between Ca2+ and the indicator in the cytoplasmic environment, similar to the situation with sparks in frog intact muscle fibers.
Signal Mass in Cut Fibers
As far as we are aware, the only estimate of mass in cut muscle fibers was reported by Gonzalez et al. (2000). With Eq. 3, however, mass can be calculated from other articles if the values of ΔF/F and FWHM are given. Table VII in Hollingworth et al. (2001) tabulates such values at the time of peak ΔF/F: 3.7–5.2 μm3 for voltage-activated sparks in cut fibers and 4.4–22.5 μm3 for spontaneous sparks in permeabilized cut fibers (amplitude threshold for spark acceptance, ΔF/F ≥ 0.5 to 1.0). These values of mass are 2.5–15 times those obtained for voltage-activated sparks in intact fibers at the time of peak ΔF/F, 1.4–1.5 μm3.
In the paper by Gonzalez et al. (2000), frog fibers were permeabilized by saponin and exposed to Imperatoxin A, an agent that, in bilayer experiments, binds to open RYRs and induces a long-lived substate that has about one-third the normal conductance (Tripathy et al., 1998). The toxin-related events usually had an initial ΔF/F that was similar to a spark followed by a small maintained ΔF/F that lasted ∼1 s (Gonzalez et al., 2000). The spark-like event in their Fig. 2, A–D, had a peak ΔF/F ≈ 3, a FWHM at time of peak ΔF/F ≈ 1.9 μm, and a peak mass ≈ 50 μm3. An average of nine such events was simulated with a Ca2+ source flux of peak amplitude of ∼11 pA and half-duration of ∼9 ms (Fig. 2 F of Gonzalez et al., 2000). Both the peak mass of the single event, 50 μm3, and the amount of Ca2+ release estimated for the averaged event, ∼99 fC, are an order of magnitude larger than the values estimated for in-focus sparks activated by voltage in frog intact fibers, 3–4 μm3 (Fig. 3, E and F) and 11.5 fC, respectively.
Simulation of Sparks in Cut Fibers
The main conclusion of this article is that the simulation of Ca2+ sparks in cut fibers requires a Ca2+ source flux that is substantially larger than the 2.5 pA required to simulate sparks in intact fibers. The required source flux is also substantially larger than the 1.4 pA used in the spark simulations by the Schneider laboratory (Jiang et al., 1999). With the standard concentrations of troponin and resting Ca2+ in the cut fiber model, a Ca2+ source flux of 23 pA is required (Table V, column 2). Even under the extreme conditions that [Ca2+]R = 50 nM and the troponin regulatory sites bind no Ca2+ at all, a source flux of 8 pA is required (Table V, column 7), which is three times that required in intact fibers. Because the values of the morphological parameters in each row of Table V, columns 2–7, are close to one another and to those in the cut fiber experiments (Table II, column 3), all six model conditions in Table V produce a reasonable simulation of sparks in cut fibers. Thus, these simulations do not establish the likely value of [Ca2+]R or the concentration of the troponin sites available for Ca2+ binding. Similar conclusions apply to the simulations in Table VII, which include increases in myoplasmic diffusion constants and myoplasmic water volume. These simulations, which are in less satisfactory agreement with the measurements than those in Table V, also required large Ca2+ source fluxes (9–22 pA).
Comparisons with the Measurements and Simulations by the Ríos Laboratory
Voltage-activated Ca2+ sparks in cut fibers appear to be different in the Ríos and Schneider laboratories (Table VII of Hollingworth et al., 2001). For example, spark amplitude is substantially larger in the Ríos laboratory (1.85 ± 0.12; amplitude acceptance criterion, ΔF/F ≥ 0.6; 18 ± 1°C), even though the values of FWHM for the microscope PSF in the Ríos laboratory (0.47 μm in x and y and 1.44 μm in z; Ríos et al., 1999) are similar to or larger than those in the Schneider laboratory (0.5 μm in x and y and 1.0 μm in z, respectively; Table I, column 3). Since FWHM is slightly smaller in the Ríos laboratory (1.33 vs. 1.5 μm; Table VII of Hollingworth et al., 2001), spark mass is only slightly larger (5.2 vs. 4.36 μm3). The larger spark amplitude and slightly larger value of mass in the Ríos laboratory make it likely that the underlying Ca2+ source flux is at least as large as the 8–23 pA required for the simulation of sparks from the Schneider laboratory (row 3 of Tables V and VII). This expectation is in agreement with spark simulations by the Ríos laboratory, which required Ca2+ source fluxes of 8 to 27 pA, depending on conditions (Table IV of Ríos et al., 1999).
Significance of a Larger Amplitude Ca2+ Source Flux in Cut Fibers
A larger Ca2+ source flux in cut fibers could be caused by an increase in RYR single channel Ca2+ flux, an increase in mean open probability, an increase in the number of active RYRs per spark, or a combination of these possibilities. There are several differences between cut and intact fibers that might explain such an increase(s). First, as considered in the last section of results, cut fibers appear to be more hydrated than intact fibers and this swelling might alter RYR function, perhaps by changing the physical interactions between adjacent RYRs or between the RYRs and other proteins at the triadic junction. Second, the relative amplitude of fluo-3′s resting fluorescence at the z- and m-lines differs between intact fibers (Hollingworth et al., 2001) and cut fibers (Tsugorka et al., 1995; Klein et al., 1996; Lacampagne et al., 1996; Shirokova and Ríos, 1997). The cut fiber pattern can be mimicked in intact fibers by increasing the concentration of K+ in the bathing solution from 2.5 to 7.5–30 mM. Since an increase in [Ca2+]R accompanies an elevation in [K+], it seems likely that the pattern of fluo-3′s resting fluorescence is a rough indicator of [Ca2+]R. By this criterion, [Ca2+]R is larger in cut fibers than in intact fibers (Hollingworth et al., 2001). Third, the duration of an action-potential–stimulated Ca2+ transient progressively increases with time during a 2 h experiment in a cut, but not an intact, fiber (Maylie et al., 1987b,c). This increase, which occurs in the absence of changes in indicator concentration, suggests that Ca2+ uptake is progressively slowed during the 2-h period, perhaps because of a progressive loss of intrinsic myoplasmic Ca2+ buffers or of modulators that maintain the normal activity of the SR Ca2+ pump; a decrease in the concentration of parvalbumin does not appear to occur during this period (Irving et al., 1989). In addition to these three documented differences between cut and intact fibers, small mobile molecules such as monovalent and divalent ions, ATP, phosphocreatine, and peptides would be expected to diffuse out of a fiber after cutting so that the composition of myoplasm in cut fibers would be expected to become progressively different from that in intact fibers (even though additions are usually made to the cut fiber end-pool solution to keep the concentrations of some of these constituents near the normal range). For example, [Mg2+]R and [Ca2+]R, which strongly affect RYR function, are probably 0.5–0.7 mM and 0.08–0.1 μM, respectively, in cut fibers and ∼1 mM and ∼0.05 μM, respectively, in intact fibers (Table I).
The differences between cut and intact fibers listed above might account for some, perhaps all, of the increased Ca2+ source flux in cut fiber sparks. For example, an increase in [Ca2+]R in cut fibers would be expected to increase the activity of the SR Ca2+ pump, which, in turn, should increase free [Ca2+] inside the SR and thereby increase RYR single channel Ca2+ flux. The diffusive loss of small molecules from the myoplasm of cut fibers could, in theory, increase the Ca2+ flux through an RYR if channel blockers or modulators that decrease the mean open probability were removed. The smaller value of [Mg2+]R and the larger value of [Ca2+]R (and the possible associated increase in SR Ca2+ content) in cut fibers could increase the number of RYRs per spark by augmenting Ca2+-induced Ca2+ release, a process that has been described in cut fibers (Jacquemond et al., 1991; Stern et al., 1997; Gonzalez et al., 2000; see also Ríos and Pizarro, 1988). Although the cause(s) of the increased Ca2+ source flux in sparks in cut fibers is poorly understood at this time, the presence of this difference between RYR function in intact and cut fibers suggests that intact fibers contain structural or regulatory factors that are altered or missing in cut fibers—and, perhaps, in other disrupted preparations.
Acknowledgments
We thank Dr. Martin F. Schneider for helpful discussions regarding the measurement and interpretation of Ca2+ sparks in cut fibers.
This work was supported by grants from the U.S. National Institutes of Health to W.K. Chandler (AM 37643) and S.M. Baylor (NS 17620).
Olaf S. Andersen served as editor.
Footnotes
Abbreviations used in this article: FDHM, full duration at half maximum; FWHM, full width at half maximum; PSF, point-spread function.
References
- Baylor, S.M., S. Hollingworth, C.S. Hui, and M.E. Quinta-Ferreira. 1986. Properties of the metallochromic dyes arsenazo III, antipyrylazo III and azo 1 in frog skeletal muscle fibres at rest. J. Physiol. 377:89–141. [DOI] [PMC free article] [PubMed] [Google Scholar]
- Baylor, S.M., and S. Hollingworth. 1988. Fura-2 calcium transients in frog skeletal muscle fibres. J. Physiol. 403:151–192. [DOI] [PMC free article] [PubMed] [Google Scholar]
- Baylor, S.M., and S. Hollingworth. 1990. Absorbance signals from resting frog skeletal muscle fibers injected with the pH indicator dye, phenol red. J. Gen. Physiol. 96:449–471. [DOI] [PMC free article] [PubMed] [Google Scholar]
- Baylor, S.M., and S. Hollingworth. 1998. Model of sarcomeric Ca2+ movements, including ATP Ca2+ binding and diffusion, during activation of frog skeletal muscle. J. Gen. Physiol. 112:297–316. [DOI] [PMC free article] [PubMed] [Google Scholar]
- Baylor, S.M., S. Hollingworth, and W.K. Chandler. 2002. Comparison of modeled and measured calcium sparks in intact skeletal muscle fibers of the frog. J. Gen. Physiol. 120:349–368. [DOI] [PMC free article] [PubMed] [Google Scholar]
- Baylor, S.M., S. Hollingworth, and W.K. Chandler. 2003. Simulation and experimental estimation of spark mass in frog intact skeletal muscle fibers injected with fluo-3. Biophys. J. 82:385a. [Google Scholar]
- Chandler, W.K., S. Hollingworth, and S.M. Baylor. 2003. Simulation of calcium sparks in frog cut skeletal muscle fibers. 2003. Biophys. J. 82:385a. [DOI] [PMC free article] [PubMed] [Google Scholar]
- Cheng, H., W.J. Lederer, and M.B. Cannell. 1993. Calcium sparks: elementary events underlying excitation-contraction coupling in heart muscle. Science. 262:740–745. [DOI] [PubMed] [Google Scholar]
- Gonzalez, A., W.G. Kirsch, N. Shirokova, G. Pizarro, M.D. Stern, and E. Ríos. 2000. The spark and its ember: separately gated local components of Ca2+ release in skeletal muscle. J. Gen. Physiol. 115:139–157. [DOI] [PMC free article] [PubMed] [Google Scholar]
- Harkins, A.B., N. Kurebayashi, and S.M. Baylor. 1993. Resting myoplasmic free calcium in frog skeletal muscle fibers estimated with fluo-3. Biophys. J. 65:865–881. [DOI] [PMC free article] [PubMed] [Google Scholar]
- Hirota, A., W.K. Chandler, P.L. Southwick, and A.S. Waggoner. 1989. Calcium signals recorded from two new purpurate indicators inside frog cut twitch fibers. J. Gen. Physiol. 94:597–631. [DOI] [PMC free article] [PubMed] [Google Scholar]
- Hollingworth, S., C. Soeller, S.M. Baylor, and M.B. Cannell. 2000. Sarcomeric Ca2+ gradients during activation of frog skeletal muscle fibres imaged with confocal and 2-photon microscopy. J. Physiol. 526:551–560. [DOI] [PMC free article] [PubMed] [Google Scholar]
- Hollingworth, S., J. Peet, W.K. Chandler, and S.M. Baylor. 2001. Calcium sparks in frog intact skeletal muscle fibers. J. Gen. Physiol. 118:653–678. [DOI] [PMC free article] [PubMed] [Google Scholar]
- Irving, M., J. Maylie, N.L. Sizto, and W.K. Chandler. 1987. Intrinsic optical and passive electrical properties of cut frog twitch fibers. J. Gen. Physiol. 89:1–40. [DOI] [PMC free article] [PubMed] [Google Scholar]
- Irving, M., J. Maylie, N.L. Sizto, and W.K. Chandler. 1989. Simultaneous monitoring of changes in magnesium and calcium concentrations in frog cut twitch fibers containing antipyrylazo III. J. Gen. Physiol. 93:585–608. [DOI] [PMC free article] [PubMed] [Google Scholar]
- Jacquemond, J., L. Csernoch, M.G. Klein, and M.F. Schneider. 1991. Voltage-gated and calcium-gated calcium release during depolarization of skeletal muscle fibers. Biophys. J. 60:867–873. [DOI] [PMC free article] [PubMed] [Google Scholar]
- Jiang, Y.-H., M.G. Klein, and M.F. Schneider. 1999. Numerical simulation of Ca2+ “sparks” in skeletal muscle. Biophys. J. 77:2333–2357. [DOI] [PMC free article] [PubMed] [Google Scholar]
- Klein, M.G., H. Cheng, L.F. Santana, Y.-H. Jiang, W.J. Lederer, and M.F. Schneider. 1996. Two mechanisms of quantized calcium release in skeletal muscle. Nature. 379:455–458. [DOI] [PubMed] [Google Scholar]
- Klein, M.G., A. Lacampagne, and M.F. Schneider. 1997. Voltage dependence of the pattern and frequency of discrete Ca2+ release events after brief repriming in frog skeletal muscle. Proc. Natl. Acad. Sci. USA. 94:11061–11066. [DOI] [PMC free article] [PubMed] [Google Scholar]
- Konishi, M., A. Olson, S. Hollingworth, and S.M. Baylor. 1988. Myoplasmic binding of fura-2 investigated by steady-state fluorescence and absorbance measurements. Biophys. J. 54:1089–1104. [DOI] [PMC free article] [PubMed] [Google Scholar]
- Konishi, M., and S.M. Baylor. 1991. Myoplasmic calcium transients monitored with purpurate indicator dyes injected into intact frog skeletal muscle fibers. J. Gen. Physiol. 97:245–270. [DOI] [PMC free article] [PubMed] [Google Scholar]
- Kurebayashi, N., A.B. Harkins, and S.M. Baylor. 1993. Use of fura red as an intracellular calcium indicator in frog skeletal muscle fibers. Biophys. J. 64:1934–1960. [DOI] [PMC free article] [PubMed] [Google Scholar]
- Lacampagne, A., W.J. Lederer, M.F. Schneider, and M.G. Klein. 1996. Repriming and activation alter the frequency of stereotyped discrete Ca2+ release events in frog skeletal muscle. J. Physiol. 2497:581–588. [DOI] [PMC free article] [PubMed] [Google Scholar]
- Lacampagne, A., M.G. Klein, and M.F. Schneider. 1998. Modulation of the frequency of spontaneous sarcoplasmic reticulum Ca2+ release events (Ca2+ sparks) by myoplasmic [Mg2+] in frog skeletal muscle. J. Gen. Physiol. 111:207–224. [DOI] [PMC free article] [PubMed] [Google Scholar]
- Lacampagne, A., C.W. Ward, M.G. Klein, and M.F. Schneider. 1999. Time course of individual Ca2+ sparks in frog skeletal muscle recorded at high time resolution. J. Gen. Physiol. 113:187–198. (published erratum appears in J. Gen. Physiol. 2003. 121:179) [DOI] [PMC free article] [PubMed] [Google Scholar]
- Maylie, J., M. Irving, N.L. Sizto, G. Boyarsky, and W.K. Chandler. 1987. a. Calcium signals recorded from cut frog twitch fibers containing tetramethyl-murexide. J. Gen. Physiol. 89:145–176. [DOI] [PMC free article] [PubMed] [Google Scholar]
- Maylie, J., M. Irving, N.L. Sizto, and W.K. Chandler. 1987. b. Calcium signals recorded from cut frog twitch fibers containing antipyrylazo III. J. Gen. Physiol. 89:83–143. [DOI] [PMC free article] [PubMed] [Google Scholar]
- Maylie, J., M. Irving, N.L. Sizto, and W.K. Chandler. 1987. c. Comparison of Arsenazo III optical signals in intact and cut frog twitch fibers. J. Gen. Physiol. 89:41–81. [DOI] [PMC free article] [PubMed] [Google Scholar]
- Melzer, W., E. Ríos, and M.F. Schneider. 1986. The removal of myoplasmic free calcium following calcium release in frog skeletal muscle. J. Physiol. 372:261–292. [DOI] [PMC free article] [PubMed] [Google Scholar]
- Pape, P.C., D.-S. Jong, W.K. Chandler, and S.M. Baylor. 1993. Effect of fura-2 on action potential-stimulated calcium release in cut twitch fibers from frog muscle. J. Gen. Physiol. 102:295–332. [DOI] [PMC free article] [PubMed] [Google Scholar]
- Pape, P.C., D.-S. Jong, and W.K. Chandler. 1995. Calcium release and its voltage dependence in frog cut muscle fibers equilibrated with 20 mM EGTA. J. Gen. Physiol. 106:259–336. [DOI] [PMC free article] [PubMed] [Google Scholar]
- Ríos, E., and G. Pizarro. 1988. Voltage sensors and calcium channels of excitation-contraction coupling. News Physiol. Sci. 3:223–227. [Google Scholar]
- Ríos, E., M.D. Stern, A. Gonzalez, G. Pizarro, and N. Shirokova. 1999. Calcium release flux underlying Ca2+ sparks of frog skeletal muscle. J. Gen. Physiol. 114:31–48. [DOI] [PMC free article] [PubMed] [Google Scholar]
- Shirokova, N., and E. Ríos. 1997. Small event Ca2+ release: a probable precursor of Ca2+ sparks in frog skeletal muscle. J. Physiol. 502:3–11. [DOI] [PMC free article] [PubMed] [Google Scholar]
- Stern, M.D., G. Pizarro, and E. Ríos. 1997. Local control model of excitation-contraction coupling in skeletal muscle. J. Gen. Physiol. 110:415–440. [DOI] [PMC free article] [PubMed] [Google Scholar]
- Sun, X.-P., N. Callamaras, J.S. Marchant, and I. Parker. 1998. A continuum of InsP3-mediated elementary Ca2+ signalling events in Xenopus oocytes. J. Physiol. 509:67–80. [DOI] [PMC free article] [PubMed] [Google Scholar]
- Tripathy, A., W. Resch, L. Xu, H.H. Valdivia, and G. Meissner. 1998. Imperatoxin A induces subconductance states in Ca2+ release channels (ryanodine receptors) of cardiac and skeletal muscle. J. Gen. Physiol. 111:679–690. [DOI] [PMC free article] [PubMed] [Google Scholar]
- Tsugorka, A., E. Ríos, and L.A. Blatter. 1995. Imaging elementary events of calcium release in skeletal muscle cells. Science. 269:1723–1726. [DOI] [PubMed] [Google Scholar]