

Abstract
An in vitro preparation of the guinea-pig cornea was used to study the effects of changing temperature on nerve terminal impulses recorded extracellularly from cold-sensitive receptors. At a stable holding temperature (31–32.5°C), cold receptors had an ongoing periodic discharge of nerve terminal impulses. This activity decreased or ceased with heating and increased with cooling. Reducing the rate of temperature change reduced the respective effects of heating and cooling on nerve terminal impulse frequency. In addition to changes in the frequency of activity, nerve terminal impulse shape also changed with heating and cooling. At the same ambient temperature, nerve terminal impulses were larger in amplitude and faster in time course during heating than those recorded during cooling. The magnitude of these effects of heating and cooling on nerve terminal impulse shape was reduced if the rate of temperature change was slowed. At 29, 31.5, and 35°C, a train of 50 electrical stimuli delivered to the ciliary nerves at 10–40 Hz produced a progressive increase in the amplitude of successive nerve terminal impulses evoked during the train. Therefore, it is unlikely that the reduction in nerve terminal impulse amplitude observed during cooling is due to the activity-dependent changes in the nerve terminal produced by the concomitant increase in impulse frequency. Instead, the differences in nerve terminal impulse shape observed at the same ambient temperature during heating and cooling may reflect changes in the membrane potential of the nerve terminal associated with thermal transduction.
Keywords: action potential, thermal transduction, sensory receptor, extracellular recording
INTRODUCTION
In mammals, cold-sensitive receptors are found in a range of tissues exposed to the external environment (e.g., skin, nasal mucosa, and cornea). The site of thermal transduction in these receptors is thought to be the morphologically unspecialized (“naked”) endings of thinly myelinated (Aδ) and unmyelinated (C) sensory axons (Hensel et al., 1974; Hensel, 1981; Heppelmann et al., 2001). Because of the very small diameter of these sensory nerve endings (∼1 μm) and their indeterminate location in tissues such as skin, it has not been possible to determine the mechanisms of thermal transduction in cold-sensitive receptors directly. Instead, mechanisms have been inferred from recordings of impulse activity in the centrally projecting axons (Hensel and Zotterman, 1951; Hensel and Iggo, 1971; Kenshalo and Duclaux, 1977; Duclaux et al., 1980; for review see Hensel, 1981) and, more recently, from intracellular calcium measurements and electrophysiological recordings from the soma of cold-sensitive primary sensory neurons in culture (Suto and Gotoh, 1999; Reid and Flonta, 2001a, b; Viana et al., 2002).
These studies showed that, at static temperatures, cutaneous cold–sensitive receptors exhibit an ongoing cyclical pattern of orthodromically propagated action potentials. This activity has been attributed to a rhythmic oscillation in membrane potential at the site of action potential initiation (Hensel, 1981). It was also suggested that thermal transduction results in alterations in the frequency and amplitude of this membrane potential oscillation as well as changes in the overall level of membrane potential (Braun et al., 1980). The net result being that action potential discharge increases with cooling and decreases with heating. Studies of cultured cold–sensitive neurons have shown that these constitute a specific population of primary sensory neurons with distinct electrophysiological characteristics. Specific responses to temperature in cold-sensitive somata have been attributed to the presence of a nonselective cation channel that opens with cold and menthol (Suto and Gotoh, 1999; McKemy et al., 2002; Okazawa et al., 2002; Peier et al., 2002) and to the closure by cold of K+ conductances (Reid and Flonta, 2001a, b; Viana et al., 2002). However, in contrast with the afferent axons of cold-sensitive receptors, spontaneous impulse discharges were seldom observed in cultured cold–sensitive neurons. This difference suggests that the ion channels involved in regulating excitability (including the thermal transduction channels) and impulse generation are heterogeneously distributed in the cell body and the axonal branches of cold-sensitive neurons.
Recently, we described an extracellular recording technique that allows electrical activity to be recorded directly from the terminals of sensory axons in guinea pig cornea (Brock et al., 1998). The cornea is very densely supplied by small-diameter sensory axons that terminate abruptly as they approach the most superficial layer of the corneal epithelium. By applying a suction electrode to the epithelial surface of the cornea, nerve impulses can be recorded and identified as originating in single cold sensory nerve terminals (Brock et al., 1998, 2001), allowing the electrical changes induced by cold stimuli to be studied at the site where the thermal transduction mechanisms are expected to be preferentially located.
The present study investigated whether changes in nerve terminal impulse (NTI)* frequency that occur in cold-sensitive receptors during heating and cooling are associated with concomitant changes in NTI shape that reflect changes in the membrane potential of the nerve terminal. It is demonstrated that both NTI patterning and NTI shape are not simply dependent on the absolute temperature, but vary depending on the rate and direction of temperature change. As the NTIs are recorded directly from the sensory nerve terminals, it is likely that the observed changes in the NTI shape reflect, in part, changes in membrane potential associated with thermal transduction.
MATERIALS AND METHODS
All experimental procedures conformed to the Australian National Health and Medical Research Council guidelines and were approved by the University of New South Wales Animal Care and Ethics Committee.
Guinea pigs of both sexes and in the weight range 200–400 g were used. Animals were anesthetized with sodium pentobarbitone (100 mg/kg i.p.) and killed by decapitation. Both eyes were dissected free from their orbits and isolated along with a short length of optic nerve and the associated ciliary nerves. Eyes were mounted in a recording chamber and superfused at 5 ml min−1 with physiological saline of the following composition (mM): Na+ 151; K+ 4.7; Ca2+ 2; Mg2+ 1.2; Cl− 144.5; H2PO3 − 1.3; HCO3 − 16.3; glucose 7.8. This solution was gassed with 95% O2/5% CO2 to pH 7.4. Under control conditions, the temperature of the bathing solution was maintained at 31–32.5°C. The temperature of the bathing solution was monitored continuously by a thermocouple placed in close apposition to the surface of the cornea. The optic nerve and associated ciliary nerves were drawn into a suction-stimulating electrode. The ciliary nerves were electrically stimulated with a constant voltage stimulator (pulse width 0.1–0.5 ms, 5–30 V).
To record electrical activity from sensory nerve terminals, a glass recording electrode (tip diameter ∼50 μm) filled with physiological saline was applied to the surface of the corneal epithelium with slight suction (Brock et al., 1998). An Ag/AgCl electrode in the recording chamber served as the indifferent electrode. Electrical activity was recorded through an AC amplifier (Neurolog NL104; Digitimer Ltd; gain ×10,000, high pass filter set at 0.1 Hz), digitized at 44 kHz, and stored on magnetic tape using a two channel PCM recorder (A.R. Vetter Co., Inc.). The temperature of the bathing solution was recorded on the second channel. Recordings were only made from sites on the cornea where the NTIs were readily distinguished from the noise (∼10 μV peak-to-peak when low pass filtered at 3–5 kHz). At many sites on the corneal surface, electrically evoked or spontaneous electrical activity was either absent or too small to be analyzed.
Receptor Identification
The data presented were collected at recording sites where the electrical activity originated from a single nerve terminal. At these sites, electrical stimulation of the ciliary nerves evoked a single all-or-none NTI at the site of recording and the spontaneously occurring orthodromic NTIs could be collided with antidromically propagated, electrically evoked NTIs (see Brock et al., 1998). In the present study, only NTIs that were defined as originating in either polymodal nociceptors or cold-sensitive receptors were analyzed (see Brock et al., 1998). Polymodal nociceptors typically had low levels of ongoing NTI discharge (<1 Hz) and were excited by bath application of a low concentration of capsaicin (0.2–0.5 μM; supplied by Sigma-Aldrich). The cold-sensitive receptors had relatively high levels of ongoing NTI discharge (2–15 Hz) that occurred in a rhythmic manner and this activity was decreased by warming and increased by cooling the solution superfusing the cornea.
Controlling the Temperature of the Bathing Solution
The temperature of the superfusing solution was controlled using a feedback-regulated heater that warmed the solution entering the bath. In most experiments, temperature responses were produced by initially heating the superfusing solution from the normal holding temperature (31–32.5°C) to 37–38°C. This was done by setting the heater target temperature to a temperature 20°C above that required to maintain the normal holding temperature. When the required temperature (∼38°C) was reached, the heater was switched off and the superfusing solution allowed to cool passively until the temperature reached 28–26°C. The heater was then switched on and the superfusing solution heated back to the normal holding temperature. This was the standard protocol used to identify receptor type and also to investigate the effects of temperature on NTI frequency, NTI shape, and the latency of electrically evoked NTIs. In the experiments comparing the effects of fast and slow heating from the normal holding temperature, fast heating was produced using the standard protocol described above, whereas slow heating was produced by setting the heater target temperature to a temperature 7°C above that required to maintain the normal holding temperature. In the experiments comparing the effects of fast and slow cooling, the bathing solution was first heated from the normal holding temperature to ∼38°C at a fast rate. Switching the heater off as in the standard protocol produced fast cooling, whereas resetting the solution heater to the temperature required to maintain the normal holding temperature produced slow cooling. We chose to investigate the effects of cooling from an initially raised temperature (∼38°C) because, without active cooling, this allowed the rate of cooling to be most readily regulated.
Data Analysis
A MacLab data acquisition system (ADInstruments Pty Ltd.) was used to digitize (sampling frequency 20 kHz) the electrophysiological signals previously recorded on tape. Prior to digitizing, the signals were filtered using a low pass filter (cut-off, 3–5 kHz). Subsequent analysis was made with the computer program Igor Pro (Wavemetrics). Measurements of NTI amplitude and shape were taken from averages of 10–40 individual NTIs. Prior to averaging, NTIs were aligned in time at their peak positive amplitude. When NTIs occurred in high frequency, short bursts, their amplitude usually declined during the burst. For this reason only the first NTI in each burst was used to construct the average NTI. The temperature at the time of occurrence of each NTI during temperature responses was measured. The effects of changing temperature on the shape of averaged NTIs were assessed at 1 or 0.5°C intervals above and below the normal holding temperature. To do this analysis, the sets of consecutively occurring NTIs used to construct the averages were selected so that the mean temperature over which they occurred was within ± 0.1°C of these step changes in temperature.
The NTIs are diphasic (positive/negative) with a prominent positive-going component (see Brock et al., 1998). To determine the effects of temperature on the shape of NTIs, the positive amplitude of the NTI and the maximum rate of change of voltage during the initial upstroke and the downstroke of the NTI (maximum dV/dt and minimum dV/dt respectively) were measured. As the amplitude of NTIs changed during the temperature responses, changes in NTI time course were made after the maximum and minimum dV/dt were normalized with respect to NTI amplitude by dividing them by the positive-peak amplitude (for details see Brock et al., 2001).
Statistical comparisons were made with repeated measures ANOVAs or paired t tests as indicated. For the repeated measures ANOVAs, the degrees of freedom were adjusted using Huynh-Feldt adjustment factors. P < 0.05 was considered statistically significant.
RESULTS
Changes in Temperature at the Surface of the Eye
In determining the effects of temperature change on NTI frequency of occurrence and shape, one potential problem is that the temperature at the nerve terminal within the corneal epithelium may differ from that measured in the superfusing solution. To assess how closely changes in the temperature of the superfusing solution are correlated with changes in temperature of the eye's surface structures, the latency of NTIs evoked by electrical stimulation of the ciliary nerves at the rear of the eye was monitored. The parent axons of the corneal sensory nerves enter the sclera at the rear of the eye and run anteriorly in the suprachoroidal space or sclera to the cornea (see Belmonte et al., 1997).
Fig. 1 shows the effects of the standard heating and cooling protocol (see materials and methods) on the latency of NTIs evoked at 1 Hz in a single experiment. During heating and cooling, NTI latency decreased and increased respectively (Fig. 1, A and B). Fig. 1 C shows that NTI latency was linearly correlated with temperature and that there was no apparent delay or hysteresis depending on whether the superfusing solution was being heated or cooled. Similar findings were obtained in six other experiments. Since the conduction velocity of mammalian unmyelinated and myelinated axons depends linearly on temperature in the range 26 to 38°C (Paintal, 1965; De Jesus et al., 1973), these findings indicate that the temperature of the eye's surface structures, including the axons forming the ciliary nerves, follow that of the superfusing solution very closely.
Figure 1.
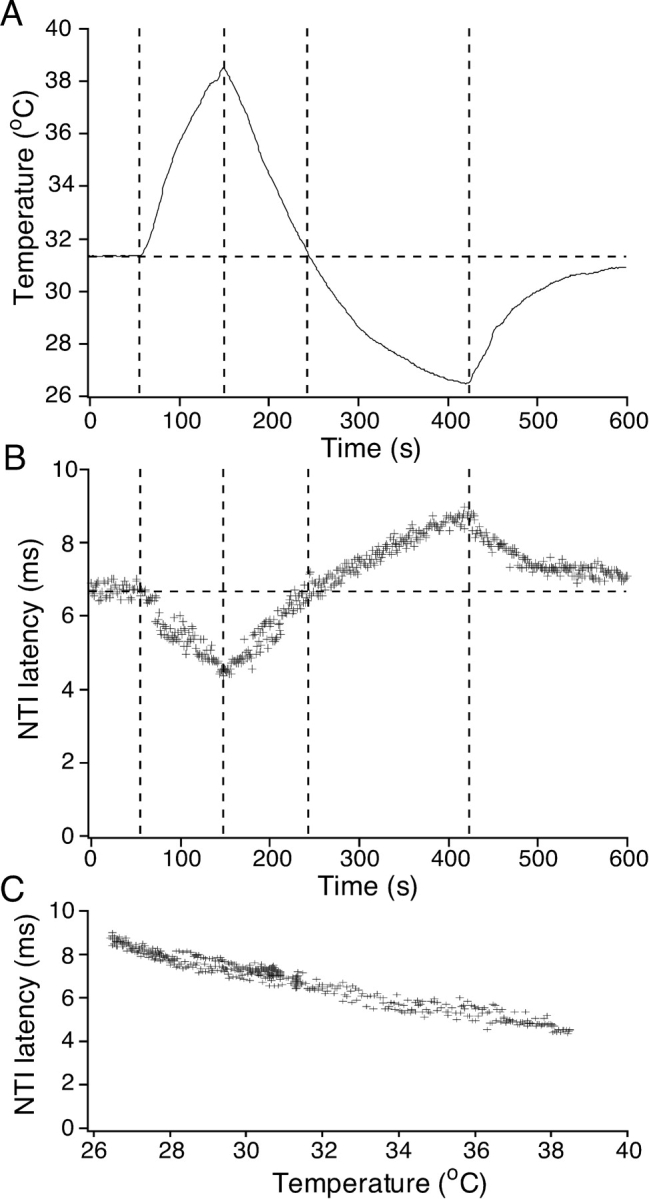
Effect of heating and cooling on the latency of electrically evoked NTIs in a cold-sensitive receptor. (A) The temperature of the bathing solution recorded close to the corneal surface. (B and C) The latency of the NTI is plotted against time (B) and temperature (C).
Temperature-induced Changes in the Frequency and Patterning of NTIs
Fig. 2 shows the effects of changing temperature on the occurrence of NTIs in a single cold-sensitive receptor. During this period of recording, the solution superfusing the cornea was heated from 31 to 37.6°C, cooled to 28.0°C, and then heated back to 31°C (Fig. 2 A). Fig. 2 B shows the number of NTIs occurring in each second. In the control period, before heating (between 0 and 90 s), the average NTI frequency was relatively constant at 6.9 NTIs s−1. During this period, NTIs occurred either singly or in bursts of two or occasionally three (Fig. 2, C and D). Fig. 2 C shows the interval between successive NTIs. Prior to heating, there was a bimodal distribution of intervals, comprised of long intervals (181 ± 33 ms; mean ± SD) and short intervals (28 ± 10 ms), the latter occurring during the bursts of NTIs. Fig. 2 D shows the number of NTIs that occurred between each long interval (i.e., each cycle). During the control period, the average number of NTIs in each cycle was 1.26 ± 0.50.
Figure 2.

Effect of heating and cooling on the frequency of ongoing NTI activity in a cold-sensitive receptor. (A) The temperature of the bathing solution recorded close to the corneal surface. (B and C) The effect of changing temperature on the frequency of NTIs (B) and the intervals between successive NTIs (C). Throughout most of the period of recording there was a cyclical pattern of NTI activity with NTIs occurring either singly or in bursts at regular intervals. (D) The number of NTIs that occurred during each cycle, i.e., between successive long intervals.
During heating, the average frequency of NTIs decreased to 5.5 s−1 between 110 and 120 s as the temperature approached 33°C. This reduction in NTI frequency was due primarily to the cessation of bursting, with little alteration in the duration of the long interval (Fig. 2, C and D). Above 33°C, the discharge of NTIs stopped and did not restart until the start of cooling at 180 s. At the start of cooling, NTIs occurred sporadically and as cooling progressed the interval between successive NTIs shortened. At ∼190 s (∼37°C), NTIs started to occur at relatively fixed intervals. Between 190 and 200 s, single NTIs occurred at intervals of 97 ± 26 ms and, throughout the subsequent period of cooling, the length of the long interval increased (Fig. 2 C). At ∼210 s, NTIs started to occur in bursts and the number of NTIs in each burst increased as the cooling progressed (Fig. 2 D). These changes in NTI patterning were associated with an increase in the average NTI frequency, above the control value, throughout most of the period of cooling (Fig. 2 B).
At the start of heating back to 31°C, there was an abrupt decrease in the length of the bursts (Fig. 2 D). At ∼29°C during cooling and heating, the number of NTIs in each cycle was 2.4 ± 1.6 (between 270–280 s) and 1.4 ± 0.7 (between 320 and 330 s), respectively. During heating back to 31°C, there was also a decrease in the long interval. Between 500 and 600 s, when the temperature had returned to 31°C, the average frequency of NTI discharge (7.8 s−1) was slightly higher than that recorded before heating.
Effects of heating and cooling similar to those described above were observed in 83 of 121 cold-sensitive receptors. In the remaining 38 cold-sensitive receptors, the pattern of NTI occurrence during cooling was different to that described above. In these receptors, the bursting pattern of NTI occurrence during cooling changed to a continuous high frequency discharge toward the end of the cooling period (at temperatures <30°C). The bursting pattern of NTI occurrence was restored shortly after the initiation of heating back to the control temperature. Although heating from the control temperature markedly reduced NTI frequency in all receptors, not all receptors were silenced. Furthermore, in those receptors that were silenced, there was considerable variability in the temperature at which NTI activity ceased.
Table I shows various measures of NTI patterning for 20 experiments determined before heating (control temperature), at the control temperature during cooling, and at the end of the temperature response when the temperature was stable. The increase in NTI frequency during cooling was associated with a shortening of the cycle time (i.e., the time between the start of each long interval) and an increase in the number of NTIs in each cycle. The mean interval between NTIs within the bursts (intraburst interval) during cooling did not differ from the control value. At the end of the temperature response, the average NTI frequency and the number of NTIs in each cycle were not significantly different from control values, but the cycle time was shorter and the intraburst interval was longer.
TABLE I.
Cooling-induced Changes in NTI Patterning
| Temperature | NTI frequency | Cycle time | NTIs cycle−1 | Intra burst interval | |
|---|---|---|---|---|---|
| °C | impulses s−1 | ms | ms | ||
| Start (control) | 31.6 ± 0.2 | 7.75 ± 1.64 | 182 ± 8 | 1.39 ± 0.16 | 21 ± 2 |
| Cooling | 31.6 ± 0.2 | 12.39 ± 2.44a | 146 ± 7a | 1.81 ± 0.22a | 22 ± 1 |
| End | 31.4 ± 0.1 | 8.22 ± 1.76 | 174 ± 8b | 1.41 ± 0.17 | 26 ± 3c |
The data were obtained from 20 cold-sensitive receptors (mean ± SEM). For each receptor the mean temperature, NTI frequency, cycle time (i.e., the time between the start of successive long intervals), number of NTIs in each cycle, and the mean intraburst interval was determined for 5-s periods before heating (control), at the control temperature during cooling, and at the end of the temperature response, at a time when the temperature was stable. Comparisons for each parameter were first made by repeated measures ANOVA. Subsequent pairwise comparisons with control values were made with paired t tests. P values were corrected for multiple comparisons using the Dunn-Sidak method.
P < 0.001.
P < 0.05.
P < 0.01.
Temperature-induced Changes in NTI Shape
Fig. 3 shows the effects of heating and cooling on the frequency of NTI occurrence and NTI shape for a single cold-sensitive receptor. The temperature and the number of NTIs occurring in each second are shown in Fig. 3, A and B, respectively. During the temperature response, the shape of the NTI varied with both absolute temperature and the direction of temperature change. Fig. 3 C shows averaged NTIs recorded during the temperature response. Shortly after initiating heating, the NTIs increased in amplitude and speeded in time course (compare NTIs at 31 and 32.5°C). Above 33°C, the discharge of NTIs practically ceased and did not recommence until shortly after the initiation of cooling (Fig. 3 B). During cooling the NTIs at 36°C were smaller in amplitude than those at 33°C during heating. As cooling progressed, the NTIs further decreased in amplitude and slowed in time course. This change was not simply a reversal of the effects of heating. For example, the NTIs at 33°C during cooling were smaller in amplitude and slower in time course than those recorded at the same temperature during heating. At the start of rewarming, the NTIs increased in amplitude and speeded in time course. Again, this change was not a reversal of the effects of cooling, as the NTIs at 27, 28, 29, and 30°C during rewarming were all larger in amplitude and faster in time course than those at the same temperatures during cooling. Fig. 3 D shows the normalized maximum and minimum dV/dt for averages of successive sets of 20 NTIs recorded throughout the temperature response. This plot shows the relatively abrupt changes in the time course of NTIs that occurred at the start of heating and when the direction of temperature change was reversed.
Figure 3.

Effect of heating and cooling on the shape of ongoing NTIs in a cold-sensitive receptor. (A) The temperature of the bathing solution recorded close to the corneal surface. (B) The effect of changing temperature on the frequency of NTIs. (C) Averaged NTIs recorded throughout the period of heating (↑) and cooling (↓). (D) The normalized maximum and minimum dV/dt of averages of successive sets of 20 NTIs. NTIs were larger in amplitude and faster in time course during heating compared with those recorded at the same temperature during cooling.
Fig. 4 shows the mean changes in positive amplitude (Fig. 4 A) and normalized maximum and minimum dV/dt (Fig. 4, B and C) of averaged NTIs recorded during temperature responses for 23 receptors. In these plots, changes in both temperature and NTI parameters are presented relative to their values determined just before starting the temperature response. However, not all receptors were tested over the full range of temperatures and only 8 of the 23 receptors continued to discharge NTIs during heating at temperatures 5°C above the starting temperature. For this reason, statistical comparisons using multivariate repeated measures ANOVAs were restricted to datasets between 1 and 4°C above the starting temperature (n = 14) and between −1 and −3°C below the starting temperature (n = 18). Both above and below the starting temperature, the maximum and minimum dV/dt of NTIs increased with temperature (Fig. 4, E and F). The positive amplitude of NTIs also increased with temperature below the starting temperature but not above the starting temperature (Fig. 4 D). Above the starting temperature, the positive amplitude and the normalized maximum and minimum dV/dt of NTIs were larger during heating than during cooling (Fig. 4, D–F). In addition, for the effects on the positive amplitude and the normalized maximum dV/dt, there was a significant interaction between the direction of temperature change and temperature (Fig. 4, D and E). This interaction indicates that for both of these parameters the slope of their relationship with temperature differed significantly between heating and cooling. Below the starting temperature, the positive amplitude and the normalized minimum dV/dt were larger during heating than during cooling (Fig. 4, D and F). Thus, NTIs were larger in amplitude and faster in time course during heating than those recorded at the same temperature during cooling.
Figure 4.

Effects of heating and cooling on the positive amplitude (A and D) and the normalized maximum (B and E) and minimum dV/dt (C and F) of NTIs recorded from cold-sensitive receptors. In these graphs the change in each NTI parameter and the change in temperature is plotted relative to values measured just before initiating heating (control temperature). (A–C) Compiled mean data for 23 cold-sensitive receptors during heating (circles) and cooling (squares). The arrows indicate the direction of temperature change. Because NTI activity ceased in many receptors during heating and the range of temperatures studied varied between receptors, the n value for each point varies between 7 and 23. (D–F) Selected datasets for each parameter measured at the same temperatures during heating (circles) and cooling (squares) from individual receptors, above (open symbols, n = 14) and below (filled symbols, n = 18) the control temperature. Statistical comparisons were made using multivariate repeated measures. For each parameter the effects of temperature (↔, *), the direction of temperature change (↔, †), and their interaction (‡) were compared. The error bars are SEMs. ns = not significant. *, †, and ‡: P < 0.05; ** and ††: P < 0.01; ***: P < 0.001.
For the experiments shown in Fig. 4, the positive amplitude and the normalized maximum and minimum dV/dt of the NTIs at the start and the end of the temperature response were not significantly different (paired t test; positive amplitude P = 0.11; normalized maximum dV/dt P = 0.43; normalized minimum dV/dt P = 0.17).
Effects of Changing the Rate of Heating and Cooling on NTI Frequency and Shape
To investigate whether the response of cold-sensitive receptors to heating and cooling depends on the rate of temperature change, the effects of fast and slow heating and cooling were determined.
Heating
NTI discharge and shape were examined during fast heating (0.104 ± 0.011°C s−1) and slow heating (0.026 ± 0.006°C s−1) from a initial temperature of 32.1 ± 0.1°C (range 31.4–32.6°C). Only receptors that continued to discharge NTIs up to 3°C above the starting temperature, during fast heating, were analyzed (n = 9). Fig. 5, A and B show recordings of temperature and the change in NTI frequency during fast (Fig. 5 A) and slow (Fig. 5 B) heating for a single receptor. Fig. 5 also shows the mean effects of fast and slow heating on NTI frequency (Fig. 5 C), positive NTI amplitude (Fig. 5 D), and the normalized maximum and minimum dV/dt of NTIs (Fig. 5, E and F). Both fast and slow heating produced a temperature-related reduction in NTI frequency and the magnitude of this effect was significantly larger during fast heating (Fig. 5 C). There was also a significant interaction between the rate of heating and temperature on NTI frequency (Fig. 5 C). This interaction indicates that the slope of the relationship between NTI frequency and temperature was different during fast and slow heating. There was also a greater increase in the positive amplitude of NTIs during fast heating compared with slow heating (Fig. 5 D). However, the differential effect of fast and slow heating on the positive amplitude of the NTIs appeared during the initial phase of heating and showed no temperature dependence (Fig. 5 D, see also Fig. 4 D). Both the normalized maximum and minimum dV/dt of the NTIs increased with temperature (Fig. 5, E and F) and there was no significant difference between the effects of slow and fast heating, nor was there a significant interaction between temperature and heating rate for these parameters.
Figure 5.

Effects of fast and slow heating on the frequency of ongoing NTIs (A–C) and their positive amplitude (D) and normalized maximum (E) and minimum dV/dt (F). In these graphs the change in each NTI parameter and the change in temperature is plotted relative to values measured just before initiating heating (control temperature). (A and B) The effects of fast (A) and slow (B) heating of the bathing solution on NTI frequency are shown for a single cold-sensitive receptor. In both (A) and (B), the upper panel shows the temperature of the bathing solution, recorded close to the corneal surface, and the lower panel shows the frequency of NTIs. (C–F) Data for 9 cold-sensitive receptors. For each parameter the effects of temperature (↔, *), the rate of temperature change (↔, †), and their interaction (‡) were compared. For NTI frequency and the normalized maximum and minimum dV/dt of NTIs, statistical comparisons were made with multivariate repeated measures ANOVAs. Because the effects of fast heating on the positive amplitude of NTIs varied much more markedly than those of slow heating, nonparametric statistical comparisons were made for this parameter. A Wilcoxon rank-sign test was used to compare the effect of heating rate and Friedman tests were used to assess the effects of temperature and the interaction between the effects of rate of heating and temperature. The error bars are SEMs. ns = not significant; †, P < 0.05; ** and ††, P < 0.01; *** and ‡‡‡, P < 0.001.
Cooling
In the cooling experiments (n = 10), the preparations were first heated to ∼38°C and then cooled. For each receptor, measurements of NTI frequency and shape during fast cooling (0.080 ± 0.004°C s−1) and slow cooling (0.016 ± 0.001°C s−1) were made at 0.5°C intervals between 4°C and 0.5°C above the starting temperature (32.1 ± 0.1°C, range 31.6–32.5°C). Fig. 6, A and B , show recordings of temperature and the change in NTI frequency during fast (Fig. 6 A) and slow (Fig. 6 B) cooling for a single receptor. Fig. 6 also shows the mean effects of fast and slow cooling on NTI frequency (Fig. 6 C), positive NTI amplitude (Fig. 6 D), and the normalized maximum and minimum dV/dt of NTIs (Fig. 6, E and F). Fast cooling produced a greater increase in NTI frequency than slow cooling. However, during cooling NTI frequency did not significantly change over the range of temperatures tested. There was a significant interaction between the effects of cooling rate and temperature on NTI frequency (Fig. 6 C), indicating that the relationship between NTI frequency and temperature differed for fast and slow cooling. Cooling was also associated with a temperature-related decrease in the positive amplitude and the normalized maximum and minimum dV/dt of the NTIs (Fig. 6, D–F). In addition, rapid cooling produced a greater decrease in all three of these parameters than did slow cooling (Fig. 6, D–F). The interaction of the effects of cooling rate and temperature on the positive amplitude and the normalized maximum and minimum dV/dt of the NTIs was not significant.
Figure 6.

Effects of fast and slow cooling on the frequency of ongoing NTIs (A–C) and their positive amplitude (D) and normalized maximum (E) and minimum dV/dt (F). In these graphs the change in each NTI parameter and the change in temperature is plotted relative to values measured just before initiating heating from the normal holding temperature (control temperature; ∼32°C). (A and B) The effects of fast (A) and slow (B) cooling of the bathing solution on NTI frequency are shown for a single cold-sensitive receptor. In both A and B, the top panel shows the temperature of the bathing solution and the lower panel shows the frequency of NTIs. (C–F) Data for nine cold-sensitive receptors. For each parameter the effects of temperature (↔, *), the rate of temperature change (↔, †), and their interaction (‡) were compared. For all parameters statistical comparisons were made with multivariate repeated measures ANOVAs. The error bars are SEMs. ns = not significant; †, P < 0.05; ** and ††, P < 0.01; *** and ‡‡‡, P < 0.001.
Effects of Stimulation Frequency on Electrically Evoked NTIs
In the preceding sections, the changes in NTI shape observed at a particular temperature during heating and cooling were associated with changes in the frequency of NTI occurrence. As it is known that repetitive activity can modify action potential shape (Bourque, 1990), the observed changes in NTI shape may be produced by changes in the level of ongoing activity. To investigate the possibility that changes in NTI frequency may alter NTI shape, ciliary nerve stimulation was used to evoke antidromic NTIs at different frequencies. The effects of stimulation frequency on NTI shape were investigated at 29, 31.5, and 35°C.
Fig. 7 A shows the sequential average of 10 NTIs evoked during trains of 50 stimuli at 10, 20, and 40 Hz in a single receptor at 31.5°C. During the trains of stimuli there was a stimulation-dependent increase in the latency and positive amplitude of the electrically evoked NTIs that increased with the frequency of stimulation. For nine cold-sensitive receptors, Fig. 7 B shows the mean effect of stimulation frequency on the positive amplitude of NTIs at 31.5°C. At all frequencies of stimulation tested, the amplitude of NTIs increased during the trains of stimuli (repeated measures ANOVA, P < 0.01 at all frequencies). Similar effects of stimulation on the positive amplitude of NTIs were also observed at 29 and 35°C during trains of stimuli at 10, 20, and 40 Hz (repeated measures ANOVA, P < 0.01 for all frequencies at 29 and 35°C).
Figure 7.

Effects of stimulation frequency on NTIs evoked by electrical stimulation of the ciliary nerves. (A) Overlaid averages of successive sets of 10 sequential NTIs recorded during trains of 50 electrical stimuli at 10, 20, and 40 Hz in a cold-sensitive receptor. In A, the averaged NTIs are aligned by the time of the electrical stimulus (stimulus artifact not depicted). (B) The positive amplitude of the averages of successive sets of 10 sequential NTIs evoked during trains of 50 stimuli at 10, 20, and 40 Hz for 9 cold-sensitive receptors. In these graphs, the positive NTI amplitude is plotted relative to that of the average of the first set of 10 NTIs in the train. The error bars are SEMs.
Temperature-induced Changes in NTI Shape for Polymodal Receptors
Only six polymodal receptors had a sufficient level of ongoing NTI activity to assess the effect of temperature on NTI shape. Fig. 8 shows a temperature response in a single polymodal receptor. For this receptor, changing temperature had only a minimal effect on the frequency of NTI discharge (Fig. 8, A and B). In addition, while NTI time course did speed slightly as the temperature was increased, there were no differential effects of heating and cooling on NTI shape (Fig. 8, C and D). This receptor was activated by capsaicin (0.5 μM), suggesting that it was a polymodal receptor (Fig. 8 B). Similar findings were obtained for the other five polymodal receptors.
Figure 8.

Effect of heating and cooling on the shape of ongoing NTIs in a polymodal receptor. (A) The temperature of the bathing solution recorded close to the corneal surface. (B) The effect of changing temperature on the frequency of occurrence of NTIs. At the end of the recording period the receptor was excited by bath application of capsiacin (0.5 μM). (C) Averaged NTIs recorded throughout the period of heating (↑) and cooling (↓). (D) The normalized maximum and minimum dV/dt of averages of successive sets of 10 NTIs.
DISCUSSION
The pattern of NTI occurrence in guinea-pig corneal cold–sensitive receptors is similar to that reported for mammalian cutaneous cold–sensitive receptors (e.g., Schäfer et al., 1988; Heinz et al., 1990). These previous studies investigated impulse activity in the centrally projecting axons of cutaneous cold–sensitive receptors both at static temperatures and after rapid step changes in temperature. Cutaneous cold–sensitive receptors have a cyclical pattern of NTI discharge, with single or short bursts of impulses occurring at regular intervals. At static temperatures, the length of the cycle period and the number of impulses per cycle are inversely related to temperature. A step decrease in temperature evokes a high frequency discharge of impulses, whereas a step increase in temperature produces a marked reduction, or cessation, of impulse activity. In both cases, after the change in temperature, the receptors adapt to a new static level of activity within 1–2 min. In most studies, it has been reported that the static discharge rate at a given temperature, after adaptation, is the same if that temperature is reached by cooling or heating (see Heinz et al., 1990), i.e., the static discharge rate signals the absolute temperature. However, in rat and monkey facial cold–sensitive receptors, adaptation at a particular temperature results in a higher level of static activity after a step decrease in temperature compared with a step increase in temperature (Dubner et al., 1975; Davies et al., 1985; c.f. Heinz et al., 1990).
In the present study, where the cornea was bathed with physiological solution and the electrode was applied close to the site of thermal transduction, it was not possible to produce step changes in temperature in the receptive field similar to those used in previous studies on cutaneous cold–sensitive receptors. Instead, the effects of more gradual changes in temperature affecting both the nerve terminal and preterminal axon were investigated. During these temperature responses, the NTI frequency measured at the same absolute temperature was greater during cooling than during heating. In addition, the magnitude of the effect of heating and cooling on NTI frequency increased with the rate of change of temperature. This effect of altering the rate of temperature change may be explained by the previously reported adaptation of the dynamic response to heating and cooling observed in cutaneous cold–sensitive receptors. While not shown here, when, after rapid heating, the temperature is held at 37–38°C for ∼1 min, the heating-induced decrease in NTI activity in corneal cold–sensitive receptors usually displays some adaptation during the period when temperature is no longer changing (unpublished data).
At 31–32°C, NTIs recorded from cold-sensitive receptors are produced by electrotonic invasion of the nerve terminal from a point more proximal in the axon where action potentials fail or are initiated (Brock et al., 2001). The extracellularly recorded NTIs are proportional to net membrane current, which is determined primarily by the capacitive current produced when the impulse invades the nerve terminal (Smith, 1988). Temperature is known to affect the rate of change of membrane potential during an action potential by altering the kinetics of voltage-activated ion channels (Russ and Siemen, 1996); the time course speeding with heating and slowing with cooling (Hodgkin and Katz, 1949; Li et al., 2002). Thus, it would be expected that NTIs would increase in amplitude and speed in time course when the temperature is raised. However, this effect of temperature on action potential time course cannot explain the differential effects of heating and cooling on the shape of NTIs recorded at the same absolute temperature.
The differential effects of heating and cooling on NTI shape were associated with changes in NTI frequency and might therefore reflect activity-dependent changes in membrane excitability. This possibility was investigated by determining the effects of stimulation frequency on the shape of electrically evoked NTIs. In corneal cold–sensitive receptors, the mean NTI frequency at 31–32°C during cooling was ∼13 Hz. Trains of electrical stimuli at frequencies between 10 and 40 Hz produced an activity-dependent increase in NTI amplitude. In addition, during the trains of stimuli, the latency of the electrically evoked NTI increased and, after trains at 20–40 Hz, there was a cessation of ongoing NTI activity that lasted for several seconds (unpublished data). It has been suggested that the slowing of conduction velocity produced by repetitive stimulation can be explained by a hyperpolarization of the axon produced by an increase in Na+/K+ ATPase activity (Rang and Ritchie, 1968; Morita et al., 1993; Serra et al., 1999). Activity-dependent hyperpolarization is also consistent with the cessation of spontaneous activity observed in cold-sensitive receptors after repetitive stimulation. Furthermore, as axonal hyperpolarization would be expected to increase the amplitude of the invading action potential (Morita et al., 1993), this can explain the activity-dependent increase in NTI amplitude. However, since the increase in NTI frequency produced by cooling was associated with a decrease in NTI amplitude, activity-dependent changes in membrane excitability, similar to those observed during repetitive electrical stimulation, cannot explain the differential effects of heating and cooling on NTI shape.
The effects of heating and cooling on NTI frequency and shape might be explained if heating hyperpolarizes the nerve terminal and cooling depolarizes the nerve terminal. The cyclical pattern of NTI activity in cold-sensitive receptors suggests that at some point within the nerve terminal arbor there is a pacemaker. The electronic spread of potential from the nerve terminals may regulate the frequency of NTI activity by interacting with this pacemaker. As voltage-dependent conductances are likely to underlie the pacemaker, the “receptor” potential may regulate the pacemaker currents as well as the likelihood of the membrane potential reaching threshold for action potential initiation. As the conductances involved in pacing would themselves be modulated by temperature, it seems probable that their temperature dependence would also contribute to the behavior of the cold-sensitive receptors. At present, the pacemaking conductances in cold receptors are unknown and, therefore, it is not possible to predict the effects of changing membrane potential or temperature on NTI patterning. However, it is likely that hyperpolarization of the nerve terminal would decrease NTI activity whereas depolarization of the nerve terminal would increase NTI activity.
Hyperpolarization and depolarization of the nerve terminal may also explain the observed effects of heating and cooling on NTI shape. At 31–32°C, hyperpolarization of the nerve terminal with focally applied extracellular current produces a marked increase in the amplitude of the negative-going component of cold-sensitive receptor NTIs (Carr et al., 2002). This change is caused by an increase in inward current and is abolished when the recording electrode is perfused with the local anesthetic, lidocaine. Under control conditions, locally applied lidocaine has only a small effect on the time course of cold-sensitive receptor NTIs (Brock et al., 2001; Carr et al., 2002). The simplest explanation is that under control conditions the nerve terminal is depolarized relative to the more proximal axon and, as a result, most of the Na+ channels present are inactivated. Hyperpolarization with extracellular current relieves Na+ channel inactivation and thereby allows active invasion of the nerve terminal. If the nerve terminals are normally depolarized relative to the more proximal axon, the spread of potential from the nerve ending would be expected to produce a progressive decrease in the number of inactivated Na+ channels proximal to the nerve terminal. If this is the case, heating-induced hyperpolarization would be expected to relieve Na+ channel inactivation proximal to the terminal and, as a result, the point at which the action potential fails to propagate actively would move toward the site of recording. Conversely, cooling-induced depolarization would be expected to increase the proportion of inactivated Na+ channels proximal to the nerve terminal and, as a result, the point at which the action potential fails to propagate actively would move away from the site of recording.
The effects of changing membrane potential at the nerve terminal on NTI shape were investigated numerically using a compartmental model for a length of axon with Hodgkin-Huxley action potential kinetics (Hodgkin and Huxley, 1952). NTIs were represented as net membrane current across the terminal compartment. Membrane potential changes that are expected to inactivate Na+ channels were mimicked by reducing the maximum Na+ conductance as a sigmoidal function of length in the terminal compartments. Fig. 9 shows the effect on simulated NTIs of shifting the sigmoid-scaled maximum Na+ conductance toward (mimicking depolarization) and away (mimicking hyperpolarization) from the nerve terminal. Mimicking the effects of changing the membrane potential on the Na+ conductance of the nerve terminal in this way produced an increase in amplitude and a speeding of time course of the NTI with hyperpolarization and a decrease in amplitude and slowing in time course of the NTI with depolarization. These changes in the amplitude and time course of the simulated NTIs are similar to those observed for cold-receptor NTIs at any particular ambient temperature during heating and cooling respectively (see Fig. 3 C). It is difficult to model the changes in NTI shape more precisely, since the type and density of ionic conductances in the nerve terminals are not known. However, the similarity of the changes in NTI shape produced by heating and cooling with those simulated by changing the spatial distribution of Na+ channels provides qualitative support for the idea that the nerve terminal depolarizes during cooling and hyperpolarizes during heating. This effect of changing temperature on membrane potential appears to be related to the process of thermal transduction in cold receptors, since for polymodal receptors, no differential effects of heating and cooling on NTI shape were observed (Fig. 8 D).
Figure 9.

Simulated NTIs calculated using a compartmental model for a length of axon incorporating the Hodgkin-Huxley equations. In this model, the maximum Na+ conductance decreased as a sigmoidal function of length in the terminal portion of the axon (A). NTIs are the net membrane current (i.e., the sum of capacitive and ionic currents) in the terminal compartment (B). To simulate the effects of changing the nerve terminal membrane potential on inactivation of the Na+ conductance, the sigmoid-scaled maximum Na+ conductance was shifted toward (hyperpolarization) or away (depolarized) from the terminal (A). For the Hodgkin-Huxley equations the following parameters were used: a maximum Na+ conductance of 120 mS cm−2 (multiplied by the scaling factor (A) in the terminal compartments) and a Na+ equilibrium potential of 115 mV (i.e., relative to the resting membrane potential); a maximum K+ conductance of 36 mS cm−2 and a K+ equilibrium potential of −12 mV; a leak conductance of 0.3 mS cm−2 and a leak equilibrium potential of 10.6 mV; a specific membrane capacitance of 1 μF cm−2 and a specific cytoplasmic resistance of 35 Ω cm. An axon diameter of 1 μm and compartment lengths of 50 μm were used. The action potentials were modeled at 6.3°C. The forward Euler method of integration was used with time steps of 0.5 μs.
Like the effects of changing temperature on NTI frequency, those on NTI shape depended on the rate of change of temperature. The more rapid the change in temperature the more pronounced the change in NTI shape. This effect is consistent with the previously reported adaptation of the dynamic response of cold receptors to heating and cooling (e.g., Schäfer et al., 1988; Heinz et al., 1990). In this respect it is important to note that the cold and menthol-induced increase in inward current in cultured cold–sensitive dorsal root ganglion neurons shows adaptation (Reid et al., 2002). Adaptation of a cold-induced current in the nerve terminals could presumably contribute to the differential effects of fast and slow cooling on frequency and NTI shape for cold receptors. Indeed, there are several candidate mechanisms that may individually or in concert contribute to the differential changes in NTI activity and shape during heating and cooling. We assume that it is the adaptation of the thermal transduction mechanism(s) in cold-sensitive receptors that is responsible for the differential effects on NTI frequency and shape when the receptor is warmed versus when it is cooled over the same absolute temperature range.
In conclusion, the findings of the present study suggest that the differential effects of heating and cooling on the configuration of cold-sensitive receptor NTIs reflect membrane potential changes associated with thermal transduction. The findings indicate that the nerve terminal membrane potential depolarizes with cooling and hyperpolarizes with heating. Consequently, to understand the mechanism underlying thermal transduction in cold-sensitive receptors, it is necessary to explain the effects of both heating and cooling.
Acknowledgments
This work was supported by the Australian Research Council (A09917169) and in part by grants SAF2001-1641 and FIS 01/1162 from the Spanish Government. J. Brock is a Senior Research Fellow of the Australian National Health and Medical Research Council.
Lawrence G. Palmer served as editor.
Footnotes
Abbreviation used in this paper: NTI, nerve terminal impulse.
References
- Belmonte, C., J. Garcia-Hirschfeld, and J. Gallar. 1997. Neurobiology of ocular pain. Prog. Retin. Eye Res. 16:117–156. [Google Scholar]
- Bourque, C.W. 1990. Intraterminal recordings from the rat neurohypophysis in vitro. J. Physiol. 421:247–262. [DOI] [PMC free article] [PubMed] [Google Scholar]
- Braun, H.A., H. Bade, and H. Hensel. 1980. Static and dynamic discharge patterns of bursting cold fibers related to hypothetical receptor mechanisms. Pflugers Arch. 386:1–9. [DOI] [PubMed] [Google Scholar]
- Brock, J.A., E.M. McLachlan, and C. Belmonte. 1998. Tetrodotoxin-resistant impulses in single nociceptor nerve terminals in guinea-pig cornea. J. Physiol. 512:211–217. [DOI] [PMC free article] [PubMed] [Google Scholar]
- Brock, J.A., S. Pianova, and C. Belmonte. 2001. Differences between nerve terminal impulses of polymodal nociceptors and cold sensory receptors of the guinea-pig cornea. J. Physiol. 533:493–501. [DOI] [PMC free article] [PubMed] [Google Scholar]
- Carr, R.W., S. Pianova, and J.A. Brock. 2002. The effects of polarizing current on nerve terminal impulses recorded from polymodal and cold receptors in the guinea-pig cornea. J. Gen. Physiol. 120:395–405. [DOI] [PMC free article] [PubMed] [Google Scholar]
- Davies, S.N., G.E. Goldsmith, R.F. Hellon, and D. Mitchell. 1985. Sensory processing in a thermal afferent pathway. J. Neurophysiol. 53:429–434. [DOI] [PubMed] [Google Scholar]
- De Jesus, P.V., I. Hausmanowa-Petrusewicz, and R.L. Barchi. 1973. The effect of cold on nerve conduction of human slow and fast nerve fibers. Neurology. 23:1182–1189. [DOI] [PubMed] [Google Scholar]
- Dubner, R., R. Sumino, and W.I. Wood. 1975. A peripheral “cold” fiber population responsive to innocuous and noxious thermal stimuli applied to monkey's face. J. Neurophysiol. 38:1373–1389. [DOI] [PubMed] [Google Scholar]
- Duclaux, R., K. Schäfer, and H. Hensel. 1980. Response of cold receptors to low skin temperatures in nose of the cat. J. Neurophysiol. 43:1571–1577. [DOI] [PubMed] [Google Scholar]
- Heinz, M., K. Schäfer, and H.A. Braun. 1990. Analysis of facial cold receptor activity in the rat. Brain Res. 521:289–295. [DOI] [PubMed] [Google Scholar]
- Hensel, H. 1981. Cutaneous thermoreceptors. Thermoreception and Temperature Regulation. H. Hensel, editor. Academic Press, London. 33–61.
- Hensel, H., K.H. Andres, and M. von During. 1974. Structure and function of cold receptors. Pflugers Arch. 352:1–10. [DOI] [PubMed] [Google Scholar]
- Hensel, H., and A. Iggo. 1971. Analysis of cutaneous warm and cold fibres in primates. Pflugers Arch. 329:1–8. [DOI] [PubMed] [Google Scholar]
- Hensel, H., and Y. Zotterman. 1951. The response of cold receptors to constant cooling. Acta Physiol. Scand. 22:96–113. [DOI] [PubMed] [Google Scholar]
- Heppelmann, B., J. Gallar, B. Trost, R.F. Schmidt, and C. Belmonte. 2001. Three-dimensional reconstruction of scleral cold thermoreceptors of the cat eye. J. Comp. Neurol. 441:148–154. [DOI] [PubMed] [Google Scholar]
- Hodgkin, A.L., and A.F. Huxley. 1952. A quantitative description of membrane current and its application to conduction and excitation in nerve. J. Physiol. 117:500–544. [DOI] [PMC free article] [PubMed] [Google Scholar]
- Hodgkin, A.L., and B. Katz. 1949. The effect of temperature on the electrical activity of the giant axon of the squid. J. Physiol. 109:240–249. [DOI] [PMC free article] [PubMed] [Google Scholar]
- Kenshalo, D.R., and R. Duclaux. 1977. Response characteristics of cutaneous cold receptors in the monkey. J. Neurophysiol. 40:319–332. [DOI] [PubMed] [Google Scholar]
- Li, H., B.G. Liu, M. Dobretsov, S.J. Brull, and J.M. Zhang. 2002. Thermosensitivity of large primary sensory neurons. Brain Res. 926:18–26. [DOI] [PubMed] [Google Scholar]
- McKemy, D.D., W.M. Neuhausser, and D. Julius. 2002. Identification of a cold receptor reveals a general role for TRP channels in thermosensation. Nature. 416:52–58. [DOI] [PubMed] [Google Scholar]
- Morita, K., G. David, J.N. Barrett, and E.F. Barrett. 1993. Posttetanic hyperpolarization produced by electrogenic Na(+)-K+ pump in lizard axons impaled near their motor terminals. J. Neurophysiol. 70:1874–1884. [DOI] [PubMed] [Google Scholar]
- Okazawa, M., K. Takao, A. Hori, T. Shiraki, K. Matsumura, and S. Kobayashi. 2002. Ionic basis of cold receptors acting as thermostats. J. Neurosci. 22:3994–4001. [DOI] [PMC free article] [PubMed] [Google Scholar]
- Paintal, A.S. 1965. Effects of temperature on conduction in single vagal and saphenous myelinated nerve fibres of the cat. J. Physiol. 180:20–49. [PMC free article] [PubMed] [Google Scholar]
- Peier, A.M., A. Moqrich, A.C. Hergarden, A.J. Reeve, D.A. Andersson, G.M. Story, T.J. Earley, I. Dragoni, P. McIntyre, S. Bevan, and A. Patapoutian. 2002. A TRP channel that senses cold stimuli and menthol. Cell. 108:705–715. [DOI] [PubMed] [Google Scholar]
- Rang, H.P., and J.M. Ritchie. 1968. On the electrogenic sodium pump in mammalian non-myelinated nerve fibres and its activation by various external cations. J. Physiol. 196:183–221. [DOI] [PMC free article] [PubMed] [Google Scholar]
- Reid, G., A. Babes, and F. Pluteanu. 2002. A cold- and menthol-activated current in rat dorsal root ganglion neurones: properties and role in cold transduction. J. Physiol. 545:595–614. [DOI] [PMC free article] [PubMed] [Google Scholar]
- Reid, G., and M.L. Flonta. 2001. a. Cold transduction by inhibition of a background potassium conductance in rat primary sensory neurones. Neurosci. Lett. 297:171–174. [DOI] [PubMed] [Google Scholar]
- Reid, G., and M.L. Flonta. 2001. b. Cold current in thermoreceptive neurons. Nature. 413:480. [DOI] [PubMed] [Google Scholar]
- Russ, U., and D. Siemen. 1996. Kinetic parameters of the ionic currents in myelinated axons: characterization of temperature effects in a hibernator and a nonhibernator. Pflugers Arch. 431:888–894. [DOI] [PubMed] [Google Scholar]
- Schäfer, K., H.A. Braun, and L. Kurten. 1988. Analysis of cold and warm receptor activity in vampire bats and mice. Pflugers Arch. 412:188–194. [DOI] [PubMed] [Google Scholar]
- Serra, J., M. Campero, J. Ochoa, and H. Bostock. 1999. Activity-dependent slowing of conduction differentiates functional subtypes of C fibres innervating human skin. J. Physiol. 515:799–811. [DOI] [PMC free article] [PubMed] [Google Scholar]
- Smith, D.O. 1988. Determinants of nerve terminal excitability. Neurology and Neurobiology. Vol. 35. Long-term Potentiation. P.W. Lanfield and S.A. Deadwyler, editors. Alan Liss Inc., New York. 411–438.
- Suto, K., and H. Gotoh. 1999. Calcium signaling in cold cells studied in cultured dorsal root ganglion neurons. Neuroscience. 92:1131–1135. [DOI] [PubMed] [Google Scholar]
- Viana, F., E. de la Pena, and C. Belmonte. 2002. Specificity of cold thermotransduction is determined by differential ionic channel expression. Nat. Neurosci. 5:189–190. [DOI] [PubMed] [Google Scholar]