

Abstract
The purpose of this study was to quantify the Ca2+ fluxes underlying Ca2+ transients and their voltage dependence in myotubes by using the “removal model fit” approach. Myotubes obtained from the mouse C2C12 muscle cell line were voltage-clamped and loaded with a solution containing the fluorescent indicator dye fura-2 (200 μM) and a high concentration of EGTA (15 mM). Ca2+ inward currents and intracellular ratiometric fluorescence transients were recorded in parallel. The decaying phases of Ca2+-dependent fluorescence signals after repolarization were fitted by theoretical curves obtained from a model that included the indicator dye, a slow Ca2+ buffer (to represent EGTA), and a sequestration mechanism as Ca2+ removal components. For each cell, the rate constants of slow buffer and transport and the off rate constant of fura-2 were determined in the fit. The resulting characterization of the removal properties was used to extract the Ca2+ input fluxes from the measured Ca2+ transients during depolarizing pulses. In most experiments, intracellular Ca2+ release dominated the Ca2+ input flux. In these experiments, the Ca2+ flux was characterized by an initial peak followed by a lower tonic phase. The voltage dependence of peak and tonic phase could be described by sigmoidal curves that reached half-maximal activation at −16 and −20 mV, respectively, compared with −2 mV for the activation of Ca2+ conductance. The ratio of the peak to tonic phase (flux ratio) showed a gradual increase with voltage as in rat muscle fibers indicating the similarity to EC coupling in mature mammalian muscle. In a subgroup of myotubes exhibiting small fluorescence signals and in cells treated with 30 μM of the SERCA pump inhibitor cyclopiazonic acid (CPA) and 10 mM caffeine, the calculated Ca2+ input flux closely resembled the L-type Ca2+ current, consistent with the absence of SR Ca2+ release under these conditions and in support of a valid determination of the time course of myoplasmic Ca2+ input flux based on the optical indicator measurements.
Keywords: Ca2+ release, myotube, mammalian muscle, excitation-contraction coupling
INTRODUCTION
Contractile activation in muscle is initiated by a massive efflux of Ca2+ ions from the SR. This Ca2+ flux is tightly controlled by the plasma membrane voltage (Melzer et al., 1995; Dirksen, 2002; see Fig. 2 A). In experiments on isolated muscle cells, SR Ca2+ release can be reproducibly triggered by plasma membrane depolarization. The precise synchronization with depolarization permits to study intracellular Ca2+ release in muscle cells in better kinetic detail than in any other cellular system. The release flux of Ca2+ from the SR can be derived from Ca2+ measurements with optical indicators. Its determination is equivalent to measuring the whole-cell currents of a plasmalemmal channel system and provides important information on the voltage-controlled gating of the Ca2+ release channels in the SR. The Ca2+ release is calculated as the time derivative of the total concentration change of Ca2+ in the myoplasmic water space during a depolarization, which is the sum of the changes in free, bound, and pumped Ca2+ (for a review see Ríos and Brum, 2002). Several methods to calculate the depolarization-controlled SR Ca2+ release flux have been reported. In one approach, estimates of the kinetic constants and intracellular concentrations of binding sites, necessary for the calculation, are obtained entirely from the biochemical literature (method 1). Baylor et al. (1983) used the myoplasmic Ca2+ transient measured with a metallochromic indicator and different sets of published values of the concentrations and rate constants. Melzer et al. (1984)(1987) used a reaction scheme to describe binding and transport and determined kinetic parameters of the scheme empirically by fitting calculated Ca2+ concentration changes to actually measured Ca2+ signals (Melzer et al., 1986a). In this “removal model fit” approach (method 2), the time course of the free Ca2+ concentration during the time interval after terminating a preceding depolarization is considered. It is assumed that release is turned off rapidly by repolarization and that removal can therefore be studied independently of release during this time. Once the model parameters are obtained by the fit, the release flux underlying the Ca2+ signal during the depolarization is calculated as in method 1. Combinations of method 1 and 2 using more complex schemes with a larger number of parameters (of which some were set to published values while others were determined by curve fitting) have subsequently been applied (González and Ríos, 1993; Shirokova et al., 1996). This general approach has also been extended to estimating flux rates of quantal Ca2+ release events (sparks) measured in microdomains of muscle cells using confocal laser scanning microscopy data (Ríos et al., 1999; Ríos and Brum, 2002). A different method (method 3) to estimate the time course of SR Ca2+ release rate based on the measurement of discrete Ca2+ release events has been reported by Klein et al. (1997) in a study on largely inactivated frog muscle fibers. The results were consistent with sparks being the quantal subunits of the global Ca2+ release (Schneider, 1999).
Figure 2.

Ca2+ input and removal in skeletal muscle. (A) Schematic diagram of the control of ryanodine receptor (RyR)-mediated Ca2+ release from the SR by the transverse tubular dihydropyridine receptor (DHPR). (B) Main compartments to which released Ca2+ is distributed (Baylor and Hollingworth, 1998; Jiang et al., 1999): fast binding sites on troponin C (T-sites), slow binding sites on troponin C and parvalbumin (P-sites), fast calcium binding by ATP, and binding and transport by the SR Ca2+-ATPase. (C) Simplified reaction scheme to account for binding and transport of released Ca2+ (see Eqs. 7–12): (1) Fast binding assumed to be instantaneous and linear (scaling factor F). (2) Slow binding (S, rate constants kon , S and koff , S and total concentration [S]total) dominated by EGTA in the experimental conditions. (3) Uptake assumed to be proportional to free calcium (rate constant kUptake). (4) Binding by the indicator dye (rate constants kon , Dye and koff , Dye and total concentration [Dye]total).
The Ca2+ release calculation can be facilitated by modifying intracellular conditions. González and Ríos (1993) introduced high concentrations of an external Ca2+ buffer, EGTA, into cut voltage-clamped muscle fibers to make the determination of Ca2+ release less dependent on intrinsic binding components. A similar approach was taken by Song et al. (1998) in isolated rat ventricular myocytes. Pape et al. (1995) likewise loaded muscle fibers with a high EGTA concentration (20 mM) and measured the protons released from EGTA in exchange for Ca2+ as an indirect way to track the largest fraction of Ca2+ release.
These methods were applied to mature amphibian and mammalian muscle cells. On the other hand, cultured myotubes which have been successfully used in many molecular physiology studies of EC coupling (for a review see Beam and Franzini-Armstrong, 1997) have not yet been characterized regarding their Ca2+ release properties in comparable detail. Method 1 was recently used by our laboratory on mouse and porcine myotubes (Dietze et al., 1998, 2000; Ursu et al., 2001) and a modified version of the method of Song et al. (1998) was applied to C2C12 myotubes (Schuhmeier et al., 2003). The results indicated that the Ca2+ signals originated mainly from intracellular release with characteristics similar to differentiated muscle fibers. In the present study we implemented the removal model fit method (method 2) to further investigate the dynamics of the voltage-controlled Ca2+ fluxes in voltage-clamped myotubes. The method allowed us to discriminate the different kinetic components of the Ca2+ flux underlying depolarization-induced Ca2+ transients and to study their voltage dependence. Comparison with the voltage-dependent Ca2+ inward current allowed us to estimate the fractional contribution of Ca2+ entry to the total Ca2+ flux and to test the fidelity of this approach to determine flux kinetics.
MATERIALS AND METHODS
Cell Culture
C2C12 myoblasts purchased from the American Type Culture Collection (CRL-1772) were grown in Dulbecco's modified eagle medium (DMEM, high glucose) containing 10% FCS. Cells were detached by trypsin (0.25%) in Ca2+- and Mg2+-free PBS. Within a day after reseeding in DMEM, FCS was replaced by 2% horse serum (HS) which led to the formation of myotubes. After one to two weeks myotubes were detached and seeded onto carbon- and collagen-coated coverslips for measurements (Schuhmeier et al., 2003). DMEM and trypsin were purchased from GIBCO BRL; FCS, HS, and PBS were from PAA Laboratories; and rat tail collagen (Type 1, C 7661) was from Sigma-Aldrich.
Solutions
The experimental solutions had the following composition (in mM): external solution, 140 tetraethylammonium hydroxide (TEAOH), 137 HCl, 10 CaCl2, 1 MgCl2, 10 HEPES, 2.5 4-aminopyridine (4-AP), 0.00125 tetrodotoxin (TTX); pH adjusted to 7.4 with HCl. In some experiments the external solution contained 30 μM cyclopiazonic acid (CPA) and 10 mM caffeine. Internal (pipette) solution, 145 CsOH, 110 HCl, 1.5 CaCl2 (free: 20 nM), 10 HEPES, 15 EGTA, 4 MgATP (5.5 total Mg), 5 Na creatine phosphate, 0.2 K5-fura-2; pH adjusted to 7.2 with CsOH.
Electrophysiology
Experiments were performed at room temperature (20–23°C). The whole-cell patch clamp configuration was used to control the membrane potential of the myotubes (amplifier LMPC, List-Medical; with range of capacitance compensation extended to 1,000 pF). Pipettes were fabricated from borosilicate glass (GC150TF-10; Clark Electromedical Instruments). Data acquisition was performed using a Digidata 1200 digitizer and the pCLAMP 7.0 software package (Axon Instruments, Inc.).
For I-V relations, the measured data points within a specified time interval (see results) were averaged. The currents I(V) were normalized by the linear capacitance to obtain current densities i(V). Plots of i(V) versus voltage were least-squares fitted with Eq. 1 and 2, which describe the total current as the sum of a linear leak current and of the voltage-gated Ca2+ current:
 |
(1) |
and
 |
(2) |
Here, gleak and Vleak are normalized conductance and reversal potential of the leak component and gCa,max and VCa are maximal normalized conductance and reversal potential of the L-type Ca2+ current. f (V) indicates voltage dependence of activation according to a standard Boltzmann-distribution and V 0.5 and k indicate voltage of half-maximal activation and voltage sensitivity, respectively.
Leak-corrected current densities iCa were converted to Ca2+ entry flux (expressed as total concentration change in the myoplasmic volume per time) using Eq. 3:
 |
(3) |
Here, z is the valence of the Ca2+ ion, F the Faraday constant, VC the total intracellular volume per membrane capacitance and fV the fraction of the total volume that is immediately accessible to Ca2+. For traces shown in the figures and for the calculation of Ai(0 mV) in Table III (see legend for definition) fV was arbitrarily set to its upper limit of 1. For VC we used the value of 0.23 liter F−1 determined by Schuhmeier et al. (2003).
TABLE III.
Parameters Describing the Voltage Dependence of Ca 2+ Input Flux and Ca 2+ Conductance for Individual Experiments
| Current | Peak | Plateau | ||||||||||||||||
|---|---|---|---|---|---|---|---|---|---|---|---|---|---|---|---|---|---|---|
| Cm | RS | gleak | Vleak | gCa,max | VCa | k | V0.5 | iCa (0 mV) | Ai (0 mV) | Apeak | kpeak | Vpeak | frpeak | Aplateau | kplateau | Vplateau | frplateau | |
| pF | mΩ | ps pF−1 | mV | ps pF−1 | mV | mV | mV | pA pF−1 | μM ms−1 | μM ms−1 | mV | mV | % | μM ms−1 | mV | mV | % | |
| A | ||||||||||||||||||
| 1412 | 277 | 1.3 | 14.2 | −19.0 | 131 | 73.8 | 4.9 | −4.5 | −6.9 | 2.74 | 40.0 | 5.8 | −13.0 | 0.0 | 14.6 | 2.0 | −18.8 | 17.3 |
| 1414 | 278 | 1.4 | 10.0 | −36.8 | 244 | 69.9 | 5.0 | −10.6 | −14.7 | 3.20 | 24.3 | 5.1 | −25.1 | 13.1 | 9.3 | 4.4 | −28.3 | 25.9 |
| 1422 | 226 | 1.0 | 10.7 | −32.2 | 244 | 70.1 | 6.4 | −0.1 | −8.7 | 0.32 | 10.7 | 6.1 | −17.0 | 2.5 | 4.0 | 6.5 | −21.2 | 10.0 |
| 1423 | 545 | 1.3 | 12.1 | −25.9 | 196 | 73.2 | 6.2 | 3.2 | −5.4 | 0.55 | 10.7 | 7.0 | −15.0 | 12.8 | 3.1 | 2.2 | −20.3 | 23.8 |
| 1424 | 342 | 0.6 | 23.8 | −17.3 | 147 | 79.1 | 7.5 | 3.7 | −4.6 | 1.21 | 8.7 | 2.0 | −18.6 | 38.9 | 4.8 | 2.0 | −20.4 | 28.8 |
| 1425 | 391 | 0.9 | 9.7 | −32.2 | 171 | 67.9 | 5.8 | −4.8 | −8.1 | 0.76 | 8.7 | 4.5 | −16.4 | 0.0 | 2.2 | 3.9 | −22.8 | 27.2 |
| 1426 | 368 | 0.8 | 8.9 | −38.5 | 162 | 73.1 | 4.5 | −9.7 | −10.3 | 0.30 | 37.6 | 9.0 | −15.3 | 7.1 | 18.2 | 4.3 | −20.0 | 1.6 |
| 1429 | 342 | 0.7 | 4.8 | −25.0 | 126 | 73.4 | 3.7 | −1.9 | −5.9 | 0.00 | 4.2 | 6.6 | −1.9 | 0.0 | 1.2 | 8.5 | −12.7 | 0.0 |
| 1430 | 300 | 0.9 | 4.1 | −35.9 | 141 | 70.6 | 4.7 | 0.0 | −5.1 | 0.63 | 11.9 | 7.6 | −14.5 | 0.0 | 3.8 | 4.4 | −19.5 | 19.6 |
| 1437 | 419 | 0.8 | 13.0 | −6.0 | 235 | 76.1 | 5.6 | 6.6 | −4.3 | 0.34 | 3.7 | 2.0 | −18.6 | 42.5 | 2.7 | 2.0 | −19.5 | 26.6 |
| Mean | 349 | 1.0 | 11.1 | −26.9 | 180 | 72.7 | 5.4 | −1.8 | −7.4 | 1.0 | 16.1 | 5.6 | −15.5 | 11.7 | 6.4 | 4.0 | −20.3 | 18.1 |
| SD | 90 | 0.3 | 5.5 | 10.4 | 47 | 3.3 | 1.1 | 5.6 | 3.2 | 1.1 | 13.3 | 2.3 | 5.8 | 16.1 | 5.8 | 2.2 | 3.8 | 10.7 |
| SEM | 30 | 0.1 | 1.8 | 3.5 | 16 | 1.1 | 0.4 | 1.9 | 1.1 | 0.4 | 4.4 | 0.8 | 1.9 | 5.4 | 1.9 | 0.7 | 1.3 | 3.6 |
| B | ||||||||||||||||||
| 1418 | 196 | 0.7 | 49.2 | −41.5 | 322 | 72.8 | 7.6 | −8.3 | −17.5 | 2.11 | 2.9 | 5.2 | −24.3 | 47.4 | 1.7 | 2.0 | −29.7 | 53.3 |
| 1419 | 386 | 0.7 | 30.6 | −21.9 | 256 | 80.2 | 6.2 | −1.6 | −11.8 | 1.68 | 6.7 | 2.0 | −27.7 | 33.6 | 3.1 | 5.0 | −31.4 | 40.8 |
| 1420 | 256 | 0.6 | 13.4 | −44.7 | 264 | 71.8 | 7.7 | 3.5 | −7.4 | 1.68 | 9.1 | 3.0 | −19.7 | 18.2 | 4.5 | 3.7 | −26.0 | 36.9 |
| 1431 | 214 | 0.6 | 13.2 | −33.8 | 310 | 53.7 | 6.1 | −7.3 | −12.7 | 4.53 | 27.1 | 7.1 | −30.3 | 7.0 | 8.9 | 5.9 | −35.0 | 33.8 |
| 1438 | 251 | 0.7 | 20.1 | −41.7 | 275 | 67.4 | 6.8 | −5.2 | −12.5 | 0.47 | 1.2 | 10.0 | −20.9 | 51.2 | 0.6 | 2.0 | −28.6 | 46.6 |
| Mean | 260 | 0.7 | 25.3 | −36.7 | 285 | 69.2 | 6.9 | −3.8 | −12.4 | 2.1 | 9.4 | 5.5 | −24.6 | 31.5 | 3.8 | 3.7 | −30.1 | 42.3 |
| SD | 74 | 0.1 | 15.1 | 9.2 | 29 | 9.8 | 0.8 | 4.8 | 3.6 | 1.5 | 10.4 | 3.2 | 4.5 | 18.9 | 3.2 | 1.7 | 3.3 | 7.8 |
| SEM | 30 | 0.0 | 6.2 | 3.8 | 12 | 4.0 | 0.3 | 2.0 | 1.5 | 0.6 | 4.2 | 1.3 | 1.8 | 7.7 | 1.3 | 0.7 | 1.4 | 3.2 |
| C | ||||||||||||||||||
| 1413 | 226 | 0.9 | 13.4 | −30.2 | 265 | 66.7 | 6.9 | −3.6 | −11.1 | 1.07 | 0.11 | 10.0 | −35.0 | 87.9 | 0.10 | 2.0 | −35.0 | 92.2 |
| 1415 | 228 | 0.6 | 41.4 | −49.1 | 380 | 72.2 | 7.9 | −11.6 | −21.8 | 1.91 | 0.11 | 2.0 | −27.9 | 90.0 | 0.00 | 3.4 | −24.1 | 100.0 |
| Mean | 227 | 0.7 | 27.4 | −39.7 | 322 | 69.4 | 7.4 | −7.6 | −16.5 | 1.5 | 0.11 | 6.0 | −31.5 | 88.9 | 0.05 | 2.7 | −29.5 | 96.1 |
| SD | 1 | 0.2 | 19.8 | 13.3 | 81 | 3.9 | 0.8 | 5.6 | 7.6 | 0.6 | 0.00 | 5.7 | 5.0 | 1.5 | 0.07 | 1.0 | 7.7 | 5.5 |
| SEM | 1 | 0.2 | 14.0 | 9.4 | 58 | 2.8 | 0.5 | 4.0 | 5.4 | 0.4 | 0.00 | 4.0 | 3.5 | 1.1 | 0.05 | 0.7 | 5.5 | 3.9 |
Cm membrane capacitance; Rs series resistance (after 80% compensation); gleak, Vleak, gCa,max and VCa as defined in the context of Eq. 1; k and V0.5 Boltzmann-parameters of conductance activation (Eq.2); iCa(0 mV) L-type current density measured at 0 mV; Ai(0 mV) flux calculated from iCa(0 mV) using Eq. 3 with fV = 1; Apeak, kpeak, Vpeak, and Aplateau, kplateau, Vplateau Boltzmann-parameters describing the first term of the sum in Eq. 5 for peak and plateau component, respectively; note that for group C the k and V values are not meaningful because of the small amplitudes A; frpeak and frplateau are apparent fractional contributions of Ca2+ entry for the peak and plateau component as described by Eq. 6. The first column lists the cell identification numbers. (A) Cells with frplateau ≤ 0.3; (B) cells with 0.3 < frplateau ≤ 0.6; (C) cells with frplateau > 0.9.
Fluorimetry
We used a microfluorimeter based on an inverted microscope (Axiovert 100 and Objective “Fluar” 40× 1.30 oil; ZEISS) with a photomultiplier tube (R268, Hamamatsu) attached to its trinocular head. Myotubes were loaded with fura-2 by diffusion from the patch-pipette. Ca2+-dependent fluorescence changes were recorded at 515 nm while exciting at 380 nm. A measurement at 360 nm excitation (isosbestic wavelength) performed in an 800-ms interval before the 380-nm recording served to normalize for changes in the indicator concentration. Free Ca2+ concentration was determined using background- and bleaching-corrected fluorescence ratio signals (R = F380/F360) according to Eq. 4 (Klein et al., 1988):
 |
(4) |
The following values were used for R min (fluorescence ratio at zero dye saturation), Rmax (ratio at full dye saturation) and KD,Fura (dissociation constant of the dye): 2.84, 0.68, and 276 nM, respectively (see Schuhmeier et al., 2003). The fura-2 dissociation rate constant koff,Fura was determined in the removal model fit as described in results.
Analysis
General analysis and nonlinear curve fitting were performed using Excel (Microsoft) and Origin (OriginLab Corporation). The program CalcV22 (Föhr et al., 1993) was used to calculate the free ion concentrations in the internal solution.
The numerical calculations to solve nonlinear differential equations and the removal fit described in results were performed using a program written in Delphi (Borland). Differential equations were solved using Euler's method. Part of the numerical calculations (simulations of the fluorescence signals) were stiff in the free Ca2+ component; therefore, to avoid numerical oscillations, a semi-implicit version of the Euler algorithm was implemented (see ). The measured data were smoothed by using a digital filtering algorithm with variable bandwidth that depends on local signal-noise ratios (Schuhmeier et al., 2003).
The steps of the removal fit analysis were as follows:
1. The digitally filtered fluorescence ratio traces were converted to free Ca2+ concentration (Eq.4) which in turn was used to calculate the occupancies of the model compartments (Dye, F, S and Uptake) shown in Fig. 2 C. Unless otherwise stated, the following set of starting parameter values were used for the calculation: kon,Dye = 164 μM−1 s−1 , koff,Dye = 45.2 s−1, [Dye]total = 200 nM, kon,S = 55.8 μM−1 s−1, koff,S = 2.12 s−1, [S]total = 15 mM, kUptake = 1,000 s−1. The rate constants of Dye and S are the values estimated for fura-2 and EGTA in Schuhmeier et al. (2003). [Dye]total and [S]total are the pipette concentrations of fura-2 and EGTA used in the experiments. Underlined parameters were further optimized by iterative least squares fitting (see Results). Note that kon,Dye and koff,Dye are linked by the assumed value of KD,Fura.
2. The removal model simulations of the fluorescence ratio decay started 10 ms after the end of each depolarization to account for the time required to turn off Ca2+ input flux. To reduce the effect of noise on the start values we averaged the data points (occupancy of each compartment) in the interval from 5 to 15 ms after the end of the depolarization.
3. The simulated traces were fitted to the measured fluorescence ratio decays using an enhanced version of a generalized reduced gradient method (GRG2; Lasdon et al., 1978). We made use of the Small-Scale Solver Dynamic Link Library (Frontline Systems) to minimize χ2 (Lasdon et al., 1974), defined as the summed squares of the point-by-point differences divided by the standard deviation of the data points in a baseline immediately before the first depolarization. Iteration was stopped when χ2 changed less than a set convergence criterion (10−5%) within at least 5 iterations in a row. We set all model parameters constant, for which values were available from calibration experiments. For the remaining parameters, a robust determination by least squares fitting could be obtained using the kinetic information in the measurements under the given assumptions. The usefulness of this procedure and of the choice of free parameters was confirmed by using simulated input fluxes with a large range of amplitudes to calculate artificial fluorescence ratio signals as described in Schuhmeier et al. (2003) and analyzing these signals with the present fitting algorithm.
The voltage dependence of Ca2+ flux was described by Eq. 5:
 |
(5) |
Here, fR(V) and fC(V) are Boltzmann terms (Eq. 2) for the activation of internal Ca2+ release and plasma membrane L-type Ca2+ conductance, respectively, AR is the maximal value of the release flux term (left term in the sum of Eq. 5) and aC a normalization factor. The term f c(V) · g Ca,max · (V − V Ca) was taken from the fit of the current-voltage data (Eq. 1). Eq. 5 assumes that any deviation from a sigmoidal voltage dependence of flux activation results from a contribution of the L-type Ca2+ inward current. The (maximal) fractional contribution fr of the Ca2+ entry flux (carried by the L-type current) to the total flux was described by Eq. 6:
 |
(6) |
where AC is the maximal value of the right term in the sum of Eq. 5.
Statistics
Data are presented and plotted as means ± SEM (n = number of experiments) for averaged values and as parameter ± SE for best fit parameters. Individual errors (SE) for fit parameters were calculated by evaluating the covariance matrix obtained at the optimum (as described in Press et al., 1992, chapter 15.6).
RESULTS
Ca2+ Inward Current and Ca2+ Transient
Fig. 1 A shows leak-corrected L-type Ca2+ inward currents at four different test voltages in a C2C12 myotube and Fig. 1 B shows the simultaneously measured fura-2 fluorescence ratio signals ΔR. A comparison indicates obvious differences in the voltage dependence of the two signals: At −30 mV, a clear Ca2+ signal can be seen while there is no current activation, and at potentials more positive than 0 mV the current declines in amplitude (Fig. 1 C) due to the decreased driving force for Ca2+ to enter the cell whereas Ca2+ signals show relatively little change. Fig. 1 D compares the voltage-dependent activation characteristics of Ca2+ signal (open squares) and L-type conductance (filled squares), derived from the best fit of Eqs. 1 and 2 to the data. The result shows that the Ca2+ transients are activated at some 15 mV more negative potentials than the L-type Ca2+ channels (V0.5: −27.3 mV vs. −12.5 mV).
Figure 1.

Ca2+ current and Ca2+ transients in a C2C12 myotube at different voltages. (A) Ca2+ inward currents for 100-ms depolarizations to different membrane potentials. (B) Calcium-dependent fluorescence ratio signals measured in parallel to the recordings of A. Note that a decrease of the ratio indicates an increase in Ca2+ concentration. (C) I-V relation showing leak-corrected inward current density versus pulse voltage (same cell as A and B). (D) Fractional activation of Ca2+ transients (open symbols) and Ca2+ conductance (filled symbols). For the plots the data points within the last 10 ms of the pulse were averaged. Continuous lines in C and D are best fit traces obtained with Eqs. 1 and 2. The fit parameters obtained for the L-type current were gCa,max = 306 ± 12 pS pF−1, VCa = 70.7 ± 4.1 mV, V0.5 = −12.5 ± 0.3 mV, k = 3.7 ± 0.3 mV. The activation parameters of the Ca2+ signals were V0.5 = −27.2 ± 1.2 mV and k = 4.2 ± 1.0 mV.
In the following sections we focus on quantifying the flux of Ca2+ that leads to the measured voltage-dependent changes in fluorescence shown for example in Fig. 1 B. This flux which may originate from extracellular and intracellular sources is termed “Ca2+ input flux” in the present study.
Removal Model Analysis
The Ca2+ input to the myoplasm during a depolarization (Fig. 2 A) is distributed to different binding and sequestration sites including troponin C, parvalbumin, the SERCA Ca2+ pump of the SR and ATP (Fig. 2 B; Baylor and Hollingworth, 1998). In the present experiments we used the extrinsic Ca2+ buffer EGTA in the intracellular solution at a concentration of 15 mM, which strongly exceeds that of any intrinsic Ca2+ buffer. The use of a single dominating Ca2+ buffer makes it possible to greatly simplify the reaction scheme for the removal of Ca2+ from the myoplasmic space (Pape et al., 1995; Song et al., 1998). The scheme in Fig. 2 C was used originally on mature skeletal muscle fibers of the frog (Melzer et al., 1986a, 1987; Timmer et al., 1998). It includes a saturable buffer S, in our case to represent EGTA, a simple transport mechanism (Uptake) with a rate proportional to free Ca2+ to account for Ca2+ sequestration, and an instantaneously equilibrating compartment far from saturation (i.e., binding proportional to free Ca2+) to account for intrinsic fast Ca2+ binding (F). In addition, the Ca2+ indicator fura-2 (Dye) is included and represents an intermediate speed saturable buffer.
The scheme of Fig. 2 C is described by the following set of equations:
 |
(7) |
 |
(8) |
 |
(9) |
 |
(10) |
with the additional conditions:
 |
(11) |
and
 |
(12) |
Mass conservation is described by the following equation:
 |
(13) |
 |
 |
Here kon , Dye , koff , Dye and [Dye]total are on- and off-rate constant and total intracellular concentration of the indicator, respectively. [S]total, kon , S and koff , S are total concentration of the slow buffer S and its on- and off-rate constant, respectively. kUptake is the rate constant of the nonsaturating transport. F is a scaling factor to describe the component of rapidly equilibrating Ca2+ ([Ca2+]F) as a multiple of the free Ca2+ concentration. A flux d[Ca2+]Leak/dt was included to compensate the uptake rate at the given resting free Ca2+ concentration.
Fluorescence ratio signals were calculated in simulations using Eq.14:
 |
(14) |
Here, Rmin and Rmax are the fluorescence ratio values for Ca2+-free and fully Ca2+-saturated indicator dye. To simulate fluorescence ratio signals with this model requires to assign values to a total number of 10 parameters. Approximate values for R max, R min, and the dissociation constant KD , Dye = koff , Dye/kon , Dye for fura-2 were obtained from previous calibration experiments (see Schuhmeier et al., 2003). [Dye]total and [S]total were set to the respective pipette concentrations of fura-2 and EGTA. F was found to be of negligible influence on the results (see Fig. 5) at the present high [S]total and was arbitrarily set to 0. This leaves four free parameters (koff , Dye, kon , S, koff , S, and kUptake) that were determined from the measured Ca2+ signals by using a least squares optimization procedure (“removal fit”, see also materials and methods).
Figure 5.

Ca2+ input flux calculation for different assumptions of intracellular binding. (A) Voltage pulse, (B) fluorescence ratio of fura-2, (C) calculated free Ca2+ after removal model fit, and (D) calculated Ca2+ input flux. The removal model fit was performed with two different assumptions for intrinsic fast buffering (F = 0, i.e., no intrinsic fast binding: lower trace, and F = 250: upper trace). The results are very similar. For F = 0 the best fit parameter values (koff , D, kon , S, koff , S an kUptake) were as follows: 43.2 s−1, 20.1 μM−1 s−1, 2.32 s−1, 11,100 s−1. For F = 250 the values were 44.2 s−1, 18.7 μM−1 s−1, 2.39 s−1, 10,800 s−1 (cell no. 1412). (E) Calculated Ca2+ input flux as a function of the assumption made for [Dye]total and [S]total (corresponding to intracellular concentrations of fura-2 and EGTA). The abscissa shows assumed percentage of pipette concentration present in the cell. Data points are the means of the calculated peak input fluxes of the cells in Table I. Fit quality (χ2/N) and estimated mean values of the parameters koff , Dye, kon , S, and koff , S, were identical. Only the mean kUptake value showed a similar proportionality to the assumed percentage of pipette concentrations. (F) Time course of Ca2+ input flux. The mean Ca2+ input fluxes obtained of each data point in E were scaled to the peak and superimposed showing that the time course is independent of the assumption made for [Dye]total and [S]total.
With a first set of values for the four free model parameters (starting values), the measured fluorescence ratio signal was used to calculate free Ca2+ and the occupancies of the different compartments. The Ca2+ levels reached in each compartment at 10 ms after repolarization were then used as initial values for a theoretical prediction of the continued time course of the fluorescence ratio relaxation using Eq. 14. The predicted time course (Fig. 3 , dashed lines) was compared with the actually measured time course and the parameter values were improved by iteration until a minimum of the squared deviations between measured and calculated trace was obtained (Fig. 3 B).
Figure 3.

Removal model fit. Depolarization scheme (top traces) to obtain different degrees of activation of SR Ca2+ release and fluorescence ratio signals of fura-2 (bottom traces) in a voltage-clamped myotube. Note that a Ca2+ concentration increase results in a downward deflection. The pulse series produced four different Ca2+ removal phases within a single experimental sweep. (A, Start) Calculation of theoretical relaxation with the following set of start values of the free parameters: koff , Dye = 30 s−1, kon , S = 1.5 μM−1 s−1, koff , S = 0.3 s−1, and kUptake = 1,000 s−1 (Dye and S parameters from Ursu et al., 2001). (B, Fit) Result of least squares deviation minimization leading to a best simultaneous fit of the four relaxation phases with the following set of parameter values: koff , Dye = 43.2 ± 0.6 s−1, kon , S = 20.1 ± 1.3 μM−1 s−1, koff , S = 2.32 ± 0.07 s−1, and kUptake = 11,100 ± 500 s−1.
Analysis of a single relaxation phase may not contain sufficient information to determine a unique set of best fit parameter values for a given cell. Therefore, a number of different transients leading to progressively more Ca2+ binding on S were fitted simultaneously. In previous work on fully differentiated muscle fibers, sequences of pulses of different durations or amplitudes were applied to reach different saturation levels of the model compartments (e.g., Melzer et al., 1986a, 1987). In these experiments long time intervals (about a minute) separated the individual pulses to ensure full recovery of both the release and the removal system after each depolarization. Because of the relatively short life time of the patch-clamped myotubes, we designed a different pulse protocol for the present investigation that allowed a characterization of removal within a much shorter period of time (∼1.3 s). Test pulses of different length and amplitude were separated by short intervals just sufficient for partial relaxation (Fig. 3, top rows). Each pulse interval provides a separate relaxation phase whose characteristics depend on the fractional Ca2+ occupancies of the intracellular binding sites reached at the end of the preceding pulse. All relaxation phases were simultaneously fitted with the model of Fig. 2 C (for further information see materials and methods). With the set of starting parameters chosen in Fig. 3 A, the theoretical decays deviate strongly from the recorded ones, whereas all measured traces are fitted well after convergence (Fig. 3 B).
The removal analysis was successfully performed in 18 cells. The individual values obtained for the four free fit parameters (koff , Dye, kon , S, koff , S, and kUptake) are listed in Table I . The mean values were koff , Dye = 46.4 s−1, kon , S = 20.0 μM−1 s−1, koff , S = 2.71 s−1 and kUptake = 10,300 s−1, respectively.
TABLE I.
Best Fit Values of the Free Parameters in the Removal Model Analysis
| Cell ID | χ2/N | koff , Dye | kon , S | koff , S | kUptake |
|---|---|---|---|---|---|
| s−1 | μM−1 s−1 | s−1 | 103 s−1 | ||
| 1412 | 1.01 | 43.2 | 20.1 | 2.32 | 11.1 |
| 1413 | 1.12 | 49.9 | 19.1 | 2.20 | 10.3 |
| 1414 | 1.10 | 45.6 | 17.2 | 3.76 | 4.7 |
| 1415 | 1.00 | 39.1 | 9.16 | 2.48 | 4.0 |
| 1418 | 0.90 | 34.7 | 32.8 | 2.28 | 15.7 |
| 1419 | 1.35 | 47.7 | 16.7 | 2.29 | 11.2 |
| 1420 | 1.28 | 41.2 | 53.5 | 1.57 | 32.3 |
| 1422 | 0.97 | 48.6 | 8.22 | 3.30 | 4.5 |
| 1423 | 1.00 | 52.8 | 8.70 | 3.93 | 2.7 |
| 1424 | 0.79 | 44.5 | 37.7 | 2.14 | 33.7 |
| 1425 | 0.90 | 61.9 | 5.52 | 2.61 | 3.1 |
| 1426 | 1.12 | 35.0 | 9.15 | 2.94 | 3.6 |
| 1428 | 1.18 | 47.3 | 50.4 | 2.69 | 23.2 |
| 1429 | 0.98 | 54.0 | 3.97 | 2.32 | 0.0 |
| 1430 | 1.21 | 45.4 | 7.65 | 3.73 | 2.3 |
| 1431 | 0.86 | 37.0 | 25.3 | 3.42 | 8.4 |
| 1437 | 1.06 | 54.8 | 28.5 | 1.81 | 8.7 |
| 1438 | 1.05 | 52.1 | 6.85 | 3.07 | 5.3 |
| Mean | 1.05 | 46.4 | 20.0 | 2.71 | 10.3 |
| SD | 0.15 | 7.3 | 15.2 | 0.69 | 10.0 |
| SEM | 0.03 | 1.7 | 3.6 | 0.16 | 2.3 |
The values of the four free parameters obtained in the removal model fit are listed for 18 C2C12 myotubes (ID numbers in left column). The quality of the fit is indicated by χ2/N (second column). A value of 1 would be obtained if the underlying function was perfectly fitted and the estimated standard deviations of noise in the fit interval and in the reference baseline were identical. N, number of measurement points in the fit interval. For definition of χ2 see materials and methods.
Calculation of Ca2+ Input Flux
Fig. 4 demonstrates the calculation of the Ca2+ input flux for the experimental example of Fig. 3.
Figure 4.

Calculation of Ca2+ input flux. (Top traces) Pulse protocol. (Middle traces) Total Ca2+ calculated as the sum of the voltage-induced changes in the different compartment occupancies (Fig. 2 C). (Bottom traces) Time derivative of total Ca2+ (Eq. 13), i.e., the total flux of Ca2+ into the myoplasm that is controlled by the depolarization. (A) Before convergence of the removal model fit (Start). (B) After convergence (Fit). Same experiment and parameter settings as in Fig. 3.
The total concentration increase of Ca2+ that occurs in the myoplasmic space during the depolarization is calculated by summing the individual compartment occupancies (Fig. 4, second row). The Ca2+ input flux (Fig. 4, third row) is then obtained as the time derivative of the total [Ca2+] trace according to Eq. 13 and expressed as change in Ca2+ concentration in the myoplasmic space per time (μM ms−1). It can be seen that in this example the amplitude of the calculated Ca2+ input flux has increased after convergence of the fit. Changes in time course went along with the amplitude change. The final input flux no longer shows the negative undershoots at the end of the pulses. The result is therefore consistent with the assumed rapid turn off of the Ca2+ flux by repolarization to the holding potential of −90 mV.
Measurements in muscle fibers indicated a significant amount of rapidly equilibrating Ca2+ binding sites (Melzer et al., 1984, 1986a, 1987) that likely originate predominantly from troponin C, ATP, and the Ca2+ pump proteins (Baylor and Hollingworth, 1998). In the model the rapidly equilibrating component of bound Ca2+ was represented by a multiple of free Ca2+ described by the parameter F (scaling factor). In previous experiments with low (submillimolar) concentrations of intracellularly applied EGTA (Melzer et al., 1984, 1987), the amplitude of the estimated release rate was critically dependent on the extent of fast Ca2+ binding. However, at the high (millimolar) concentrations of EGTA used in our experiments, even a rapidly equilibrating Ca2+ binding component many times greater than free Ca2+ hardly influenced the calculation result. When in Fig. 5 D the parameter F was arbitrarily set to 0 and 250, the removal model fit parameters and the release flux calculation results were almost identical (see Fig. 5 legend). Therefore, we omitted F from the present calculations (F = 0). On the other hand, the value of [S]total (Eq. 12) had a large influence on the scale of the calculated input flux. In the model, [S]total represents the effective concentration of EGTA in the cell. We assumed that the concentrations of both fura-2 and EGTA reached values equal to the concentrations inside the pipette (0.2 and 15 mM, respectively) at the time when the depolarizing pulses were started. In previous measurements, the intensity increase of the fura-2 fluorescence at the isosbestic excitation wavelength of 360 nm indicated that the cytoplasm was essentially in equilibrium with the pipette solution within ∼15 min after establishing the whole cell configuration (Schuhmeier et al., 2003). Deviations from the assumed concentration values would cause a change in scale for the flux amplitude. The effect is shown in Fig. 5 E. Here, the calculated peak flux amplitudes derived from the removal fit analysis are plotted versus the fraction of the pipette concentrations assumed to be present in the cell. The filled circles show the mean values of the peak amplitudes derived from the analysis of the 18 cells shown in Table I. In each case, the removal fit had identical quality (same χ2/N values). The flux amplitudes changed in proportion to the fractional pipette concentrations. Fig. 5 F shows the superimposed time course for each of the estimates of Fig. 5 E normalized to the peak. The scaled records were identical. Thus, the total effective concentrations of fura-2 and S in the cell are required for quantifying the amplitude but not for a valid estimate of the time course of the Ca2+ input flux.
In addition to the question of the true effective intracellular concentrations there is an uncertainty about the intracellular dissociation constants of fura-2 and EGTA. In the previous analysis (Fig. 3–5 and Table I) we assumed that the intracellular fura-2 dissociation constant KD , Dye equals the value measured in vitro. koff , Dye was optimized in the fit and kon , Dye was calculated by dividing the fit value of koff , Dye by KD , Dye. Under these conditions, the best fit values of kon , S and koff , S yield a mean KD , S of 246 nM, which is close to the value reported for EGTA in free solution at neutral pH (Smith et al., 1984; Pape et al., 1995; Naraghi, 1997). Previous investigations indicated that Ca2+ chelators show lower affinity for Ca2+ when in contact with intracellular proteins (Konishi et al., 1988; Matsuda et al., 1996). A three- to fourfold increase in the dissociation constant for fura-2 was suggested. EGTA might show a similar effect. We therefore investigated systematically how the rate constant values obtained in the analysis depend on the assumptions made for the equilibrium constants of fura-2 and EGTA. We chose 12 different combinations of fixed KD , Dye and KD , S values and repeated the removal analysis for all cells of Table I with koff , Dye, koff , S, and kUptake as free parameters. The KD , Dye values covered the range reported for in vitro and in vivo conditions (Pape et al., 1993) and included our in vitro estimate.
Table II A summarizes the result. It shows that the best fit parameter values and the quality of the fit (χ2/N) depend on the values chosen for the two equilibrium constants. For each KD , Dye a different KD , S led to the lowest least square deviation. Even better fits (lower χ2/N values) were obtained when both kon , S and koff , S were free parameters (data listed in Table II B).
TABLE II.
Dependence of Best Fit Parameters on Assumptions Made for KD,Dye and KD,S
| A | KD , Dye | KD , S | χ2/N | kon , Dye | koff , Dye | kon , S | koff , S | kUptake | Peak input flux |
|---|---|---|---|---|---|---|---|---|---|
| nM | nM | μM−1 s−1 | s−1 | μM−1 s−1 | s−1 | 103 s−1 | μM−1 ms−1 | ||
| 150 | 200 | 1.06 ± 0.04 | 324.1 ± 15.1 | 48.6 ± 2.3 | 13.99 ± 0.70 | 2.8 ± 0.1 | 5.59 ± 0.66 | 10.8 ± 2.6 | |
| 276 | 200 | 1.06 ± 0.04 | 165.2 ± 6.2 | 45.6 ± 1.7 | 13.31 ± 0.55 | 2.7 ± 0.1 | 5.61 ± 0.63 | 16.6 ± 3.5 | |
| 500 | 200 | 1.10 ± 0.04 | 87.5 ± 3.0 | 43.8 ± 1.5 | 12.60 ± 0.48 | 2.5 ± 0.1 | 5.83 ± 0.64 | 25.2 ± 4.5 | |
| 1,000 | 200 | 1.22 ± 0.08 | 42.0 ± 1.4 | 42.0 ± 1.4 | 11.78 ± 0.76 | 2.4 ± 0.2 | 6.84 ± 1.11 | 42.2 ± 6.6 | |
| 150 | 500 | 1.10 ± 0.04 | 549.8 ± 67.8 | 82.5 ± 10.2 | 6.17 ± 0.37 | 3.1 ± 0.2 | 2.43 ± 0.32 | 5.5 ± 1.4 | |
| 276 | 500 | 1.07 ± 0.04 | 207.2 ± 12.1 | 57.2 ± 3.3 | 6.01 ± 0.33 | 3.0 ± 0.2 | 2.46 ± 0.30 | 8.9 ± 2.2 | |
| 500 | 500 | 1.06 ± 0.04 | 99.4 ± 4.1 | 49.7 ± 2.1 | 5.79 ± 0.27 | 2.9 ± 0.1 | 2.50 ± 0.29 | 14.1 ± 3.2 | |
| 1,000 | 500 | 1.08 ± 0.04 | 45.4 ± 1.6 | 45.4 ± 1.6 | 5.44 ± 0.21 | 2.7 ± 0.1 | 2.56 ± 0.28 | 23.3 ± 4.4 | |
| 150 | 1,000 | 1.16 ± 0.05 | 3,352.5 ± 720.5 | 502.9 ± 108.1 | 3.37 ± 0.18 | 3.4 ± 0.2 | 2.26 ± 0.38 | 3.1 ± 0.8 | |
| 276 | 1,000 | 1.10 ± 0.04 | 441.1 ± 87.6 | 121.7 ± 24.2 | 3.16 ± 0.19 | 3.2 ± 0.2 | 1.26 ± 0.17 | 5.0 ± 1.3 | |
| 500 | 1,000 | 1.08 ± 0.04 | 126.0 ± 8.3 | 63.0 ± 4.2 | 3.08 ± 0.17 | 3.1 ± 0.2 | 1.28 ± 0.16 | 8.2 ± 2.1 | |
| 1,000 | 1,000 | 1.06 ± 0.04 | 50.7 ± 2.1 | 50.7 ± 2.1 | 2.95 ± 0.14 | 3.0 ± 0.1 | 1.30 ± 0.15 | 14.3 ± 3.2 | |
| B | |||||||||
| 150 | 133 ± 25 | 1.05 ± 0.03 | 295.3 ± 10.7 | 44.3 ± 1.6 | 35.06 ± 6.29 | 2.4 ± 0.2 | 14.17 ± 2.75 | 15.6 ± 3.0 | |
| 276 | 246 ± 44 | 1.05 ± 0.03 | 168.1 ± 6.2 | 46.4 ± 1.7 | 20.03 ± 3.59 | 2.7 ± 0.2 | 10.25 ± 2.35 | 17.9 ± 3.2 | |
| 500 | 447 ± 76 | 1.05 ± 0.03 | 95.8 ± 3.6 | 47.9 ± 1.8 | 11.44 ± 2.05 | 2.9 ± 0.1 | 6.71 ± 1.67 | 19.5 ± 3.5 | |
| 1,000 | 896 ± 149 | 1.05 ± 0.03 | 48.8 ± 1.8 | 48.8 ± 1.8 | 5.84 ± 1.05 | 3.0 ± 0.1 | 3.69 ± 0.96 | 20.4 ± 3.7 |
(A) KD , Dye and KD , S were set to fixed values shown in columns 1 and 2; koff , Dye, koff , S, and kUptake were used as free parameters in the removal model fit. (B) Only KD , Dye was set to the values in column 1; koff , Dye, kon , S, koff , S, and kUptake were free parameters in the fit.
The mean values of kon , S, koff , S and KD , S are plotted versus KD , Dye in Fig. 6, A, B, and E , respectively, and kUptake and koff , Dye are plotted in Fig. 6, C and D, respectively. At each of the four assumed KD,Dye values (150, 276, 500, and 1,000 nM), the fits resulted in equally good approximations of the measured relaxation time courses (χ2/N values identical) but led to quite different rate constants kon , S and kUptake (Fig. 6, A and C). On the other hand koff , S and koff , Dye were rather independent of the choice of KD , Dye (Fig. 6, B and D). Interestingly, despite the strong variations in some of the free fit parameters, the calculated Ca2+ input fluxes were very similar. Their peak amplitudes ranged between 16 and 20 μM ms−1 (Fig. 6 F) and their time courses (Fig. 6 G) were identical, regardless of the assumed KD , Dye value. Fig. 6 H shows the superimposed normalized traces of the calculated mean input fluxes using the results of Table II A. This demonstrates that even for the fits of somewhat lower quality the calculated time course is not much different.
Figure 6.
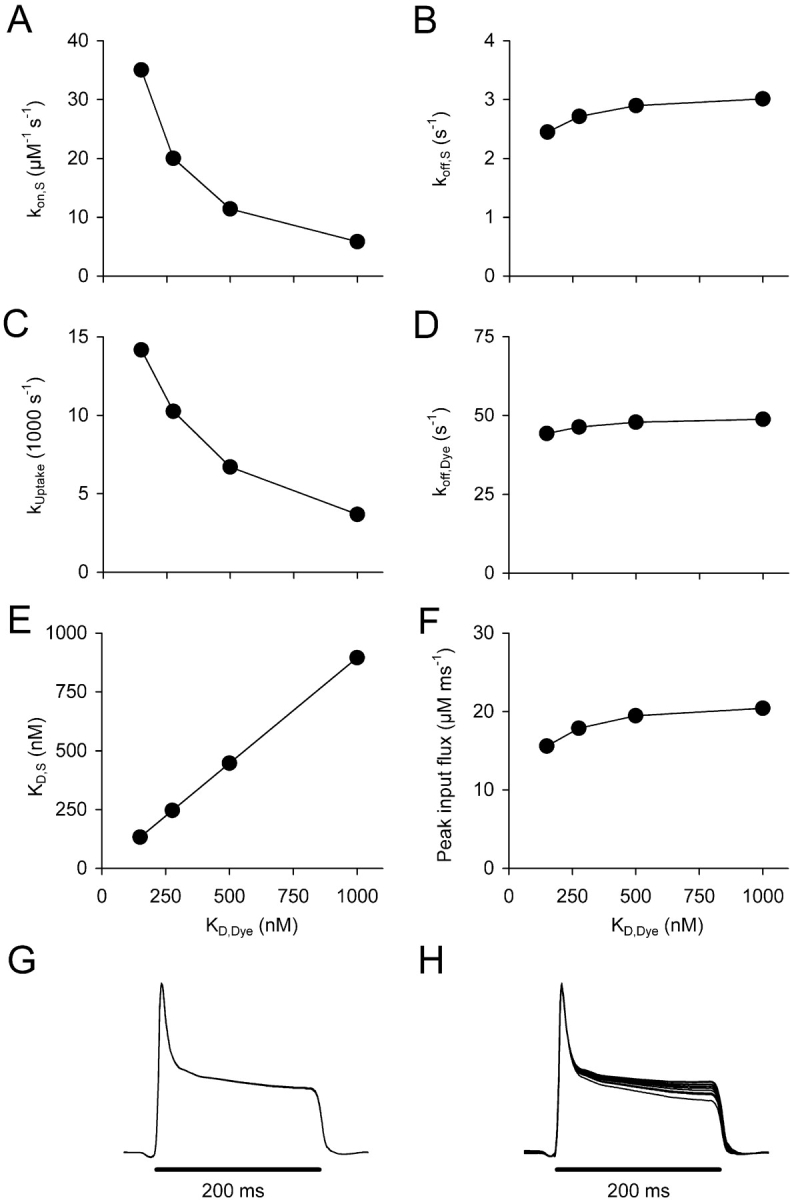
Estimated removal parameters and Ca2+ input flux for different assumptions of intracellular fura-2 Ca2+ affinity. (A–D) Mean values of the free parameters kon , S, koff , S, kUptake, and koff , Dye, respectively, obtained in removal model fits of 18 experiments for different assumptions of intracellular KD , Dye. (E) KD , S as a function of assumed KD , Dye values calculated from data of A and B. (F) Estimated peak values of Ca2+ input flux for the same set of experiments (third voltage pulse of the pulse paradigm shown in Figs. 3 and 4. (G and H) Superimposed and normalized average traces of the calculated Ca2+ input flux corresponding to the results of Table II, B and A, respectively.
Voltage Dependence of Ca2+ Input Flux
The previous sections showed that the removal model analysis leads to a robust determination of the time course of the voltage-dependent Ca2+ input flux. Further experiments were performed to investigate the voltage dependence of the peak and steady-state flux components. In the experiment shown in Fig. 7 a 100-ms test pulse was gradually increased in 10-mV steps from −80 to +60 mV. Fig. 7 A shows the calculated Ca2+ input flux signals and Fig. 7 B the L-type Ca2+ inward currents measured simultaneously. The calculation was based on best fit parameters of a removal fit analysis that was performed on the same cell immediately before this pulse series. Each pulse was separated from the next by a 30-s recovery period.
Figure 7.

Calculated Ca2+ input flux and measured Ca2+ inward current. (A) Calculated Ca2+ input flux at different amplitudes of depolarization (100-ms pulses). (B) L-type Ca2+ inward current measured simultaneously with the signals in A. (C) Current-voltage relation derived from the data shown in B. (Continuous line) Best fit using Eq.1. The leak component is subtracted. (D) Activation curves of Ca2+ input flux (peak, circles; plateau, open squares; both measured from the baseline) and Ca2+ conductance (filled squares). Here and in Figs. 8 and 11 the means of the data values between 25 and 75 ms during the 100 ms depolarization were evaluated for the plateau and current amplitudes. The continuous lines are best fit traces using the sum of a Boltzmann-equation (Eq. 2) and a scaled and inverted version of the fit trace shown in C (see Eq. 5). For Boltzmann-parameters k and V0.5 for peak, plateau, and conductance see Table III (cell no. 1414). Same experiment as in Fig. 1.
The first sign of Ca2+ mobilization was detected at −40 mV. The response increased steeply with voltage between −40 and −10 mV and changed only slightly at larger depolarizations. The L-type Ca2+ inward current (see Fig. 7 B and the current-voltage relation of Fig. 7 C) showed a pronounced maximum at 0 mV and decreased in amplitude at larger potentials due to the progressive decrease in inward driving force for Ca2+. The amplitude of the tail current at the end of the depolarization increased monotonically with voltage (Fig. 7 B) consistent with the sigmoidal voltage-dependent activation of L-type channel conductance (Fig. 7 D, filled squares) derived from the current voltage relation (Fig. 7 C).
Fig. 7 D shows the voltage dependence of peak and plateau of Ca2+ input flux (open circles and squares, respectively) in comparison to the voltage dependence of Ca2+ conductance. Both peak and plateau are measured from the baseline level. The plateau value of the flux was determined by taking the average of values between 25 and 75 ms during the 100-ms depolarization. For better comparison the same time range was used for evaluating the voltage dependence of Ca2+ current and conductance. The Boltzmann-fits (lines) show that conductance activation has its half-maximal value at ∼15 mV more positive potentials (for best fit parameter values see Table III , cell no. 1414).
Fig. 8 C presents the peak and plateau components of Ca2+ input flux (both measured from the baseline) averaged from 10 cells that showed a largely sigmoidal activation as in Fig. 7. For comparison, in Fig. 8, A and B, the mean inward current amplitude and conductance are shown as a function of voltage. The individual Boltzmann activation parameters (Eqs. 1, 2, and 5) obtained from this set of cells are summarized in Table III A.
Figure 8.

Voltage dependence of input flux and inward current. Averaged data of 10 experiments as the one shown in Fig. 7 (see Table III A). (A) Current-voltage relation of the leak-corrected inward current. (B) Fractional activation of Ca2+ conductance. (C) Peak (circles) and plateau (squares) of Ca2+ input flux. (D) Flux ratio (peak/plateau) for the range from −30 to +60 mV.
Peak and plateau of the Ca2+ input flux in mature muscle fibers have been assigned to different mechanisms: primarily Ca2+-dependent and primarily voltage-dependent, respectively (Stern et al., 1997). Characteristic differences in the voltage dependence of peak and plateau have been observed in amphibian and mammalian muscle fibers, possibly related to fundamental functional differences in EC coupling (Shirokova et al., 1996). Frog fibers in contrast to rat fibers showed a pronounced maximum of the ratio of both components at intermediate voltages (note that “peak” in the notation of Shirokova et al. [1996] corresponds to peak–plateau in our case) at intermediate voltages. In Fig. 8 D the ratio peak/plateau of the calculated input flux in the C2C12 myotubes is plotted as a function of voltage. The ratio increases linearly from 1.6 at −30 mV to 2.8 at +60 mV and showed no pronounced maximum as in frog fibers. Thus, the results described so far indicate that the estimated input flux of Ca2+ exhibits kinetics and voltage dependence of peak/plateau ratios resembling those reported for SR Ca2+ release in rat muscle fibers.
Evidence for SR Depletion
The plateau component of the input flux often showed a slow decline distinct from the fast decay immediately after the peak (e.g., Fig. 5). According to the interpretation of a similar time course in adult muscle fibers (Schneider et al., 1987b), the fast decay results from inactivation whereas the slow decline results from the depletion of the SR caused by a noninactivating component of Ca2+ release. Following this interpretation, one can calculate a depletion-corrected rate of Ca2+ release that is proportional to SR-permeability (González and Ríos, 1993; Shirokova et al., 1995). This is demonstrated in Fig. 9 .
Figure 9.

Decline in Ca2+ input flux caused by depletion of internal stores. Comparison of voltage-activated Ca2+ signals and Ca2+ entry flux through the L-type Ca2+ channels. The two columns show results obtained in the same cell with the same depolarization separated by a time interval of 8 min. (A) Scheme of the depolarizing voltage pulse. (B) Fluorescence ratio signals. (C) Calculated Ca2+ input flux. (D) SR Ca2+ content. (E) Permeability changes calculated by correction for store depletion. (Thin line) Time course before correction. (F) Ca2+ entry flux derived from the measured L-type Ca2+ current using Eq. 3. Assuming proportionality between SR content and Ca2+ release flux in the interval 30–90 ms after pulse-on, we used linear regression (sloping dashed lines) to determine amplitude A1 and slope m1 of the release flux (C) and the slope m2 of Δ[Ca2+]SR (D). The amplitude A2 (= A1 × m2/ m1) was then used to calculate the initial SR content by adding the corresponding Δ[Ca2+]SR value.
As in the previous publications, the SR Ca2+ content was presented as a concentration referred to the myoplasmic water volume and assumed to be the sole driving force for Ca2+ release. The content at any time during the pulse (Fig. 9 D) was calculated as the initial content (before the pulse) minus the running integral of the release rate (= Δ[Ca2+]SR).
The initial SR content was determined as 7.2 mM in the left column of Fig. 9. It decreased by 33% during the course of the 100-ms depolarizing pulse (see Fig. 9 legend for more detail).
During our experiments, we observed a variable “run-down” of the Ca2+ input flux that was not accompanied by a corresponding change of the L-type inward current. It was therefore likely caused by alterations in intracellular Ca2+ release, possibly resulting from a decline in the responsiveness of the release channels to depolarization or from a reduced driving force for Ca2+ release during SR depletion. The example of Fig. 9 indicates Ca2+ depletion of the SR as a main cause for the “run-down”. The depolarizing voltage step (Fig. 9 A, left column) was repeated after a time interval of 8 min (right column) in which different depolarizing pulses, as shown in Fig. 7 A, were applied. The amplitudes of the fluorescence ratio signal Fig. 9 B and of the calculated Ca2+ input flux (Fig. 9 C) were considerably smaller than during the first depolarization. In the second pulse the initial SR Ca2+ was estimated as 3.6 mM, indicating a reduction in SR Ca2+ load by 50%. During the course of this pulse SR content decreased by 40% of the initial value. Correcting the Ca2+ input flux traces for depletion, i.e., converting Ca2+ release rates to permeability changes (in the units % ms−1) led to very similar amplitudes and time courses for both pulses (compare left and right record in panel E). It has been suggested that the loading state of the SR also affects permeability (e.g., Pape and Carrier, 1998). We cannot rule out this possibility, but the result of Fig. 9 is not in conflict with a change in driving force alone causing the observed decrease in flux amplitude.
Estimation of Ca2+ Entry Flux
The total myoplasmic Ca2+ input flux is a compound signal consisting of internal Ca2+ release and Ca2+ entry from the extracellular space. Ca2+ entry flux in isolation can be determined from the Ca2+ inward current using Eq. 3 (see materials and methods). This allows us to estimate the relative contribution of entry and release. Fig. 9 F shows the Ca2+ entry flux calculated from the current recordings and expressed in the same dimensions (concentration per time) as the input flux in Fig. 9 C. We compared the size of the optically determined flux signal with the Ca2+ entry flux carried by the Ca2+ current. Considering the different scaling in Fig. 9, C and F, the calculated total Ca2+ input flux is much larger than the entry flux of Ca2+. Also its time course is utterly different. The absence of a component resembling the Ca2+ entry flux in this and the previous examples suggests little contribution of the Ca2+ current to the fluorescence signal.
In the set of experiments illustrated in Fig. 10 we applied two depolarizing pulses separated by a 10-ms time interval. The optically determined Ca2+ input flux is shown on the left, the electrically determined Ca2+ entry flux on the right, calculated with Eq. 3 as described above. Fig. 10 B shows the result from a cell comparable to the one in Fig. 9, i.e., with an estimated input flux much larger than the entry flux (note the difference in scale between the left and right panel). In the input flux (left), the peak seen in the first pulse is missing in the second one, whereas in the entry flux (right) both responses are almost identical. Fig. 10 C shows a measurement from a cell that exhibited very small fluorescence transients. The calculated Ca2+ input flux (left) is considerably smaller than in Fig. 10 B, whereas Ca2+ entry flux (right) has similar size. In this cell, the input flux shows amplitude and kinetic characteristics similar to the entry flux and practically no change in kinetics induced by the prepulse. The observations indicate that a large part, if not all, of the optical signals in Fig. 10 C results from Ca2+ entry (see also discussion).
Figure 10.

Comparison of calculated Ca2+ input flux and transmembrane Ca2+ entry flux. (A) Scheme of double pulse paradigm to activate Ca2+ inward current and intracellular Ca2+ release. (B, left) calculated Ca2+ input flux. (Right) Ca2+ entry flux derived from the electrically recorded leak corrected inward current using Eq. 3. Note the differences in scale. Cell no. 1426. (C) Same as in B but recorded from a cell (no. 1444) that showed very small fluorescence transients. Ca2+ input flux was calculated using the mean parameter values of Table I. Vertical scales of left and right panel are similar and time course and double pulse response are comparable, indicating that the input flux results mainly from Ca2+ entry from the extracellular space.
Voltage Dependence of Ca2+ Input Flux in the Absence of Release
Fig. 11 shows measurements of the voltage dependence obtained from a cell of the kind shown in Fig. 10 C. For comparison, the data are plotted as in Fig. 7. The calculated input flux signals shown in Fig. 11 A are blunted by the digital filtering because of the small scale of the original fluorescence ratio signals and their low signal to noise ratio. Nevertheless, it is clear that in most traces termination is faster than activation and the amplitude during the depolarization decreases progressively at the positive voltages, quite like the inward current (Fig. 11, B and C).
Figure 11.

Voltage dependence of Ca2+ input flux and Ca2+ inward current in a cell with low fluorescence response. (A) Calculated Ca2+ input flux for 100-ms pulses of variable amplitude. (B) Simultaneously measured Ca2+ inward currents. (C) I-V relation obtained from the data shown in B. (D) Voltage dependence of Ca2+ input flux (open squares) and Ca2+ entry flux (closed squares) derived from B displayed as fraction of the maximal data values. For Boltzmann-parameters k and V0.5 for peak, plateau, and conductance see Table III (cell no. 1415).
Comparing the normalized input flux (open squares) and entry flux (filled squares) in Fig. 11 D shows that both exhibit essentially identical voltage dependence. Some of the flux traces in Fig. 11 A, in particular the one at +60 mV, showed responses at the end of the depolarization that can be attributed to the Ca2+ tail current. The observed characteristics make it likely that the indicator picked up only Ca2+ entering the cell from the outside in these cases.
Evaluating the voltage dependence of Ca2+ input flux for all our measurements, we also found cells with responses intermediate between the examples of Figs. 7 and 11. Their peak and plateau values showed various degrees of reduction at large depolarization. To account for the decrease of flux amplitude at large depolarizations we fitted the Ca2+ input flux-voltage relations with the sum of a Boltzmann relation and a scaled version of the best fit curve describing the current-voltage relation of the leak-corrected Ca2+ inward current (see Eq. 5, materials and methods). This description would be physically adequate if the deviations from a sigmoidal voltage activation curve resulted exclusively from Ca2+ inward current. Because of the additional contribution of run down, the fit serves to estimate the maximal contribution of Ca2+ entry to the total flux.
The cells whose complete voltage dependence of optical and electrical signals could be determined were divided into three groups depending on the relative contribution of the nonsigmoidal component (Table III). Group A (10 cells) represents the experiments in which the maximum contribution of inward current was <30% during the plateau phase (factor frplateau <0.3, see Eq.6). Group B (5 cells) contains experiments in which the contribution was between 30 and 60%, in group C (2 cells) it was >90%. The calculated time course of the input flux in these two cells showed no initial peak, a slow rise, and a rapid drop, sometimes accompanied by a peak at the end of the pulse, i.e., characteristics of the Ca2+ entry flux mediated by the L-type Ca2+ channels. The experiment shown in Fig. 7 is a representative of group A, the one in Fig. 11 belongs to group C. Considering their input flux properties, it seems likely that the cells of group C were deficient in SR Ca2+ release.
Time Course of Ca2+ Entry Flux Measured Optically and Electrically
In myotubes that show no SR release, Ca2+ input flux equals Ca2+ entry flux. This condition provides the interesting possibility to test the fidelity of the optical approach to reconstruct the time course of Ca2+ input flux because the flux derived from the electrically measured Ca2+ inward current (Eq. 3) should show the temporally undistorted entry flux. Because it is possible that even the cells of group C had a residual component of SR Ca2+ release, we applied a protocol designed to completely deplete the SR of releasable Ca2+. 30 μM of the SR Ca2+ pump blocker cyclopiazonic acid (CPA) and 10 mM caffeine were applied to myotubes with initially normal SR release as shown in Fig. 12 A. CPA caused a strong rapid decline in the calculated flux amplitude. Caffeine led to a further small and slow progressive decrease.
Figure 12.

Alteration of calculated Ca2+ input flux on SR store depletion. A 100-ms pulse to +20 mV was repeated every 30 s and Ca2+ input and entry flux were estimated. Parameter values determined in the removal model fit analysis: koff , D = 43.4 ± 0.9 s−1, kon , S = 19.0 ± 1.2 μM−1 ms−1, koff , S = 2.92 ± 0.14 s−1, kUptake = 3,910 ± 264 s−1. (A) Ca2+ input flux amplitude, averaged over the interval 25–75 ms after pulse on. 30 μM CPA was applied to bath solution after the fifth voltage pulse leading to a strong decrease in flux amplitude and a rise in the resting free Ca2+ concentration (not depicted). The application of 10 mM caffeine five minutes later led only to a small further amplitude decrease. (B) Ca2+ input flux plotted against entry flux during the experiment. After drug application both signals showed a linear dependence; the mean ratio of input to entry flux after adding caffeine was 5.4 ± 2.2 (n = 3). (C) Ca2+ input flux before application of CPA and caffeine (mean of the first five recordings). (D) Ca2+ input flux after drug application (mean recordings within the time interval 10–20 min; note the 10-fold smaller scale). (E) Ca2+-entry flux derived from the inward current corrected for leak and capacitive components and scaled to the same amplitude as D.
In Fig. 12 B, Ca2+ input flux and Ca2+ entry flux are plotted versus each other. The plot shows that the initial strong decrease in amplitude occurred essentially independent of any change in Ca2+ entry while during the subsequent longer period in CPA- and caffeine-containing solution the amplitude of the input flux slowly declined in proportion to the entry flux. The only small additional effect of the high caffeine concentration and the close correlation between the two signals suggest that the remaining input flux consists exclusively of the Ca2+ entry component.
Fig. 12, C and D, show the time course of the calculated Ca2+ input flux before and after application of CPA and caffeine, respectively. Note that the vertical scale is 10-fold smaller in D compared with C. The time course was markedly changed after the drug application and closely resembled the time course of the flux derived from the Ca2+ inward current using Eq. 3, which is shown in Fig. 12 E. This is consistent with the suggestion that Ca2+ entry is the only source of Ca2+ under these conditions. In addition it is a very reassuring result regarding the quality of determining the time course of Ca2+ input flux with this method.
DISCUSSION
Removal Model Fit for Myotubes
In muscle cells, plasma membrane depolarization causes the activation of Ca2+ channels in both the plasma membrane and in the SR, leading to rapidly rising intracellular Ca2+ transients. In this study, we investigated depolarization-controlled Ca2+ transients in cultured myotubes, which are a preferred preparation for structure-function analyses in EC coupling. For the first time we applied the “removal model fit” approach to this preparation. This allowed us to extract, using fluorimetric Ca2+ signals, the flow of Ca2+ to the cytoplasm, termed “Ca2+ input flux”, which consists of Ca2+ release from the SR and Ca2+ entry from the extracellular space. We determined the voltage dependence of the Ca2+ input flux and the relative contribution of the two different flux components.
The decay of the voltage-activated Ca2+ transient after turning off input flux by repolarization provides information on the voltage-independent Ca2+ removal processes (binding and transport) that act in parallel to Ca2+ input during the depolarization. The “removal model fit” analysis makes use of fitting model-generated traces to measured Ca2+ transient decays (Melzer et al., 1986a; Timmer et al., 1998; Ríos and Brum, 2002). The result is a characterization of global removal properties that allows us to separate the unknown voltage-dependent flux from the removal activity during a period of depolarization.
The high intracellular concentration of the Ca2+ chelator EGTA in our experiments permitted us to choose a removal model with a simple structure and a small number of kinetic parameters. The reaction kinetics of any intrinsic Ca2+ binding site can be neglected for the removal calculation, because EGTA is in large excess of such sites. In particular, Fig. 5 shows that the influence of a fast binding component even 250 times greater than free Ca2+ will be negligible.
As in previous work on muscle fibers, a crucial assumption for the removal fit analysis was that the Ca2+ channel gates are closed during the fit intervals. Timmer et al. (1998) demonstrated that some degree of violation of this assumption (e.g., a slower termination of Ca2+ flux by repolarization) will lead to a relatively small alteration of the result. From the rapid change in slope of the Ca2+ signal at the end of the depolarization it is evident that the input flux does in fact decrease rapidly to low values (e.g., Fig. 1).
Compared with previous versions of the method that were applied to mature muscle fibers we introduced several changes that took into account the particular conditions in myotubes and helped to overcome difficulties in applying the procedure to this preparation. We designed a pulse protocol for a more rapid acquisition of the model parameters (Figs. 3 and 4), because the time available for acquiring data in patch-clamped myotubes is generally limited to <30 min. A number of decay phases starting from different free and bound Ca2+ levels could thus be obtained within a very short period of time by applying repetitive depolarizations separated by brief repolarizations. Voltage-dependent Ca2+ input flux undergoes changes (inactivation and depletion) that do not recover in the short repolarization intervals. The result of the removal analysis, however, is not influenced by these changes because it does not depend on assumptions regarding properties of the Ca2+ input mechanism other than that it is turned off during the fit intervals.
Evaluation of Model Parameters in the Removal Analysis
The model used for the removal analysis was similar to the one introduced by Melzer et al. (1986a). One difference was that it included the kinetic description of the indicator dye. In a novel approach we fitted the model directly to the indicator signals instead of using indicator-derived free Ca2+ records for the fit. In the analysis of the present experiments the fura-2 dissociation rate constant koff , Dye, which is an important determinant for estimating the time course of free myoplasmic Ca2+ (Eq. 4; Klein et al., 1988), was included as a free fit parameter. In agreement with measurements on mature muscle fibers (Baylor and Hollingworth, 1988; Klein et al., 1988; García and Schneider, 1993), we found koff , Dye to be considerably smaller than determined in vitro (Jackson et al., 1987; Kao and Tsien, 1988). Our value of 46 s−1 (at 20–23°C) was not very sensitive to changes in the assumed dissociation constant of fura-2 and therefore provided a quite robust estimate. The value was very close to the one obtained in our laboratory for the same preparation using a different method (45 s−1, Schuhmeier et al., 2003), but was almost twice as high as the estimate obtained in rat muscle fibers at 14–17°C (26 s−1, García and Schneider, 1993). The latter difference is largely consistent with the temperature dependence of the rate constant. Bakker et al. (1997) predicted a value of ∼40 s−1 at 22–24°C.
The compartment described by the rate constant kUptake was included in the model to account for the slow phase of decline seen after the first rapid phase of Ca2+ decay at the end of the depolarizing pulse. It likely results from the activity of the SR Ca2+ pump. kon , S and koff , S, on the other hand, should mainly characterize the binding activity of EGTA in the cell. The mean KD , S value of 246 nM (obtained when using the in vitro KD , Dye) is very close to the value of 238 nM calculated by Pape et al. (1995) for KD , app , EGTA in free solution at pH 7.1 and 20°C. The pH in our intracellular solution was 7.2. For this pH, using the same tabulated stability constants, we calculate a KD , app , EGTA of 150 nM.
It has been suggested that KD , Dye is up to four times higher in the cytoplasm than in free solution (Konishi et al., 1988). A value considerably larger than determined in the in vitro calibrations may therefore be more adequate to assume. In the analysis of Fig. 6 KD , Dye values of 150, 276, 500, and 1,000 nM led to mean KD , S values of 133, 246, 447, and 896, respectively. Therefore, if the intracellular affinity of fura-2 for Ca2+ is indeed reduced in myotubes, the analysis results indicate that EGTA is affected in a similar way.
However, the primary task of the model fit analysis is not to identify specific removal components and to separate pump activity from binding activity; instead it is used as a tool to describe overall removal with the goal of determining the rate of Ca2+ mobilization (Ca2+ input flux) from measured Ca2+ transients. This is based on the assumption that a model that fits the Ca2+ decaying phases of a cell well will suffice to describe the overall removal rate of Ca2+ and will therefore lead to a valid calculation of the voltage-triggered Ca2+ input flux during the depolarization (Melzer et al., 1987; Schneider et al., 1987a,b). The two compartments S and Uptake (Fig. 2 C) in addition to the one describing the dye reaction were sufficient to generate excellent simultaneous fits to the measured fluorescence transients in most of the cells (see Fig. 3) as indicated by the χ2/N values in Table I (see the table legend). However, the rate constants of S were about one order of magnitude larger than reported for EGTA in free solution (Smith et al., 1984). Interestingly, when the assumed KD,Dye was altered, equally good fits were obtained but leading to considerably different values of some of the free kinetic parameters (Fig. 6). On the other hand, the overall removal and consequently the calculated flux rate were almost invariant.
kon , S could be found to change over a sixfold range when changing KD , Dye between 150 and 1,000 nM. This demonstrates that individual model parameters determined with the fitting procedure depend on assumptions made for fura-2 properties in the cell. Since the true value of KD , Dye in the cell cannot be determined from these measurements, the removal model fit does not provide an unambiguous determination of these parameters. In particular, we cannot expect an absolute determination of the intracellular value of kon , EGTA by this method. Various estimates of kon , EGTA have been published. Smith et al. (1984) found 1.5 or 3.3 106 M−1s−1 at 25°C in a stopped flow study in 0.1 M KCl solution. Naraghi (1997) reports a value of 2.7 106 M−1s−1 in a temperature jump study (range between 17°C and 22°C) in a solution resembling more intracellular conditions. In intracellular measurements in cut frog muscle fibers loaded with a solution containing 20 mM EGTA, Pape et al. (1995) obtained 2.5 106 M−1s−1. As in our case, this value depended on assumptions made by the authors for intracellular indicator properties. Our value of kon , S (5.84 106 M−1s−1) obtained at the highest assumed fura-2 KD (Fig. 6 A) is 2.3 times larger than the mean value of these estimates.
koff , S was also higher than in vitro estimates of koff , EGTA, but, unlike kon , S, it was insensitive to changes in KD , Dye. Moreover, it showed values consistent with the results of other groups (Shirokova et al., 1996; Song et al., 1998). It may therefore be a reliable absolute estimate of koff , EGTA in the cell. Importantly, the insensitivity to assumptions made for fura-2 was also true for the final calculation result of the analysis, i.e., the Ca2+ input flux (Fig. 6 F).
Characteristics of Ca2+ Input Flux in Myotubes
As a model system to study Ca2+ input flux in myotubes, we chose the mouse C2C12 muscle cell line (Blau et al., 1983), which has previously been reported (by use of other methods) to exhibit characteristics of mature skeletal muscle–type EC coupling. In particular, depolarization by high [K+] induced Ca2+ transients that were independent of external Ca2+ (Lorenzon et al., 2000). In a previous paper, using a method derived from Song et al. (1998) to calculate Ca2+ input flux, we showed that the flux underlying voltage clamp–activated fura-2 Ca2+ transients in C2C12 myotubes has similar characteristics as in primary cultured mouse myotubes and in mature fibers (Schuhmeier et al., 2003). The advantage of the approach used in the present study is the straightforward algorithmic procedure to quantify removal and the possibility to determine the Ca2+ input flux by taking into account the specific situation of each cell instead of using a set of averaged parameter values for all analyzed cells. To obtain details on Ca2+ signaling in microdomains of the cells, other optical techniques, like confocal microscopy, are required (Ríos and Brum, 2002, Schneider and Ward, 2002). For instance, Shirokova et al. (1999) detected regions of different responsiveness to voltage in primary-cultured myotubes of neonatal mice using confocal line scanning in combination with whole cell patch clamping. An extension of our approach to spatially-resolved Ca2+ signals should be possible. But high-resolution space-time data from voltage-clamped cells are difficult to acquire and to quantify. Thus, for an efficient comparison of cells expressing mutant proteins, the use of global Ca2+ signals as in the present study seems more appropriate.
When internal Ca2+ release got smaller, a Ca2+ inward current–dependent component of input flux, which was normally hidden by the large release flux, became evident. Together with store depletion it was one cause for the variable decrease of the Ca2+ input flux amplitudes at larger depolarizations. In extreme cases only this component was present and, consequently, SR Ca2+ release appeared to be absent. A reason for the variable fractional contribution of release could not be identified. Cells with high and very low internal Ca2+ release were found next to each other in the same dish, as was the case for the cells shown in Figs. 7 and 11. The two myotubes had similar size as judged by the membrane capacitance. Apparently some myotubes either do not possess a functional Ca2+ release mechanism or, for some unknown reason, have become deficient in stored Ca2+. To purposely eliminate the driving force for SR Ca2+ release, we applied CPA and caffeine. This likewise led to Ca2+ input fluxes with similar kinetic characteristics as the Ca2+ inward current and could be used as a test for the method's reliability to reproduce flux kinetics.
The mean ratio of input to entry flux (optical to electrical determination) in the experiments with CPA- and caffeine-depleted SR was 5.4 ± 2.2 (n = 3), i.e., very close to the value obtained in experiments described in Figs. 10 and 11 with the likely a priori absence of SR Ca2+ release (5.6 ± 1.0, n = 8). The size difference indicates difficulties in quantifying absolute amplitudes by one or both of the two methods for entry flux determination. This should not come as a surprise since we deal with very small Ca2+ transients and the calculations include a number of assumptions. For instance, the volume fraction fV (Eq. 3) that is rapidly accessible to entering Ca2+ will be smaller than the upper bound (=1) that was chosen for the calculation. The smaller fV value due to the presence of organelles and diffusion barriers will thus reduce the amplitude ratio by an unknown factor. fV may not be identical to the space fraction that is accessible to the indicator by slow diffusion. The latter has been estimated to be 0.7 for frog muscle fibers by taking into consideration the space occupied by organelles (Baylor et al., 1983). If the same factor applied to myotubes, the ratio of the entry flux values determined with the two different methods would be 3.8 instead of 5.4. But it may well be considerably smaller. Further, one might argue that an incorrect experimental determination of VC could have caused the discrepancy. We rule this out because our volume determinations (Schuhmeier et al., 2003) proved to be very precise in measurements using microcapillaries of known dimensions (50 μm internal diameter) filled with the same fluorescent dye. Also, cell capacitance can be measured precisely and any systematic error in capacitance recording should cancel out because capacitance was measured in the same way in the flux experiments and in the experiments used for the VC determinations. We also consider it unlikely that the group of cells which were used for the VC determination differed in VC from the cells that were used for the entry flux determination. Thus, we believe that the main uncertainty in the quantification of entry flux by Eq. 3 results from fV. On the other hand, in the optical flux determination, the amplitude critically depends on the assumed effective concentration of EGTA in the cell as shown in Fig. 5 E. In summary, both flux estimates, electrical and optical, carry uncertainties regarding absolute scale. Given these uncertainties, the two different entry flux determinations led to relatively close values.
The cells summarized as group A in Table II exhibited large Ca2+ transients and both peak and plateau showed an essentially sigmoidal voltage dependence (see Fig. 8 C) as is typical for mature skeletal muscle fibers (Melzer et al., 1986b; Shirokova et al., 1996). This indicates that voltage-controlled Ca2+ release from the SR is the main determinant of the Ca2+ input flux in these cells. The characteristics of Ca2+ release obtained from this group of myotubes are in overall agreement with our previous determinations in primary-cultured myotubes using alternative approaches (Dietze et al., 1998, 2000; Ursu et al., 2001). In particular, the flux showed a pronounced peak, a plateau that decayed slowly and a rapid deactivation response to repolarization. A striking difference in these components, possibly corresponding to important differences in the release mechanism, has been reported when comparing frog and rat muscle fibers: In frog muscle, the flux ratio (peak/plateau − 1 in our notation) shows a pronounced maximal value of approximately seven at intermediate voltages while in rat muscle it shows values around two and no maximum at all (Shirokova et al., 1996). These observations have been attributed to differences in structure of the coupling units. In frog muscle, roughly equal amounts of the two ryanodine receptor isoforms α and β were found (Murayama and Ogawa, 1992) whereas in most mammalian muscles, one ryanodine receptor isoform (RyR1) predominates (for review see Sorrentino and Reggiani, 1999). Stern et al. (1997) proposed that the maximum of the flux ratio at intermediate voltages observed in frog muscle mainly results from Ca2+-dependent activation of Ca2+ release channels organized in a cluster. The presence of the β isoform (corresponding to RyR3) in frog muscle and its likely arrangement in a parajunctional lattice (Felder and Franzini-Armstrong, 2002) may endow the cluster with a higher Ca2+ sensitivity. The flux ratios in C2C12 myotubes showed no pronounced maximum at a particular voltage (Fig. 8 D). Instead they increased linearly with voltage with a shallow slope and therefore resemble the behavior found in mature rat muscle (Shirokova et al., 1996), which may be attributed to a tighter voltage control of Ca2+ release than in frog muscle.
Conclusion
Even though the removal model approach has provided valuable information regarding the voltage control of intracellular Ca2+ release in muscle fibers (e.g., Melzer et al., 1986a; Simon et al., 1991; Csernoch et al., 1993; González and Ríos, 1993; Delbono et al., 1995; Shirokova et al., 1996; Szentesi et al., 2000), it has up to now not been used on cultured myotubes because of the difficulty to obtain high quality Ca2+ recordings under voltage clamp conditions in this preparation. In the present investigation we filled the gap and applied the removal model analysis to determine both time course and voltage dependence of Ca2+ release flux in myotubes. Cultured skeletal myocytes have gained considerable importance as gene expression systems for structure-function analysis in EC coupling (e.g., Tanabe et al., 1988; Nakai et al., 1996; Beurg et al., 1997). Mutations in heterologously expressed EC-coupling proteins may lead to changes in Ca2+ input flux that are not obvious by simple inspection of the Ca2+ transient amplitudes. Hence, a thorough investigation of time course and voltage dependence of the fluxes underlying Ca2+ signals, as performed here on normal myotubes, should be included in future studies to fully characterize functional changes in genetically altered preparations.
 |
(A5) |
 |
Acknowledgments
We are grateful to Drs. F. Lehmann-Horn, H. Brinkmeier, W. Horbelt, J. Timmer, and W. Spiecker for advice and suggestions. We thank E. Schoch for designing and constructing equipment, D. Ursu for the determination of volume-capacitance ratios, and Dr. K. Föhr for providing software for the calculation of binding equilibria. We also thank W. Fritz and E. Schmid for help with the carbon-coating of coverslips and S. Schäfer, E. Gouadon, and U. Richter for help with cell culture and solutions.
The work was supported by a grant of the Deutsche Forschungsgemeinschaft to W. Melzer (ME-713/10-2, 3) and a stipend of Graduiertenkolleg 182 to R.P. Schuhmeier.
Olaf S. Andersen served as editor.
APPENDIX
Semiimplicit Integration of Model Differential Equations
Eqs. 7–13 form a “stiff” set of differential equations. The [Ca 2+]-compartment shows a time constant τ of relaxation of ∼50 μs after a change in Ca2+-input flux at low [Ca 2+] in the presence of 15 mM EGTA, whereas other compartments show much slower relaxation (e.g., for [Ca2+ Dye] τ is in the range of 10–20 ms, see Schuhmeier et al., 2003). As a consequence, the numerical solution y(t) may oscillate, unless the integration step size Δt = t i + 1 − ti is reduced to a small fraction of the sampling interval of fluorescence data acquisition (0.25 ms).
The calculation effort caused by greatly reduced Δt can be avoided by (a) automatic step size control or (b) usage of implicit instead of explicit integration (Kincaid and Cheney, 1991). In implicit integration the calculation term for the solution y(t i + 1) during integration step i + 1 includes y(t i + 1). It can be regarded as an integration in the reverse direction. y(t i + 1) is usually found by iteration. For Euler integration, explicit integration is given by Eq. A1 while an implicit algorithm is shown in Eq. A2:
 |
(A1) |
 |
(A2) |
We chose a semiimplicit approach that combined implicit Euler integration for the stiff component [Ca 2+] with explicit Euler integration for the remaining compartments [X] (Eqs. A3 and A4).
 |
(A3) |
 |
(A4) |
Here f
Ca and f
X are the time derivatives of [Ca
2+] (see Eq. 13, with  [Ca
2+]total = 0) and the components [X] (Eqs. 7 and 9), respectively. This set of equations can be analytically solved for [Ca
2+](t
i + 1). The result obtained from Eqs. 7–13 and A3 is shown in Eq. A5.
[Ca
2+]total = 0) and the components [X] (Eqs. 7 and 9), respectively. This set of equations can be analytically solved for [Ca
2+](t
i + 1). The result obtained from Eqs. 7–13 and A3 is shown in Eq. A5.
Thus, the integration step size reduction is circumvented and the differential equations can be integrated using steps that correspond to the data sampling interval. This method was used to simulate fluorescence ratios for fitting the measured ratio signals during relaxation. For the Ca2+ input flux calculations from measured fluorescence ratios, on the other hand, [Ca 2+] does not need to be solved by numerical integration but was calculated according to Eq. 4.
The semiimplicit integration approach proved to be a very fast and efficient way to integrate the given set of differential equations without compromising accuracy (as compared with explicit Euler integration with greatly reduced step size). Furthermore, by avoiding adaptive step size control and iterative search for [Ca 2+](t i + 1), any possible instabilities that may arise from these error-controlled algorithms are prevented in the model fit procedure.
References
- Bakker, A.J., S.I. Head, and D.G. Stephenson. 1997. Time course of calcium transients derived from Fura-2 fluorescence measurements in single fast twitch fibres of adult mice and rat myotubes developing in primary culture. Cell Calcium. 21:359–364. [DOI] [PubMed] [Google Scholar]
- Baylor, S.M., W.K. Chandler, and M.W. Marshall. 1983. Sarcoplasmic reticulum calcium release in frog skeletal muscle fibres estimated from Arsenazo III calcium transients. J. Physiol. 344:625–666. [DOI] [PMC free article] [PubMed] [Google Scholar]
- Baylor, S.M., and S. Hollingworth. 1988. Fura-2 calcium transients in frog skeletal muscle fibres. J. Physiol. 403:151–192. [DOI] [PMC free article] [PubMed] [Google Scholar]
- Baylor, S.M., and S. Hollingworth. 1998. Model of sarcomeric Ca2+ movements, including ATP Ca2+ binding and diffusion, during activation of frog skeletal muscle. J. Gen. Physiol. 112:297–316. [DOI] [PMC free article] [PubMed] [Google Scholar]
- Beam, K.G., and C. Franzini-Armstrong. 1997. Functional and structural approaches to the study of excitation- contraction coupling. Methods Cell Biol. 52:283–306. [DOI] [PubMed] [Google Scholar]
- Beurg, M., M. Sukhareva, C. Strube, P.A. Powers, R.G. Gregg, and R. Coronado. 1997. Recovery of Ca2+ current, charge movements, and Ca2+ transients in myotubes deficient in dihydropyridine receptor beta 1 subunit transfected with beta 1 cDNA. Biophys. J. 73:807–818. [DOI] [PMC free article] [PubMed] [Google Scholar]
- Blau, H.M., C.P. Chiu, and C. Webster. 1983. Cytoplasmic activation of human nuclear genes in stable heterocaryons. Cell. 32:1171–1180. [DOI] [PubMed] [Google Scholar]
- Csernoch, L., V. Jacquemond, and M.F. Schneider. 1993. Microinjection of strong calcium buffers suppresses the peak of calcium release during depolarization in frog skeletal muscle fibers. J. Gen. Physiol. 101:297–333. [DOI] [PMC free article] [PubMed] [Google Scholar]
- Delbono, O., K.S. O'Rourke, and W.H. Ettinger. 1995. Excitation-calcium release uncoupling in aged single human skeletal muscle fibers. J. Membr. Biol. 148:211–222. [DOI] [PubMed] [Google Scholar]
- Dietze, B., F. Bertocchini, V. Barone, A. Struk, V. Sorrentino, and W. Melzer. 1998. Voltage-controlled Ca2+ release in normal and ryanodine receptor type 3 (RyR3)-deficient mouse myotubes. J. Physiol. 513:3–9. [DOI] [PMC free article] [PubMed] [Google Scholar]
- Dietze, B., J. Henke, H.M. Eichinger, F. Lehmann-Horn, and W. Melzer. 2000. Malignant hyperthermia mutation Arg615Cys in the porcine ryanodine receptor alters voltage dependence of Ca2+ release. J. Physiol. 526:507–514. [DOI] [PMC free article] [PubMed] [Google Scholar]
- Dirksen, R.T. 2002. Bi-directional coupling between dihydropyridine receptors and ryanodine receptors. Front. Biosci. 7:d659–d670. [DOI] [PubMed] [Google Scholar]
- Felder, E., and C. Franzini-Armstrong. 2002. Type 3 ryanodine receptors of skeletal muscle are segregated in a parajunctional position. Proc. Natl. Acad. Sci. USA. 99:1695–1700. [DOI] [PMC free article] [PubMed] [Google Scholar]
- Föhr, K.J., W. Warchol, and M. Gratzl. 1993. Calculation and control of free divalent cations in solutions used for membrane fusion studies. Methods Enzymol. 221:149–157. [DOI] [PubMed] [Google Scholar]
- García, J., and M.F. Schneider. 1993. Calcium transients and calcium release in rat fast-twitch skeletal muscle fibres. J. Physiol. 463:709–728. [DOI] [PMC free article] [PubMed] [Google Scholar]
- González, A., and E. Ríos. 1993. Perchlorate enhances transmission in skeletal muscle excitation-contraction coupling. J. Gen. Physiol. 102:373–421. [DOI] [PMC free article] [PubMed] [Google Scholar]
- Jackson, A.P., M.P. Timmerman, C.R. Bagshaw, and C.C. Ashley. 1987. The kinetics of calcium binding to fura-2 and indo-1. FEBS Lett. 216:35–39. [DOI] [PubMed] [Google Scholar]
- Jiang, Y.H., M.G. Klein, and M.F. Schneider. 1999. Numerical simulation of Ca2+ “Sparks” in skeletal muscle. Biophys. J. 77:2333–2357. [DOI] [PMC free article] [PubMed] [Google Scholar]
- Kao, J.P., and R.Y. Tsien. 1988. Ca2+ binding kinetics of fura-2 and azo-1 from temperature-jump relaxation measurements. Biophys. J. 53:635–639. [DOI] [PMC free article] [PubMed] [Google Scholar]
- Kincaid, D., and W. Cheney. 1991. Numerical Analysis. Brooks/Cole, Pacific Grove, CA. 486 pp.
- Klein, M.G., A. Lacampagne, and M.F. Schneider. 1997. Voltage dependence of the pattern and frequency of discrete Ca2+ release events after brief repriming in frog skeletal muscle. Proc. Natl. Acad. Sci. USA. 94:11061–11066. [DOI] [PMC free article] [PubMed] [Google Scholar]
- Klein, M.G., B.J. Simon, G. Szücs, and M.F. Schneider. 1988. Simultaneous recording of calcium transients in skeletal muscle using high- and low-affinity calcium indicators. Biophys. J. 53:971–988. [DOI] [PMC free article] [PubMed] [Google Scholar]
- Konishi, M., A. Olson, S. Hollingworth, and S.M. Baylor. 1988. Myoplasmic binding of fura-2 investigated by steady-state fluorescence and absorbance measurements. Biophys. J. 54:1089–1104. [DOI] [PMC free article] [PubMed] [Google Scholar]
- Lasdon, L.S., R.L. Fox, and M.W. Ratner. 1974. Nonlinear optimization using the generalized reduced gradient method. R. A. I. R. O. V-3:73–104. [Google Scholar]
- Lasdon, L.S., A.D. Waren, A. Jain, and M.W. Ratner. 1978. Design and testing of a generalized reduced gradient code for nonlinear programming. ACM Trans. Math. Softw. 4:34–50. [Google Scholar]
- Lorenzon, P., F. Grohovaz, and F. Ruzzier. 2000. Voltage- and ligand-gated ryanodine receptors are functionally separated in developing C2C12 mouse myotubes. J. Physiol. 525:499–507. [DOI] [PMC free article] [PubMed] [Google Scholar]
- Matsuda, S., H. Kusuoka, K. Hashimoto, E. Tsujimura, and T. Nishimura. 1996. The effects of proteins on [Ca2+] measurement: different effects on fluorescent and NMR methods. Cell Calcium. 20:425–430. [DOI] [PubMed] [Google Scholar]
- Melzer, W., A. Herrmann-Frank, and H.C. Lüttgau. 1995. The role of Ca2+ ions in excitation-contraction coupling of skeletal muscle fibres. Biochim. Biophys. Acta. 1241:59–116. [DOI] [PubMed] [Google Scholar]
- Melzer, W., E. Rios, and M.F. Schneider. 1984. Time course of calcium release and removal in skeletal muscle fibers. Biophys. J. 45:637–641. [DOI] [PMC free article] [PubMed] [Google Scholar]
- Melzer, W., E. Rios, and M.F. Schneider. 1986. a. The removal of myoplasmic free calcium following calcium release in frog skeletal muscle. J. Physiol. 372:261–292. [DOI] [PMC free article] [PubMed] [Google Scholar]
- Melzer, W., E. Rios, and M.F. Schneider. 1987. A general procedure for determining the rate of calcium release from the sarcoplasmic reticulum in skeletal muscle fibers. Biophys. J. 51:849–863. [DOI] [PMC free article] [PubMed] [Google Scholar]
- Melzer, W., M.F. Schneider, B.J. Simon, and G. Szücs. 1986. b. Intramembrane charge movement and calcium release in frog skeletal muscle. J. Physiol. 373:481–511. [DOI] [PMC free article] [PubMed] [Google Scholar]
- Murayama, T., and Y. Ogawa. 1992. Purification and characterization of two ryanodine-binding protein isoforms from sarcoplasmic reticulum of bullfrog skeletal muscle. J. Biochem. (Tokyo). 112:514–522. [DOI] [PubMed] [Google Scholar]
- Nakai, J., R.T. Dirksen, H.T. Nguyen, I.N. Pessah, K.G. Beam, and P.D. Allen. 1996. Enhanced dihydropyridine receptor channel activity in the presence of ryanodine receptor. Nature. 380:72–75. [DOI] [PubMed] [Google Scholar]
- Naraghi, M. 1997. T-jump study of calcium binding kinetics of calcium chelators. Cell Calcium. 22:255–268. [DOI] [PubMed] [Google Scholar]
- Pape, P.C., and N. Carrier. 1998. Effect of sarcoplasmic reticulum (SR) calcium content on SR calcium release elicited by small voltage-clamp depolarizations in frog cut skeletal muscle fibers equilibrated with 20 mM EGTA. J. Gen. Physiol. 112:161–179. [DOI] [PMC free article] [PubMed] [Google Scholar]
- Pape, P.C., D.S. Jong, and W.K. Chandler. 1995. Calcium release and its voltage dependence in frog cut muscle fibers equilibrated with 20 mM EGTA. J. Gen. Physiol. 106:259–336. [DOI] [PMC free article] [PubMed] [Google Scholar]
- Pape, P.C., D.S. Jong, W.K. Chandler, and S.M. Baylor. 1993. Effect of fura-2 on action potential-stimulated calcium release in cut twitch fibers from frog muscle. J. Gen. Physiol. 102:295–332. [DOI] [PMC free article] [PubMed] [Google Scholar]
- Press, W.H., S.A. Teutolsky, W.T. Vetterling, and B.P. Flannery. 1992. Numerical Recipes in Fortran. 2nd ed. Cambridge University Press, Cambridge, MA. 684 pp.
- Ríos, E., and G. Brum. 2002. Ca2+ release flux underlying Ca2+ transients and Ca2+ sparks in skeletal muscle. Front. Biosci. 7:d1195–d1211. [DOI] [PubMed] [Google Scholar]
- Ríos, E., M.D. Stern, A. González, G. Pizarro, and N. Shirokova. 1999. Calcium release flux underlying Ca2+ sparks of frog skeletal muscle. J. Gen. Physiol. 114:31–48. [DOI] [PMC free article] [PubMed] [Google Scholar]
- Schneider, M.F. 1999. Ca2+ sparks in frog skeletal muscle: generation by one, some, or many SR Ca2+ release channels? J. Gen. Physiol. 113:365–372. [DOI] [PMC free article] [PubMed] [Google Scholar]
- Schneider, M.F., E. Ríos, and W. Melzer. 1987. a. Determining the rate of calcium release from the sarcoplasmic reticulum in muscle fibers. Biophys. J. 51:1005–1007. [DOI] [PMC free article] [PubMed] [Google Scholar]
- Schneider, M.F., B.J. Simon, and G. Szücs. 1987. b. Depletion of calcium from the sarcoplasmic reticulum during calcium release in frog skeletal muscle. J. Physiol. 392:167–192. [DOI] [PMC free article] [PubMed] [Google Scholar]
- Schneider, M.F., and C.W. Ward. 2002. Initiation and termination of calcium sparks in skeletal muscle. Front. Biosci. 7:d1212–d1222. [DOI] [PubMed] [Google Scholar]
- Schuhmeier, R.P., B. Dietze, D. Ursu, F. Lehmann-Horn, and W. Melzer. 2003. Voltage-activated calcium signals in myotubes loaded with high concentrations of EGTA. Biophys. J. 84:1065–1078. [DOI] [PMC free article] [PubMed] [Google Scholar]
- Shirokova, N., J. García, G. Pizarro, and E. Ríos. 1996. Ca2+ release from the sarcoplasmic reticulum compared in amphibian and mammalian skeletal muscle. J. Gen. Physiol. 107:1–18. [DOI] [PMC free article] [PubMed] [Google Scholar]
- Shirokova, N., A. Gonzalez, J. Ma, R. Shirokov, and E. Rios. 1995. Properties and roles of an intramembranous charge mobilized at high voltages in frog skeletal muscle. J. Physiol. 486:385–400. [DOI] [PMC free article] [PubMed] [Google Scholar]
- Shirokova, N., R. Shirokov, D. Rossi, A. González, W.G. Kirsch, J. García, V. Sorrentino, and E. Ríos. 1999. Spatially segregated control of Ca2+ release in developing skeletal muscle of mice. J. Physiol. 521:483–495. [DOI] [PMC free article] [PubMed] [Google Scholar]
- Simon, B.J., M.G. Klein, and M.F. Schneider. 1991. Calcium dependence of inactivation of calcium release from the sarcoplasmic reticulum in skeletal muscle fibers. J. Gen. Physiol. 97:437–471. [DOI] [PMC free article] [PubMed] [Google Scholar]
- Smith, P.D., G.W. Liesegang, R.L. Berger, G. Czerlinski, and R.J. Podolsky. 1984. A stopped-flow investigation of calcium ion binding by ethylene glycol bis(beta-aminoethyl ether)-N,N'-tetraacetic acid. Anal. Biochem. 143:188–195. [DOI] [PubMed] [Google Scholar]
- Song, L.S., J.S. Sham, M.D. Stern, E.G. Lakatta, and H. Cheng. 1998. Direct measurement of SR release flux by tracking ‘Ca2+ spikes’ in rat cardiac myocytes. J. Physiol. 512:677–691. [DOI] [PMC free article] [PubMed] [Google Scholar]
- Sorrentino, V., and C. Reggiani. 1999. Expression of the ryanodine receptor type 3 in skeletal muscle. A new partner in excitation-contraction coupling? Trends Cardiovasc. Med. 9:54–61. [DOI] [PubMed] [Google Scholar]
- Stern, M.D., G. Pizarro, and E. Ríos. 1997. Local control model of excitation-contraction coupling in skeletal muscle. J. Gen. Physiol. 110:415–440. [DOI] [PMC free article] [PubMed] [Google Scholar]
- Szentesi, P., L. Kovacs, and L. Csernoch. 2000. Deterministic inactivation of calcium release channels in mammalian skeletal muscle. J. Physiol. 528:447–456. [DOI] [PMC free article] [PubMed] [Google Scholar]
- Tanabe, T., K.G. Beam, J.A. Powell, and S. Numa. 1988. Restoration of excitation-contraction coupling and slow calcium current in dysgenic muscle by dihydropyridine receptor complementary DNA. Nature. 336:134–139. [DOI] [PubMed] [Google Scholar]
- Timmer, J., T. Müller, and W. Melzer. 1998. Numerical methods to determine calcium release flux from calcium transients in muscle cells. Biophys. J. 74:1694–1707. [DOI] [PMC free article] [PubMed] [Google Scholar]
- Ursu, D., S. Sebille, B. Dietze, D. Freise, V. Flockerzi, and W. Melzer. 2001. Excitation-contraction coupling in skeletal muscle of a mouse lacking the dihydropyridine receptor subunit gamma1. J. Physiol. 533:367–377. [DOI] [PMC free article] [PubMed] [Google Scholar]