

Abstract
We have explored whether γ-aminobutyric acid (GABA) is released by regulated exocytosis of GABA-containing synaptic-like microvesicles (SLMVs) in insulin-releasing rat pancreatic β-cells. To this end, β-cells were engineered to express GABAA-receptor Cl−-channels at high density using adenoviral infection. Electron microscopy indicated that the average diameter of the SLMVs is 90 nm, that every β-cell contains ∼3,500 such vesicles, and that insulin-containing large dense core vesicles exclude GABA. Quantal release of GABA, seen as rapidly activating and deactivating Cl−-currents, was observed during membrane depolarizations from −70 mV to voltages beyond −40 mV or when Ca2+ was dialysed into the cell interior. Depolarization-evoked GABA release was suppressed when Ca2+ entry was inhibited using Cd2+. Analysis of the kinetics of GABA release revealed that GABA-containing vesicles can be divided into a readily releasable pool and a reserve pool. Simultaneous measurements of GABA release and cell capacitance indicated that exocytosis of SLMVs contributes ∼1% of the capacitance signal. Mathematical analysis of the release events suggests that every SLMV contains 0.36 amol of GABA. We conclude that there are two parallel pathways of exocytosis in pancreatic β-cells and that release of GABA may accordingly be temporally and spatially separated from insulin secretion. This provides a basis for paracrine GABAergic signaling within the islet.
Keywords: GABA, GAD65, pancreatic islets, paracrine communication, SLMV
INTRODUCTION
Type 1 diabetes mellitus is caused by the selective autoimmune destruction of insulin-producing β-cells in pancreatic islets of Langerhans. One of the most important autoantigens in type 1 diabetes is the 65-kD isoform of glutamate decarboxylase (GAD65). Antibodies against GAD65 are formed in 75–84% of the patients (Schmidli et al., 1994). GAD65-reactive cytotoxic T-lymphocytes can mediate the autoimmune destruction of the β-cells (Yoon et al., 1999). Despite the importance of GAD65 in the disease process, its physiological role in pancreatic islets is still unclear.
GAD65 and the second isoform of glutamate decarboxylase, GAD67, catalyze the formation of the inhibitory neurotransmitter GABA from glutamate. Both GAD and GABA are present in pancreatic islets at concentrations similar to those encountered in classical GABAergic regions of the brain (Taniguchi et al., 1977). In pancreatic islets, both GAD and GABA selectively localize to β-cells (Michalik and Erecinska, 1992). While GABA has been ascribed an intracellular role as a fuel in β-cells (Sorenson et al., 1991), the finding of inhibitory effects of exogenously added GABA on the secretion of insulin (Shi et al., 2000), glucagon (Rorsman et al., 1989), and somatostatin (Robbins et al., 1981) suggested a putative function as a paracrine transmitter. Indeed, GABA receptors have been demonstrated in different cell types of pancreatic islets (Rorsman et al., 1989; Yang et al., 1994; von Blankenfeld et al., 1995).
Understanding the function of GABA as a paracrine transmitter in islets requires information on how, if at all, GABA is secreted from β-cells and its regulation. Studies on the release of GABA from β-cells, however, have so far yielded conflicting results (Ahnert-Hilger and Wiedenmann, 1992; Smismans et al., 1997), which may partially be due to the lack of an assay with high temporal and quantitative resolution.
In β-cells, GAD65 and GABA are excluded from insulin-containing large dense-core vesicles (LDCVs) (Garry et al., 1988) and are instead believed to principally associate with synaptic-like microvesicles (SLMVs) (Reetz et al., 1991; Thomas-Reetz et al., 1993). SLMVs share many protein components with synaptic vesicles of neurons and can be found in several endocrine cell types (Thomas-Reetz and De Camilli, 1994). Classical high-resolution techniques for monitoring exocytosis, such as capacitance measurements, cannot readily distinguish between LDCVs and SLMVs. Indeed, it has been proposed that an early rapid component of capacitance increase results from release of SLMVs (Takahashi et al., 1997). We have developed a novel method that allows the detection of individual GABA-containing vesicles at high temporal resolution. We show here that GABA is promptly released by regulated Ca2+-dependent exocytosis during membrane depolarizations to physiological voltages. This provides a basis for paracrine intercellular signaling exerted by GABA within the islet micro-organ.
MATERIALS AND METHODS
Adenovirus Construction
cDNAs encoding the GABAAα1 and the GABAAβ1 subunits of the human GABAA receptor were subcloned into the shuttle vector pACCMV.pLpA (Becker et al., 1994). The plasmids pACCMV-GABAAα1 and pACCMV-GABAAβ1 were cotransfected into HEK293 cells together with pJM17 to obtain recombinant adenoviruses encoding either the GABAAα1 or the GABAAβ1 receptor subunits. Viral titres were determined by agarose overlay of HEK293 cells (Becker et al., 1994).
Islet Cell Preparation and Infection
Pancreatic islets were isolated from Sprague-Dawley or Wistar rats by collagenase digestion as described elsewhere (Olofsson et al., 2002). All experiments involving animal experiments were performed in accordance with the regulations of the ethical committee at Lund University. Single cells were prepared by triculation of islets in Ca2+-free solution. The cells were coinfected with the recombinant adenoviruses encoding the GABAAα1 and GABAAβ1 subunits (10–100 pfu/cell) and used for experiments 24–48 h after infection. In some initial experiments (Figs. 6 A and 8), 20 mM of GABA was added to the culture medium to ensure that the GABA-containing vesicles are not depleted of GABA; no difference in the properties of GABA release were detected between the loaded and unloaded cells. It was ascertained separately by immunogold electron microscopy that GABA did not accumulate in insulin-containing LDCV during this procedure (unpublished data).
Figure 6.
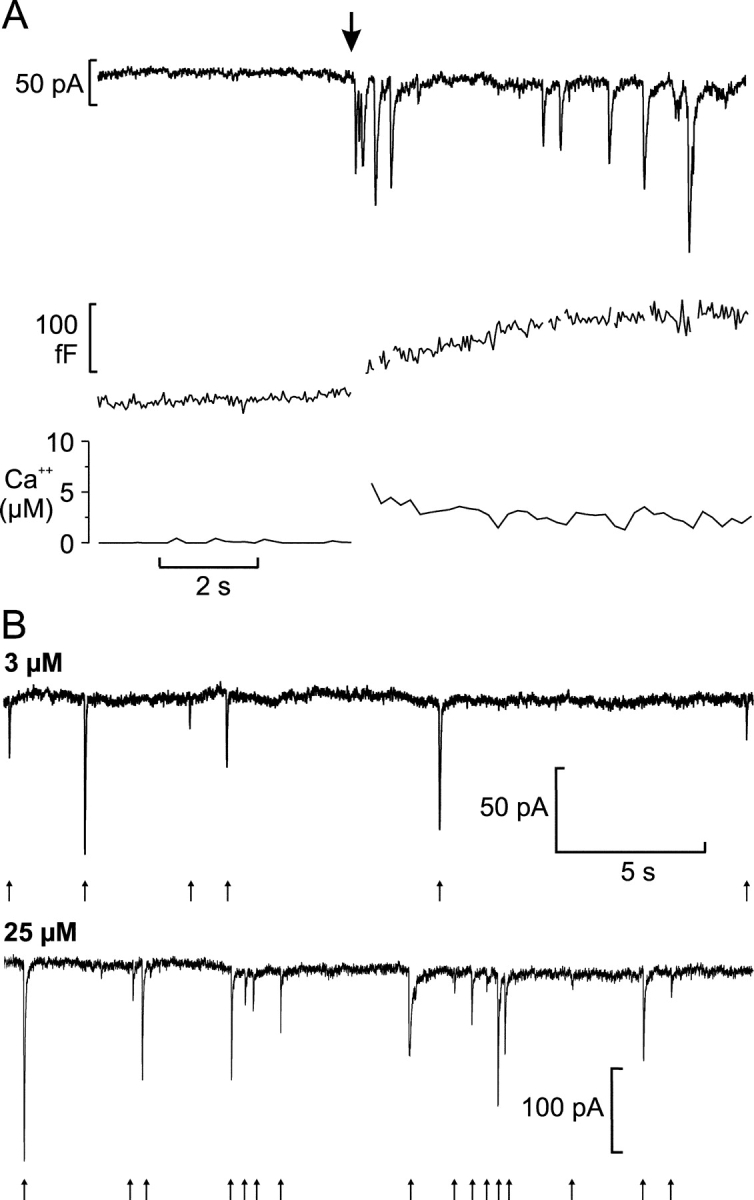
Ca2+ dependence of GABA release. (A) Cl− current transients (top) and increase in cell capacitance (middle) elicited by an increase in [Ca2+]i (bottom) produced by photorelease from caged Ca2+ preloaded into the cell. The cell was held at −70 mV and the time of photoliberation is indicated by the arrow (artifacts in the capacitance trace caused by the Cl− current transients have been removed). (B) Representative recordings of Cl− current transients (indicated by arrows) from cells infused with pipette solution containing 3 μM (top) or 25 μM (bottom) free Ca2+.
Electrophysiology
Patch pipettes were pulled from borosilicate glass (tip resistance 3–6 MΩ). The electrophysiological measurements were conducted using the perforated patch (Fig. 8) or standard whole-cell configuration (all other experiments). In the former type of recordings, electrical contact was established by inclusion of the pore-forming antibiotic amphotericin B into the pipette solution (final concentration: 0.24 mg/ml). The measurements were performed using an EPC9 patch-clamp amplifier (HEKA Electronics) and Pulse software (version 8.31, HEKA). β-cells were identified based on their size and on the inactivation properties of voltage-gated sodium currents (Hiriart and Matteson, 1988; Göpel et al., 1999).
Figure 8.

cAMP stimulation of GABA exocytosis. (A) Cl− current transients elicited by trains of 500-ms depolarizations before (top) and 2 min after (bottom) addition of forskolin (2 μM) to the bath solution. (B) Histogram summarizing the GABA release events elicited per train under control conditions and after stimulation with forskolin. (C) As in B but instead showing the total increase in cell capacitance (ΔCm) elicited by the train. In B and C, the data are mean values ± SEM of 10 experiments.
For the recording of GABA-induced current transients, the cells were normally held at −70 mV and depolarizations were 500 ms long and went (unless otherwise indicated) to 0 mV. Exocytosis was detected as changes in cell capacitance, which was estimated by the Lindau-Neher technique implementing the “Sine + DC” feature of the lock-in module of the Pulse software. The amplitude of the sine wave was 20 mV and the frequency was set to 500 Hz.
Photorelease of Caged Calcium
Photolysis of Ca2+ nitrophenyl-EGTA was elicited by brief UV light flashes (<2 ms; XF-10, HiTech). Increases in intracellular Ca2+ were measured by dual wavelength spectrofluorimetry using the Ca2+ indicator Fura FF (100 μM; Molecular Probes) in an Ionoptix fluorescence-imaging system equipped with the software IonWizard (IonOptix). Concentrations of intracellular Ca2+ were calculated using a KD of 35 μM for the Ca2+–Fura FF complex in the presence of Mg2+. Initial [Ca2+]i was estimated to be ∼0.3 μM.
Solutions
The standard extracellular solution consisted of (in mM unless stated otherwise) 118 NaCl, 20 TEACl, 5.6 KCl, 2.6 CaCl2, 1.2 MgCl2, 5 HEPES, and 5 glucose (pH 7.4 with NaOH). The pipette solution for recording of currents evoked by external application of GABA (Fig. 2, C and D) contained 125 CsCl, 30 CsOH, 10 EGTA, 1 MgCl2, 5 HEPES, and 3 Mg-ATP (pH 7.15 with HCl). The intracellular medium used for the trains of depolarizations (Figs. 5, A and B, and 7 A) contained 125 Cs+-glutamate, 10 CsCl, 10 NaCl, 1 MgCl2, 5 HEPES, 0.05 EGTA, 3 Mg-ATP, and 0.1 cAMP (pH 7.15 with CsOH). For Ca2+ infusion experiments (Figs. 3, 4, and 6 B), the pipette solution consisted of 139 CsCl, 1 MgCl2, 5 HEDTA, 3 Mg-ATP, 0.1 cAMP, 5 HEPES (pH 7.15 with CsOH), and 0.57 or 2.23 CaCl2 for free Ca2+ concentrations of 3 μM or 25 μM, respectively. In the experiments involving photorelease of caged Ca2+ (Fig. 6 A), the pipette solution was composed of 110 CsCl, 10 KCl, 10 NaCl, 1 MgCl2, 25 HEPES (pH 7.1 with KOH), 3 MgATP, 0.1 cAMP, 3 NP-EGTA (Molecular Probes), 2 CaCl2, and 0.1 fura-FF. In the perforated patch experiments (Fig. 8), the pipette solution contained 76 Cs2SO4, 10 KCl, 10 NaCl, 1 MgCl2, and 5 HEPES (pH 7.35 with CsOH; 297 mOsm after inclusion of amphotericin). For measurement of the voltage dependence of GABA exocytosis (Fig. 7 B), the pipette solution contained 145 CsCl, 1 MgCl2, 5 HEPES, 0.05 EGTA, 3 Mg-ATP, and 0.1 cAMP (pH 7.15 with CsOH), and the extracellular solution was composed of 118 D-gluconic acid, 10 TEACl, 2.6 CaCl2, 1.2 MgCl2, 5 HEPES, 5 glucose, and 5.6 K+-glutamate or 2.8 K2SO4 (adjusted to pH 7.4 with NaOH). This combination of extra- and intracellular solutions had to be used in order to resolve the GABA-activated Cl− currents over a wide range of voltages. Similar results were obtained with potassium glutamate and potassium sulfate containing extracellular solutions. This indicates that glutamate, e.g., via activation of ionotropic glutamate receptors (Inagaki et al., 1995), did not affect the results in this series of experiments. Data obtained under both conditions were therefore combined. Liquid junction potentials (VLJ) were measured according to Neher (1992). VLJ was −4 mV for Na+-gluconate containing bath solution versus CsCl containing pipette solution (Fig. 7 B) and +15 mV for the standard extracellular solution versus the Cs+-glutamate containing pipette solution (Figs. 5, A and B, and 7 A). VLJ were not corrected for in the experiments shown.
Figure 2.

Overexpression of GABAA receptors in β-cells. (A) Western blot of homogenates of rat islet cells (∼150 islets) infected or not with the adenoviral constructs encoding the GABAA-receptor Cl− channels, using an antibody against the α1 subunit (top), and the corresponding densitograms (below). The bands in the noninfected samples may correspond to endogenous α1 subunits in non-β-cells. (B) Immunofluorescence micrograph of a β-cell infected with the adenoviral constructs using antibodies against the α1 subunit of the GABAA receptor (green) and insulin (red). Bar, 5 μm. (C) Inward current activated in an infected β-cell by rapid application of GABA (1 mM) to the bath solution. (D) Relationship between the GABA concentration and the peak amplitude of the Cl−-current responses. The current responses have been normalized to the maximum peak current (usually observed in response to 1 mM GABA). All concentrations were tested in the same cell. Data are mean values ± SEM of five experiments. The Hill equation was approximated to the data points giving a Kd of 30 μM.
Figure 5.

Depolarization-induced exocytosis. (A) Transient Cl− currents (bottom) and increase in cell capacitance (middle) triggered by a train of ten 500-ms depolarizations from −70 to 0 mV in an infected β-cell. (Inset) A part of the recording (marked by the dashed box) on an expanded time base, including five transient Cl− currents. Note that the driving force for Cl− ions is inward (corresponding to an upward deflection of the current trace) at 0 mV and outward at −70 mV with the solutions used. While some transient currents were observed between the depolarization pulses, no events were observed before the train. (B) Number of Cl− current transients (N) elicited by the individual depolarization pulses during trains of 10 500-ms depolarizations from −70 to 0 mV during a first train (black bars) and a second train applied 2 min later (white bars, n = 5).
Figure 7.
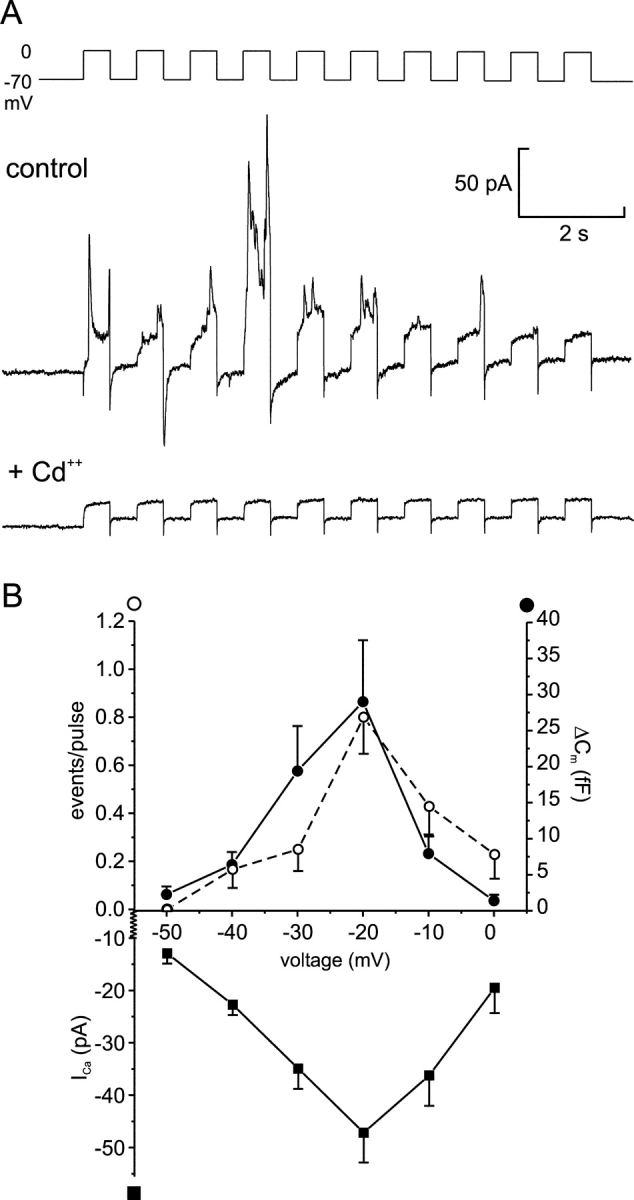
Depolarization-evoked GABA release requires Ca2+-influx through voltage-gated Ca2+-channels. (A) Current responses elicited by a train of ten 500-ms depolarizations from −70 to 0 mV before (top) and after (bottom) addition of CdCl2 (10 μM) to the bath solution. (B) Cl− current transients (open circles), capacitance increase (ΔCm; filled circles), and peak Ca2+ current (ICa; squares) triggered by 500-ms depolarizations from −70 mV to the indicated potentials. All data points correspond to average ± SEM from 8–35 experiments. Note that there is an ∼20 mV difference in the liquid junction potential between the intracellular solution used in this series of experiments and those used in most other experiments. Thus, the voltage experienced by the cells during depolarization to 0 mV in Figs. 5, A and B, and 7 A is comparable to −20 mV in this series of experiments.
Figure 3.

Quantal release of GABA. (A) Current trace (overlay of six sweeps) from an infected β-cell infused with pipette solution containing 3 mM free Ca2+ at −70 mV holding potential. Cl− current spikes, corresponding to spontaneous release of GABA-containing vesicles, are superimposed on the background current. (B) Recording from another cell under the same experimental conditions as in A before (top) and after (middle) addition of the GABAA receptor antagonist bicuculline to the bath solution and after washout of the antagonist (bottom; each trace corresponds to five superimposed sweeps).
Figure 4.
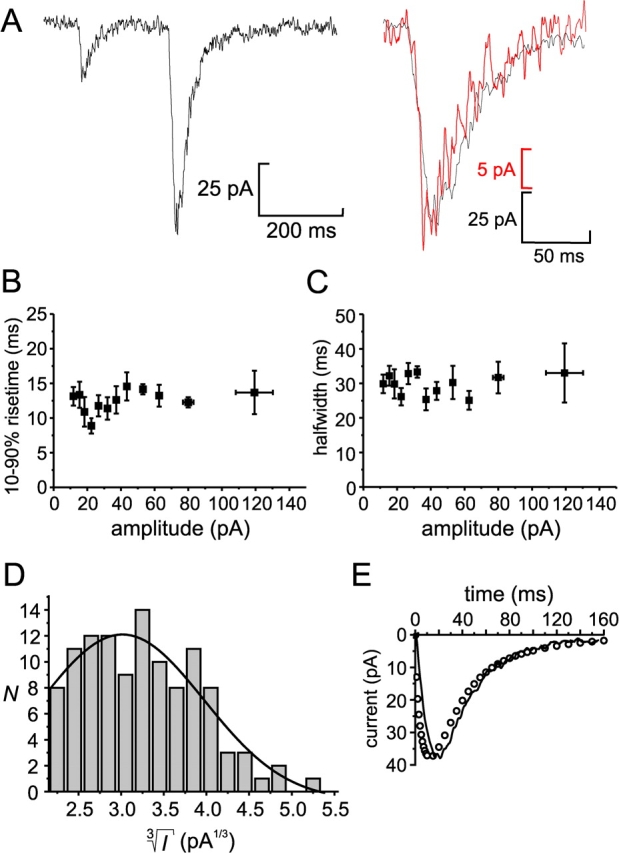
Properties of quantal GABA release. (A, left) Two transient currents illustrating the variability of the current amplitudes. (Right) Amplitude-corrected overlay the first (red) and second (black) transient current from the left panel, demonstrating the similarity in current kinetics. (B) Rise time (10–90%) displayed against current amplitude. (C) Duration (half widths) of current transients displayed against current amplitude. For display purposes, the data presented in B an C are presented as mean values ± SEM of 10 amplitude-matched responses. (D) Distribution of the cubic roots of transient current amplitudes ( ) of the same events as in those presented in A–C. A Gaussian fit is superimposed (N = number of events). (E) Experimentally measured GABA-activated Cl−-current transient (mean of 12 events; continuous line) and current response obtained by mathematical modelling (circles).
Western Blotting
Islet homogenates were separated by SDS/PAGE on 8% acrylamide gels and transferred onto polyvinyldiene difluoride (PVDF) membranes. The membranes were incubated overnight with anti-GABAAα1 (Chemicon, 1:100), followed by horseradish-peroxidase (HRP)-coupled secondary antibody (1:20,000 dilution; Pierce Chemical Co.) for 1 h. The blots were developed by using SuperSignal® West Pico Chemiluminiscent Substrate (Pierce Chemical Co.) and visualized on X-ray films.
Immunocytochemistry
Rat islet cells were fixed using the formaldehyde-pH-shift method and permeabilized with 0.2% Triton. Nonspecific binding was blocked with 4% normal donkey serum. The cells were incubated overnight at 4°C with anti-insulin (1:1000; Eurodiagnostica) and anti-GABA (Sigma-Aldrich, 1:2,000; Fig. 1 C) or anti-GABAAα1 (Chemicon, 1:100; Fig. 2 B) antibodies. This was followed by incubation for 1 h with the corresponding secondary antibodies coupled to Cy5 and Cy2 (1:150; Jackson ImmunoResearch Laboratories), respectively. Fluorescence was visualized using a Plan-Apochromat 100×/1.4 oil objective and the 488 nm (Cy2) and 633 nm (Cy5) lines of a ZEISS LSM 510 confocal microscope. Images were acquired using ZEISS LSM 510 software.
Figure 1.

Localization of GABA and β-cell ultrastructure. (A) Electron micrograph of a rat pancreatic islet. Three docked insulin-containing LDCVs and two docked GABA-containing SLMVs have been highlighted by the black and white arrows, respectively. Bar, 250 nm. (B) Diameters of SLMVs and LDCVs in rat pancreatic β-cells. Two Gaussians have been approximated to the distribution of the profile diameters of the SLMVs and LDCVs. (C) Immunofluorescence micrograph of β-cells maintained in tissue culture for 24 h using specific antibodies against insulin (red, left) and GABA (green, right). Note the low GABA content of some β-cells (indicated by arrows). Bar, 5 μm. (D) Immunogold labeling of GABA in a β-cell in an intact islet. Bar, 500 nm.
Electron Microscopy
For detailed ultrastructural analysis, islets were prepared and analyzed as described elsewhere for mouse islets (Olofsson et al., 2002). For immunogold electron microscopy, intact pancreatic islets were fixed in 1% paraformaldehyde and 2.5% glutaraldehyde for 1 h at 4°C. After fixation, the islets were washed with PBS, embedded in agarose (type VII, Sigma-Aldrich), cryoprotected in glycerol, and embedded in Lowicryl HM20 by cryofixation and freeze-substitution. Immunoreactivity was detected by postembedding immunogold labeling of ultrathin sections (60–80 nm) using a rabbit anti-GABA primary antibody (Chemicon AB5016) and a goat anti–rabbit secondary antibody conjugated to 15-nm gold particles (Amersham Biosciences). Background staining over empty resin amounted to 2 ± 1 particles/μm2 and has not been subtracted. Specificity of immunolabeling was monitored by parallel processing of test sections containing amino acid–glutaraldehyde brain macromolecule conjugates (GABA, glutamate, taurine, glycine, aspartate, glutamine, or in the absence of any amino acid). Quantitative analysis of these test sections demonstrated dense staining of the GABA conjugate and absence of significant cross-reactivity with the other conjugates.
Estimation of Vesicular GABA Content
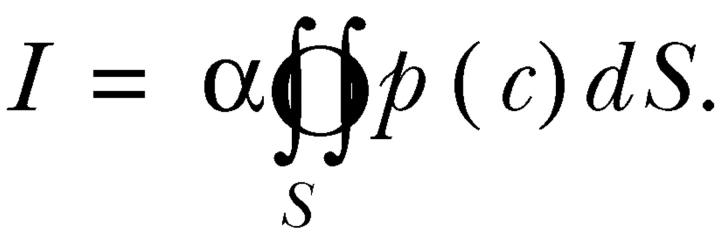
After fusion of a vesicle with the plasma membrane, GABA diffuses into the surrounding solution and activates GABAA receptor Cl− channels. This causes a transient increase in an ion current across the plasma membrane. The size of the current ΔI through an elementary surface ΔS at an arbitrary time moment after the fusion event depends on the local concentration of GABA, on the density and conductance of the GABAA receptor Cl− channels and their binding affinity. Therefore it may be expressed mathematically in the following form:
 |
(1) |
where α is a proportionality coefficient comprising the surface density of the GABAA receptor and its single-channel conductance and p(c) is the dose–response function that shows the proportion of channels that are open at GABA concentration equal to c. The total current at the same moment is then obtained by integrating the Eq.1 over the surface of the plasma membrane S and is equal to
The local concentration of GABA c at a given time point depends on the initial concentration in the vesicle c 0, the diameters of the vesicle and the fusion pore and the diffusion coefficient of GABA in the vesicle and surrounding medium. Since after the opening of a fusion pore GABA rapidly diffuses into the surrounding space, the total current I is a peak function of time. This function was used to fit an experimental current peak caused by the release of GABA from a fused vesicle with the initial concentration of GABA in vesicle c 0 as the main fitting parameter. To solve the diffusion problem, the software package FEMLAB (Comsol) was used. The obtained solution was then imported into the MATLAB workspace (Mathworks, Inc.) and used for fitting to experimental data.
Analysis and Statistical Evaluation
Data are given as mean ± SEM. Statistical significances were evaluated using Student's t test. The GABA-induced current transients were analyzed using the software MiniAnalysis (Synaptosoft). In experiments with high release rates and significant overlap of the current transients, the number of release events was estimated by dividing the total charge of the GABAA receptor–mediated Cl− currents by the charge of an averaged quantal response from the same experiment. In experiments with lower release rates and apparently well separated individual current transients, the number of events was determined directly by counting.
RESULTS
Ultrastructural Analyses of LDCVs and SLMVs in Rat Pancreatic Islets
Fig. 1 A shows an electron micrograph of a rat pancreatic islet illustrating the presence of both SLMVs (white arrows) and LDCVs (black arrows) in β-cells. The histogram in Fig. 1 B shows the measured profile diameters. It is clear that the vesicles diameters fall in two distinct classes that can both be described by Gaussian distributions. The true vesicle diameters were derived from the observed profile diameter distribution as described previously (Olofsson et al., 2002). We thus estimated the average diameters of the SLMVs and LDCVs to be 91 ± 4 nm (n = 688 in 83 cells) and 327 ± 6 nm (3,515 in 83 cells), respectively. The value for SLMVs is equal to that obtained in chromaffin cells (Plattner et al., 1997). The coefficients of variation (CV; standard deviation relative to mean value) were 0.27 and 0.22 for SLMVs and LDCVs, respectively. The total number of SLMVs was 3,460 ± 135 (n = 83) per β-cell, of which 238 ± 33 (n = 83) were docked with the plasma membrane (examples of docked SLMVs highlighted by white arrows in Fig. 1 A). The corresponding values for the LDCVs in rat β-cells were 10,047 ± 435 and 450 ± 42 per cell. The number of LDCVs in rat β-cells in good agreement with previous estimates in mouse β-cells (Dean, 1973; Olofsson et al., 2002).
Immunocytochemistry confirmed that GABA is stored in the β-cells and revealed that the concentrations varied considerably from cell to cell (Fig. 1 C). This correlated with varying levels of GAD65 expression (unpublished data). Immunogold electron microscopy was performed on β-cells in intact islets using a GABA-specific antibody (Fig. 1 D). The particle density measured within the insulin-containing LDCVs and the remainder of the cell were 5.7 ± 3.2 and 30 ± 19 particles/μm2, respectively. This shows that GABA is excluded from LDCVs. Because of the low contrast inherent to the immunogold technique, it was not possible to demonstrate the accumulation of GABA in SLMVs directly.
Detection of Quantal GABA Release
To measure GABA secretion from single β-cells, we developed a novel assay based on the overexpression of GABAA receptor Cl− channels in isolated pancreatic islet cells. To this end, adenoviral vectors encoding for the α1 and β1 subunits of the human GABAA receptor (Birnir et al., 1995), respectively, were constructed and used to coinfect freshly isolated rat pancreatic β-cells. Western blot analysis revealed ∼20-fold overexpression of GABAA receptors compared with noninfected islets (Fig. 2 A). Immunocytochemistry showed homogenous distribution of the receptor in the plasma membrane (Fig. 2 B). Electrophysiological measurements were performed on single infected β-cells. Application of GABA (1 mM) to the bath solution evoked an inward current in ∼80% of the cells (Fig. 2 C). The current typically had an amplitude between 0.5 and 2 nA and was half-maximally activated by 30 μM GABA (Fig. 2 D). No GABA-activated current was observed in noninfected β-cells. This does not mean, however, that all islet cells lack GABAA-receptors. We have previously demonstrated in guinea pig that glucagon-producing α-cells contain such receptors at high density (Rorsman et al., 1989) and unpublished data indicate that this is also the case in rat islets.
We reasoned that if GABA is released by exocytosis of GABA-containing SLMVs in β-cells engineered to overexpress GABAA-receptor Cl−-channels, then release of the neurotransmitter should be detectable as an increased Cl−-conductance. Fig. 3 A shows a whole-cell patch-clamp recording from a β-cell infused with pipette solution containing 3 μM free Ca2+. The holding potential was −70 mV. Superimposed on the background current are discrete, transient inward current spikes resembling inhibitory postsynaptic currents (IPSCs) in neurons (Edwards et al., 1990). The transient currents were completely and reversibly blocked by 100 μM of the GABAA receptor antagonist bicuculline (Fig. 3 B; n = 4). We conclude that the transient currents described above are attributable to activation of GABAA-receptor Cl− channels after exocytosis of single GABA-containing vesicles from β-cells.
Characteristics of Currents Triggered by GABA Release
The amplitude of the transient currents elicited upon stimulation of exocytosis with high intracellular Ca2+ was very variable (Fig. 4 A). The transient currents activated in 12.6 ± 0.7 ms (10–90% rise time) and had a half width (i.e., the time the current exceeds 50% of the peak amplitude) of 30 ± 1 ms (n = 117). Neither of these parameters showed any dependence on the current amplitude (Fig. 4, A–C). The average amplitude of the transient currents in this experiment was 38 ± 2 pA (range 10–141 pA; n = 117). In the same cell, application of 1 mM GABA to saturate the receptors elicited a whole-cell current of 1.7 nA, suggesting that an individual GABA release event activates only ∼2% of the GABAA receptors.
The amplitude of the GABA-induced current transients is likely to be proportional to the GABA content of the vesicles undergoing exocytosis. Given that the vesicle diameters (d) are normally distributed (Fig. 1 B), we predict that the cubic roots of the current amplitudes ( ) should also be normally distributed if the vesicles are uniformly loaded with GABA (remember that vesicle volume (V) is given by the expression V=
 πr3). As shown in Fig. 4 D, the distribution of
  can be described by a single Gaussian (continuous curve superimposed on histogram) with a CV of 0.32. The latter value is reasonably close to that obtained for the vesicle diameter (0.27; see above). The histogram further suggests that ∼20% of the events were below the detection threshold of ∼10 pA.
Collectively, the analysis of the transient currents suggests that they arise from exocytosis of a single population of GABA-containing vesicles. Given that the insulin-containing LDCVs exclude GABA, it seems justifiable to conclude that the observed events result from exocytotic fusion of GABA-containing SLMVs. Qualitatively similar results were obtained in three additional experiments analyzed the same way.
Estimation of the Intravesicular GABA Concentration
We estimated the intravesicular concentration of GABA by mathematical modelling of an averaged current spike from the experiment in Figs. 3 A and 4, A–D. The GABAA receptor–mediated conductance per area, corresponding to the proportionality coefficient α in Eqs. 1 and 2 (see materials and methods), was measured by application of a saturating concentration of GABA at the end of the experiment in combination with the estimation of the cell surface by capacitance measurements. The dose–response curve was obtained from Fig. 2 D. The SLMV diameter was taken to be 90 nm (Fig. 1 B), the membrane thickness to be 7 nm, and the fusion pore diameter was assumed to be 3 nm (Albillos et al., 1997). As shown in Fig. 4 E, the model reasonably predicts the time-course and amplitude of the current transient. We thus estimated that every vesicle contains 0.36 amol of GABA, which corresponds to an intravesicular concentration of 0.9 M.
GABA Release during Trains of Voltage-clamp Depolarizations
We next investigated GABA release during depolarizations to 0 mV from a holding potential of −70 mV. The depolarizations are expected to open voltage-gated Ca2+ channels, thus elevating the intracellular Ca2+ levels. Trains of 10 depolarizations (500 ms) were applied at 1 Hz to infected cells infused with Ca2+-free solution containing 50 μM EGTA. As shown in Fig. 5 A, the depolarizations triggered transient currents similar to those described above. The inset shows the current responses elicited by the fourth pulse (dotted rectangle) on an expanded time base. The direction of the currents is outward rather than inward during the depolarizations to 0 mV as the equilibrium potential of Cl− with the solutions used (152 mM Cl− in the extracellular, 23 mM Cl− in the intracellular solution) is −49 mV. By analogy to what was seen in the intracellular dialysis experiments (Fig. 3 B), the current transients that could be elicited by membrane depolarization were completely blocked by addition of the GABAA receptor antagonist bicuculline (100 μM) to the bath solution (n = 8; unpublished data).
Exocytosis of SLMVs Contributes Little to Capacitance Increases
Cell capacitance is a powerful single-cell assay of secretion that monitors changes of cell-surface area due to exocytotic fusion of vesicles with the plasma membrane (Moser and Neher, 1997). The magnitude of the capacitance increase (ΔCm) resulting from the fusion of a vesicle with the plasma membrane is proportionally related to the square of the vesicle radius (r; i.e., ΔCm = ɛπr2 where ɛ is 9 fF/μm2). Exocytosis of an SLMV (r = 45 nm; Fig. 1 B) and an LDCV (r = 164 nm) can accordingly be expected to result in a capacitance increase of 0.23 and 3.4 fF, respectively. We combined capacitance measurements with our single-vesicle assay of GABA/SLMV release. In the experiment shown in Fig. 5 A, the train of depolarizations elicited a capacitance increase of 546 fF. Because of the comparatively high exocytotic rate in this experiment, causing significant overlap of the GABA-induced current transients, the number of current transients was estimated by dividing the total charge of the GABA-induced current through the charge of an average single event. We thereby estimated that the train triggered 52 current transients. From these data it can be calculated that exocytosis of SLMVs in this experiment accounts for ∼2% of the measured capacitance increase (i.e., 52 × 0.23 fF/546 fF). In a series of 11 experiments, the capacitance increase per current transient averaged 31 ± 6 fF, corresponding to a contribution of SLMV exocytosis to the capacitance signal of ∼0.7% (0.23 fF/31 fF). It therefore seems justifiable to conclude that capacitance measurements in β-cells primarily reflect exocytosis of insulin-containing LDCVs. We acknowledge, however, that because of the amplitude distribution and thresholding, we will miss some GABA-induced events (see above). Even when allowance is made for this, it is clear that the frequency of the GABA-activated current transients is only ∼10% of that expected if they were due to LDCV exocytosis.
The experiment in Fig. 5 A also revealed a progressive decrease in the number of current transients triggered by the later depolarization pulses of the train. Eventually, some pulses (numbers 8 and 10) failed to evoke any GABA release. Fig. 5 B summarizes data from five cells. During the first train (black columns), the total number of events elicited averaged 8.2 ± 2.5 per train. It is evident that there is a ∼75% decline in the release probability during the train. In contrast, the voltage-gated Ca2+ currents decreased only by 23 ± 3% between the first and tenth pulse of the depolarization train (n = 13; unpublished data). When another train of depolarizations was applied 2 min later, the release probability during the initial part of the train was almost restored to that observed during the first train (white columns; total number of events 7.5 ± 2.5 per train; n = 5).
Ca2+ Dependence of GABA Release
The fact that exocytosis of GABA can be triggered by membrane depolarization suggests that it may be triggered by an increase in the cytoplasmic-free Ca2+-concentration. We explored the Ca2+ dependence of GABA exocytosis from β-cells by loading infected β-cells via the patch pipette with “caged-Ca2+” (Ca2+-NP-EGTA). Photolysis of the compound by a flash of UV-light led to an instantaneous increase of the intracellular Ca2+ concentration (Fig. 6 A, bottom). This triggered both an increase in cell capacitance (middle) and a series of transient currents reflecting exocytosis of GABA-containing vesicles (top). The increase in capacitance per current transient averaged 26 ± 5 fF (n = 5). This confirms the results obtained with membrane depolarizations (Fig. 5 A) that release of GABA via exocytosis of SLMVs accounts for <1% of the capacitance increase (0.23 fF/26 fF). The dissociation of GABA release and capacitance increase seen in this experiment (the six rightmost events in Fig. 6 A, top) could be the consequence of either these release events adding very little membrane area (equivalent to 6 × 0.23 fF = 1.3 fF) or concomitant endocytosis masking ongoing exocytosis (Eliasson et al., 1996).
To further quantify the Ca2+ dependence of GABA exocytosis, we compared GABA release from β-cells infused with pipette solution containing 3 μM (Fig. 6 B, top) or 25 μM (bottom) free Ca2+ in the standard whole-cell configuration. As the current transients usually appeared clearly separated in these experiments, the number of events was determined directly by counting. At 3 μM free Ca2+, 9.4 ± 3.2 events/min were observed (n = 9), whereas at 25 μM free Ca2+ the frequency increased to 20.3 ± 4.4 events/min (P < 0.05; n = 9). In the same experiments, a similar ∼2-fold difference between the lower and higher Ca2+ concentration was measured for the rate of capacitance increase; 349 ± 130 fF/min at 3 μM and 758 ± 168 fF/min at 25 μM [Ca2+]i. Again, the number of GABA-triggered currents is much less than expected if they resulted from exocytosis of LDCVs. Using a conversion factor of 3.4 fF/LDCV (as predicted from the vesicle diameter established by electron microscopy), the rate of capacitance increase observed at 25 μM Ca2+ corresponds to >200 granules/min, 10-fold higher than the number of GABA-dependent current transients actually observed.
GABA Release Depends on Voltage-dependent Ca2+ Influx
To verify that GABA release is triggered by Ca2+ influx through voltage-gated Ca2+ channels in the plasma membrane, trains of depolarizations were applied before and after addition of 10 μM Cd2+ to the extracellular solution (Fig. 7 A). It is evident that this broad-spectrum inhibitor of voltage-gated Ca2+ channels abolished GABA release (n = 3). Thus, exocytosis of the GABA-containing vesicles is secondary to Ca2+ influx and not to membrane depolarization as such. We next determined the voltage dependence of GABA release. As shown in Fig. 7 B, no GABA was released when the depolarization went to −50 mV. Depolarizations to −40 mV and beyond elicited release of GABA, which was maximal at −20 mV. When the pulses went above −20 mV, a secondary reduction was observed because of the reduced driving force for Ca2+ into the β-cell. This voltage dependence strongly resembled that of the Ca2+ current and virtually superimposed that of exocytosis monitored as increases in cell capacitance.
Modulation of GABA Release by cAMP
Insulin secretion is stimulated by agents increasing intracellular cAMP (Ämmälä et al., 1993). The involvement of the cAMP-/protein kinase A–dependent pathway in GABA exocytosis was studied by applying trains of depolarizations from −70 to 0 mV before and after addition of the adenylate cyclase activator forskolin (2 μM; Fig. 8 A). The results of 10 individual experiments are summarized in Fig. 8 B. On average, forskolin increased GABA release by 78%. In the same experiments, the capacitance increase elicited by the depolarizations was augmented by forskolin by 49% (Fig. 8 C). Thus, release of SLMVs and LDCVs exhibit a number of similarities in terms of voltage and Ca2+ dependence and modulation by second messenger systems.
DISCUSSION
Like neurons and other endocrine cells (Bauerfeind et al., 1993; Moriyama et al., 2000), pancreatic β-cells contain two types of vesicles: LDCVs containing insulin and SLMVs (Reetz et al., 1991). The function of the SLMVs in the β-cell is unclear and it even remains to be unequivocally established that they are capable of undergoing regulated exocytosis. Here we describe a novel system to detect the release of GABA at the single-vesicle level with millisecond resolution by overexpression of ionotropic GABAA receptors as autoreceptors for neurotransmitter release (Hollins and Ikeda, 1997; Whim and Moss, 2001). We show that GABA is released by regulated exocytosis evoked by Ca2+ influx through voltage-gated Ca2+ channels.
Properties of Quantal GABA Release in Rat β-cells
The amount of GABA release detected varied substantially from cell to cell. In good preparations, quantal release of GABA was observed in ∼50% of β-cells infused with ≥3 μM free Ca2+. Apart from variable levels of GABAA receptor expression and exocytotic responses, the failure to detect exocytotic release of GABA in the remaining 50% of cells can be attributed to the variability of cellular GABA content. Indeed, some isolated β-cells exhibited only weak GABA immunoreactivity after 24 h of culture (Fig. 1 C). In addition to differences in GAD65 expression, it has been reported that β-cells lose ∼70% of biochemically determined GABA after 24 h of culture as compared with intact islets (Winnock et al., 2002).
In some experiments with high release rates, e.g., during trains of voltage-clamp depolarizations (Figs. 5 A and 7 A), significant overlap of the GABA-induced current transients was observed, impeding the determination of the number of release events by direct counting. In these experiments we estimated the frequency of exocytotic events by measuring the total charge of the GABA-induced current and dividing it through the charge of an average event from the same experiment. However, in most experiments, especially those involving infusion of the cells with Ca2+-containing solutions (Figs. 3, 4, and 6 B), the great majority of the current transients appeared well separated. This also reflects the ∼5–10-fold lower release rates for GABA-containing vesicles compared with that expected for the release of insulin-containing LDCVs estimated by the capacitance measurements. Quantification of the exocytotic events therefore did not seem to pose a general problem for data analysis. Collectively, these observations suggest that although the SLMVs are capable of undergoing exocytosis, the frequency of these events is considerably lower than that of the LDCVs.
Analysis of the kinetics of the release events as well as the amplitude distribution (Fig. 4, B–D) indicates that they result from the exocytosis of a single population of vesicles. If GABA were released by both exocytosis of the LDCVs and SLMVs, then the rise time (t10–90%) as well as half-widths would have been expected to vary with the current amplitude, as has previously been shown for serotonin release in Retzius neurons (Bruns et al., 2000).
By mathematical modelling of experimentally obtained current transients, we estimated that the average intravesicular concentration of GABA is ∼0.9 M. This is similar to the neurotransmitter concentration in other vesicles (Travis and Wightman, 1998). The fitting of our model to experimental data also revealed that the diffusion rate of GABA out of vesicles into the extracellular space should be considerably slower than the rate of its dispersion in the surrounding medium. If the diffusion coefficient for GABA within a vesicle was taken to be equal to that in free solution (600 μm s−1; Jayaraman et al., 1999), then only very rapidly rising (t10–90% < 1 ms) and narrow (half-width: ∼1 ms) current spikes were obtained in our calculations. Since these responses differ significantly from those experimentally observed, we propose that SLMVs in pancreatic β-cells, by analogy to other neurotransmitter-containing vesicles, contain a poly-electrolyte matrix that considerably decreases the diffusion coefficient of GABA. In accordance with values obtained experimentally for catecholamines in chromaffin cells (Amatore et al., 2000), we therefore assumed a 100-fold reduced intravesicular diffusion coefficient for GABA molecules (6 μm s−1).
Even with the reduced diffusion coefficient, the calculated spike still rose faster than expected from the experimental data. We attribute this discrepancy to the fixed geometry of the fusion pore in our model (i.e., the fusion pore is taken to instantly dilate to its final size in the model). The slower time course we observe experimentally indicates that the opening and formation of a fusion pore takes a certain time and during the initial stages of a fusion event the release of GABA is hindered by the small size of the pore.
In a vesicle with a diameter of 90 nm, the GABA concentration of 0.9 M results in an intravesicular GABA content of 0.36 amol. Since a rat β-cell contains ∼3,500 SLMVs, the total vesicular pool of GABA amounts to ∼1.25 fmol/cell or ∼6% of the total GABA content (21 pmol per 1,000 cells in intact rat islets; Winnock et al., 2002). Thus, the bulk of the β-cell GABA resides in the extravesicular space including the cytoplasm. Importantly, GABA is excluded from the insulin-containing granules and measured GABA immunoreactivity within these organelles was <20% of the average cellular concentration (Fig. 1 D).
SLMVs Belong to Functional Pools that Vary with Regard to Release Competence
During trains of depolarizing pulses, there was a progressive ∼75% decline of the GABA release probability (Fig. 5, A and B). Release was restored when the same stimulus was applied again after 2 min latency. The decline in release probability could not be explained by a corresponding reduction of Ca2+-influx, which was only reduced by 23%. In mouse β-cells, such small decreases in Ca2+ entry only marginally affect exocytosis (Renström et al., 1996). These observations instead suggest that the GABA-containing vesicles, like insulin-containing LDCVs (Rorsman et al., 2000), are organized in distinct pools with different release kinetics. A limited number of vesicles are immediately available for release (“readily releasable pool”, RRP), representing most of the exocytotic events during the first pulses of the depolarization series. This RRP is refilled from a larger reserve pool of vesicles that have to undergo preparatory steps before being released, therefore displaying slower release kinetics. It appears that a train of ten 500-ms depolarizations is sufficient to fully deplete the RRP.
Exocytosis of SLMVs Contributes Marginally to Observed Capacitance Increase
It has been proposed that exocytosis of SLMVs constitutes a sizeable fraction of the capacitance response in β-cells (Takahashi et al., 1997). Comparison of the capacitance changes with the number of GABA release events with knowledge about the diameters of the SLMVs and LDCVs enabled us to determine how much of the observed capacitance increase is attributable to the exocytosis of the SLMVs. We thereby estimate that release of the SLMVs typically accounts for 1–2% of the observed capacitance increase. Thus, capacitance measurements provide a good estimate of insulin granule exocytosis.
Having access to two techniques allowing us to distinguish between exocytosis of SLMVs and LDCVs enabled us to compare the properties of the two pathways of release. In general, exocytosis of the two types of vesicles exhibited similar regulation. This is in agreement with comparative measurements of the release of acetylcholine-containing SLMVs and catecholamine-storing LDCVs in phaeochromocytoma cells (Nishiki et al., 1997) and with studies on glutamate secretion from pinealocytes (Moriyama et al., 2000). It is worthy of note that none of these studies provided any evidence for a major difference in the release kinetics of SLMVs and LDCVs (Fig. 5 A). In experiments involving dialysis of the cytosol with stimulating Ca2+ concentrations (Fig. 6 B), increasing the Ca2+ concentration from 3 to 25 μM had a similar effect on the release rates of LDCVs and SLMVs. We acknowledge that these experiments cannot be used to derive the true Ca2+-sensitivity of exocytosis (whether seen as a capacitance increase or GABA-transients) because the release-competent pool will be quickly depleted and other processes (such as refilling of the pool by vesicle mobilization) will then be rate limiting for exocytosis. Nevertheless, the similar effect of increasing [Ca2+]i on GABA release and exocytosis measured as capacitance increase (which principally reflects exocytosis of the LDCVs) suggests that release of both types of vesicles may involve the same Ca2+ sensors (Sugita et al., 2002).
GABA Is Released by Depolarization to Physiological Membrane Potentials
The physiological stimulus for secretory activity of β-cells is an elevation of blood glucose levels, which triggers electrical activity of the cells. The direct investigation of the glucose effect on GABA exocytosis is not straightforward with our assay, because for recording of the GABA-induced current events the membrane voltage has to be clamped. This precludes the development of glucose-induced electrical activity. A theoretically feasible approach would be the measurement of GABA-evoked “postsynaptic potentials” in the current-clamp mode. However, the Cl− equilibrium potential in β-cells (−43 mV; unpublished data) is close to their membrane potential during glucose-induced electrical activity (which oscillates between −40 and −20 mV; Antunes et al., 2000). Consequently, the GABA-induced potentials will be small and therefore difficult to identify among glucose-induced action potentials. Instead we simulated glucose-induced electrical activity by applying trains of voltage-clamp depolarizations. Glucose-induced action potentials in rat β-cells usually peak at around −20 mV (Antunes et al., 2000). GABA release was elicited by depolarizations to voltages above −50 mV and was maximally stimulated by depolarization to −20 mV (−15 mV after correction for liquid junction potentials; Fig. 7 B). Moreover, the voltage dependence of GABA exocytosis closely followed that of both Ca2+ influx and capacitance increases (reflecting exocytosis of insulin-containing LDCVs). Action potentials in rat β-cells have a half-width of 150–200 ms (Antunes et al., 2000). Although we applied depolarization pulses of 500 ms duration, ∼40% of the GABA current transients were triggered during the first 200 ms of the depolarization pulses (unpublished data). Together, these data strongly suggest that GABA secretion from β-cells is also glucose-stimulated.
Studies on the effect of glucose on GABA secretion from pancreatic islets or from insulin-secreting cell lines have so far yielded conflicting results. While some studies showed a stimulation of GABA secretion by glucose (Ahnert-Hilger and Wiedenmann, 1992; Gaskins et al., 1995), others reported an inhibition (Smismans et al., 1997; Hayashi et al., 2003) or no effect (Nagamatsu et al., 1999; Bustamante et al., 2001). All of these studies have relied on the determination of the GABA concentration in the cell supernatant by HPLC, enzymatic assays or with radioactive tracers, mostly with low temporal resolution (up to 24-h measurement intervals). Rat β-cells have been reported to release 0.4 amol of GABA per second and cell regardless of the glucose concentration (Smismans et al., 1997). Given that an SLMV contains 0.36 amol of GABA (Fig. 4 E), the spontaneous release rate would correspond to 1 SLMV per second and β-cell. This is only ∼10% of the exocytotic rate that can maximally be attained during membrane depolarization (five events during 500 ms; Fig. 5 A, inset), but still relatively high in comparison with the release rate observed in dialysis experiments (Fig. 6 B). The amounts of GABA secreted over long periods are thus likely to reflect processes other than exocytotic release of the neurotransmitter, e.g., passive transporter–mediated leakage. This route of release may be affected by variations of GAD activity and changes in GABA content of the cells rather than changes in the glucose concentration (Smismans et al., 1997). Nevertheless, it is clear that GABA, at least for brief periods, can be released at rates much higher than indicated by the previous biochemical assays.
Physiological Role of Regulated Release of GABA in Islets
With a basal release rate equivalent to one vesicle per second and β-cell which increases 5–10-fold during electrical activity, it is clear that both the β-cell itself as well as its neighbors will be exposed to biologically active concentrations of GABA and quite high interstitial levels of the neurotransmitter may be attained close to the release sites. This highlights the possibility of GABA exerting a paracrine role within the pancreatic islets. Indeed, GABAA and GABAB receptors have been documented in pancreatic islet cells (Rorsman et al., 1989; Brice et al., 2002) and our own unpublished data indicate that release of endogenous GABA from rat β-cells inhibits glucagon and insulin release by activation of GABAA and GABAB receptors, respectively.
The concept that a substance released from the β-cells regulates glucagon secretion from neighboring α-cells is underscored by the recent observations of Ishihara et al. (2003), who postulated that Zn2+ coreleased with insulin may inhibit glucagon secretion although the mechanisms remain obscure. It is likely that several mechanisms contribute to the glucose regulation of glucagon release from the α-cells in vivo. It should also be emphasized that not all regulation needs to be exerted via paracrine signaling as even individual α-cells and pure α-cell preparations retain the ability to respond to glucose (Pipeleers et al., 1985; Johansson et al., 1989).
Significance to Diabetes
The finding that GABA-containing SLMVs undergo exocytosis may finally be of significance to the understanding of type 1 diabetes. It is tempting to speculate that the selective destruction of the β-cells in type 1 diabetes, although the autoantigen GAD65 is expressed in several other cells (Tillakaratne et al., 1995), is a consequence of the functional significance of GABAergic processes within the islet and the high rate of SLMV exocytosis. Intriguingly, pharmacological procedures that hyperpolarize the β-cell and thus can be expected to inhibit exocytosis of the SLMVs have been reported to reduce GAD65 presentation and exert a β-cell protective action in type 1 diabetes (Karlsson et al., 2000). In addition, altered paracrine signaling in the islet may be a causative factor for the increase in glucagon secretion that contributes to the metabolic disturbances in both type 1 and type 2 diabetes (Krentz and Nattrass, 1997; Shah et al., 2000).
Acknowledgments
We thank Kristina Borglid for skilled technical support.
Supported by the Juvenile Diabetes Research Foundation, the Swedish Research Council (grant no 8647), the Swedish Diabetes Association, the European Community and the Novo Nordisk Foundation, the Göran Gustafsson Stiftelse, and the Swedish Strategic Foundation.
Olaf S. Andersen served as editor.
Matthias Braun and Anna Wendt contributed equally to this work.
Abbreviations used in this paper: GABA, γ-aminobutyric acid; LDCV, large dense-core vesicle; SLMV, synaptic-like microvesicle.
References
- Ahnert-Hilger, G., and B. Wiedenmann. 1992. The amphicrine pancreatic cell line, AR42J, secretes GABA and amylase by separate regulated pathways. FEBS Lett. 314:41–44. [DOI] [PubMed] [Google Scholar]
- Albillos, A., G. Dernick, H. Horstmann, W. Almers, G. Alvarez de Toledo, and M. Lindau. 1997. The exocytotic event in chromaffin cells revealed by patch amperometry. Nature. 389:509–512. [DOI] [PubMed] [Google Scholar]
- Amatore, C., Y. Bouret, E.R. Travis, and R.M. Wightman. 2000. Interplay between membrane dynamics, diffusion and swelling pressure governs individual vesicular exocytotic events during release of adrenaline by chromaffin cells. Biochimie. 82:481–496. [DOI] [PubMed] [Google Scholar]
- Ämmälä, C., F.M. Ashcroft, and P. Rorsman. 1993. Calcium-independent potentiation of insulin release by cyclic AMP in single β-cells. Nature. 363:356–358. [DOI] [PubMed] [Google Scholar]
- Antunes, C.M., A.P. Salgado, L.M. Rosario, and R.M. Santos. 2000. Differential patterns of glucose-induced electrical activity and intracellular calcium responses in single mouse and rat pancreatic islets. Diabetes. 49:2028–2038. [DOI] [PubMed] [Google Scholar]
- Bauerfeind, R., A. Regnier-Vigouroux, T. Flatmark, and W.B. Huttner. 1993. Selective storage of acetylcholine, but not catecholamines, in neuroendocrine synaptic-like microvesicles of early endosomal origin. Neuron. 11:105–121. [DOI] [PubMed] [Google Scholar]
- Becker, T.C., R.J. Noel, W.S. Coats, A.M. Gomez-Foix, T. Alam, R.D. Gerard, and C.B. Newgard. 1994. Use of recombinant adenovirus for metabolic engineering of mammalian cells. Methods Cell Biol. 43:161–189. [DOI] [PubMed] [Google Scholar]
- Birnir, B., M.L. Tierney, N.P. Pillai, G.B. Cox, and P.W. Gage. 1995. Rapid desensitization of alpha 1 beta 1 GABA A receptors expressed in Sf9 cells under optimized conditions. J. Membr. Biol. 148:193–202. [DOI] [PubMed] [Google Scholar]
- Brice, N.L., A. Varadi, S.J. Ashcroft, and E. Molnar. 2002. Metabotropic glutamate and GABAB receptors contribute to the modulation of glucose-stimulated insulin secretion in pancreatic β-cells. Diabetologia. 45:242–252. [DOI] [PubMed] [Google Scholar]
- Bruns, D., D. Riedel, J. Klingauf, and R. Jahn. 2000. Quantal release of serotonin. Neuron. 28:205–220. [DOI] [PubMed] [Google Scholar]
- Bustamante, J., M.V. Lobo, F.J. Alonso, N.T. Mukala, E. Gine, J.M. Solis, J. Tamarit-Rodriguez, and R. Martin Del Rio. 2001. An osmotic-sensitive taurine pool is localized in rat pancreatic islet cells containing glucagon and somatostatin. Am. J. Physiol. Endocrinol. Metab. 281:E1275–E1285. [DOI] [PubMed] [Google Scholar]
- Dean, P.M. 1973. Ultrastructural morphometry of the pancreatic β-cell. Diabetologia. 9:115–119. [DOI] [PubMed] [Google Scholar]
- Edwards, F.A., A. Konnerth, and B. Sakmann. 1990. Quantal analysis of inhibitory synaptic transmission in the dentate gyrus of rat hippocampal slices: a patch-clamp study. J. Physiol. 430:213–249. [DOI] [PMC free article] [PubMed] [Google Scholar]
- Eliasson, L., P. Proks, C. Ämmälä, F.M. Ashcroft, K. Bokvist, E. Renström, P. Rorsman, and P.A. Smith. 1996. Endocytosis of secretory granules in mouse pancreatic β-cells evoked by transient elevation of cytosolic calcium. J. Physiol. 493:755–767. [DOI] [PMC free article] [PubMed] [Google Scholar]
- Garry, D.J., N.M. Appel, M.G. Garry, and R.L. Sorenson. 1988. Cellular and subcellular immunolocalization of L-glutamate decarboxylase in rat pancreatic islets. J. Histochem. Cytochem. 36:573–580. [DOI] [PubMed] [Google Scholar]
- Gaskins, H.R., M.E. Baldeon, L. Selassie, and J.L. Beverly. 1995. Glucose modulates gamma-aminobutyric acid release from the pancreatic BTC6 cell line. J. Biol. Chem. 270:30286–30289. [DOI] [PubMed] [Google Scholar]
- Göpel, S., T. Kanno, S. Barg, J. Galvanovskis, and P. Rorsman. 1999. Voltage-gated and resting membrane currents recorded from β-cells in intact mouse pancreatic islets. J. Physiol. 521:717–728. [DOI] [PMC free article] [PubMed] [Google Scholar]
- Hayashi, M., H. Yamada, S. Uehara, R. Morimoto, A. Muroyama, S. Yatsushiro, J. Takeda, A. Yamamoto, and Y. Moriyama. 2003. Secretory granule-mediated co-secretion of L-glutamate and glucagon triggers glutamatergic signal transmission in islets of Langerhans. J. Biol. Chem. 278:1966–1974. [DOI] [PubMed] [Google Scholar]
- Hiriart, M., and D.R. Matteson. 1988. Na+ channels and two types of Ca2+ channels in rat pancreatic β-cells identified with the reverse hemolytic plaque assay. J. Gen. Physiol. 91:617–639. [DOI] [PMC free article] [PubMed] [Google Scholar]
- Hollins, B., and S.R. Ikeda. 1997. Heterologous expression of a P2x-purinoceptor in rat chromaffin cells detects vesicular ATP release. J. Neurophysiol. 78:3069–3076. [DOI] [PubMed] [Google Scholar]
- Inagaki, N., H. Kuromi, T. Gonoi, Y. Okamoto, H. Ishida, Y. Seino, T. Kaneko, T. Iwanaga, and S. Seino. 1995. Expression and role of ionotropic glutamate receptors in pancreatic islet cells. FASEB J. 9:686–691. [PubMed] [Google Scholar]
- Ishihara, H., P. Maechler, A. Gjinovci, P.L. Herrera, and C.B. Wollheim. 2003. Islet β-cell secretion determines glucagon release from neighbouring alpha-cells. Nat. Cell Biol. 5:330–335. [DOI] [PubMed] [Google Scholar]
- Jayaraman, V., S. Thiran, and G.P. Hess. 1999. How fast does the g-aminobutyric acid receptor channel open? Kinetic investigations in the microsecond time region using a laser-pulse photolysis technique. Biochemistry. 38:11372–11378. [DOI] [PubMed] [Google Scholar]
- Johansson, H., E. Gylfe, and B. Hellman. 1989. Cyclic AMP raises cytoplasmic calcium in pancreatic a2-cells by mobilizing calcium incorporated in response to glucose. Cell Calcium. 10:205–211. [DOI] [PubMed] [Google Scholar]
- Karlsson, F.A., C. Berne, E. Bjork, M. Kullin, Z. Li, J.Y. Ma, A. Scholin, and L. Zhao. 2000. β-cell activity and destruction in type 1 diabetes. Ups. J. Med. Sci. 105:85–95. [DOI] [PubMed] [Google Scholar]
- Krentz, A.J., and M. Nattrass. 1997. Acute metabolic complications of diabetes mellitus: diabetic ketoacidosis, hyperosmolar non-ketotic syndrome and lactic acidosis. Textbook of Diabetes. Vol. 2. J. Pickup and G. Williams, editors. Blackwell Science, Oxford. 39.31–39.23.
- Michalik, M., and M. Erecinska. 1992. GABA in pancreatic islets: metabolism and function. Biochem. Pharmacol. 44:1–9. [DOI] [PubMed] [Google Scholar]
- Moriyama, Y., M. Hayashi, H. Yamada, S. Yatsushiro, S. Ishio, and A. Yamamoto. 2000. Synaptic-like microvesicles, synaptic vesicle counterparts in endocrine cells, are involved in a novel regulatory mechanism for the synthesis and secretion of hormones. J. Exp. Biol. 203:117–125. [DOI] [PubMed] [Google Scholar]
- Moser, T., and E. Neher. 1997. Estimation of mean exocytic vesicle capacitance in mouse adrenal chromaffin cells. Proc. Natl. Acad. Sci. USA. 94:6735–6740. [DOI] [PMC free article] [PubMed] [Google Scholar]
- Nagamatsu, S., T. Watanabe, Y. Nakamichi, C. Yamamura, K. Tsuzuki, and S. Matsushima. 1999. a-soluble N-ethylmaleimide-sensitive factor attachment protein is expressed in pancreatic β-cells and functions in insulin but not g-aminobutyric acid secretion. J. Biol. Chem. 274:8053–8060. [DOI] [PubMed] [Google Scholar]
- Neher, E. 1992. Correction for liquid junction potentials in patch clamp experiments. Methods Enzymol. 207:123–131. [DOI] [PubMed] [Google Scholar]
- Nishiki, T., Y. Shoji-Kasai, M. Sekiguchi, S. Iwasaki, K. Kumakura, and M. Takahashi. 1997. Comparison of exocytotic mechanisms between acetylcholine- and catecholamine-containing vesicles in rat pheochromocytoma cells. Biochem. Biophys. Res. Commun. 239:57–62. [DOI] [PubMed] [Google Scholar]
- Olofsson, C.S., S.O. Göpel, S. Barg, J. Galvanovskis, X. Ma, A. Salehi, P. Rorsman, and L. Eliasson. 2002. Fast insulin secretion reflects exocytosis of docked granules in mouse pancreatic β-cells. Pflugers Arch. 444:43–51. [DOI] [PubMed] [Google Scholar]
- Pipeleers, D.G., F.C. Schuit, C.F. Van Schravendijk, and M. Van de Winkel. 1985. Interplay of nutrients and hormones in the regulation of glucagon release. Endocrinology. 117:817–823. [DOI] [PubMed] [Google Scholar]
- Plattner, H., A.R. Artajelo, and E. Neher. 1997. Ultrastuctural organization of bovine chromaffin cell cortex-analysis by cryofixation and morphometry of aspects pertinent to exocytosis. J. Cell Biol. 139:1709–1717. [DOI] [PMC free article] [PubMed] [Google Scholar]
- Reetz, A., M. Solimena, M. Matteoli, F. Folli, K. Takei, and P. De Camilli. 1991. GABA and pancreatic β-cells: colocalization of glutamic acid decarboxylase (GAD) and GABA with synaptic-like microvesicles suggests their role in GABA storage and secretion. EMBO J. 10:1275–1284. [DOI] [PMC free article] [PubMed] [Google Scholar]
- Renström, E., L. Eliasson, K. Bokvist, and P. Rorsman. 1996. Cooling inhibits exocytosis in single mouse pancreatic β-cells by suppression of granule mobilization. J. Physiol. 494:41–52. [DOI] [PMC free article] [PubMed] [Google Scholar]
- Robbins, M.S., L.H. Grouse, R.L. Sorenson, and R.P. Elde. 1981. Effect of muscimol on glucose-stimulated somatostatin and insulin release from the isolated, perfused rat pancreas. Diabetes. 30:168–171. [DOI] [PubMed] [Google Scholar]
- Rorsman, P., P.O. Berggren, K. Bokvist, H. Ericson, H. Mohler, C.G. Ostenson, and P.A. Smith. 1989. Glucose-inhibition of glucagon secretion involves activation of GABAA-receptor chloride channels. Nature. 341:233–236. [DOI] [PubMed] [Google Scholar]
- Rorsman, P., L. Eliasson, E. Renström, J. Gromada, S. Barg, and S. Göpel. 2000. The cell physiology of biphasic insulin secretion. News Physiol. Sci. 15:72–77. [DOI] [PubMed] [Google Scholar]
- Schmidli, R.S., P.G. Colman, E. Bonifacio, G.F. Bottazzo, and L.C. Harrison. 1994. High level of concordance between assays for glutamic acid decarboxylase antibodies. The first international glutamic acid decarboxylase antibody workshop. Diabetes. 43:1005–1009. [DOI] [PubMed] [Google Scholar]
- Shah, P., A. Vella, A. Basu, R. Basu, W.F. Schwenk, and R.A. Rizza. 2000. Lack of suppression of glucagon contributes to postprandial hyperglycemia in subjects with type 2 diabetes mellitus. J. Clin. Endocrinol. Metab. 85:4053–4059. [DOI] [PubMed] [Google Scholar]
- Shi, Y., J. Kanaani, V. Menard-Rose, Y.H. Ma, P.Y. Chang, D. Hanahan, A. Tobin, G. Grodsky, and S. Baekkeskov. 2000. Increased expression of GAD65 and GABA in pancreatic β-cells impairs first-phase insulin secretion. Am. J. Physiol. Endocrinol. Metab. 279:E684–E694. [DOI] [PubMed] [Google Scholar]
- Smismans, A., F. Schuit, and D. Pipeleers. 1997. Nutrient regulation of g-aminobutyric acid release from islet β-cells. Diabetologia. 40:1411–1415. [DOI] [PubMed] [Google Scholar]
- Sorenson, R.L., D.G. Garry, and T.C. Brelje. 1991. Structural and functional considerations of GABA in islets of Langerhans. β-cells and nerves. Diabetes. 40:1365–1374. [DOI] [PubMed] [Google Scholar]
- Sugita, S., O.H. Shin, W. Han, Y. Lao, and T.C. Sudhof. 2002. Synaptotagmins form a hierarchy of exocytotic Ca2+ sensors with distinct Ca2+ affinities. EMBO J. 21:270–280. [DOI] [PMC free article] [PubMed] [Google Scholar]
- Takahashi, N., T. Kadowaki, Y. Yazaki, Y. Miyashita, and H. Kasai. 1997. Multiple exocytotic pathways in pancreatic β-cells. J. Cell Biol. 138:55–64. [DOI] [PMC free article] [PubMed] [Google Scholar]
- Taniguchi, H., Y. Okada, C. Shimada, and S. Baba. 1977. GABA in pancreatic islets. Arch. Histol. Jpn. 40:87–97. [DOI] [PubMed] [Google Scholar]
- Thomas-Reetz, A., J.W. Hell, M.J. During, C. Walch-Solimena, R. Jahn, and P. De Camilli. 1993. A g-aminobutyric acid transporter driven by a proton pump is present in synaptic-like microvesicles of pancreatic β-cells. Proc. Natl. Acad. Sci. USA. 90:5317–5321. [DOI] [PMC free article] [PubMed] [Google Scholar]
- Thomas-Reetz, A.C., and P. De Camilli. 1994. A role for synaptic vesicles in non-neuronal cells: clues from pancreatic β-cells and from chromaffin cells. FASEB J. 8:209–216. [DOI] [PubMed] [Google Scholar]
- Tillakaratne, N.J., L. Medina-Kauwe, and K.M. Gibson. 1995. g-aminobutyric acid (GABA) metabolism in mammalian neural and nonneural tissues. Comp. Biochem. Physiol. A. Physiol. 112:247–263. [DOI] [PubMed] [Google Scholar]
- Travis, E.R., and R.M. Wightman. 1998. Spatio-temporal resolution of exocytosis from individual cells. Annu. Rev. Biophys. Biomol. Struct. 27:77–103. [DOI] [PubMed] [Google Scholar]
- von Blankenfeld, G., J. Turner, G. Ahnert-Hilger, M. John, M.O. Enkvist, F. Stephenson, H. Kettenmann, and B. Wiedenmann. 1995. Expression of functional GABAA receptors in neuroendocrine gastropancreatic cells. Pflugers Arch. 430:381–388. [DOI] [PubMed] [Google Scholar]
- Whim, M.D., and G.W. Moss. 2001. A novel technique that measures peptide secretion on a millisecond timescale reveals rapid changes in release. Neuron. 30:37–50. [DOI] [PubMed] [Google Scholar]
- Winnock, F., Z. Ling, R. De Proft, S. Dejonghe, F. Schuit, F. Gorus, and D. Pipeleers. 2002. Correlation between GABA release from rat islet β-cells and their metabolic state. Am. J. Physiol. Endocrinol. Metab. 282:E937–E942. [DOI] [PubMed] [Google Scholar]
- Yang, W., A.A. Reyes, and N.C. Lan. 1994. Identification of the GABAA receptor subtype mRNA in human pancreatic tissue. FEBS Lett. 346:257–262. [DOI] [PubMed] [Google Scholar]
- Yoon, J.W., C.S. Yoon, H.W. Lim, Q.Q. Huang, Y. Kang, K.H. Pyun, K. Hirasawa, R.S. Sherwin, and H.S. Jun. 1999. Control of autoimmune diabetes in NOD mice by GAD expression or suppression in β-cells. Science. 284:1183–1187. [DOI] [PubMed] [Google Scholar]