

Abstract
Positively charged voltage sensors of sodium and potassium channels are driven outward through the membrane's electric field upon depolarization. This movement is coupled to channel opening. A recent model based on studies of the KvAP channel proposes that the positively charged voltage sensor, christened the “voltage-sensor paddle”, is a peripheral domain that shuttles its charged cargo through membrane lipid like a hydrophobic cation. We tested this idea by attaching charged adducts to cysteines introduced into the putative voltage-sensor paddle of Shaker potassium channels and measuring fractional changes in the total gating charge from gating currents. The only residues capable of translocating attached charges through the membrane-electric field are those that serve this function in the native channel. This remarkable specificity indicates that charge movement involves highly specialized interactions between the voltage sensor and other regions of the protein, a mechanism inconsistent with the paddle model.
Keywords: gating current, S4 segment, Shaker, cysteine modification
INTRODUCTION
The foundation of the excitability of nerve and muscle cells lies in a ubiquitous collection of ion channels that are exquisitely sensitive to small changes in the electrical potential across the plasma membranes where they reside. In spite of the structural and functional diversity of these membrane proteins, the sensitivity to voltage is known to originate primarily from positively charged residues, typically arginines, embedded within α helices known as S4 segments. Voltage-gated potassium channels manifest an approximately fourfold radial symmetry, with the four subunits encircling the permeation pathway through which ions diffuse. Each subunit is composed of six transmembrane segments, including the S4 segment with its up to seven basic residues, typically separated from one another by two neutral residues. The movement through the membrane-electric field of the four outermost positively charged residues in each S4 segment is coupled to gates that open and close the permeation pathway (Yellen, 1998; Bezanilla, 2000). Each subunit consists of two functional domains. Pore domains, homologous to the bacterial KcsA channel (Doyle et al., 1998), surround the permeation pathway and are composed of the transmembrane segments S5 and S6, the reentrant loop between them, and the cytoplasmic COOH terminus. The peripheral voltage-sensing domains, consisting of the NH2 terminus and S1–S4, sense membrane potential and transmit this information to the pore domain.
Over the past decade a variety of experimental approaches have produced a reasonable consensus on how the S4 segments move through the membrane-electric field (Bezanilla, 2002; Gandhi and Isacoff, 2002; Horn, 2002; Larsson, 2002). Because of the pervasive hydrophilic accessibility of individual cysteines substituted anywhere along the S4 segments (Larsson et al., 1996; Yang et al., 1996; Yusaf et al., 1996; Baker et al., 1998; Wang et al., 1999), it is generally believed that hydrophilic crevices or vestibules invade the surfaces of S4 segments from both the extracellular and intracellular aspects of the channel (Fig. 1 A). These and other studies suggest that S4 segments move through a largely proteinaceous “gating pore” much shorter than the thickness of the bilayer membrane.
Figure 1.

Models of voltage-sensor movement. (A) Conventional model of voltage-sensor movement. Two opposing subunits are shown with the ion permeation path between them. Depolarization moves the extracellular portion of the S4 segment (red) outward through a short gating pore, opening the permeation pathway. Most of the S4 segment is surrounded by hydrophilic crevices/vestibules. The transmembrane-electric field falls mainly across the short gating pore. (B) Paddle model adapted from Jiang et al. (2003b). Two opposing subunits are shown. Depolarization moves the paddle, the S3b helix and extracellular end of the S4 segment, outward through lipid, pulling the cytoplasmic activation gate open.
A radically different proposal for charge movement has emerged from the crystal structure of the KvAP potassium channel (Jiang et al., 2003a,b). In this model the “voltage-sensor paddle”, consisting of the S4 segment, the COOH-terminal half of the S3 segment (S3b), and the short linker between them, shuttles its positive charges across the lipid bilayer in response to changes of membrane potential (Fig. 1 B). Depolarization results in the S4 segment pulling on the S4–S5 linker, which then causes the intracellular activation gate, at the cytoplasmic ends of the S6 segments, to open (Jiang et al., 2003b). The paddle is postulated to be peripheral to all other transmembrane segments and therefore largely surrounded by lipid, rather than water and protein, as in conventional models. Support for this new mechanism of charge movement derives mainly from two observations. The first is that in the crystal structure of the entire channel, the paddles appear as peripheral domains pointing away from the central core of the channel (Jiang et al., 2003a). The second is that the paddle can drag tethered biotin across the bilayer in response to changes of membrane potential (Jiang et al., 2003b).
We test here a direct prediction of this new model that distinguishes it from more conventional models. We ask whether the paddle can shuttle other charged groups, attached to introduced cysteines, across the membrane-electric field. The paddle model predicts that charged adducts placed anywhere within the COOH-terminal helix of the S3 segment and ∼12 residues into the S4 segment will contribute to charge movement. The conventional model, by contrast, predicts that the only charge-moving region of the channel protein is the short section of the S4 segment that moves through the gating pore. Our results show that the set of charge-moving residues is more restricted than predicted by either class of model. Only residues whose side-chains move charge in the native channel are capable of doing so when they are converted to cysteines and labeled with charged adducts. This result shows that charge movement by a voltage sensor is a highly specific process that is likely to involve a precise itinerary for charged side-chains through a favorable proteinaceous environment.
MATERIALS AND METHODS
DNA Clones and Site-directed Mutagenesis
The wild-type background we use for mutations is Shaker H4 containing four modifications: deletion of residues 6–46 to remove N-type inactivation, T449V to inhibit C-type inactivation, and C301S and C308S to reduce sensitivity of the wild type channel to cysteine modification (Holmgren et al., 1996). Based on this background, we constructed cysteine mutants and their nonconducting versions with the W434F mutation (Perozo et al., 1993) in the pore region. Mutagenesis was done with QuickChangeTM site-directed mutagenesis kits from Stratagene. All of the cDNA clones were sequenced to verify each mutation. We used a standard calcium phosphate method to transiently transfect tsA201 cells. We used oocyte expression for the R362C mutant because of its poor expression in mammalian cells. In this case we retained the native T449 residue to obviate potassium currents in the W434F mutant (Yang and Sigworth, 2002).
Electrophysiology
Standard whole-cell patch-clamp recording methods (Ding and Horn, 2003) were used to record gating and ionic currents. Except where noted, the patch pipette contained (mM): 105 CsF, 35 NaCl, 10 EGTA, 10 HEPES, pH 7.4. The bath contained (mM): 142 NaCl, 10 CsCl, 1.5 CaCl2, 1 MgCl2, 10 Hepes, pH 7.4. All of the experiments were done at room temperature. Liquid junction potentials between the bath and the pipette solution were corrected. Electrode resistance was in the range of 1–2 MΩ. The voltage error due to series resistance was <3 mV after compensation. Data were collected between 10–20 min after the establishment of the whole-cell configuration in order to avoid time-dependent changes of OFF gating currents. Two-microelectrode oocyte recording was used for R362C/W434F gating currents, using a OC-725C amplifier (Warner Instruments). The oocyte bath contained (mM): 100 N-methyl-D-glucamine Cl, 0.3 CaCl2, 1 MgCl2, 5 Hepes, pH 7.5. Methanethiosulfonate (MTS) reagents (Toronto Research Chemicals) were prepared from aqueous stock solutions of 100 mM methanethiosulfonate-ethyltrimethylammonium (MTSET), methanethiosulfonate-ethylsulfonate (MTSES), methanethiosulfonate-2-aminoethyl (MTSEA), and methanethiosulfonate-methyltrimethylammonium (MTSMT), that were kept at 4°C and diluted immediately before use.
Modification rates were determined as described previously using conducting variants of each cysteine mutant (Larsson et al., 1996). The second-order modification rates are reported in Table I. As an example, Fig. 2 shows the effect of modification of the mutant S357C by 2.5 mM extracellular MTSES. Five superimposed traces show the absence of an effect of the reagent when applied at −120 mV (Fig. 2 A, arrow). Subsequently, 500-ms depolarizations to −50 mV produced a saturating increase of Cs+ current elicited at a test pulse of +20 mV, presumably by making the introduced cysteine more reactive. This increase of current was largely a consequence of a leftward shift of the activation current-voltage relationship (unpublished data). Current at the end of the test pulse increased exponentially with a time constant of 8.8 s (Fig. 2 B). When modifying nonconducting variants of this mutant, we exposed the cells for at least 60 s (6.8 times the time constant of modification) to 2.5 mM MTSES at −50 mV. According to the measured time constant, the modification should be >99.8% (1 − e −6.8) complete after 60 s. If, however, the current increase is due to modification of only one of the channel's four cysteines, and if these cysteines react independently of one another, then the probability of a channel being completely modified is >0.995 [(1 − e −6.8)4]. We used this calculation for each mutant and reagent to ensure that >95% nonconducting channels were completely modified.
TABLE I.
Cysteine Modification Rates
| MTSMT | MTSEA | MTSES | MTSET | |
|---|---|---|---|---|
| S357C | 1,717 ± 74 −50 mV, (3) |
38 ± 9 −50 mV,(3) |
||
| A359C | 1,016 ± 25 −50 mV, (3) |
153 ± 30 −50 mV, (3) |
98 ± 27 −50 mV, (4) |
2,884 ± 518 −50 mV, (4) |
| R362C | 753 ± 309 0 mV, (3) |
614 ± 160 0 mV, (3) |
208 ± 55 0 mV, (3) |
|
| V363C | 1,537 ± 139 −50 mV, (4) |
877 ± 121 0 mV, (3) |
NR | |
| I364C | 601 ± 94 −50 mV, (3) |
4,123 ± 720 0 mV, (3) |
46 ± 22 −50 mV, (3) |
|
| R365C | 4,410 ± 242 0 mV, (3) |
20,949 ± 2,612 0 mV, (5) |
1,784 ± 600 0 mV, (3) |
|
| L366C | 2,055 ± 534 0 mV, (3) |
4,464 ± 847 0 mV (3) |
NR |
Modification rates of conducting mutants of Shaker by methanethiosulfonate reagents. Rates (M−1s−1) were calculated from the single exponential time course of changes of current amplitudes due to shifts in conductance-voltage (G-V) relationships induced by modification (Larsson et al., 1996). The voltage at which the rate was measured is indicated for each residue and MTS reagent with the number of cells examined in parentheses. The indicated voltages are identical to those used for modification of the non-conducting mutants in the corresponding experiments throughout the study. NR indicates that modification rate was too low to be measured.
Figure 2.
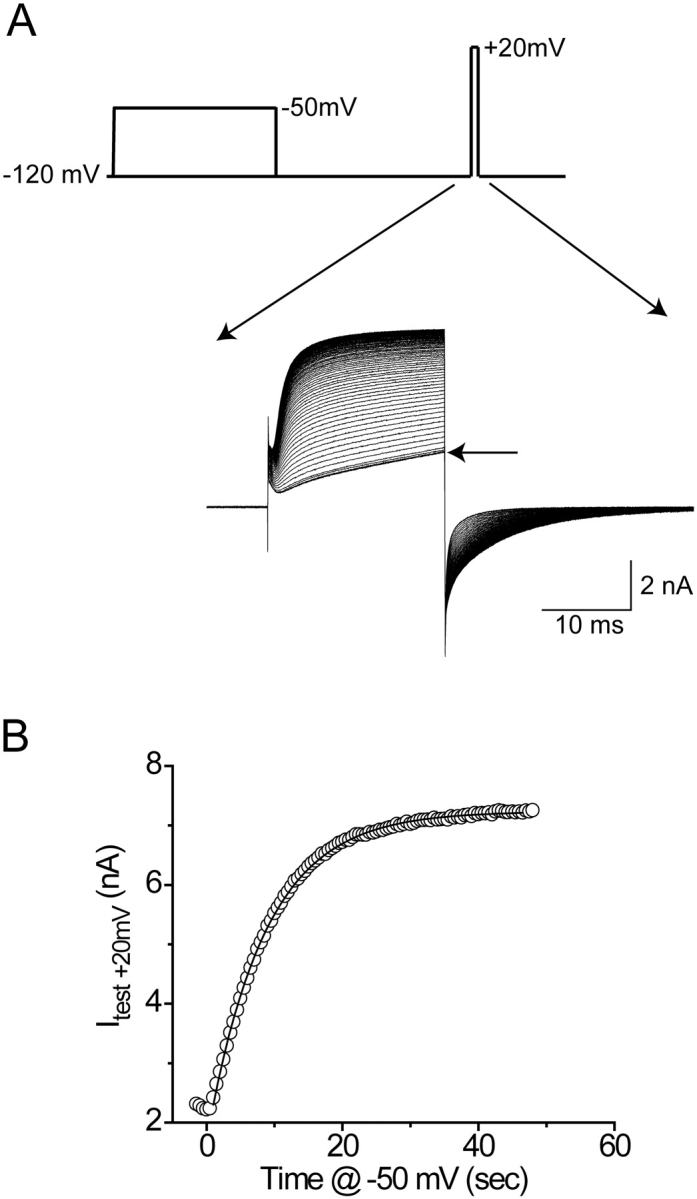
Time course of cysteine modification of S357C by 2.5 mM MTSES. (A) Cs+ currents elicited at +20 mV in the conducting variant. The pulse protocol is shown, and the experiment described in more detail in materials and methods. (B) Isochronal currents measured near the end of the test pulse. The fitted line is an exponential function with a time constant of 8.8 s.
Capacitance and leakage currents were usually subtracted by the use of a P/−8 correction protocol from a −140 mV holding potential. To ensure that linear capacitance correction did not lose charge, we also used the methods of Aggarwal and MacKinnon (1996) to compute Q-V curves from uncorrected capacity transients over a range from −240 to +120 mV. For most constructs, except unmodified R365C/W434F, this method produced identical Q-V relationships as seen after P/−8 correction.
Data Analysis
Data were analyzed using pCLAMP (Axon Instruments, Inc.), ORIGIN 7.0 (OriginLab), and Fortran (Compaq). Throughout the paper, error bars represent the standard error of the mean.
Integrated charge Q was obtained from OFF gating current at a fixed potential of −140 mV, except where indicated otherwise. The total charge Q tot was identical measured from OFF or ON gating currents if the holding and tail potentials were identical. Q-V relations were fitted to the Boltzmann equation:
 |
RT/F = 25 mV at room temperature. A weighted double Boltzmann function was used to fit the Q-V relationship of unmodified R365C/W434F.
RESULTS
Attaching Charged Adducts to the Voltage-sensor Paddle
Voltage sensors respond to changes of membrane potential by moving charge, a process much like electrophoresis. To examine its aptitude for this task, we attached charged adducts to the putative voltage-sensor paddle and measured fractional changes in the total charge moved by the channel's voltage sensors. We estimate charge movement from the gating currents obtained from cysteine mutants of the Shaker potassium channel. To avoid contamination by ionic currents we used a nonconducting background (W434F) in most experiments. Our Shaker variant also lacked the NH2-terminal inactivation ball. An individual Shaker channel can move a total of ∼13 elementary charges across the membrane-electric field (Schoppa et al., 1992; Aggarwal and MacKinnon, 1996; Seoh et al., 1996). In a transfected cell the total gating charge of all functional channels, Q tot, is estimated directly from the integrated gating currents over a wide range of voltages (the Q-V relationship). We examine the fractional change of Q tot after covalently attaching either negative or positive adducts to a cysteine introduced into each voltage-sensor paddle. The expected effect of this manipulation is substantial. If each of a channel's four paddles increases its charge by +1, for example by reaction of a cysteine with the monovalent cation MTSET (methanethiosulfonate-ethyltrimethylammonium), Q tot is expected to increase by ∼31% (4/13 × 100%), assuming that each paddle shuttles its charged adduct completely across the electric field along with the S4's four outermost arginines. Similarly, the monovalent anion MTSES (methanethiosulfonate-ethylsulfonate) should decrease Q tot by ∼31%.
To ensure complete labeling, we measured modification rates in conducting mutants (Table I), using standard methods based on reagent-induced shifts of the conductance-voltage (G-V) relationship (Larsson et al., 1996; Baker et al., 1998). From these second order rate constants we chose reagent concentrations, voltages, and exposure times sufficient for >95% labeling of all cysteines (see materials and methods).
According to the alignment between the crystal structure of KvAP and Shaker (Jiang et al., 2003a), residue A359 lies at the tip of the voltage-sensor paddle, three residues out from the outermost arginine (R362) of the S4 segment. Fig. 3 shows that modification of the cysteine mutant A359C by anionic MTSES slows gating current kinetics while having absolutely no effect on Q tot for this cell (Fig. 3 D, unnormalized Q-V curves). This result suggests that although the S4 segment is entirely capable of translocating its charged arginines after modification of A359C by MTSES, the adduct itself remains outside the membrane-electric field.
Figure 3.

Modification of A359C/W434F by MTSES. The crystal structure of S2–S4 from the isolated voltage-sensor domain of KvAP (Jiang et al., 2003a) is shown, with A359C represented as a lysine, the approximate structure of a cysteine modified by MTSEA. Drawn using DeepView/Swiss-PdbViewer (http://us.expasy.org). (A and B) Gating currents elicited by depolarizations from −70 to +50 mV in 10-mV increments. Holding potential, −120 mV; tail potential, −140 mV. Effect of MTSES shown in B. (C) ON gating currents at +50 mV and OFF gating currents at −140 mV after a step to +50 mV from the same cell shown in (A and B). The arrow indicates the MTS-modified current. (D) Un-normalized Q-V curves from the same cell.
Modification of A359C by cationic MTSET has the opposite effect on kinetics, producing faster ON and OFF gating currents (Fig. 4, A–C). In this case, however, Q tot is decreased ∼30% (Fig. 4 D), the opposite direction predicted by the paddle model, as if the S-ethyltrimethylammonium (SET) adduct prevents the S4 segment from moving back to its full resting position at a hyperpolarized voltage. This reduction of Q tot is not due to a destruction of ∼30% of the channels by MTSET, as shown in Fig. 4 E. In this experiment we measured gating current and ionic current within the same cell, using a conducting variant of the A359C mutant. The poorly permeant cation Cs+ in this experiment reduces the amplitude of ionic current to a manageable level (Olcese et al., 1997; Horn et al., 2000). The reversal potential of the ionic current was set by the Cs+ gradient to ∼35 mV. A depolarization from −140 to +35 mV reveals a pure gating current, and a subsequent depolarization to +65 mV exposes a pure ionic current. Note that these voltages are sufficiently depolarized to maximally activate both gating current (Table II) and ionic current (control G-V curves were fit by a Boltzmann function with V mid = −41 ± 0.8 mV, and slope of 5.1 ± 0.2 e0, n = 3). Modification by MTSET reduced the integrated ON gating current in this cell by 35% while having no effect on the ionic current, suggesting that reduction of Q tot is not accompanied by a loss of channels. Moreover, we used nonstationary noise analysis on Cs+ currents to measure the effects of MTSET modification on the estimated number of channels (N) in a cell. N did not change significantly in three A359C cells after MTSET modification (paired t test; unpublished data), in spite of clear effects on both gating current kinetics and Q tot.
Figure 4.

Modification of A359C by MTSES. All panels used the nonconducting (W434F) variant except E. (A–D) As in Fig. 3. (E) Ionic (Cs+) and gating currents from a MTSET-modified cell. Holding potential, −140 mV. Depolarization to +35 mV, the reversal potential for ionic current, reveals a pure gating current. The subsequent depolarization to +65 mV is a pure ionic current. Currents before and after modification are superimposed, showing characteristic effects on gating current, but none on ionic current. Bath (in mM): 152 CsCl, 1.5 CaCl2, 1 MgCl2, 10 Na-HEPES (pH 7.4). Internal: 37.5 CsCl, 102.5 N-methyl-D-glucamine chloride, 10 EGTA, 10 HEPES (pH 7.3).
TABLE II.
Q-V Parameters
| Control | MTSET | MTSMT | MTSES | MTSEA | ||||||
|---|---|---|---|---|---|---|---|---|---|---|
| V mid | q (e0) | V mid | q (e0) | V mid | q (e0) | V mid | q (e0) | V mid | q (e0) | |
| mV | mV | mV | mV | mV | ||||||
| S357C | −42.5 ± 2.5 (6) |
1.3 ± .11 | −58.6 ± 4.5 (3) |
1.6±.12 | −53.1 ± 9.2 (3) |
1.3 ± .10 | ||||
| A359C | −40.3 ± 0.7 (24) |
2.1±.09 | −43.8 ± 2.5 (7) |
1.6 ± .09 * |
−44.2 ± 4.8 (7) |
1.7 ± .18 | −49.4 ± 3.9 (4) |
1.9 ± .14 | −42.8 ± 2.5 (5) |
1.7 ± .16 |
| R362C | −42.4 ± 1.3 (32) |
1.0 ± .04 | −77.5 ± 1.9 (8) * |
1.1 ± .09 | −72.9 ± 2.8 (10) * |
1.1 ± .11 | −38.5 ± 1.6 (14) |
1.0 ± .04 | ||
| V363C | −53.7 ± 1.2 (17) |
2.2 ± .06 | −60.4 ± 1.9 (14) * |
1.8 ± .12 | −54.2 ± 2.4 (3) |
2.8 ± .29 | ||||
| I364C | −48.1 ± 1.0 (12) |
3.1 ± .19 | −19.6 ± 3.6 (6) * |
1.3 ± .07 * |
−51.1 ± 2.3 (3) |
2.8 ± .34 | −41.0 ± 6.9 (3) |
2.4 ± .60 | ||
| R365C | −44.7 ± 3.2 (5) |
2.0 ± .23 | −26.6 ± 5.7 (7) |
1.8 ± .12 | ||||||
| L366C | −63.1 ± 1.3 (7) |
3.8 ± .23 | −71.5 ± 1.4 (3) * |
2.8 ± .37 | −63.7 ± 0.9 (4) |
3.0 ± .25 | ||||
Boltzmann parameters of charge-voltage (Q-V) relationships for nonconducting (W434F) Shaker mutants. In the case of the R365C mutant, control Q-V curves were fit with a double Boltzmann function with estimated parameters indicated in the legend of Fig. 9. The number of cells for each group is in parenthesis with the asterisk indicating P < 0.01 in a paired t test assuming unequal variance.
A shorter derivative of MTSET, namely MTSMT (methanethiosulfonate-methyltrimethylammonium), has similar effects as MTSET on the A359C mutant (Fig. 5, A, B, and E–G). The distance between the Cβ of arginine and one of its guanido nitrogens is approximately the same as the comparable distance for a cysteine modified by MTSMT. This argues against the possibility that the length of the adduct allows the introduced charge to remain outside of the membrane as the paddle moves its postulated distance (≥20 Å; Jiang et al., 2003b) across the bilayer.
Figure 5.

Modification of A359C/W434F by MTS reagents. (A–D) ON and OFF gating currents and Q-V curves, as in Fig. 3. (E) Fractional effect of all MTS reagents on Q tot of A359C/W434F. (F) Effect of MTS reagents on time constant of ON gating current at +50 mV. (G) Effect of MTS reagents on time constant of OFF gating current at −140 mV after a depolarization to +50 mV.
The reduction of Q tot by MTSET and MTSMT, but not MTSES, suggests that the S4 segment cannot pull the cationic adducts into a fully withdrawn conformation at hyperpolarized voltages. Stronger hyperpolarization, to −240 mV after a step to +120 mV, did not increase Q tot measured in OFF gating currents (not depicted). These results imply that cationic adducts on residue A359C interfere with S4 movement through the gating pore. Alternatively, the energy of moving a cationic adduct through lipid is so high that the paddle cannot pull it into the bilayer, even though it is postulated to be able to move four charged arginines through lipid. Why are cationic and anionic adducts different in their effects on Q tot? One possibility is steric hindrance. The bulky trimethylammonium group of SET and SMT is larger than the sulfonate of SES. To test this possibility we modified A359C with the primary amine MTSEA (methanethiosulfonate-ethylammonium), which also speeds the kinetics of ON gating currents without reducing Q tot (Fig. 5, C–F). Although this result supports the idea that the smaller size of SEA allows freer S4 movement, this adduct may leave Q tot unaffected due the fact that the adduct becomes deprotonated (i.e., uncharged) when pulled into a hydrophobic environment.
Cationic adducts may inhibit inward S4 movement and reduce Q tot because residue 359 is so close to the S4 segment and the postulated gating pore through which it moves. To test this possibility we tagged S357C, two positions further out into the S3–S4 linker, with MTSMT or MTSES. Although both reagents slow the kinetics of ON and OFF gating currents (Figs. 6 A, and 7, B and C) and cause hyperpolarizing shifts of the Q-V relationship (Table II), they have no effect on Q tot (Figs. 6 A and 7 A), indicating that adducts attached to this residue remain outside of the electric field even at hyperpolarized voltages.
Figure 6.
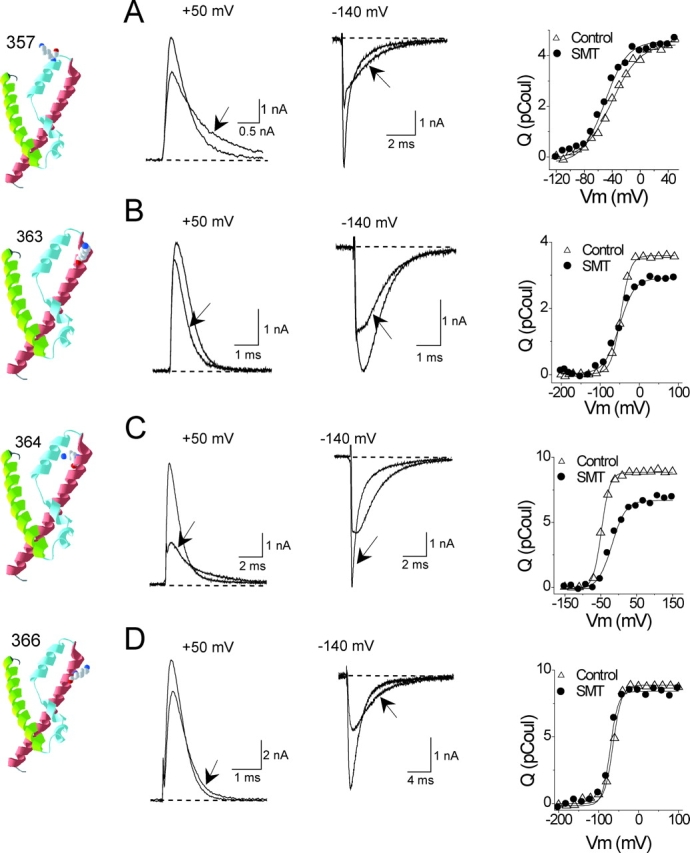
Modification of neutral residues. (A–D) Effects on gating currents and Q-V curves of MTSMT modification of indicated residues, labeled as in Figs. 3–5.
Charging the S4 Segment
Although the paddle model implies that residues at the extracellular end of the S4 segment should translocate charged adducts at least partway through the electric field (Fig. 1 B), our results show otherwise. It might be argued, however, that hydrophilic adducts attached to the S3–S4 loop remain in contact with the extracellular solution even when the S4 segment is withdrawn to a more intracellular position. Both paddle and conventional models predict, nevertheless, that the 10 outermost residues of the S4 segment, beginning with the outermost arginine (R362 in Shaker), should all be able to transfer their side-chains through the membrane-electric field. We tested this hypothesis for all S4 residues that are readily accessible to extracellular cysteine reagents. Unexpectedly, although V363C, I364C, and L366C can be modified by charged MTS reagents, in no case does the modification produce the predicted direction of change of Q tot (Figs. 6, B–D, and 7 A), in spite of the fact that these neutral residues are all flanked by charge-carrying arginines. The deepest of these residues in the primary sequence, L366, is between S4's second (R365) and third (R368) arginines, both of which are able to carry their charges completely through the electric field (Aggarwal and MacKinnon, 1996; Seoh et al., 1996). Two out of three of these neutral S4 residues show a significant reduction in Q tot when modified by MTSMT (Fig. 7 A). These reductions in gating charge were, as in the case of MTSET modification of A359C (Fig. 4 E), accompanied by much smaller decreases of ionic conductance, 6.34 ± 0.02% (n = 3) for V363C and 7.41 ± 0.08% (n = 3) for I364C (unpublished data).
Figure 7.

Summary of effects of MTS reagents on S357C, V363C, I364C, and L366C. (A–C) Effects on Q tot and gating current kinetics, as in Fig. 5, E–G. Two time constants were required to fit data for I364C/W434F after MTSMT modification. n = 3–14 cells for each measurement.
The inability of charged adducts to contribute to Q tot raises the question whether the S4 segment evolved with specialized roles for the specific residues that carry charge in native channels. To investigate this idea, we mutated R362 and R365, the two S4 charged residues accessible from the extracellular surface of Shaker, to cysteine and tested whether they were able to transfer methanethiosulfonate adducts across the electric field. Fig. 8, B and E, show that modification of R362C by either MTSEA or MTSMT produces the 44% increase in Q tot expected for the addition of one positive charge to each S4 segment (4/9 × 100%). Moreover, MTSES decreases Q tot, although not to the full extent expected for a monovalent anion (Fig. 8, D and E).
Figure 8.

Modification of R362C/W434F. (A–D) Effect of MTSEA and MTSES modification in oocytes expressing R362C/W434F. Currents recorded by two-microelectrode voltage clamp. Holding and tail potential, −100 mV; 20-mV steps between −140 and +100 mV. Linear capacity–corrected currents used a 20-mV depolarization from +60 mV. Q-V relationships obtained from uncorrected currents (Aggarwal and MacKinnon, 1996). (E) Fractional effect of modification of R362C/W434F on Q tot. Dashed lines are predictions for adding one positive charge (1.44) or one negative charge (0.56) to each S4 segment. Cationic adducts increase Q tot by an amount insignificantly different from the predicted 44%, but significantly different from the control (*, P < 0.01). MTSES modification causes a significant reduction of Q tot (*), but not down to the predicted level.
Cysteine mutation of the deeper residue R365 causes a striking alteration of the Q-V relationship, as described previously (Baker et al., 1998), spreading the charge movement over a much wider voltage range (Fig. 9, A and B). Reaction of this mutant with either MTSEA (Baker et al., 1998) or MTSES restores the Q-V relationship to the form of a compact single Boltzmann function. As in the case of R362C, modification of R365C with the cationic adduct increases, and with the anionic adduct decreases, Q tot (Fig. 9 E). MTSMT abolishes both the ionic and gating current of R365C (not depicted), perhaps by steric hindrance of S4 movement.
Figure 9.

Modification of R365C/W434F. (A–D) Effect of MTSEA and MTSES modification in tsA201 cells. Q-V obtained as described in Fig. 8. Control shows currents between −240 and +120 mV in 40-mV steps; after modification from −150 to +120 mV in 30-mV steps (A); or from −150 to +100 mV in 50-mV steps (C). Holding and tail potential, −100 and −120 mV, respectively. Control Q-V curves were fit to a double Boltzmann function with the following estimated parameters: V mid1 = −142.5 ± 3.2 mV; q 1 = 1.75 ± 0.35 e0; V mid2 = −4.4 ± 2.9 mV; q 2 = 2.16 ± 0.43 e0; w1 = 0.36 ± 0.03; n = 12. w1 is the fractional weight of the hyperpolarized component. (E) Fractional effect of modification of R365C/W434F on Q tot. MTSES modification reduces Q tot significantly less than predicted for the addition of one negative charge.
Thus, R362C and R365C, unlike all the other cysteine mutants we examined in S4 or in the S3-S4 linker, are capable of translocating cationic adducts completely across the electric field. Moreover, these are the only residues in which MTSES modification affects Q tot. Our results cannot establish whether the SES adduct is translocated through the electric field, but the data for R365C, in which MTSES reduces Q tot significantly more than predicted by its charge alone, suggest that the anionic adduct inhibits S4 movement, either sterically or electrostatically.
The residues we examined in this study fall into two nonoverlapping classes, those capable of moving positive charge (R362 and R365), and all others. Among the latter class, all neutral residues in the native channel, we observed some diversity of phenotypes, in that bulky adducts reduced Q tot in residues at positions 359, 363, and 364, but not in others. This heterogeneity of phenotype suggests a fine-grained structure in the region where the S4 segment traverses the electric field. It also supports the idea that charge transfer involves the movement of one proteinaceous region against another, and that this movement can be inhibited by steric hindrance.
DISCUSSION
The charged residues of S4 segments are specialized for moving their side-chains through the electric field in response to changes of membrane potential. Quite unexpectedly, neutral residues in the S4 segment, even those flanked by charge-moving arginines, are incapable of this feat. This result strongly suggests that the periodicity unique to S4 segments, in which every third residue is positively charged, is a structural feature required for normal charge movement. This specificity rules out both the paddle model and featureless versions of conventional models. Moreover, it suggests that changes of membrane potential move the S4 segment along a distinct trajectory that is energetically permissive for its basic residues to traverse a relatively hydrophobic environment.
Our proposal is reinforced by the fact that the primary amine adduct SEA increases Q tot by one charge per S4 segment in either R362C or R365C, indicating that the adduct is fully protonated during S4 movement. In fact, SEA produces the same fractional increase of Q tot in R362C as the permanently charged adduct SMT (Fig. 8 E). However MTSEA, unlike MTSMT, is titratable and readily permeates bilayer membranes in a deprotonated form at neutral pH (Karlin and Akabas, 1998). If the SEA adduct behaves like other small titratable molecules (Gutknecht and Tosteson, 1973), the permeability of the bilayer for the uncharged amine is expected to be at least seven orders of magnitude higher than for the charged form (McLaughlin, 1973), excluding the likelihood that the protonated amine moves through lipid. We conclude, therefore, that the side-chains of residues 362 or 365 cross the electric field within the confines of a gating pore primarily composed of protein. Here they experience a negative electrostatic potential that both lowers the energy for arginine and favors the protonated form of the SEA adduct. This idea is consistent with the pK a shift observed for histidine in the R365H mutant of Shaker (Starace et al., 1997) and with negative electrostatic potentials estimated in the vicinity of basic residues in an S4 segment of the sodium channel (Yang et al., 1997). Neutral S4 residues must be sufficiently far from this negative potential when they move through the gating pore that they cannot carry cationic adducts across the electric field. The specificity we report here applies only to the position of the residues along the S4 segment, not the specific structure of the side-chain of these residues. Arginine, lysine (Aggarwal and MacKinnon, 1996), or a cysteine labeled with either MTSEA or MTSMT all transfer a full charge at position 362 of Shaker. Even a histidine substituted for one of the charge-carrying residues of Shaker can move a proton across the electric field (Starace et al., 1997; Starace and Bezanilla, 2001). The fact that histidine can remain protonated as it crosses the electric field also argues against its side-chain moving through lipid.
Fig. 10 shows that the specificity we observe can be accounted for by a helical screw model of S4 movement (Catterall, 1986; Guy and Seetharamulu, 1986; Keynes and Elinder, 1999; Lecar et al., 2003). The periodicity of basic and neutral residues in an S4 α helix leads to a pattern of three left-handed spiral stripes, one of which is composed of the charged residues (Gandhi and Isacoff, 2002). In this model depolarization causes a 13.5 Å outward translation accompanied by a 180° clockwise rotation (viewed from the extracellular side), so that each positively charged side-chain follows the same path through the gating pore. The negative electrostatic potential experienced by basic residues is likely to originate from acidic residues both in the extracellular S3-S4 and S5-S6 loops (Elinder et al., 2001), and in the neighboring S2 and S3 segments (Papazian et al., 1995; Silverman et al., 2003). The helical screw motion insures that ion pairs will lower the energy of basic residues on the charged stripe as it moves through a region of low dielectric constant. If the S4 segment lies against the pore domain (Cha et al., 1999; Blaustein et al., 2000; Broomand et al., 2003; Gandhi et al., 2003; Lainé et al., 2003; Neale et al., 2003), S2 and S3 segments and their negative charges will be peripheral to the central axis, forming the outer perimeter of the gating pore surrounding an S4 segment (Fig. 10). Therefore, when charged residues of the S4 segment are in the gating pore, they are likely to be oriented radially outwards, toward the stabilizing acidic residues in S2 and S3. Notice that the 180° rotation brings R362, which is in the gating pore at a hyperpolarized voltage (Larsson et al., 1996; Starace and Bezanilla, 2001), around to face the pore domain at a depolarized voltage, where it approaches closely to residues at the top of the S5 segment of a neighboring subunit (Elinder et al., 2001; Broomand et al., 2003; Lainé et al., 2003).
Figure 10.

Helical screw model. Shaker S4 model superimposed on the pore domain represented by the KcsA crystal structure (Doyle et al., 1998). Only three of the four S4 segments are shown for clarity. The amorphous peripheral domains that enclose S4 segments (shown only for two opposing subunits) consist of the S1–S3 segments, with critical negative charges (in red) contributed by the S2 and S3 segments (Papazian et al., 1995). The blue and white side-chains are for the basic residues, showing the charged spiral around the S4 segment. Residues 363 (green), 364 (purple), and 366 (orange) are shown as lysines, indicative of the approximate structure of a cysteine modified by MTSEA. The orientation of the S4 segment is ∼40° to the vertical axis of the pore domain (Li-Smerin et al., 2000), allowing close approach between R362 and the top of an adjacent subunit at a depolarized voltage (Broomand et al., 2003; Lainé et al., 2003; Neale et al., 2003). A helical wheel shows the three outermost arginines on the opposite face of the four neutral residues that lie between them.
What happens when extracellular charged adducts are attached to normally neutral S4 residues? Our data show that they cannot be translocated through the electric field, suggesting that they remain electrically contiguous with the extracellular compartment, even at strongly hyperpolarized voltages. Any two consecutive neutral residues are on the opposite face of the helix from the basic residues flanking them (Fig. 10, helical wheel). Therefore, when their flanking arginines are in the gating pore, charged adducts on normally neutral residues must reside in an extracellular vestibule between the S4 segment and uncharged regions of the central pore domain (Fig. 10).
A depolarization of only 10 mV can change the open probability of a sodium or potassium channel by more than two orders of magnitude (Sigworth, 1994; Bezanilla, 2000). This exceptional sensitivity to membrane potential necessitates that each S4 segment be capable of translocating at least 2.8 elementary charges across a hydrophobic barrier. Moreover, the charge must be moved rapidly for the physiologically important task of generating action potentials. Voltage-gated ion channels use two tricks to lower the energy for moving this charge. First, they create aqueous crevices and vestibules around S4 segments, so that at any membrane potential the charged side-chains of basic residues are predominately in an aqueous environment either above or below the gating pore (Larsson et al., 1996; Yang et al., 1996; Yusaf et al., 1996; Baker et al., 1998; Wang et al., 1999). Second, they provide an energetically favorable pathway, decorated with punctate negative charges, for the positively charged stripe of S4 charges. Both of these design strategies require that the S4 segment move through a largely proteinaceous gating pore with a structure attuned to the periodicity of positively charged residues of the S4 segment. This conclusion, which is supported by an extensive range of experimental observations, is incompatible with the paddle model in which the S4 charges move a distance of ≥20 Å entirely through lipid (Jiang et al., 2003b).
Acknowledgments
We thank Dr. Manuel Covarrubias for comments on the manuscript, Dr. Michael Root for help with Fig. 10, and Ms. Lindsey Ingleby for technical assistance.
Supported by National Institutes of Health grant AR41691.
Lawrence G. Palmer served as editor.
References
- Aggarwal, S.K., and R. MacKinnon. 1996. Contribution of the S4 segment to gating charge in the Shaker K+ channel. Neuron. 16:1169–1177. [DOI] [PubMed] [Google Scholar]
- Baker, O.S., H.P. Larsson, L.M. Mannuzzu, and E.Y. Isacoff. 1998. Three transmembrane conformations and sequence-dependent displacement of the S4 domain in Shaker K+ channel gating. Neuron. 20:1283–1294. [DOI] [PubMed] [Google Scholar]
- Bezanilla, F. 2000. The voltage sensor in voltage dependent ion channels. Physiol. Rev. 80:555–592. [DOI] [PubMed] [Google Scholar]
- Bezanilla, F. 2002. Voltage sensor movements. J. Gen. Physiol. 120:465–473. [DOI] [PMC free article] [PubMed] [Google Scholar]
- Blaustein, R.O., P.A. Cole, C. Williams, and C. Miller. 2000. Tethered blockers as molecular ‘tape measures’ for a voltage-gated K+ channel. Nat. Struct. Biol. 7:309–311. [DOI] [PubMed] [Google Scholar]
- Broomand, A., R. Männikkö, H.P. Larsson, and F. Elinder. 2003. Molecular movement of the voltage sensor in a K channel. J. Gen. Physiol. 122:741–748. [DOI] [PMC free article] [PubMed] [Google Scholar]
- Catterall, W.A. 1986. Molecular properties of voltage-sensitive sodium channels. Annu. Rev. Biochem. 55:953–985. [DOI] [PubMed] [Google Scholar]
- Cha, A., G.E. Snyder, P.R. Selvin, and F. Bezanilla. 1999. Atomic scale movement of the voltage-sensing region in a potassium channel measured via spectroscopy. Nature. 402:809–813. [DOI] [PubMed] [Google Scholar]
- Ding, S., and R. Horn. 2003. Effect of S6 tail mutations on charge movement in Shaker potassium channels. Biophys. J. 84:295–305. [DOI] [PMC free article] [PubMed] [Google Scholar]
- Doyle, D.A., J.M. Cabral, R.A. Pfuetzner, A.L. Kuo, J.M. Gulbis, S.L. Cohen, B.T. Chait, and R. MacKinnon. 1998. The structure of the potassium channel: Molecular basis of K+ conduction and selectivity. Science. 280:69–77. [DOI] [PubMed] [Google Scholar]
- Elinder, F., R. Männikkö, and H.P. Larsson. 2001. S4 charges move close to residues in the pore domain during activation in a K channel. J. Gen. Physiol. 118:1–10. [DOI] [PMC free article] [PubMed] [Google Scholar]
- Gandhi, C.S., E. Clark, E. Loots, A. Pralle, and E.Y. Isacoff. 2003. The orientation and molecular movement of a K+ channel voltage-sensing domain. Neuron. 40:515–525. [DOI] [PubMed] [Google Scholar]
- Gandhi, C.S., and E.Y. Isacoff. 2002. Molecular models of voltage sensing. J. Gen. Physiol. 120:455–463. [DOI] [PMC free article] [PubMed] [Google Scholar]
- Gutknecht, J., and D.C. Tosteson. 1973. Diffusion of weak acids across lipid bilayer membranes: Effects of chemical reactions in the unstirred layers. Science. 182:1258–1261. [DOI] [PubMed] [Google Scholar]
- Guy, H.R., and P. Seetharamulu. 1986. Molecular model of the action potential sodium channel. Proc. Natl. Acad. Sci. USA. 83:508–512. [DOI] [PMC free article] [PubMed] [Google Scholar]
- Holmgren, M., M.E. Jurman, and G. Yellen. 1996. N-type inactivation and the S4-S5 region of the Shaker K+ channel. J. Gen. Physiol. 108:195–206. [DOI] [PMC free article] [PubMed] [Google Scholar]
- Horn, R. 2002. Coupled movements in voltage-gated ion channels. J. Gen. Physiol. 120:449–453. [DOI] [PMC free article] [PubMed] [Google Scholar]
- Horn, R., S. Ding, and H.J. Gruber. 2000. Immobilizing the moving parts of voltage-gated ion channels. J. Gen. Physiol. 116:461–475. [DOI] [PMC free article] [PubMed] [Google Scholar]
- Jiang, Y.X., A. Lee, J.Y. Chen, V. Ruta, M. Cadene, B.T. Chait, and R. MacKinnon. 2003. a. X-ray structure of a voltage-dependent K+ channel. Nature. 423:33–41. [DOI] [PubMed] [Google Scholar]
- Jiang, Y.X., V. Ruta, J.Y. Chen, A. Lee, and R. MacKinnon. 2003. b. The principle of gating charge movement in a voltage-dependent K+ channel. Nature. 423:42–48. [DOI] [PubMed] [Google Scholar]
- Karlin, A., and M.H. Akabas. 1998. Substituted-cysteine accessibility method. Methods Enzymol. 293:123–145. [DOI] [PubMed] [Google Scholar]
- Keynes, R.D., and F. Elinder. 1999. The screw-helical voltage gating of ion channels. Proc. R. Soc. Lond. B. Biol. Sci. 266:843–852. [DOI] [PMC free article] [PubMed] [Google Scholar]
- Lainé, M., M.C. Lin, J.P. Bannister, W.R. Silverman, A.F. Mock, B. Roux, and D.M. Papazian. 2003. Atomic proximity between S4 segment and pore domain in Shaker potassium channels. Neuron. 39:467–481. [DOI] [PubMed] [Google Scholar]
- Larsson, H.P. 2002. The search is on for the voltage sensor-to-gate coupling. J. Gen. Physiol. 120:475–481. [DOI] [PMC free article] [PubMed] [Google Scholar]
- Larsson, H.P., O.S. Baker, D.S. Dhillon, and E.Y. Isacoff. 1996. Transmembrane movement of the Shaker K+ channel S4. Neuron. 16:387–397. [DOI] [PubMed] [Google Scholar]
- Lecar, H., H.P. Larsson, and M. Grabe. 2003. Electrostatic model of S4 motion in voltage-gated ion channels. Biophys. J. 85:2854–2864. [DOI] [PMC free article] [PubMed] [Google Scholar]
- Li-Smerin, Y.Y., D.H. Hackos, and K.J. Swartz. 2000. A localized interaction surface for voltage-sensing domains on the pore domain of a K+ channel. Neuron. 25:411–423. [DOI] [PubMed] [Google Scholar]
- McLaughlin, S. 1973. Salicylates and phospholipid bilayer membranes. Nature. 243:234–236. [DOI] [PubMed] [Google Scholar]
- Neale, E.J., D.J.S. Elliott, M. Hunder, and A. Sivaprasadarao. 2003. Evidence for intersubunit interactions between S4 and S5 transmembrane segments of the Shaker potassium channel. J. Biol. Chem. 278:29079–29085. [DOI] [PubMed] [Google Scholar]
- Olcese, R., R. Latorre, L. Toro, and F. Bezanilla. 1997. Correlation between charge movement and ionic current during slow inactivation in Shaker K+ channels. J. Gen. Physiol. 110:579–589. [DOI] [PMC free article] [PubMed] [Google Scholar]
- Papazian, D.M., X.M. Shao, S.-A. Seoh, A.F. Mock, Y. Huang, and D.H. Wainstock. 1995. Electrostatic interactions of S4 voltage sensor in Shaker K+ channel. Neuron. 14:1293–1301. [DOI] [PubMed] [Google Scholar]
- Perozo, E., R. MacKinnon, F. Bezanilla, and E. Stefani. 1993. Gating currents from a nonconducting mutant reveal open-closed conformations in Shaker K+ channels. Neuron. 11:353–358. [DOI] [PubMed] [Google Scholar]
- Schoppa, N.E., K. McCormack, M.A. Tanouye, and F.J. Sigworth. 1992. The size of gating charge in wild-type and mutant Shaker potassium channels. Science. 255:1712–1715. [DOI] [PubMed] [Google Scholar]
- Seoh, S.A., D. Sigg, D.M. Papazian, and F. Bezanilla. 1996. Voltage-sensing residues in the S2 and S4 segments of the Shaker K+ channel. Neuron. 16:1159–1167. [DOI] [PubMed] [Google Scholar]
- Sigworth, F.J. 1994. Voltage gating of ion channels. Q. Rev. Biophys. 27:1–40. [DOI] [PubMed] [Google Scholar]
- Silverman, W.R., B. Roux, and D.M. Papazian. 2003. Structural basis of two-stage voltage-dependent activation in K+ channels. Proc. Natl. Acad. Sci. USA. 100:2935–2940. [DOI] [PMC free article] [PubMed] [Google Scholar]
- Starace, D.M., and F. Bezanilla. 2001. Histidine scanning mutagenesis of basic residues of the S4 segment of the Shaker K+ channel. J. Gen. Physiol. 117:469–490. [DOI] [PMC free article] [PubMed] [Google Scholar]
- Starace, D.M., E. Stefani, and F. Bezanilla. 1997. Voltage-dependent proton transport by the voltage sensor of the Shaker K+ channel. Neuron. 19:1319–1327. [DOI] [PubMed] [Google Scholar]
- Wang, M.H., S.P. Yusaf, D.J.S. Elliott, D. Wray, and A. Sivaprasadarao. 1999. Effect of cysteine substitutions on the topology of the S4 segment of the Shaker potassium channel: implications for molecular models of gating. J. Physiol. 521:315–326. [DOI] [PMC free article] [PubMed] [Google Scholar]
- Yang, N., A.L. George, and R. Horn. 1997. Probing the outer vestibule of a sodium channel voltage sensor. Biophys. J. 73:2260–2268. [DOI] [PMC free article] [PubMed] [Google Scholar]
- Yang, N., A.L. George, Jr., and R. Horn. 1996. Molecular basis of charge movement in voltage-gated sodium channels. Neuron. 16:113–122. [DOI] [PubMed] [Google Scholar]
- Yang, Y., and F.J. Sigworth. 2002. The Shaker mutation T449V rescues ionic currents of W434F K+ channels. Biophys. J. 82:234a. [Google Scholar]
- Yellen, G. 1998. The moving parts of voltage-gated ion channels. Q. Rev. Biophys. 31:239–295. [DOI] [PubMed] [Google Scholar]
- Yusaf, S.P., D. Wray, and A. Sivaprasadarao. 1996. Measurement of the movement of the S4 segment during the activation of a voltage-gated potassium channel. Pflugers Arch. 433:91–97. [DOI] [PubMed] [Google Scholar]