

Abstract
Calcium release through ryanodine receptors (RYR) activates calcium-dependent membrane conductances and plays an important role in excitation-contraction coupling in smooth muscle. The specific RYR isoforms associated with this release in smooth muscle, and the role of RYR-associated proteins such as FK506 binding proteins (FKBPs), has not been clearly established, however. FKBP12.6 proteins interact with RYR2 Ca2+ release channels and the absence of these proteins predictably alters the amplitude and kinetics of RYR2 unitary Ca2+ release events (Ca2+ sparks). To evaluate the role of specific RYR2 and FBKP12.6 proteins in Ca2+ release processes in smooth muscle, we compared spontaneous transient outward currents (STOCs), Ca2+ sparks, Ca2+-induced Ca2+ release, and Ca2+ waves in smooth muscle cells freshly isolated from wild-type, FKBP12.6−/−, and RYR3−/− mouse bladders. Consistent with a role of FKBP12.6 and RYR2 proteins in spontaneous Ca2+ sparks, we show that the frequency, amplitude, and kinetics of spontaneous, transient outward currents (STOCs) and spontaneous Ca2+ sparks are altered in FKBP12.6 deficient myocytes relative to wild-type and RYR3 null cells, which were not significantly different from each other. Ca2+ -induced Ca2+ release was similarly augmented in FKBP12.6−/−, but not in RYR3 null cells relative to wild-type. Finally, Ca2+ wave speed evoked by CICR was not different in RYR3 cells relative to control, indicating that these proteins are not necessary for normal Ca2+ wave propagation. The effect of FKBP12.6 deletion on the frequency, amplitude, and kinetics of spontaneous and evoked Ca2+ sparks in smooth muscle, and the finding of normal Ca2+ sparks and CICR in RYR3 null mice, indicate that Ca2+ release through RYR2 molecules contributes to the formation of spontaneous and evoked Ca2+ sparks, and associated STOCs, in smooth muscle.
Keywords: Ca2+ -induced Ca2+ release, ryanodine receptor, FKBP12.6, RYR3, knockout mouse
INTRODUCTION
RYR participate in Ca2+ mobilization in smooth muscle through the generation of spontaneous Ca2+ sparks (Nelson et al., 1995), calcium-induced calcium release (CICR) (Imaizumi et al., 1998; Collier et al., 2000), and stretch-induced calcium release (SICR) (Ji et al., 2002). Whether spontaneous, induced by ICa, or by stretch, Ca2+ sparks repeatedly arise from a few specialized regions within the myocyte, termed frequent discharge sites (Gordienko et al., 1998). As smooth muscle cells express multiple RYR genes (Marks et al., 1989; Hakamata et al., 1992; Ledbetter et al., 1994; Neylon et al., 1995), the ascription of discreet functional roles to these genes has been problematic (Kotlikoff, 2003).
To address the role of specific RYR isoforms in RYR-mediated Ca2+ release in smooth muscle, we have examined Ca2+ sparks and spontaneous, transient outward currents (STOCs), which are the local membrane response to Ca2+ sparks (Benham and Bolton, 1986; Nelson et al., 1995; Perez et al., 1999) in urinary bladder smooth muscle cells dissociated from RYR3 and FKBP12.6 null mice. RYR3 null mice demonstrate some impaired responses in neonatal skeletal muscles (Bertocchini et al., 1997), but do not display a prominent smooth muscle phenotype. It has been reported that RYR3 proteins are not involved in Ca2+ sparks or global Ca2+ release in vascular myocytes (but that RYR1 and RYR2 are required) (Coussin et al., 2000); however, recent studies of Ca2+ sparks and STOCs in cerebral myocytes from RYR3 null mice reported an increase in the frequency of Ca2+ sparks and a decreased myogenic tone in these mice (Lohn et al., 2001). Further complicating this analysis, Jiang et al. (2003) recently identified a highly expressed deletion splice variant in smooth muscle that acts as an inhibitory subunit.
As FKBP12.6 proteins are known to selectively associate with RYR2 channels (Timerman et al., 1996; Xin et al., 1999), and inactivation of the FKBP12.6 gene in mice results in a characteristic lengthening of the Ca2+ sparks in heart cells (Xin et al., 2002), we reasoned that FKBP12.6 null mice could be used to determine whether Ca2+ sparks in smooth muscle arise from RYR2 molecules. We report here that spontaneous Ca2+ sparks and STOCs in myocytes from FKBP12.6 null mice are markedly altered, whereas RYR3-deficient mice show no observable alterations in spark amplitude, kinetics, or frequency. Similar results were obtained for Ca2+ sparks evoked by voltage-clamp steps to activate ICa and CICR, confirming the essential similarity of these processes. Finally, Ca2+ wave speed was equivalent in WT and RYR3 null mice, suggesting that RYR3 molecules are not essential for wave propagation. These data strongly argue for a central functional role of RYR2 in smooth muscle Ca2+ release.
MATERIALS AND METHODS
Cell Preparation
Mice were anesthetized and killed in accordance with an approved laboratory animal protocol and bladder myocytes prepared as previously described (Ji et al., 2002). Briefly, the urinary bladder was dissected in ice-cold oxygenated Ca2+-free solution containing (mM): 80 Na-glutamate, 55 NaCl, 6 KCl, 2 MgCl2, 10 HEPES, and 10 glucose. The detrusor muscle was minced and incubated for 20 min at 37°C in dissociation solution containing 1 mg/ml dithioerythreitol, 1 mg/ml papain, and 1 mg/ml bovine serum albumin (Sigma-Aldrich), and the partially digested tissue was then transferred to a solution containing 1 mg/ml collagenase type II (Worthington Biochemical), 1 mg/ml bovine serum albumin, and 100 μM Ca2+. After incubation for 10 min, the digested tissue was washed and gently triturated in dissociation solution to yield single smooth muscle cells.
Patch-Clamp Recording
Membrane currents recorded at room temperature using whole-cell voltage clamp methods. To examine STOCs, cells were clamped at −20 mV, or stepped from −50 to −20 mV in 10-mV increments to examine voltage dependence. The intracellular solution was (mM): 130 KCl, 1.8 MgCl2, 1.0 Na2ATP, 0.05 CaCl2, 0.1 EGTA, pH 7.3, and the extracellular solution was: 137 NaCl, 5.4 KCl, 1.8 CaCl2, 1.0 MgCl2, 10 glucose, 10 HEPES, pH 7.4. Currents were filtered at 500 Hz and digitized at 2 kHz. In some cases voltage-clamped cells were dialyzed with 50 μM Fluo-4 and simultaneously scanned to measure Ca2+ sparks (see below). Current clamp measurements of membrane potential were performed by adjusting the holding current to produce membrane voltages of approximately −20 mV. The pipette solution was: 50 KCl, 80 KAsp, 1 MgCl2, 0.1 EGTA, 3 MgATP, and 10 HEPES (pH adjusted to 7.2 with KOH).
Measurement of Ca2+ Fluorescence
Myocytes were incubated with 10 μM Fluo-4 a.m. (Molecular Probes) for 10 min at room temperature and transferred into a recording chamber mounted on an inverted microscope (TE300; Nikon). Cells were allowed to adhere to the bottom of the recording chamber for 15 min and then perfused with extracellular solution (see above) for 40 min. For CICR experiments, 200 ms voltage steps from −70 to −20 mV were imposed and fluo-4 fluorescence recorded using a laser scanning confocal head (Radiance 2000, Bio-Rad Laboratories) coupled to an inverted microscope (TE-300; Nikon) equipped with a plan-apo 60x water immersion objective (1.2 n.a.; Nikon). Cells were excited with 488 nm light from a krypton/argon laser and linescan images recorded using Lasersharp software (Bio-Rad Laboratories).
Knockout Mice and RT-PCR
Mice homozygous for the inactivated RYR3 allele (Bertocchini et al., 1997) were obtained and maintained as heterozygotes, continually backcrossed onto a C57Bl/6 background. FKBP12.6 null mice (Xin et al., 2002), maintained on a C57Bl/6 background, were aged matched with RYR3 and wild-type (WT) C57Bl/6 mice. RT-PCR was performed by routine methods on detrusor muscle dissected free of other tissue layers, using the following specific primers (forward and reverse, respectively): RYR1-GCACACTGGTCAGGAGTCGTATG, GGGTGTAGCACAGGATTTAT; RYR2-GAATTCATCATGGATACTCTACC, GTCATGCACATTATCTTCTGCAT; RYR3-CCTGAGTTCACGACAAGCTACAG, TAGCTGCTTAAAGCTTTTCAAGC.
Data Analysis
Ca2+ sparks were analyzed using custom software written in Mathlab. To display the linescan images in a consistent way, F0 was obtained by averaging the fluorescence for each pixel (x dimension) for a period preceding activation of a Ca2+ spark, and the fluorescence of all pixels (F) was divided on a pixel by pixel basis by F0. Linescans were then displayed with a colormap ranging from 0.5 to 3 F/F0. Profiles were constructed by averaging the pixels bisecting a Ca2+ spark for each time point in the scan. Calcium sparks were fit to a function with six free parameters (F0, start time, rise time, peak F/F0, half time decay and final offset) using a Levenberg-Marquardt nonlinear least squares fitting routine. STOC decay kinetics were measured by fitting the current recordings to a single exponential decay function using Clampfit. STOC rise time and peak current were measured by hand from the raw current recordings. Results are expressed as mean ± SE where applicable. Data from the three groups (WT, RYR3−/−, and FKBP12.6−/−) were compared by one-way, repeated measures of ANOVA and significant differences between groups determined by the Student-Newman-Keuls (SNK) test for pairwise comparisons. Ca2+ wave speed was determined by constructing multiple pseudolinescans along the axis of Ca2+ wave propagation; for each repeatedly imaged pixel, the frame in which Ca2+ fluorescence increased from the previous average of 5 frames by 20% or greater were identified and a best fit line through these pixels was used to determine the slope (wave velocity). For each experiment three or four lines were used and the slopes averaged to obtain the Ca2+ wave speed. Measurements in WT and RYR3−/− myocytes were compared by the Student's t test.
RESULTS
STOCs in RYR3 and FKBP12.6 Null Urinary Bladder Myocytes
We first sought to confirm the presence of RYR isoforms in mouse urinary bladder smooth muscle, as studies had not reported the RYR expression pattern in the mouse. The detrusor muscle was carefully dissected free from the mucosal and fibrosal layers and RNA prepared for RT-PCR. As shown in Fig. 1 A, all three isoforms were detected in experiments using primers specific for the respective transcripts, whereas no bands were obtained in the absence of reverse transcriptase. The relative intensity of individual bands, even from the same pool of RNA, should not be interpreted quantitatively, as numerous cell types beside muscle are present at low levels within smooth muscle tissues and the efficiency of amplification may be quite variable. Moreover, such results are of limited use in the determination of functionally relevant isoforms and highlight the necessity of using other methods to resolve the specific isoform(s) contributing to smooth muscle Ca2+ release.
Figure 1.

Inactivation of FKBP12.6, but not RYR3, increases STOC frequency. (A) Expression of three RYR isoforms by rtPCR from the same pool of RNA purified from dissected detrusor muscle. For each primer set amplifications were conducted in the presence and absence of reverse transcriptase (RT). The final lane also shows a water control. (B) Voltage dependence of STOCs in detrusor myocytes from wild-type (WT), RYR3−/−, and FKBP12.6−/− mice. Cells were voltage clamped at potentials shown above and frequencies (below) determined from these experiments. (C) Mean STOC frequency from 15 WT, 12 RYR3−/−, and 13 FKBP12.6−/− cells (dissociated from at least four separate mice in each group) in which the voltage protocol shown in B was recorded. *** indicates significance at the 0.001 level for each individual comparison by ANOVA (Student-Newman-Keuls method). At all voltages the frequency of STOCs in FKBP12.6 null mice was significantly higher than each of the other two groups, whereas at each voltage WT and RYR3−/− mice were not significantly different.
Previous data indicate that FKBP12.6 plays an important role in regulating Ca2+ release in cardiac myocytes (Xin et al., 2002), a process that is mediated by RYR2. The selective interaction of FKBP12.6 with RYR2 (Timerman et al., 1996; Xin et al., 1999) allowed us to use FKBP12.6-deficient mice to determine whether Ca2+ release events were altered in a manner consistent with that observed for cardiac Ca2+ sparks (Xin et al., 2002). As STOCs are a convenient indicator of spontaneous SR Ca2+ release events (Walsh and Singer, 1983; Benham and Bolton, 1986; Trieschmann and Isenberg, 1989; Stehno-Bittel and Sturek, 1992; Nelson et al., 1995; Wang et al., 1997), we first measured the amplitude, frequency, and kinetics of STOCs in urinary bladder myocytes from wild-type, FKBP12.6−/−, and RYR3−/− mice. Cells were progressively depolarized from a holding potential of −50 mV to increase the frequency of spontaneous events. As shown in Fig. 1, the frequency and amplitude of spontaneous Ca2+ release events, reflected by the frequency of STOCs, was markedly higher in FKBP12.6 null mice than in WT or RYR3-deficient myocytes, at all potentials examined. In a series of experiments identical voltage-clamp protocols were imposed on cells dissociated from each group (cells were used from at least four separate mice in each group) and the STOC frequency determined at each voltage. At holding voltages from −60 to −20 mV (10-mV intervals) the STOC frequency was significantly higher in FKBP12.6 myocytes when compared with WT or RYR3 null mice (P < .001), which were not significantly different from each other. For example, at −50 mV the mean frequencies (STOCS/s) were 0.12 ± 0.041, 0.11 ± 0.035, and 0.51 ± 0.084 in WT, RYR3−/−, and FKBP12.6−/− cells, respectively (SEM). STOC frequency increased steeply as a function of voltage, but even at −20 mV the mean frequency of STOCs in FKBP12.6 null mice was more than twofold greater than in the other groups. Conversely, the mean frequency of STOCs in RYR3−/− mice was not significantly different from that of WT mice at any voltage.
Fig. 2 A also illustrates the dramatic increase in amplitude of STOCs recorded in FKBP12.6 null cells, relative to the cells from WT or RYR3−/− mice. At −20 mV, STOC amplitude in WT and RYR3 deficient cells was 83.5 ± 3.2 (n = 281) and 78.9 ± 5.4 pA (n = 136), respectively, whereas the mean amplitude in FKBP12.6 knockout cells was 249.1 ± 9.9 pA (n = 271, P < .001 by SNK). Fig. 2 shows typical STOCs from the three cell types superimposed, as well as the mean amplitudes and decay halftimes. The total duration of STOCs was also significantly increased in FKBP12.6 null myocytes compared with either WT or RYR3 null cells (685.5 ± 42.3 ms, n = 197 versus 154.5 ± 8.5 ms, n = 166, and 134.3 ± 11.2 ms, n = 92, for FBKP12.6−/−, WT, and RYR3−/−, respectively, P < 0.001 by SNK). The marked lengthening of STOC duration in FKBP12.6 deleted myocytes was not simply an effect of the larger mean amplitude of these events, as exponential fits to the STOC decay demonstrated a clear difference in the intrinsic decay time. Thus, as shown in Fig. 2 B, the halftime of decay for STOCs from FKBP12.6 null cells was significantly increased relative to the other two groups, which were not significantly different. Moreover, a plot of STOC amplitude versus half time of decay for all data (688 points), did not yield a significant correlation between these variables (unpublished data). These data suggest that the longer decays likely result from a prolonged local rise in [Ca2+]i near the maxiK channels. Thus, FKBP12.6 proteins play an important role in the regulation of STOCs in mouse bladder myocytes, consistent with the notion that these currents arise from a close coupling of sarcolemmal maxiK channels with RYR2 in the SR membrane, and likely reflect the underlying Ca2+ release kinetics and amplitude.
Figure 2.

STOC amplitude and decay are increased in FKBP12.6 null mice. (A) Typical STOCs recorded from WT (light gray), RYR3−/− (dark gray), and FKBP12.6−/− (black) myocytes. STOCs were recorded in cells voltage clamped at −20 mV. (B) Mean amplitude and halftime of decay for STOCs recorded at −20 mV. The number of events for amplitude and decay measurements is shown superimposed on the bar graph; data represent events recorded from more than 12 mice in each group. The decay phase of currents was fit to a single exponential function to determine decay kinetics. *** indicates significance at the P < 0.001 level for FKBP12.6 null mice versus the other two groups. Mean STOC amplitude and decay were not significantly different between WT and RYR3−/− mice.
FKBP12.6 Regulates Ca2+ Sparks in Smooth Muscle
To further test the assumption that altered STOCs reflect changes in the underlying Ca2+ release events, we measured Ca2+ sparks in voltage-clamped urinary bladder myocytes from WT, RYR3−/−, and FKBP12.6−/− mice. Linescan images were obtained to resolve the kinetics of these events and STOCs activated by the spontaneous Ca2+ sparks were simultaneously recorded. Fig. 3 shows typical recordings from the three cell types as well as a plot of normalized fluorescence intensity within the area of the spark. Ca2+ sparks in wild-type cells displayed typical kinetics, which extended beyond the duration of the related STOC, as has been previously reported (Nelson et al., 1995; ZhuGe et al., 2000). Events in RYR3 null cells were quite similar in frequency and amplitude as WT cells. In contrast, FKBP12.6−/− cells displayed a higher frequency of spontaneous Ca2+ sparks and these events were of higher amplitude and spread than in wild-type or RYR3 null myocytes, often forming propagated Ca2+ waves, with correspondingly large transient outward currents. Examples of individual Ca2+ sparks at higher time resolution, and a summary of the mean amplitude, spread (full width, half-maximum), and decay for the different cell types are shown in Fig. 4 . Ca2+ sparks from FKBP12.6−/− myocytes were significantly larger than WT or RYR3−/− cells, with a characteristically extended inactivation after the peak, consistent with the prominent effect observed in cardiac myocytes (Xin et al., 2002). Ca2+ sparks in FKBP12.6−/− cells were also more than twice as wide (FWHM) as in control and RYR3 null cells. Consistent with STOC data, Ca2+ sparks in RYR3−/− cells were not increased in amplitude, spread, or decay relative to WT.
Figure 3.
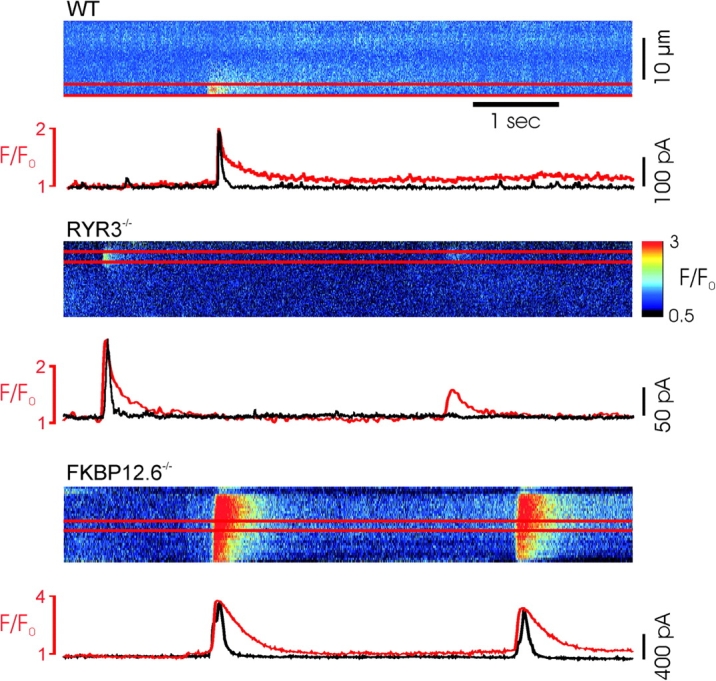
Simultaneous recordings of Ca2+ sparks and STOCs in WT, RYR3 and FKBP12.6 deficient myocytes. (A–C) Above, typical Ca2+ sparks recorded in confocal, linescan images from of Fluo-4–loaded cells. Below, profile of average fluorescence intensity from the area of the Ca2+ sparks (between red lines), shown superimposed on simultaneously recorded current (black), indicating STOCs activated by the Ca2+ sparks. Current traces are scaled to match the peak F/F0 in each experiment. Note the different scale in C. Ca2+ sparks were markedly larger and of longer duration in FKBP12.6 knockout cells. Color bar at right indicates the pseudo color representation of the minimum and maximum pixel values.
Figure 4.
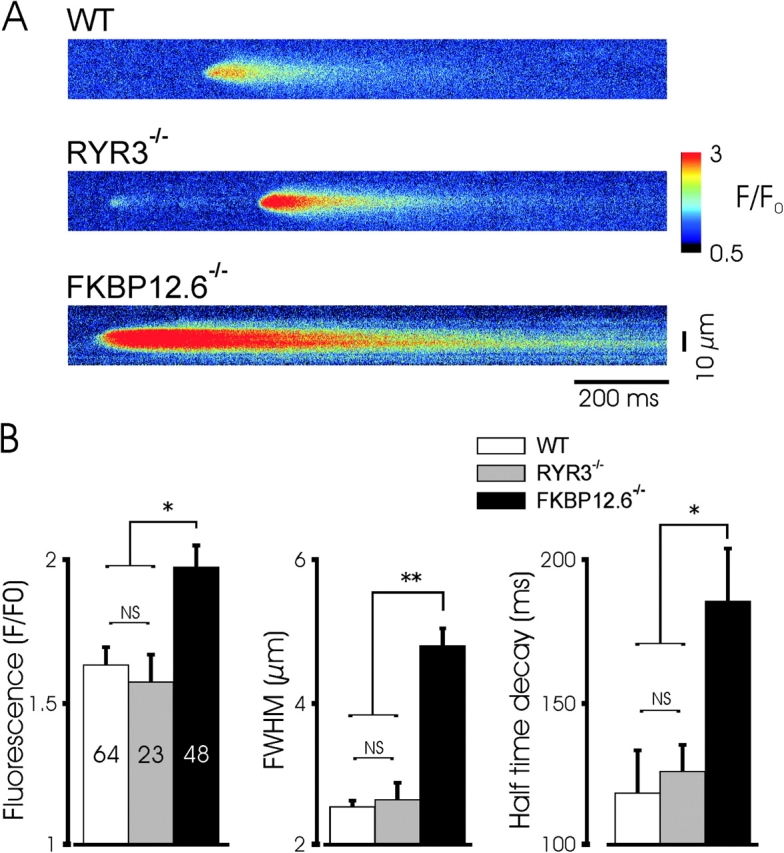
Augmented spontaneous Ca2+ sparks in FKBP12.6 null myocytes. (A) Confocal linescans of representative Ca2+ sparks from the three mouse groups indicate the increase in amplitude, spread, and decay time in FKBP12.6 null myocytes. The characteristic lengthened decay of Ca2+ sparks is seen in the example shown. (B) Mean properties of Ca2+ sparks from the three groups (23/16, 14/8, and 16/10 for the cells/mice used in WT, RYR3−/−, and FKBP12.6−/− mice, respectively). The amplitude (F/Fo), size (full width at half maximal amplitude, FWHM), and exponential decay half time were all significantly greater in FKBP12.6 null myocytes than in WT cells. * and ** indicate P < 0.05 and 0.01, respectively by ANOVA using the Student-Newman-Keuls test. Ca2+ sparks in FKBP12.6 null mice were of significantly greater amplitude and spread, and the decay time significantly increased, relative to the other two groups, which were not significantly different from each other.
Ryanodine receptor Ca2+ channels display stochastic gating behavior and consequently Ca2+ sparks vary substantially in frequency, amplitude, and duration. To further characterize the range of Ca2+ spark properties observed in the control and transgenic mice, frequency distributions were generated for F/F0, FWHM, and decay. The distribution of Ca2+ spark frequency, amplitude, size, and kinetics was markedly similar between control and RYR3 null mice, whereas sparks from FKBP12.6 null mice were markedly skewed toward more frequent, larger, and longer events. Thus, for example over 85% Ca2+ sparks from WT cells were of amplitude between 1.25–2 F/Fo, FWHM between 1.5–3 μm, and decay of between 0–250 ms; the corresponding ranges for FKBP12−/− cells were 1.25–2.75 F/Fo, 3.5–6.5 μm, and 50–350 ms.
FKBP12.6 Regulates Transient Hyperpolarizations
A major consequence of spontaneous Ca2+ release in smooth muscle is the regulation of membrane potential through the activation of calcium-dependent sarcolemmal ion channels (Nelson et al., 1995). Spontaneous Ca2+ sparks and hyperpolarizations have not been simultaneously measured, however. To examine the relationship between spontaneous changes in membrane potential and the Ca2+ sparks that generate them, and to determine whether the alterations in Ca2+ sparks associated with targeted deletion of FKBP12.6 result in altered spontaneous depolarization, we simultaneously measured Ca2+ sparks and myocytes membrane potential in current-clamped myocytes. To increase the frequency of spontaneous Ca2+ sparks, cells were clamped at current injection levels producing a membrane potential of approximately −20 mV. Typical recordings in WT and transgenic myocytes are shown in Fig. 5 . Ca2+ sparks produced prominent hyperpolarizations, as seen by voltage excursions temporally linked to Ca2+ release events. In WT cells, hyperpolarizations averaged ∼12 mV and were always observed with larger Ca2+ sparks. Consistent with voltage clamp experiments, Ca2+ sparks in FKBP12.6 null cells induced larger and longer hyperpolarizations than observed in WT cells. Peak hyperpolarizations were 12.7 ± 1.3 mV (n = 54) in WT, 9.9 ± 1.3 mV (n = 16) in RYRT3−/−, and 18.2 ± 2.0 mV (n = 37) in FKBP12.6 null cells, respectively (P < 0.05).
Figure 5.
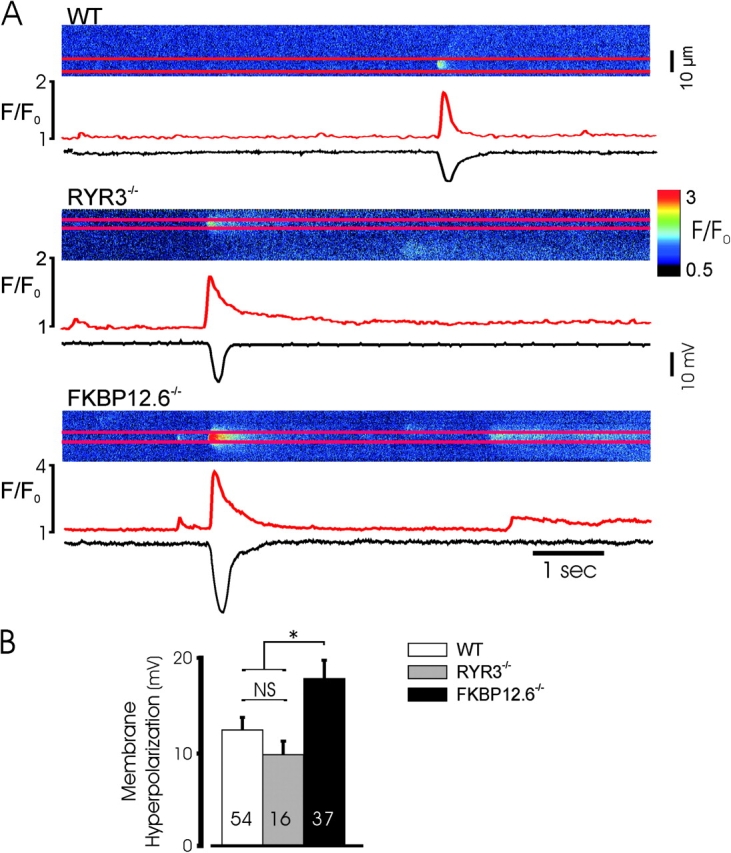
Augmented spontaneous hyperpolarizations in FKBP12.6 null mice. (A) Typical spontaneous Ca2+ sparks and associated hyperpolarizations in the three mouse genotypes recorded simultaneously. (B) Mean data from the indicated number of spontaneous hyperpolarizations recorded from a series of experiments as above (21/16, 13/8, and 11/8 different cells/mice in the three groups). * indicates P < 0.05 for hyperpolarizations in FKBP12.6 null cells relative to WT or RYR3 null mice, which were not significantly different.
Calcium-induced Calcium Release in Wild-type, RYR3−/−, and FKBP12.6−/− Myocytes
The processes that underlie spontaneous Ca2+ sparks are likely quite similar to those associated with CICR, as CICR often manifests as the triggering of individual Ca2+ sparks from the same sites from which spontaneous Ca2+ sparks originate (Imaizumi et al., 1998; Collier et al., 2000; Ji et al., 2002). If equivalent Ca2+ release mechanisms underlie both processes, deletion of specific components of the release system by gene targeting should result in similar alterations in both spontaneous and evoked Ca2+ sparks. To determine the phenotype of Ca2+ sparks evoked by CICR in FKBP12.6 and RYR3 null mice, voltage-clamped myocytes were depolarized from −70 to −30 mV to activate small ICa and isolated Ca2+ sparks, and simultaneously imaged by confocal scanning. As shown in Fig. 6 , Ca2+ sparks triggered by depolarizations to evoke ICa were increased in amplitude, duration, and size in FKBP12.6-deleted mice, whereas sparks triggered by ICa in RYR3 null myocytes were not significantly different from those of WT mice. Moreover, the degree of augmentation of Ca2+ release events triggered by ICa was roughly similar as that observed with spontaneous events (compare Figs. 4 B and 6 B). The extended tail of Ca2+ sparks, characteristic of FKBP12.6 null cardiac myocytes was a prominent feature of spontaneous and triggered events. Thus, CICR occurs normally in the absence of RYR3 proteins and triggered Ca2+ sparks appear to involve RYR2 gating, as indicated by the effect of FKBP12.6 deletion.
Figure 6.
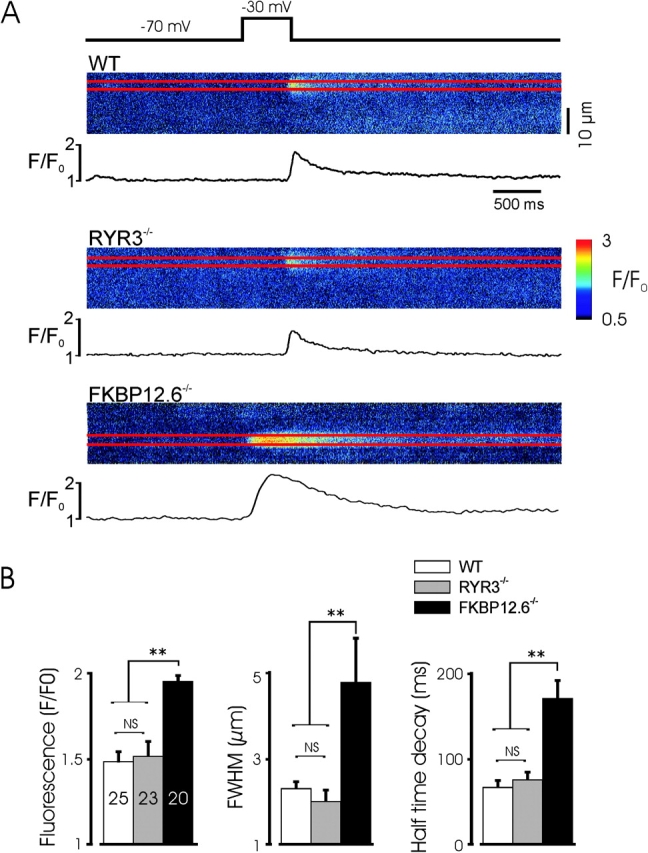
Augmented calcium-induced calcium release in FKBP12.6 null myocytes. (A) Representative linescan images of Ca2+ sparks evoked by a voltage-clamp depolarization to −30 mV to evoke single Ca2+ sparks. Note the extended decay (tail) of the Ca2+ spark in the FKBP12.6 myocyte and it's earlier occurrence after the voltage step. Linescan calibration bar is 10 μm. (B) Mean characteristics of the evoked Ca2+ sparks from the experiments shown. The amplitude, size, and decay of Ca2+ sparks in FKBP12.6 null myocytes was significantly greater than in the other two genotypes and no significant difference was observed between WT and RYR3 null mice. Experiments from five, four, and six WT, RYR3 null, and FKBP12.6 null mice, respectively. ** indicates P < 0.01 for FKBP12.6 null mice, versus the other two groups, and lack of significance of any other comparison.
While the lack of effect of RYR3 deletion on either spontaneous or CICR evoked Ca2+ sparks argues against a prominent role for these channels in unitary release events, it is possible that these more ubiquitously expressed channels play an essential role in the transmission of Ca2+ waves in smooth muscle cells after their local generation. To examine this question we first tested whether RYR3 null myocytes were capable of generating Ca2+ waves and then compared the speed of Ca2+ wave propagation in WT and RYR3 null myocytes. As shown in Fig. 7 , Ca2+ waves are propagated in voltage-clamped RYR3 null myocytes after induction of CICR by ramp depolarizations. Wave speed was determined in rapid confocal imaging experiments (20 or 30 frames/s) in a series of experiments in which myocytes were depolarized from −60 to −10 mV, by constructing pseudolinescans along three to four directions of wave propagation and averaging these values for a given experiment (Fig. 7 B). As shown in Fig. 7 C, a series of such experiments in WT and RYR3 null myocytes demonstrated equivalent Ca2+ wave speed, suggesting that RYR3 channels do not play an essential role in the propagation of Ca2+ waves in urinary bladder myocytes.
Figure 7.

Propagation of Ca2+ waves in RYR3 null myocytes. (A) Images from an experiment in which a voltage-clamped RYR3−/− myocyte was ramp depolarized from −60 to −10 mV to evoke CICR in the form of a Ca2+ wave. Dotted lines on initial image demonstrate the lines used to construct pseudolinescans to measure Ca2+ wave speed. (B) Pseudolinescan constructed from the experiment shown above (using the dotted line at top left); only the component of the linescan during which the Ca2+ wave is propagated is shown (cropped in time axis). The dotted line indicates the fit to the pseudolinescan to determine wave velocity. Pseudocolor calibration as in A. (C) Mean Ca2+ wave propagation speed in a series of RYR3−/− and WT myocytes in which a step depolarization from −60 to −10 mV evoked CICR and a propagated Ca2+ wave. n = 5 myocytes for each group (from five WT and four RYR3 null mice; results are not significant by Student's t analysis).
DISCUSSION
We show here that FKBP12.6 proteins play an important functional role in RYR-mediated Ca2+ release in urinary bladder smooth muscle, altering the characteristics of unitary Ca2+ release events and associated Ca2+-activated currents. FKBP12.6 proteins have been shown to selectively associate with cardiac (RYR2) SR Ca2+ channels (Timerman et al., 1996; Xin et al., 1999, 2002) and recent work from our laboratory has demonstrated a specific association between FKBP12.6 and RYR2, but not RYR1 or RYR3 proteins, in smooth muscle (Wang et al., 2004). These results imply an important functional role for RYR2 channels in Ca2+ spark generation, as the effect of FKBP12.6 deletion on the frequency, amplitude, and kinetics of potassium currents activated by Ca2+ sparks, the properties of spontaneous Ca2+ sparks, and the properties of Ca2+ sparks triggered by CICR in urinary bladder myocytes is consistent with the effect of this deletion on Ca2+ release in cardiac myocytes (Marx et al., 2000, 2001; Xin et al., 2002).
Conversely, the properties of STOCs and spontaneous or evoked Ca2+ sparks were equivalent in RYR3-deficient and WT myocytes. These results are in contrast to a previous report (Lohn et al., 2001), which demonstrated a marked increase in STOC frequency (10–50-fold increase over the voltage range reported here) in cerebral arterial myocytes. Consistent with that report, however, no alteration in the amplitude, width, or duration of Ca2+ sparks was observed in RYR3 null cells compared with WT. Thus, both our results and those of Lohn et al. (2001) argue against an essential role of RYR3 proteins in the generation of Ca2+ sparks in smooth muscle. Recent studies have indicated that RYR3 proteins may play a secondary, regulatory role associated with the formation of heterotetramers or dominant negative effects (Jiang et al., 2003). The marked difference in our findings and those of Lohn et al. (2001) regarding the frequency of STOCs may therefore result from different levels of expression of RYR3 splice variants in different smooth muscles, or may derive from a more general role of these channels in the regulation of [Ca2+]i unrelated to CICR. Thus, RYR3 deletion may alter the basal level of [Ca2+]i, resulting in an increase in Ca2+ spark frequency in some myocytes, without an alteration in the fundamental properties (e.g., channel open time) of the release event. While we are not able to definitively exclude a role of RYR1 in smooth muscle Ca2+ release, it seems quite unlikely that FKBP12.6 deletion results in an alteration in RYR1 function, as RYR1 proteins do not associate with FKBP12.6 proteins (Timerman et al., 1996). A functional role for RYR1 proteins in the formation of Ca2+ sparks and a role for RYR3 proteins in global Ca2+ release has been reported in vascular myocytes using antisense approaches in cultured cells (Coussin et al., 2000; Mironneau et al., 2001).
We also examined Ca2+ waves in RYR3 null myocytes, as these proteins could be involved in transmitting unitary Ca2+ release events through myocytes, although they do not appear to be primarily involved in the initial Ca2+ spark formation. Our finding of equivalent wave speed in both cell types indicates that these channels are not required for the propagation of locally generated events. This finding is also consistent with the observation of similar Ca2+ spark width in RYR3−/− and WT myocytes, as one would predict a decrease in the spread of Ca2+ sparks, which appear to consist of a continuum of events from locally confined Ca2+ sparks to globally propagated waves. While these findings do not exclude a role for RYR3 channels in the amplification of Ca2+ release events in smooth muscle cells, they establish the sufficiency of the other expressed isoforms to produce the major features of ryanodine receptor–mediated Ca2+ release and unitary release from discrete sites and amplification to generate propagated waves.
Finally, the equivalent effect of FKBP12.6 deletion on spontaneous Ca2+ sparks and on CICR evoked by depolarizations to activate ICa suggests a fundamental similarity between these processes and argues for a critical role of RYR2 proteins. Spontaneous Ca2+ release events occur repeatedly from the same frequent discharge sites (Nelson et al., 1995; Bolton and Gordienko, 1998) and CICR and SICR events occur from the same frequent discharge sites (Collier et al., 2000; Ji et al., 2002). Thus, our results suggest that these areas contain RYR2 and FKBP12.6 proteins; SR release is likely initiated by gating of these molecules, which display gating kinetics that shape the resulting Ca2+ sparks. Preferential initiation of Ca2+ sparks in a few subcellular locations could arise due to a association between the sarcolemma and SR containing RYR2, or due to specialized SR in which a higher concentration of these molecules are inserted. Further proof of this hypothesis will require the selective inactivation of RYR2 channels in smooth muscle.
Acknowledgments
The authors wish to thank Jason Wilson and Jane Lee for technical support.
Supported by NIH DK58795, HL45239, and DK065992.
Olaf S. Andersen served as editor.
Abbreviations used in this paper: CICR, calcium-induced calcium release; SICR, stretch-induced calcium release; STOC, spontaneous, transient outward current.
References
- Benham, C.D., and T.B. Bolton. 1986. Spontaneous transient outward currents in single visceral and vascular smooth muscle cells of the rabbit. J. Physiol. 381:385–406. [DOI] [PMC free article] [PubMed] [Google Scholar]
- Bertocchini, F., C.E. Ovitt, A. Conti, V. Barone, H.R. Scholer, R. Bottinelli, C. Reggiani, and V. Sorrentino. 1997. Requirement for the ryanodine receptor type 3 for efficient contraction in neonatal skeletal muscles. EMBO J. 16:6956–6963. [DOI] [PMC free article] [PubMed] [Google Scholar]
- Bolton, T.B., and D.V. Gordienko. 1998. Confocal imaging of calcium release events in single smooth muscle cells. Acta Physiol. Scand. 164:567–575. [DOI] [PubMed] [Google Scholar]
- Collier, M.L., G. Ji, Y. Wang, and M.I. Kotlikoff. 2000. Calcium-induced calcium release in smooth muscle: loose coupling between the action potential and calcium release. J. Gen. Physiol. 115:653–662. [DOI] [PMC free article] [PubMed] [Google Scholar]
- Coussin, F., N. Macrez, J.L. Morel, and J. Mironneau. 2000. Requirement of ryanodine receptor subtypes 1 and 2 for Ca2+-induced Ca2+ release in vascular myocytes. J. Biol. Chem. 275:9596–9603. [DOI] [PubMed] [Google Scholar]
- Gordienko, D.V., T.B. Bolton, and M.B. Cannell. 1998. Variability in spontaneous subcellular calcium release in guinea-pig ileum smooth muscle cells. J. Physiol. 507:707–720. [DOI] [PMC free article] [PubMed] [Google Scholar]
- Hakamata, Y., J. Nakai, H. Takeshima, and K. Imoto. 1992. Primary structure and distribution of a novel ryanodine receptor/calcium release channel from rabbit brain. FEBS Lett. 312:229–235. [DOI] [PubMed] [Google Scholar]
- Imaizumi, Y., Y. Torii, Y. Ohi, N. Nagano, K. Atsuki, H. Yamamura, K. Muraki, M. Watanabe, and T.B. Bolton. 1998. Ca2+ images and K+ current during depolarization in smooth muscle cells of the guinea-pig vas deferens and urinary bladder. J. Physiol. 510:705–719. [DOI] [PMC free article] [PubMed] [Google Scholar]
- Ji, G., R.J. Barsotti, M.E. Feldman, and M.I. Kotlikoff. 2002. Stretch-induced calcium release in smooth muscle. J. Gen. Physiol. 119:533–544. [DOI] [PMC free article] [PubMed] [Google Scholar]
- Jiang, D., B. Xiao, X. Li, and S.R. Chen. 2003. Smooth muscle tissues express a major dominant negative splice variant of the type 3 Ca2+ release channel (ryanodine receptor). J. Biol. Chem. 278:4763–4769. [DOI] [PubMed] [Google Scholar]
- Kotlikoff, M.I. 2003. Calcium-induced calcium release in smooth muscle: the case for loose coupling. Prog. Biophys. Mol. Biol. 83:171–191. [DOI] [PubMed] [Google Scholar]
- Ledbetter, M.W., J.K. Preiner, C.F. Louis, and J.R. Mickelson. 1994. Tissue distribution of ryanodine receptor isoforms and alleles determined by reverse transcription polymerase chain reaction. J. Biol. Chem. 269:31544–31551. [PubMed] [Google Scholar]
- Lohn, M., W. Jessner, M. Furstenau, M. Wellner, V. Sorrentino, H. Haller, F.C. Luft, and M. Gollasch. 2001. Regulation of calcium sparks and spontaneous transient outward currents by RyR3 in arterial vascular smooth muscle cells. Circ. Res. 89:1051–1057. [DOI] [PubMed] [Google Scholar]
- Marks, A.R., P. Tempst, K.S. Hwang, M.B. Taubman, M. Inui, C. Chadwick, S. Fleischer, and B. Nadal-Ginard. 1989. Molecular cloning and characterization of the ryanodine receptor/junctional channel complex cDNA from skeletal muscle sarcoplasmic reticulum. Proc. Natl. Acad. Sci. USA. 86:8683–8687. [DOI] [PMC free article] [PubMed] [Google Scholar]
- Marx, S.O., J. Gaburjakova, M. Gaburjakova, C. Henrikson, K. Ondrias, and A.R. Marks. 2001. Coupled gating between cardiac calcium release channels (ryanodine receptors). Circ. Res. 88:1151–1158. [DOI] [PubMed] [Google Scholar]
- Marx, S.O., S. Reiken, Y. Hisamatsu, T. Jayaraman, D. Burkhoff, N. Rosemblit, and A.R. Marks. 2000. PKA phosphorylation dissociates FKBP12.6 from the calcium release channel (ryanodine receptor): defective regulation in failing hearts. Cell. 101:365–376. [DOI] [PubMed] [Google Scholar]
- Mironneau, J., F. Coussin, L.H. Jeyakumar, S. Fleischer, C. Mironneau, and N. Macrez. 2001. Contribution of ryanodine receptor subtype 3 to Ca2+ responses in Ca2+-overloaded cultured rat portal vein myocytes. J. Biol. Chem. 276:11257–11264. [DOI] [PubMed] [Google Scholar]
- Nelson, M.T., H. Cheng, M. Rubart, L.F. Santana, A.D. Bonev, H.J. Knot, and W.J. Lederer. 1995. Relaxation of arterial smooth muscle by calcium sparks. Science. 270:633–637. [DOI] [PubMed] [Google Scholar]
- Neylon, C.B., S.M. Richards, M.A. Larsen, A. Agrotis, and A. Bobik. 1995. Multiple types of ryanodine receptor/Ca++ release channels are expressed in vascular smooth muscle. Biochem. Biophys. Res. Commun. 215:814–821. [DOI] [PubMed] [Google Scholar]
- Perez, G.J., A.D. Bonev, J.B. Patlak, and M.T. Nelson. 1999. Functional coupling of ryanodine receptors to KCa channels in smooth muscle cells from rat cerebral arteries. J. Gen. Physiol. 113:229–238. [DOI] [PMC free article] [PubMed] [Google Scholar]
- Stehno-Bittel, L., and M. Sturek. 1992. Spontaneous sarcoplasmic reticulum calcium release and extrusion from bovine, not porcine, coronary artery smooth muscle. J. Physiol. 451:49–78. [DOI] [PMC free article] [PubMed] [Google Scholar]
- Timerman, A.P., H. Onoue, H.B. Xin, S. Barg, J. Copello, G. Wiederrecht, and S. Fleischer. 1996. Selective binding of FKBP12.6 by the cardiac ryanodine receptor. J. Biol. Chem. 271:20385–20391. [DOI] [PubMed] [Google Scholar]
- Trieschmann, U., and G. Isenberg. 1989. Ca2+-activated K+ channels contribute to the resting potential of vascular myocytes. Ca2+-sensitivity is increased by intracellular Mg2+-ions. Pflugers Arch. 414:S183–S184. [DOI] [PubMed] [Google Scholar]
- Walsh, J.V., Jr., and J.J. Singer. 1983. Ca++-activated K+ channels in vertebrate smooth muscle cells. Cell Calcium. 4:321–330. [DOI] [PubMed] [Google Scholar]
- Wang, Y.X., B.K. Fleischmann, and M.I. Kotlikoff. 1997. Modulation of maxi-K+ channels by voltage-dependent Ca2+ channels and methacholine in single airway myocytes. Am. J. Physiol. 272:C1151–C1159. [DOI] [PubMed] [Google Scholar]
- Wang, Y.X., Y.M. Zheng, Q.B. Mei, Q.S. Wang, M.L. Collier, S. Fleischer, H.B. Xin, and M.I. Kotlikoff. 2004. FKBP12.6 and cADPR regulation of Ca2+ release in smooth muscle cells. Am. J. Physiol. Cell Physiol. 286:C538–C546. [DOI] [PubMed] [Google Scholar]
- Xin, H.B., K. Rogers, Y. Qi, T. Kanematsu, and S. Fleischer. 1999. Three amino acid residues determine selective binding of FK506-binding protein 12.6 to the cardiac ryanodine receptor. J. Biol. Chem. 274:15315–15319. [DOI] [PubMed] [Google Scholar]
- Xin, H.B., T. Senbonmatsu, D.S. Cheng, Y.X. Wang, J.A. Copello, G.J. Ji, M.L. Collier, K.Y. Deng, L.H. Jeyakumar, M.A. Magnuson, et al. 2002. Oestrogen protects FKBP12.6 null mice from cardiac hypertrophy. Nature. 416:334–338. [DOI] [PubMed] [Google Scholar]
- ZhuGe, R., K.E. Fogarty, R.A. Tuft, L.M. Lifshitz, K. Sayar, and J.V. Walsh, Jr. 2000. Dynamics of signaling between Ca2+ sparks and Ca2+-activated K+ channels studied with a novel image-based method for direct intracellular measurement of ryanodine receptor Ca2+ current. J. Gen. Physiol. 116:845–864. [DOI] [PMC free article] [PubMed] [Google Scholar]