

Abstract
Conformational changes of the human Na+/glucose cotransporter (hSGLT1) were studied using voltage-jump methods. The cotransporter was expressed in Xenopus laevis oocytes, and SGLT1 charge movements were measured in the micro- to millisecond time scale using the cut-open oocyte preparation and in the millisecond to second time scale using the two-electrode voltage clamp method. Simultaneous charge and fluorescence changes were studied using tetramethylrhodamine-6-maleimide-labeled hSGLT1 Q457C. In 100 mM external [Na+], depolarizing voltage steps evoked a charge movement that rose initially to a peak (with time constant τ = 0.17 ms) before decaying to steady state with two time constants (τ = 2–30 and 25–150 ms). The time to peak (0.9 ms) decreased with [Na+], and was not observed in 0 mM [Na+]. In absence of Na+, charge movement decayed monotonically to steady state with three time constants (0.2, 2, and 150 ms). Charge movement was accompanied by fluorescence changes with similar time courses, indicating that global conformational changes monitored by charge movement are reflected by local environmental changes at or near Q457C. Our results indicate that the major voltage-dependent step of the Na+/glucose transport cycle is the return of the empty carrier from inward to outward facing conformations. Finally, we observed subtle differences between time constants for charge movement and for optical changes, suggesting that optical recordings can be used to monitor local conformational changes that underlie the global conformational changes of cotransporters.
Keywords: Na+/glucose cotransport, presteady-state kinetics, charge movement, fluorescence, conformational changes
INTRODUCTION
The Na+/glucose cotransporter (SGLT1) is a member of a large family of proteins that uses the electrochemical potential gradient of Na+ to accumulate substrates into cells. Cotransport occurs by an alternating access mechanism via a series of conformational changes induced by substrate binding and membrane voltage (Parent et al., 1992; Hazama et al., 1997; Loo et al., 1998; Meinild et al., 2002). A simplified six-state kinetic model has been proposed to account for the kinetics of SGLT1 (Parent et al., 1992; Hazama et al., 1997; Loo et al., 1998; Mackenzie et al., 1998; Meinild et al., 2002). The transporter has six kinetic states consisting of the ligand-free (C1, C6), Na+-bound (C2, C5), and Na+- and sugar-bound (C3, C4) states at the external and internal membrane surfaces (see Fig. 15 A). Two external Na+ ions bind to the transporter before glucose, and the substrates are transported simultaneously, and glucose is released before Na+ on the inside. The model accounted not only for the steady-state kinetics of SGLT1, but also predicted presteady-state transients associated with the transporter in the absence of glucose (Parent et al., 1992; Loo et al., 1993). In the model, the protein is negatively charged (valence of −2), and membrane voltage is assumed to influence: (a) the reorientation of the ligand-free or empty carrier between inward and outward facing conformations, and (b) the binding of external Na+ to a site in the membrane electric field. Thus, there is a predicted charge movement associated with the voltage-dependent partial reactions C1↔C6 (empty carrier alternating between outward and inward facing conformations) and C2↔C1 (external Na+ binding/dissociation).
Figure 15.

Kinetic model for Na+/glucose cotransport (modified from Parent et al., 1992). (A) The transporter has six kinetic states consisting of the empty transporter C (states C1 and C6), the Na+-bound CNa2 (states C2 and C5) and the Na+- and sugar-bound SCNa2 (states C3 and C4) in the external and internal membrane surfaces. Two Na+ ions bind to the transporter before the sugar molecule. The shaded region represents the voltage-dependent steps: conformational change of the empty transporter between the external and internal membrane surfaces (C1↔C6); and Na+ binding/dissociation (C1↔C2). The simplifying assumption (for high external [Na+]) is that the two Na+ binding steps are lumped into one. The distribution of the conformations depends on membrane voltage. The transporter is in C2 at large hyperpolarizing voltages, and C6 at large depolarizing voltages. In the TMR6M-labeled Q457C, sugar transport is abolished, and since Na+ binding/dissociation at the cytoplasmic surface may be neglected because internal [Na+] is low and internal Na+ binding constant is high (see materials and methods), only the partial reactions in the shaded area are studied. (B) Seven-state model for presteady-state current. C1a and C1b represent intermediate states between C1 and C6, and C2a and C2b are the states with one Na+ bound. The rate constants (kij) for transition between two states (Ci→Cj) are defined by kij = kij o exp(−ɛijFV/RT), where kij o is a voltage-independent rate, ɛij is the voltage dependency, and F, R, and T have their usual physicochemical meanings. (C) A simplified five-state kinetic model for charge movement and the assumptions on the rate constants that were used for the simulation described in Fig. 16.
In 1993, we reported transporter capacitive currents, carrier currents, with stepped jumps in membrane voltage (in the presence of Na+ but absence of sugar), and hypothesized that most of these voltage-dependent transient currents (presteady-state currents or charge movement) are due to the voltage-sensitive conformational changes of the membrane protein (Loo et al., 1993). These presteady-state currents have been used to gain insight into the partial reactions of cotransporters (for reviews see Loo et al., 2002; Forster et al., 2002), and to estimate the total number of transporters in the cell membrane (Zampighi et al., 1995). The origin of the cotransporter transients, however, has been questioned, and it has been proposed that the currents are due solely to ion binding to sites within the membrane electric field (e.g., Su et al., 1996).
By combining presteady-state measurements with optical techniques using extrinsic fluorescent probes covalently bound to engineered cysteine residues in the transporter (Loo et al., 1998; Meinild et al., 2002), we have established that the presteady-state currents of SGLT1 are due to Na+ binding/dissociation and transitions of the empty transporter between outward- and inward-facing conformations (Loo et al., 1998; Meinild et al., 2002). We have also shown that the fluorescent changes in the tetramethylrhodamine-6-maleimide (TMR6M)–labeled hSGLT1 mutant Q457C reports local conformational changes (at Cysteine 457) associated with ligand binding (Na+ and sugar) and voltage jumps.
In this study using both charge and fluorescence measurements, we have set out to extend the voltage- and Na+-induced perturbations in the conformation of SGLT1 over a wider time scale, ranging from microseconds to seconds. Our previous studies have examined the conformational changes of SGLT1 with time constants in the range of 3–35 ms. The motivations for performing charge and fluorescence measurements at an expanded time scale were our simulations on the six-state kinetic model for SGLT1, which predicted a fast rising phase of charge movement with depolarizing potentials (Parent et al., 1992; Hazama et al., 1997), and our observation that steady-state conditions are not reached at the end of our standard 100-ms voltage pulses.
The concurrent employment of an independent optical method to monitor voltage-induced conformational changes in the transporter overcomes some of the inherent limitations of charge measurements alone. Our results demonstrate that there are at least three components of voltage-induced perturbations in hSGLT1 with time constants ranging from 0.2 to 200 ms. The slow (τ = 30–200 ms) and medium (3–20 ms) components contribute equally to total charge transfer, while the fast (0.2–1.5 ms) component contributes the most to total fluorescence changes. Under Na+-free conditions, all three components are still evident, but the time constants decrease in magnitude. We conclude that most of the SGLT1 charge movement is due to the reorientation of intrinsic charge in the membrane protein and that there are at least two intermediate conformations (C1a and C1b) between the two final states C1 and C6 in the external and internal membrane surfaces (C1↔C1a↔C1b↔C6). External Na+ modulates charge transfer between C1 and C6 by increasing the occupancy of the Na+-bound state (C2 = C1Na2) and reducing the occupancies of C1, C1a, C1b, and C6. This suggests that C1 is meta-stable; the highest probability states are C2 in the presence of Na+, and C6 in the absence of Na+. The implication is that after the Na+/glucose transport step, the high external Na+ concentration shifts the transporter from the cytoplasm (C6) into the state with the highest affinity for glucose (C2) to initiate another cycle of Na+/glucose transport across the membrane. Our results also suggest that the voltage sensitivity of Na+/glucose cotransport resides mainly in return of the empty carrier from the inward- to outward-facing conformation (C6 to C1).
MATERIALS AND METHODS
Strategy
Our general strategy was to express SGLTs in Xenopus laevis oocytes and to record changes in transporter currents and extrinsic fluorescence over a wide time scale (microsecond to seconds) after rapid jumps in the membrane potential. In the absence of sugar, the transient transporter currents are capacitive, due to a reorientation of the protein charge in the membrane electric field, and/or the binding and dissociation of external Na+ in a well within the membrane field. To examine the role of Na+, external [Na+] was varied between 0 and 100 mM by isomolar replacement of NaCl with cholineCl. Na+ binding and dissociation at the cytoplasmic face of the protein may be neglected as the cytoplasmic concentration is either low (∼10 mM in intact oocytes) or absent in the cut-open oocyte preparation (see below) and the internal Na+ binding affinity is low (Eskandari et al., 1999; Sauer et al., 2000; Quick et al., 2003).
The two-electrode voltage clamp, with a settling time 0.6–1.0 ms (Loo et al., 1993), was used to record transients in the millisecond to second range. To examine kinetic events in the microsecond to millisecond range, the cut-open oocyte preparation, with a settling time of 80 μs (Taglialatela et al., 1992; Stefani and Bezanilla, 1998) was used. The wild-type human SGLT1 (hSGLT1) was used to record transporter charge movements, and the hSGLT1 mutant transporter, Q457C, was used to correlate fluorescence and charge movement (Loo et al., 1998; Meinild et al., 2002). Previously, it has been shown that the mutant protein is able to transport sugar, but sugar transport is abolished on alkylation of Cys457 with methanethiosulfonate reagents, or after labeling by TMR6M (Loo et al., 1998; Meinild et al., 2002). Since the TMR6M-labeled mutant transporter can bind Na+ and sugar, it can be used for studying the conformational changes associated with ligand binding and voltage jumps. The human isoform was used because the distribution of the protein between outside-facing and inside-facing conformations was at a midpoint at the normal resting potential (holding potential) of the oocyte, −50 mV. This means that over the practical range of voltage jumps that can be used with oocytes, −150 to +50 mV, the full charge movement may be recorded by hyperpolarizing the membrane to −150 mV and depolarizing to +50 mV. It should also be borne in mind that the midpoint V0.5 for SGLT1 shifts by ∼100 mV per 10-fold reduction in external [Na+] (Loo et al., 1993; Hazama et al., 1997; Quick et al., 2001), and this means that it is not feasible to obtain the full charge vs. voltage curve at [Na+] < 10 mM.
Preparation and Maintenance of Oocytes
Mature Xenopus laevis oocytes were isolated, defolliculated, injected with human SGLT1 or human SGLT1 Q457C cRNA (Loo et al., 1993, 1998). hSGLT1 Q457C was labeled with 200 μM TMR6M (Loo et al., 1998).
Combined Electrophysiological and Fluorescence Experiments
Electrophysiological and fluorescence experiments were performed simultaneously, using either two-electrode (Loo et al., 1998; Meinild et al., 2001) or cut-open oocyte voltage clamp fluorometry (Cha and Bezanilla, 1997, 1998). The current records were the averages of 3–4 sweeps, and the fluorescence records were averages of either 4 or 20 sweeps. Interpulse interval was ≥1 s. Records were filtered at 2 kHz, 500 Hz, or 50 Hz, depending on the sampling interval (5 μs to 750 μs per sample). In two-electrode voltage clamp experiments, the bath contained 100 mM NaCl buffer (in mM, 100 NaCl, 2 KCl, 1 CaCl2, 1 MgCl2, 10 HEPES, pH 7.4). In cut-open oocyte experiments, external and guard solutions contained (in mM) 100 Na-methanesulfonate, 1 CaCl2, 10 HEPES (pH 7.3), and internal solution contained (in mM) 100 K-methanesulfonate, 1 EGTA, 10 HEPES (pH 7.3). The Na+ concentration was varied by equimolar replacement of Na+ with choline. Fluorescence data have been corrected for rundown (Meinild et al., 2002). All experiments were performed at room temperature (20–23°C).
Data Analysis
Isolation of Presteady-state Currents.
In response to a voltage pulse, the total membrane current consisted of the membrane bilayer capacitive transient, the presteady-state currents of SGLT1, and the steady-state current. Using 100-ms voltage pulses, we have reported that the relaxation of the presteady-state current exhibited a single time constant between 2 and 30 ms (Loo et al., 1993; Hazama et al., 1997; Quick et al., 2001; Meinild et al., 2002). In pilot studies, we found additional components with time constants between 0.2–2 and 35–160 ms. For clarity of presentation, we operationally defined the fast, medium, and slow components (for charge and fluorescence) as those with time constants between 0.2–2, 2–20, and 30–160 ms, respectively. Since at each voltage step their time constants differed by an order of magnitude, the components were estimated separately using test voltage pulses of different durations.
Slow Component.
The time constant of the slow component was estimated from the current relaxations after the medium component has decayed. The early phase was obtained by extrapolation of the exponential fit to the peak of the capacitive transient, typically two sample points after onset of the voltage pulse. The slow charge was obtained from the integral of the slow component of presteady-state current.
Medium Component.
The medium component was estimated using 100-ms voltage pulses after subtraction for the slow component (above) and the steady-state current. The compensated current was fitted to the function
 |
where Icmexp(−t/τcm) is, to a first approximation, the capacitive current. The charge was obtained from the integral of the medium component.
Phlorizin Subtraction.
An alternative procedure for isolating the SGLT1 transient was to use phlorizin subtraction (Loo et al., 1993; Hazama et al., 1997; Meinild et al., 2001). The transients were obtained by pointwise-subtraction of the current relaxations in 100 μM external phlorizin (in the presence of Na+) from those obtained in the absence of phlorizin (in Na+). In Na+-free situations (e.g., Fig. 5, C and D), they were obtained by subtraction of the current relaxations in 100 μM phlorizin and 100 mM Na+ from the current relaxations in 0 mM Na+. The currents isolated by phlorizin subtraction were the total presteady-state currents. Subtraction could not be used with the TMR6M Q457C because of the low phlorizin affinity (Ki ≈ 100 μM for TMR6M Q457C vs. 200 nM for hSGLT1).
Figure 5.

Rising phase of charge movement. The experiment was performed on hSGLT1 using a two-electrode voltage clamp. Current records were obtained by phlorizin subtraction. Vh was −90 mV, data were digitized at 8 μs per sample, and pulse was 6 ms. (A) Presteady-state currents in 100 mM [Na+]o. (B) Dependence of the rising phase on [Na+]o. The current records were obtained at Vt = +50 mV in 100, 25, and 12 mM [Na+]o. (C) τ–V relations for the medium component in 100 and 0 mM [Na+]o. Data were obtained from one oocyte. The open symbols were obtained from the OFF response and represent the mean of 10 values (with test potential varying between +50 and −150 mV). (D) Q–V relations for the medium component in 100 and 0 mM [Na+]o. Q was obtained from the mean of the ON and OFF charges using 100-ms pulses in 100 mM Na+ and 30-ms pulses for 0 mM Na+. The curve (for 100 mM Na+) was drawn using the Boltzmann relation with Qmax = −20.3 ± 0.4 nC, zδ = 1.1 ± 0.1, and V0.5 = −47 ± 1 mV.
Cut-open Oocyte Experiments.
The background leak currents and the oocyte bilayer capacitive transients were first compensated with the voltage clamp amplifier (CA-1; Dagan Corporation). The P/4 protocol was used to isolate the presteady-state currents (Bezanilla and Armstrong, 1977; Bezanilla and Stefani, 1998) using a subtracting holding potential (Vshp) of −150 mV where there was negligible SGLT1 charge movement.1
Fitting of Q–V and ΔF–V Relations.
The charge vs. voltage (Q–Vm) relations could, to a first approximation, be fitted to a single Boltzmann function (Loo et al., 1993; Hazama et al., 1997):
 |
where Qmax = Qdep − Qhyp, Qdep and Qhyp are the Q (absolute value) at depolarizing and hyperpolarizing limits, Vm is membrane potential, F is the Faraday, R is the gas constant, T is the absolute temperature, V0.5 is the membrane potential at 50% Qmax (or the midpoint voltage), z is apparent valence of the movable charge, and δ is the fraction of the membrane electric field traversed by the charge. zδ is the steepness factor for the dependence of Q on voltage. The Boltzmann relation was also used to fit the dependence of the change of fluorescence intensity (ΔF) on membrane voltage (Loo et al., 1998; Meinild et al., 2002). The parameters obtained were the maximal fluorescence intensity change (ΔFmax), the membrane voltage at 50% ΔFmax (V0.5), and the product (zδ) of the apparent valence of the fluorescence voltage sensor (z) and the dielectric distance (δ).
Fits of data to equations were performed using either Sigmaplot 2002 (SPSS) or Clampfit 8.1 (Axon Instruments). Unless otherwise noted, statistics were obtained from the error of the fit. While data are shown for representative experiments, all experiments were performed on at least three oocytes from different batches.
RESULTS
Part I. Charge Movement
The first part describes the time course of voltage-induced capacitance currents (the presteady-state current) through SGLT1. The study extends our previous experiments to encompass sub-millisecond and second time domains. Charge measurements are presented for wild-type human SGLT1 and the TMR6M-labeled hSGLT1 mutant Q457C. The latter was used to monitor the conformational changes of the transporter by fluorescence measurements.
Slow and Medium Charge Movements in hSGLT1.
The raw current records from an oocyte expressing hSGLT1 performed with the two-electrode voltage clamp are shown in Fig. 1 A. The membrane potential was held at −50 mV (Vh) and stepped to a test value (Vt, from +50 to −150 mV, and representative traces are shown) for 100 ms before returning to Vh. The current contained (a) an initial spike, with a time constant of 0.7–1.0 ms; (b) hSGLT1 presteady-state currents, which decayed to an apparent steady state with time constants of 3–25 ms; and (c) the steady-state current, comprising of the background current of the oocyte and a hSGLT1-mediated Na+-uncoupled (or leak) current due to the uniporter function of the transporter in the absence of sugar (Umbach et al., 1990; Loo et al., 1999). Only the initial spike and the background currents were observed in noninjected oocytes. Inspection of the recordings on oocytes with high levels of expression reveals that the steady state has not been reached at 100 ms, especially in the hyperpolarizing direction (Fig. 2 A). We therefore applied voltage pulses of up to seconds in duration.
Figure 1.

Time course of the raw or total currents (capacitive and hSGLT1 presteady-state currents) of an oocyte expressing hSGLT1. The experiment was performed using a two-electrode voltage clamp, and all data were obtained from a single oocyte. Membrane potential was held at −50 mV (Vh) and then stepped to a series of test values Vt (from +50 to −150 mV in 20-mV decrements; representative traces are shown for +50, −10, −50, −90, and −150 mV) before returning to Vh. The pulse duration was 100 ms in A and 500 ms in B, and the currents, which are the average of three sweeps, have been filtered at 500 Hz (A) and 50 Hz (B). An upwards deflection of the current trace represents an outward current.
Figure 2.

Medium and slow components of the presteady-state currents of hSGLT1 (ON response). Shown are the current records for the ON pulse from Vh (−50 mV) to Vt +50, −10, −50, −90, and −150 mV for the 100-ms (A) and the 500-ms (B) duration pulses. The data were from the same oocyte as Fig. 1. To isolate the slow charge, the steady-state current was removed, and the transient current (for the 500 ms pulses) was fitted to a single exponential function. The fit was restricted to the region between 5τmed (τmed ≈ 3–20 ms) and 500 ms. The starting point was 25 ms at +50 mV, 60 ms at −10 mV, and 100 ms at Vt more negative than −90 mV. The fit was extrapolated to the peak of the total current trace (dashed lines in A and B), typically two data samples after onset of the voltage pulse (to 0.2 ms in A). The isolated slow charge is shown in D. To obtain the medium component, the slow component (dashed line) was subtracted from the 100-ms current records (A). The difference was fitted to I(t) = Icm exp(−t/τcm) + Imed exp(−t/τmed). Panel C shows the medium charge obtained after subtraction of the membrane capacitance (Icm exp(−t/τcm)). For clarity, the current trace at −50 mV (Vh) has been omitted in D.
The raw current records (from the same oocyte as Fig. 1 A) for a 500-ms pulse are shown in Fig. 1 B. Compared with the 100-ms pulse, it was necessary to increase the sampling interval from 0.1 to 0.5 ms and to filter the current records at 50 Hz (vs. 500 Hz for the 100-ms pulse). This resulted in a filtering or rounding off of the 3–25 ms (medium) component of presteady-state current (Fig. 1 B). Steady state was reached by 500 ms.
The procedure for isolating the components of the presteady-state current is illustrated in Fig. 2 for the ON response. The fit of the slow component began after a period of five times the relaxation time constant of the medium component (τmed). At 5τmed (typically ≈100 ms), the medium component has decayed 99% (from the initial value), and the remaining slow relaxations were well described by a single exponential function (Fig. 2 B). Fig. 2 D shows the slow component extrapolated to the beginning of the pulse.
The medium component was obtained from the 100-ms current records by first subtracting the slow component (dashed line in Fig. 2 A) from the total current, and then subtracting the membrane capacitive currents (Fig. 2 C).
Fig. 3 shows the OFF currents when the test potential was returned to Vh. The slow relaxations (between 100 and 500 ms) could be fitted by a single exponential function (Fig. 3 B). Fig. 3 (C and D) shows the isolated slow and medium components. All charge movements associated with hSGLT1 in the presence of Na+ (the medium and slow components and the rising phase described in Fig. 6 below) were blocked by 100 μM phlorizin, the specific high-affinity competitive inhibitor of SGLT1 (unpublished data).
Figure 3.

Medium and slow components of the presteady-state currents of hSGLT1 (OFF response). Shown are the current records for the OFF pulse when membrane potential was stepped from the test potential (+50, −10, −50, −90, and −150 mV) back to the holding (−50 mV) for the 100 ms (A) and the 500 ms (B) duration pulses. The data were from the same oocyte as Fig. 1, and the protocol for isolation of the medium (C) and slow components of charge movement (D) is as described in Fig. 2. As τmed for OFF was independent of test voltage (τmed = 15 ms, see Fig. 4 A), the initial point for the fit (Fig. 3 B) was 96 ms for all the OFF pulses.
Figure 6.

The rising phase of charge movement in hSGLT1-Q457C. The experiment was performed on TMR6M-labeled Q457C using the cut-open oocyte voltage clamp. The currents have been compensated for membrane capacitance and background current using the P/4 protocol with a Vshp of −150 mV. External and guard solutions contained 100 mM Na-methanesulfonate and internal solution contained 100 K-methanesulfonate. Data was digitized at 5 μs per sample. Vh was −80 mV. The Vt values were +50 and −150 mV. (A) Presteady-state currents in 100 mM [Na+]o. Current trace at +50 mV was averaged from 10 sweeps. The other records were single sweeps. (B) Presteady-state currents 0 [Na+]o. The records were single sweeps. Current and time scales are the same for A and B. (C) τ–V relations for fast charge. Data is from the experiment of A and B (Vh = −80 mV). The filled symbols are from the ON, and open symbols from the OFF response. The circles (•) are obtained from the decay of the presteady-state current with hyperpolarizing pulses in 100 mM [Na+]o. The triangles (▴) were from the rising phase of the presteady-state current with depolarizing pulses and were obtained using a two exponential fit with the constraint that the time constant of decay was the same as those obtained from the same oocyte with 100-ms pulses. The squares (▪) are the time constants of current decay in the absence of Na+.
The voltage dependence of the time constant (τ) for the ON transient was qualitatively similar for the medium and slow components (Figs. 4 A). In the hyperpolarizing direction, τ (≈20 ms for the medium and ≈100 ms for the slow component) was relatively independent of voltage. In the depolarizing direction, τ decreased as the test voltage became more positive, to 3 and 30 ms (at +50 mV) for the medium and slow components, respectively. The time constant for the OFF transients when membrane was stepped from the test voltage (Vt) back to Vh was independent of Vt. In this and subsequent figures, for simplicity, the OFF time constant is shown at Vm −50 mV (open symbols in Fig. 4 A). The OFF time constants were 15 ± 1 ms (n = 10) and 99 ± 4 ms (n = 10) for the medium and slow components, respectively.
Figure 4.

Kinetics of charge movement of hSGLT1: voltage dependence of the medium and slow components. Data was from the experiment of Fig. 1. (A) τ–V relations. The filled symbols represent the ON where membrane potential was stepped from Vh (−50 mV) to different test potentials (Vt). The open symbols represent the time constant of the relaxation of the OFF where membrane potential was returned from Vt to Vh (−50 mV). Error bars are standard errors (SE) of the fit when the SE exceeds the size of the symbol. The OFF responses were independent of the previous test potential (Vt), and open symbols represent the mean of 10 values with Vt varying between +50 and −150 mV. (B) Q–V relations for the medium charge. At each Vm, the medium charge (Q) was obtained as the time integral of the medium presteady-state current for the ON (circles) and OFF (squares) responses. The curve is the fit of the mean of the medium ON and OFF charge to the Boltzmann relation with Qmax = 8.7 ± 0.2 nC, zδ = 1.0 ± 0.1, and V0.5 = −33 ± 1 nC. (C) Q–V rela tions for slow charge. Slow charge (Q) was obtained from the time integral of the slow presteady-state current for the ON and OFF responses. The curve is the fit of the mean of the slow ON and OFF charge to the Boltzmann relation with Qmax = 7.2 ± 0.1 nC, zδ = 1.0 ± 0.1, and V0.5 = −67 ± 1 nC. (D) Q–V relations for total charge. Total charge is the sum of the medium and slow components (described in B and C). Filled and open symbols represent the total ON and OFF, respectively. The smooth curve is the fit of the total OFF charge to the Boltzmann relation with Qmax = 17.2 ± 0.3 nC, zδ = 0.9 ± 0.1, and V0.5 = −44 ± 1 mV.
The medium (Qmed) and slow charges (Qslow) were obtained by integration of the corresponding presteady-state currents for the ON and OFF responses (Fig. 2, C and D; Fig. 3, C and D). The charge vs. voltage relations (Q–V) for the medium and slow components were sigmoidal, and the ON and OFF charges were approximately equal at each test voltage (Fig. 4, B and C). The curve in Fig. 4 B was obtained from the fit of the mean of the ON and OFF charge movements for the medium component (at each Vt) to a Boltzmann relation with Qmax = 8.7 nC, zδ = 1.0, and V0.5 = −33 mV. The corresponding result for the slow component is presented in Fig. 4 C, with the curve described by the parameters Qmax = 7.2 nC, zδ = 1.0, and V0.5 = −67 mV.
The medium and slow charges (Qmed and Qslow) were added to obtain the total charge (Fig. 4 D). In the hyperpolarizing direction, the total ON charge was equal in magnitude but opposite in sign to the total OFF charge. At the two most positive test voltages applied, +50 and +30 mV, the ON charge was slightly less than the OFF charge. The difference suggests that the kinetics of the ON response might be too fast to be accurately measured using the two-electrode voltage clamp (see Fig. 7). The curve in Fig. 4 D was the fit of the OFF charge to the Boltzmann relation with zδ = 1.0 and V0.5 = −44 mV.
Figure 7.
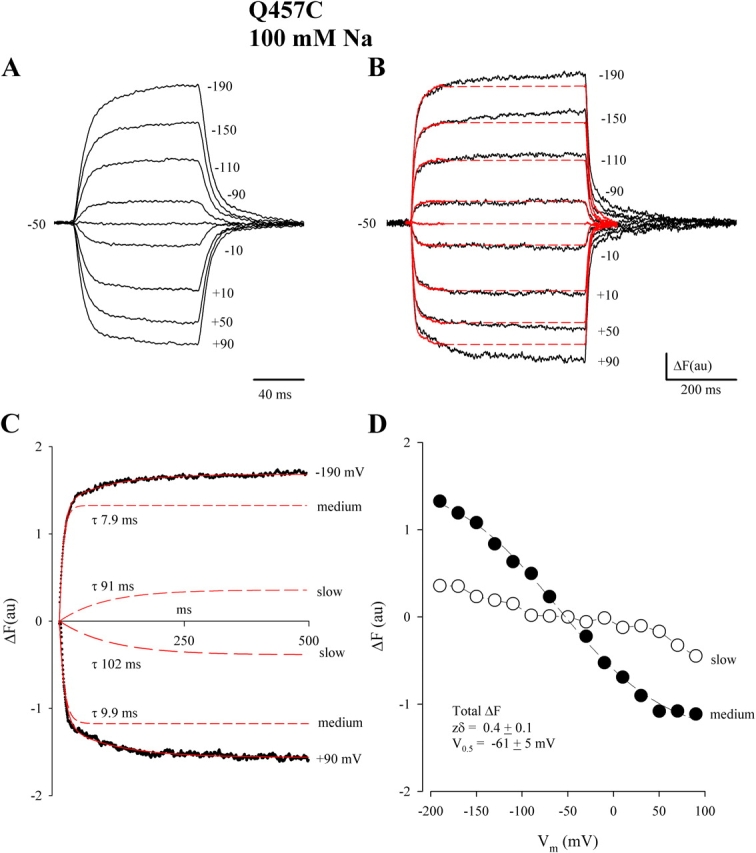
Slow (ΔFslow) and medium (ΔFmed) components of ΔF. The experiment was performed using a two-electrode voltage clamp on a TMR6M-labeled Q457C. Bath solution contained 100 mM Na+. (A) Time course of ΔF for a 100-ms pulse. Vh was −50 mV and the Vt values are indicated next to the traces. (B) The corresponding ΔF records for a 500-ms pulse, and superimposition of the short and long (100- and 500-ms) pulses. The traces from the 100-ms pulses (from A) have been split to overlap with the 500-ms pulses at the onset of the ON and OFF. The dotted lines indicate the ΔF at 100 ms. (C) ΔFmed and ΔFslow. The time course of total ΔF (shown for Vt of +90 and −190 mV) was fitted (smooth curves) to two exponential components: ΔF = ΔFmed (1 − exp(−t/τmed)) + ΔFslow (1 − exp(−t/τslow)), where ΔFmed, ΔFslow, τmed, and τslow are the amplitudes and time constants of the medium and slow components. Parameters obtained from the fit were as follows: at +90 mV, ΔFmed = −1.17 au, τmed = 9.9 ms, ΔFslow = −0.38 au, τslow = 102 ms; at −190 mV, ΔFmed = −1.33 au, τmed = 7.9 ms, ΔFslow = −0.36 au, τslow = 91 ms. Dashed curves represent the ΔFmed and ΔFslow components (from the fit) with the time constants next to the traces. The τ's were independent of Vt (between +50 and −150 mV). τmed was 7.9 ms and 8.5 ms (n = 10) for the ON and OFF responses, respectively. τslow ranged between 60 and 150 ms with a mean of 92 ms for the ON, and 138 ms for the OFF. (D) ΔFmed–V (filled circles) and ΔFslow (open circles) relations. ΔF (at each Vt) was obtained from fitting the relaxation of ΔF to two exponential components (as in C). The ΔFmed–V and total ΔF–V relations (sum of ΔFmed and ΔFslow) were fitted with the Boltzmann relation with ΔFmax = 3.00 ± 0.15 au, zδ = 0.4 ± 0.1, V0.5 = −61 ± 4 mV; and ΔFmax = 3.86 ± 0.24 au, zδ = 0.4 ± 0.1, V0.5 = −61 ± 5 mV.
Slow and Medium Charge Movements in Q457C.
Medium and slow components of charge movement were observed in the 100- and 500-ms current records of the TMR6M-labeled Q457C (unpublished data), and their characteristics were similar to those of wild-type hSGLT1. The τ–V relation for the medium component (τmed) was the same as hSGLT1; for test voltages more negative than −50 mV, τmed was ≈20 ms and was independent of voltage, and in the depolarizing direction, τmed decreased to ≈3 ms at +50 mV (compare Fig. 4 A). Like wild-type hSGLT1, for hyperpolarizing voltages, the slow component of TMR6M-labeled Q457C was independent of voltage for the ON and OFF pulses. The time constant (τslow) ranged between 60 and 200 ms, depending on the level of expression of hSGLT1-Q457C; the higher the expression, the larger was τslow. This variation in τslow was possibly due to an underestimation of τslow at low levels of expression seen with this mutant. As in hSGLT1, the magnitudes of the medium and slow charges for the OFF response (in TMR6M Q457C) were comparable and contributed equally to the total charge. The Q–V relation for total charge could be fitted by the Boltzmann relation with zδ = 1.0 and V0.5 in the range −40 to −65 mV.
Rising Phase of Charge Movement in hSGLT1.
At a high sampling rate (8 μs/sample), we have observed a rising phase with the two-electrode voltage clamp (Fig. 5 A). In this record, the presteady-state current was obtaining by phlorizin subtraction. With onset of the depolarizing voltage pulse, the current rose initially to a peak (at 1.5 ms) before decaying toward the steady state. The rising phase was not observed for hyperpolarizing voltages (Fig. 5 A).
The rising phases (at +50 to −10 mV) were superimposable when the current traces were normalized to the peak current (at 1.5 ms). The current records were fitted to a sum of two exponentials with the constraint that the time constant of decay was the same as those obtained from the same oocyte with 100-ms pulses. τ for the rising phase was 550 ± 60 μs (n = 4) and was independent of test voltage (+50 to −10 mV).
When external Na+ concentration ([Na+]o) was reduced from 100 to 12 mM, the time to peak (tpeak) was reduced (Fig. 5 B). For the +50 mV pulse illustrated, tpeak was 1.5 ms at 100 mM [Na+]o, 0.9 ms at 25 mM [Na+]o, and 0.7 ms at 12 mM [Na+]o. A plot of tpeak vs. [Na+]o (at 100, 50, 25, 12, and 6 mM) yielded a sigmoidal relation with a Hill coefficient between 1 and 2 (unpublished data).
From peak current, the time constant of the medium component of decay of transient current decreased with external Na+ concentration (Fig. 5 B), and this is illustrated for 100 and 0 mM [Na+]o in Fig. 5 C. At −150 mV, τ decreased from 18 to 3.5 ms, and from 4.5 to 1.9 ms at +50 mV (see inset). In the working voltage range (+50 to −150 mV), the “maximal” charge recorded (the difference in charge between the limits +50 and −150 mV) was reduced 50% on removing Na+ (Fig. 5 D). We were unable to estimate the Qmax, zδ, and V0.5 under Na+-free conditions because the charge did not saturate at the largest hyperpolarizing voltage applied (−150 mV). This observation is in agreement with the previous finding that the midpoint voltage (V0.5) of the Q–V curve (for the medium component) became more negative by 100 mV per 10-fold decrease in [Na+]o (Hazama et al., 1997; Quick et al., 2001).
The cut-open oocyte voltage clamp, with a settling time of <80 μs, was used to examine the rising phase of charge movement in more detail. Representative current records for the hSGLT1-Q457C labeled with tetramethylrhodamine-6 maleimide (TMR6M) are shown in Fig. 6. Vh was −80 mV, and the traces (shown for Vt +50 and −150 mV) were obtained with a sampling interval of 5 μs. In Na+, the current rose from an initial low value (close to 0 nA) to a peak (at 0.9 ms for Vt +50 mV) before decaying toward steady state. The time duration at peak current was rather broad, ≈0.5–1 ms. As in two-electrode voltage clamp experiments (Fig. 5 A), the rise to peak current became less pronounced as Vt was made less positive (not depicted). In the hyperpolarizing direction, the current showed a simple relaxation to steady state. In the OFF response, current decayed from an early time point (Fig. 6 A). In the absence of Na+, the rising phase was not observed for depolarizing or hyperpolarizing pulses.
The time constants for the fast current records are shown in Fig. 6 C. In the presence of Na+, for hyperpolarizing voltage pulses (−110 to −130), current decayed with a time constant of 1.3 ± 0.1 ms (n = 3). In the depolarizing direction, for Vt between −50 and +50 mV, current rose to a peak with a time constant of 0.17 ± 0.01 ms (n = 6), and then decayed with a time constant of ≈3 ms or greater (unpublished data). In the absence of external Na+, current decayed to steady state with a voltage-independent time constant of 0.24 ± 0.01 ms (n = 9) for ON, and 0.17 ± 0.01 ms for OFF.
Part II. Fluorescence Changes
Slow Fluorescence Changes
The time course of rhodamine fluorescence for a 100-ms voltage pulse using the two-electrode voltage clamp is shown in Fig. 7 A for TMR6M-labeled Q457C in 100 mM [Na+]o. There was a change of fluorescence intensity (ΔF, a decrease for depolarizing and an increase for hyperpolarizing voltages) that returned to the holding level at the end of the pulse. The larger the voltage step, the larger was the ΔF, but the time constant τ was ≈10 ms and independent of voltage (see Loo et al., 1998; Meinild et al., 2002). With longer (500 ms) pulses, we observed an additional component (Fig. 7 B). In Fig. 7 B, the 100-ms records (from Fig. 7 A) were split (at 100 ms) and overlaid on the 500-ms records to agree at the onset of the ON and OFF pulses. The dashed traces indicate the ΔF at 100 ms, and a comparison with the fluorescence level at 500 ms shows that the amplitude of the slow component increased with the size of the test voltage step in both depolarizing and hyperpolarizing directions. The amplitude of the slow component during the OFF response increased with the duration of the ON pulse, indicating that the slow component developed sequentially after relaxation of the 10-ms component.
The total fluorescence change (ΔFtotal) was resolved into two components, slow (ΔFslow) and medium (ΔFmed). To obtain ΔFslow and ΔFmed, the ΔFtotal for the 500-ms pulse was fitted by a sum of two exponential components, and representative traces for the ON pulse are shown in Fig. 7 C for Vt = +90 and −190 mV. Time constant of this slow fluorescence (τslow) was independent of Vt; τslow was 92 ± 11 ms (n = 7) for the ON, and 138 ± 16 ms (n = 10) for the OFF pulses. For medium fluorescence, the time constant (τmed) was also independent of voltage; between +50 and −150 mV, τmed was 8.5 ± 0.3 ms (n = 10) for ON and 7.9 ± 0.3 ms (n = 10) for OFF.
Fig. 7 D shows a plot of the amplitudes of ΔFslow and ΔFmed vs. voltage. The ΔFmed–V relation was sigmoidal with a zδ of 0.4 and V0.5 of −61 mV. The slow component increased with the size of the voltage jump, but we were unable to obtain a Boltzmann fit to the ΔFslow–V relation because of the low amplitudes and scatter. Nevertheless, inspection of the OFF records (Fig. 7 B) suggests that V0.5 is similar for the slow and medium components, i.e., the symmetry between the OFF responses to depolarizing and hyperpolarizing test pulses is similar for the medium and slow component. The maximal observed fluorescence change, the difference between the ΔF's at the largest depolarizing and hyperpolarizing voltages (+90 and −190 mV), was much larger for ΔFmed than ΔFslow (ratio was ≈5). The sum of the two components, ΔFtotal, gave a zδ of 0.4 and V0.5 of −61 mV (Fig. 7 D).
The 100- and 500-ms fluorescence records at various [Na+]o are shown in Fig. 8 A. They are overlaid (as in Fig. 7 B). The slow component is evident at each Na+ concentration. The dependence of ΔFmed on Na+ is shown in Fig. 8 B. The ΔFmed–V relations obeyed the Boltzmann relation. zδ was 0.4 and independent of [Na+]o. As [Na+]o was reduced, there was no apparent change in maximal fluorescence (ΔFmed max), but there was a shift of V0.5 to more negative values: from −30 mV at 100 mM Na+ to −99 mV at 25 mM Na+. In Na+-free solutions, the ΔFmed–V curve did not saturate even at the most negative voltage applied (−150 mV). When V0.5 was plotted against [Na+]o, the slope yielded a 100-mV shift in V0.5 per 10-fold decrease in Na+ concentration (unpublished data), indicating that in Na+-free solutions, the V0.5 is more negative than −200 mV. The dashed line represents the Boltzmann relation in the absence of Na+, with V0.5 of −200 mV, ΔFmax of 1, and zδ of 0.4. The close agreement with the Na+-free data indicates that in Na+, the medium fluorescence can be largely attributed to the empty transporter.
Figure 8.
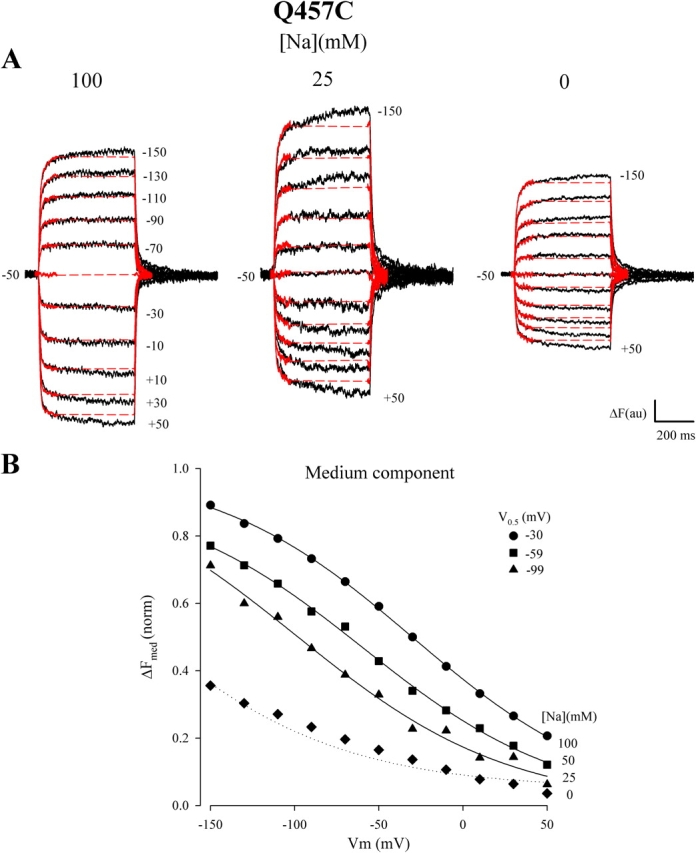
Dependence of the slow and medium components of ΔF on [Na+]. (A) Time course of ΔF when [Na+]o was 100, 25, and 0 mM. [Na+]o was varied by choline replacement. The records from 100- and 500-ms pulses are overlaid, with the 100-ms records split (at 100 ms) to align with the 500-ms records at the onset of the ON and OFF pulses (see Fig. 7 B). Data were collected from a single oocyte, and all three panels share the abscissa and ordinate scales. The 500-ms records were fitted to ΔF = ΔFmed (1 − exp(−t/τmed)) + ΔFslow (1 − exp(−t/τslow)). The τ's obtained are independent of Vt. For ON, respectively at 100, 50, 25, and 0 mM [Na+]o, τmed was 11.6 ± 0.2 ms (n = 9), 11.4 ± 0.3 ms (n = 10), 11.3 ± 0.4 ms (n = 9), and 10.9 ± 0.3 ms (n = 10); and τslow was 149 ± 21 ms (n = 7), 167 ± 28 ms (n = 6), 159 ± 44 ms (n = 6), and 146 ± 22 ms (n = 8). For OFF, τmed was 8.0 ± 0.2 ms (n = 10), 9.6 ± 0.4 ms (n = 10), 10.0 ± 0.4 ms (n = 9), and 10.2 ± 0.4 ms (n = 10); and τslow was 154 ± 41 ms (n = 7), 184 ± 38 ms (n = 8), 119 ± 45 ms (n = 7), and 146 ± 48 ms (n = 7). (B) ΔF–V relations for the medium component (ΔFmed). ΔFmed and ΔFslow were obtained by curve fitting (described in A). At each [Na+]o, the ΔFmed–V curves were fitted (smooth curves) to the Boltzmann relation. At 100 mM [Na+]o, zδ = 0.4 ± 0.03, and V0.5 = −30 ± 3 mV. At 50 mM [Na+]o, zδ = 0.4 ± 0.07, and V0.5 = −59 ± 6 mV. At 25 mM [Na+]o, zδ = 0.4 ± 0.15, and V0.5 = −99 ± 31 mV. For comparison, the curves have been normalized to the maximal extrapolated (slow-compensated) fluorescence change (ΔFmax) observed in 100 mM [Na+]o and have also been shifted to align at the extrapolated depolarizing limit (see Loo et al., 1993; Meinild et al., 2001). The dotted line at 0 Na+ was the Boltzmann relation with the same ΔFmax and zδ (0.4) as 100 mM [Na+], and V0.5 of −200 mV.
The ratio of the slow and medium components, ΔFslow max/ΔFmed max (taken between +50 and −150 mV), was independent of [Na+]o (at 100, 50, 25, and 0 mM): 0.20 ± 0.03 (n = 4) for the ON, and 0.18 ± 0.03 (n = 4) for the OFF pulses. The time constants for ΔFmed and ΔFslow were independent of voltage and [Na+]o. τmed was ≈10 ms, and τslow was ≈ 150 ms (see legend of Fig. 8 B).
Fast Fluorescence Changes
A fast component of fluorescence was observed using the cut-open oocyte voltage clamp. This is illustrated in Fig. 9 A, which shows the time course of ΔF in 100 mM [Na+]o. The experiment was performed on the same oocyte as Fig. 6 with membrane potential held at −80 mV. With onset of the voltage pulse, there was a fast initial change of fluorescence. The kinetics became faster when Na+ was removed from the external solution (Fig. 9 C). In both Na+ and Na+-free solutions, increasing the pulse duration to 40 ms revealed an additional component with a time constant τ ≈ 10 ms (Fig. 9, B and D). The amplitude of ΔF was dependent on [Na+]o; maximal change of fluorescence (between +50 and −150 mV) decreased 64% (from 6.3 to 4.0 arbitrary units) when Na+ was removed (Fig. 9 D).
Figure 9.

Fast fluorescence changes. Data was obtained using the cut-open oocyte on a TMR6M-labeled Q457C. External and guard solutions contained 100 mM Na-methanesulfonate and internal solution contained 100 mM K-methanesulfonate. Subtracting holding potential (Vshp) was −150 mV. The records were the averages of 20 sweeps. Data was digitized at 5 μs per sample (A) and 50 μs per sample (B). C and D show the time course of ΔF in Na+-free solution (choline replacement). Digitizing rate was 5 μs per sample (C) and 50 μs per sample (D).
The time course of ΔF could be fitted by two exponentials, and representative records (at Vt = +50 and −150 mV) are shown in Fig. 10 (A and B) (for the ON and OFF pulses). The numbers next to the traces are the time constants (τfast) of the fast component. In the absence of Na+, τfast was ≈0.4 ms and increased to ≈2.0 ms in 100 mM Na+ (Fig. 10 A). For the OFF response, τfast was also ≈0.4 ms in 0 mM Na+ (Fig. 10 B). In the presence of Na+, the recovery from +50 mV was considerably faster (τfast ≈ 0.4 ms; Fig. 10 B) than the recovery from −150 mV (1.9 ms). Fig. 10 (C and D) shows the τfast–V relations. In the absence of Na+, τfast was voltage independent, and was 0.35 ± 0.04 ms (n = 9) for ON, and 0.34 ± 0.03 ms (n = 9) for OFF. In Na+, τfast was 1.7 ± 0.8 ms (n = 9) and independent of voltage. For the OFF response, τfast depended on Vt; when Vt was more negative than Vh, τfast was ≈2 ms (2.0 ± 0.1 ms, n = 5), and when more positive, τfast was smaller (e.g., 0.41 ms at +50 mV).
Figure 10.
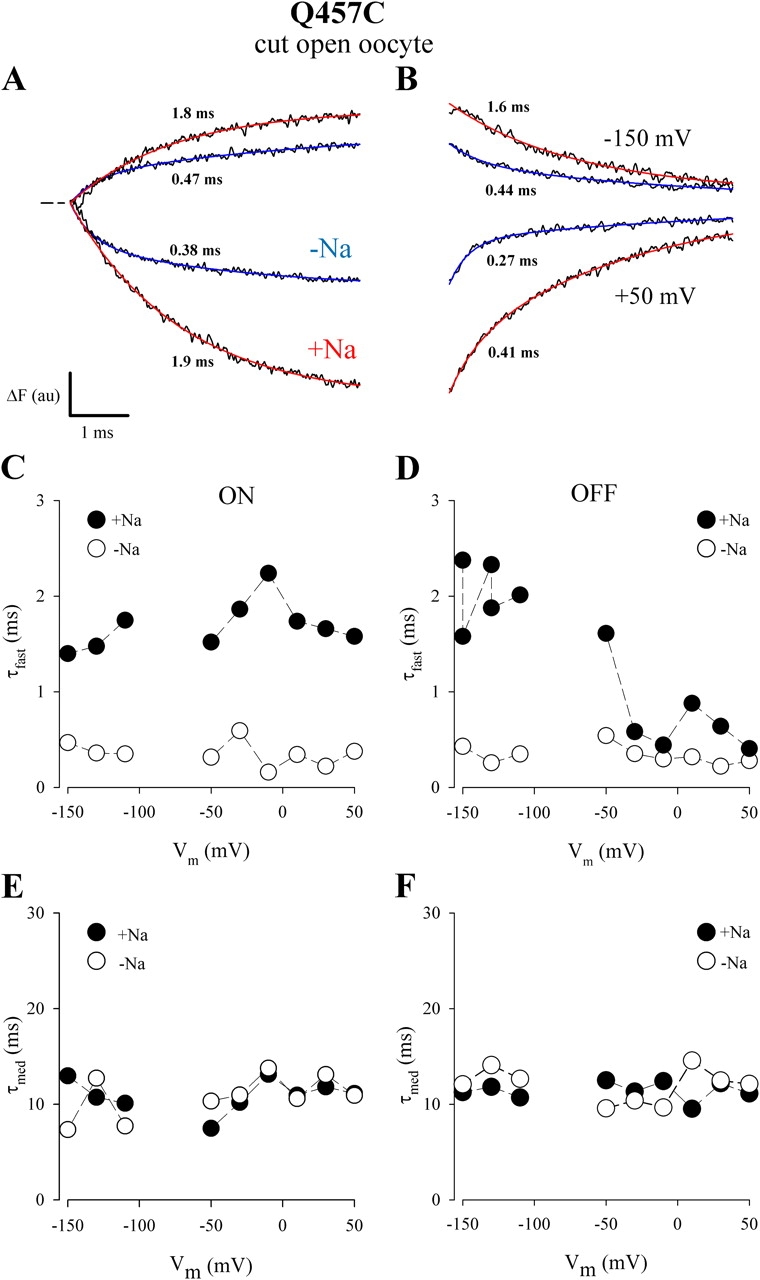
Voltage dependence of the fast and medium components of ΔF. Time course of ΔF (for a 5-ms pulse) at Vt of +50 and −150 mV (Vh = −80 mV) in 100 mM [Na+]o (+Na) or 0 Na+ (−Na). Data is from the experiment of Fig. 9. The fluorescence records were fitted to two exponential components (denoted by fast and medium). The number next to each trace is the time constant of the fast component (τfast). A and B show the time courses of ΔF (for ON [A] and for OFF [B]). (C) τ–V relations for τfast (ON). Open symbols (0 Na+) were obtained from 5-ms pulses, and filled symbols (+Na) were from 40-ms pulses. (D) τ–V relations for τfast (OFF). Data were from 5-ms pulses. (E and F) τ–V relations for τmed (for ON [E] and for OFF [F]). Data were from 40-ms pulses.
The time constants of the medium component (τmed ≈ 11 ms) was independent of voltage and [Na+]o (for both ON and OFF pulses). The ΔF–V relation for the fast component in the presence of Na+ (100 mM) was sigmoidal, and could be fitted by the Boltzmann relation with a zδ of 0.6 ± 0.1 and a V0.5 of −48 ± 7 mV (Fig. 11 A). The medium ΔF–V curve in Na+ was also sigmoidal, but because of the small amplitude, there was a large uncertainly in the maximal fluorescence, steepness factor, and midpoint voltage (ΔFmax = 3.8 ± 1.9 au; zδ = 0.5 ± 0.3; V0.5 = −100 ± 47 mV). We were unable to fit the medium ΔF–V relation in the absence of Na+. Compared with the fast, the medium component was relatively insensitive to Na+ (Fig. 11 B). In the absence of Na+, the fast and medium components were similar (ΔFfast max/ΔFmed max ≈ 1), and the major role of Na+ was to increase the amplitude of the fast component (ΔFfast max/ΔFmed max ≈ 3.3).
Figure 11.
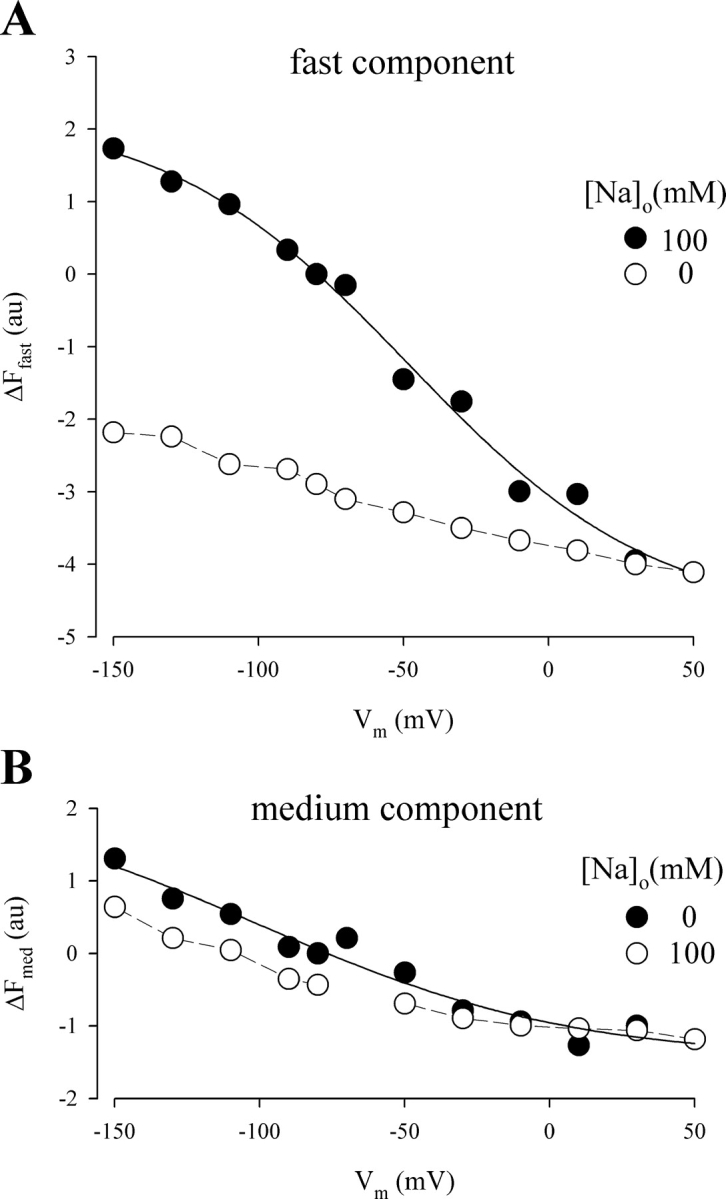
Na+ dependence of the fast and medium components of ΔF. The fast and medium fluorescence amplitudes were obtained by fitting the time course of ΔF to two exponential components (compare, Fig. 7). (A) ΔF–V relation for the fast component. The curve is the fit of the data in 100 mM Na+ to the Boltzmann relation with ΔFmax = 7.0 au, z = 0.6, and V0.5 = −48 mV. The ΔF–V curve in 0 Na+ has been shifted to align with that of 100 mM Na+ at +50 mV. (B) ΔF–V relation for the medium component. The curve is the fit of the data in 100 mM Na+ with ΔFmax = 3.8 ± 1.9 au, z = 0.5 ± 0.3, and V0.5 = −100 ± 47 mV. The ΔF–V curve in 0 Na+ has been shifted to align with that of the 100 mM Na+ at +50 mV.
The total ΔF–V relation, measured using 100-ms pulses with the cut-open oocyte voltage clamp, was described by the Boltzmann relation; in four experiments performed in 100 mM [Na+]o, zδ was 0.4 ± 0.1 (n = 4) and V0.5 was −51 ± 17 mV (n = 4). This is consistent with the results on the medium fluorescence (ΔFmed) obtained using the two-electrode voltage clamp (Figs. 7 and 8).
Part III. Correlation between Charge Movement and Fluorescence Changes
Medium and Slow Charge and Fluorescence Changes
The time course of slow charge and fluorescence in the presence of Na+ (100 mM) are compared in the experiment of Fig. 12 A. Shown are the records in response to 750-ms hyperpolarizing voltage pulses from −50 mV (Vh) to −110, −130, and −150 mV. For ΔF, the time constants (of the ON response) were 9 and 169 ms. For comparison of the slow components, the concurrent charge and fluorescence records were normalized to 75 and 750 ms. Within this interval, there was a close agreement between the two time courses. We were unable to compare slow charge and fluorescence at large depolarizing voltages (more positive than +10 mV) because of the high endogenous chloride currents of the oocytes. In the absence of Na+, there was also a fair agreement between slow charge and slow fluorescence (Fig. 12 B).
Figure 12.
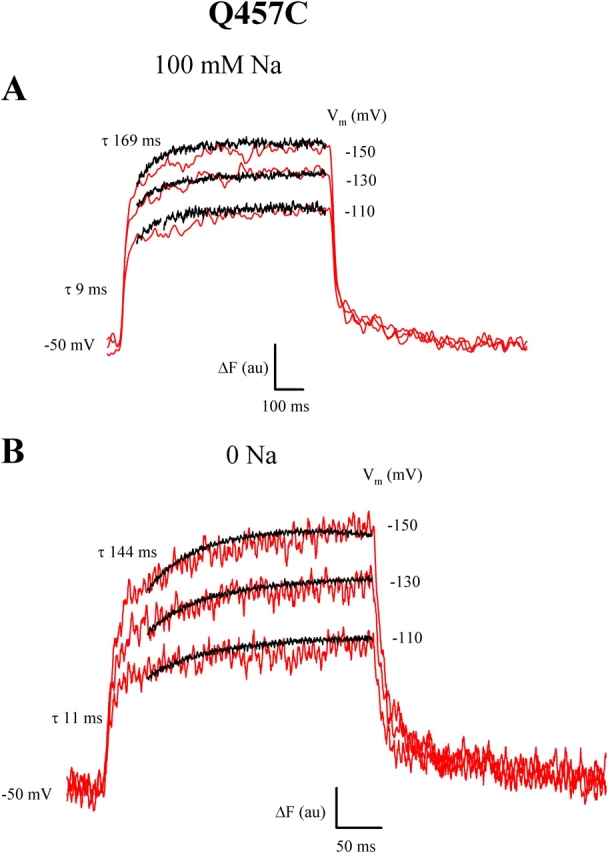
Correlation between slow charge and fluorescence. Experiment was performed using a two-electrode voltage clamp on TMR6M Q457C. (A) Correlation between slow charge and fluorescence (red traces) in 100 mM [Na+]o. The charge record has been normalized to agree with ΔF at 40 and 750 ms. Shown are records at hyperpolarizing voltages of −110, −130, and −150 mV from Vh = −50 mV. ΔF contained two voltage-independent time constants of 9 ± 1 ms (n = 10) and 169 ± 19 ms (n = 7) for the ON, and 9 ± 1 ms (n = 10) and 154 ± 9 ms (n = 9) for the OFF response. τslow for charge (ON) was 104 ± 10 ms (n = 3). (B) Correlation between slow charge and slow fluorescence in Na+-free solution. Pulse duration was 300 ms, and Vh was −50 mV. The current records have been normalized to agree with the fluorescence at 50 and 300 ms (as in A). ΔF (for the ON pulse) contained two voltage-independent time constants of 11 ± 1 ms (n = 8) and 144 ± 15 ms (n = 8). τslow for charge (ON) was 63 ± 8 ms (n = 3).
Fig. 13 shows a comparison of medium components of charge and fluorescence (in a 75-ms pulse) in the presence of Na+ (100 mM). Since the time constant for charge was voltage dependent, while that for ΔF was voltage independent (Fig. 4 A and Fig. 7C), one would anticipate a difference in time course between the two signals, and this is observed. In the depolarizing direction, charge (τ ≈ 4 ms) led fluorescence (τ ≈ 8 ms), and in the hyperpolarizing direction, fluorescence (τ ≈ 9 ms) led charge (τ ≈ 21 ms). This difference between charge and fluorescence in the medium component was also observed under Na+-free conditions.
Figure 13.

Correlation between medium charge and fluorescence. Experiment was performed using a two-electrode voltage clamp on a TMR6M-labeled Q457C in 100 mM NaCl buffer. Vh was −50 mV. The time course of Q and ΔF are compared at +30 and −150 mV. Q was obtained from the total current by subtraction of the steady-state current and the oocyte membrane capacitive transient. The traces have been normalized to agree at the end of the voltage pulse (75 ms). The numbers next to the traces are the time constants of Q and ΔF.
Rising Phase of Charge Movement and Fluorescence
The concurrent presteady-state current (I) and fluorescence records (ΔF) during the first 5 ms of a pulse from −80 mV to +50 mV are shown in Fig. 14 (from Figs. 6 and 9). In the presence of Na+, with depolarizing pulses, τ of the rising phase of charge movement was 0.17 ms while τ of the fast fluorescence was 1.7 ms, indicating that “fast” charge (rising phase) led fast fluorescence. For hyperpolarizing pulses, charge also led fluorescence (τ = 1.0 ms for Q and 1.8 ms for ΔF; Table I). The presteady-state current was integrated to obtain the charge transferred. The charge transferred by the rising phase (at 0.8 ms) was 21% of total charge transferred at the end of voltage pulse (at 5 ms) while the ratio of ΔF at peak current (0.8 ms) to total ΔF (at 5 ms) was 37%. This suggests that the fast component is responsible for the major change in the fluorescence signal, while the contribution of the rising phase to total charge was smaller. In the absence of Na+, where τ for fluorescence decreased to 0.4 ms, we were unable to detect a corresponding fast charge (Fig. 14 B), largely due to the low expression of the Q457C mutant in this oocyte.
Figure 14.
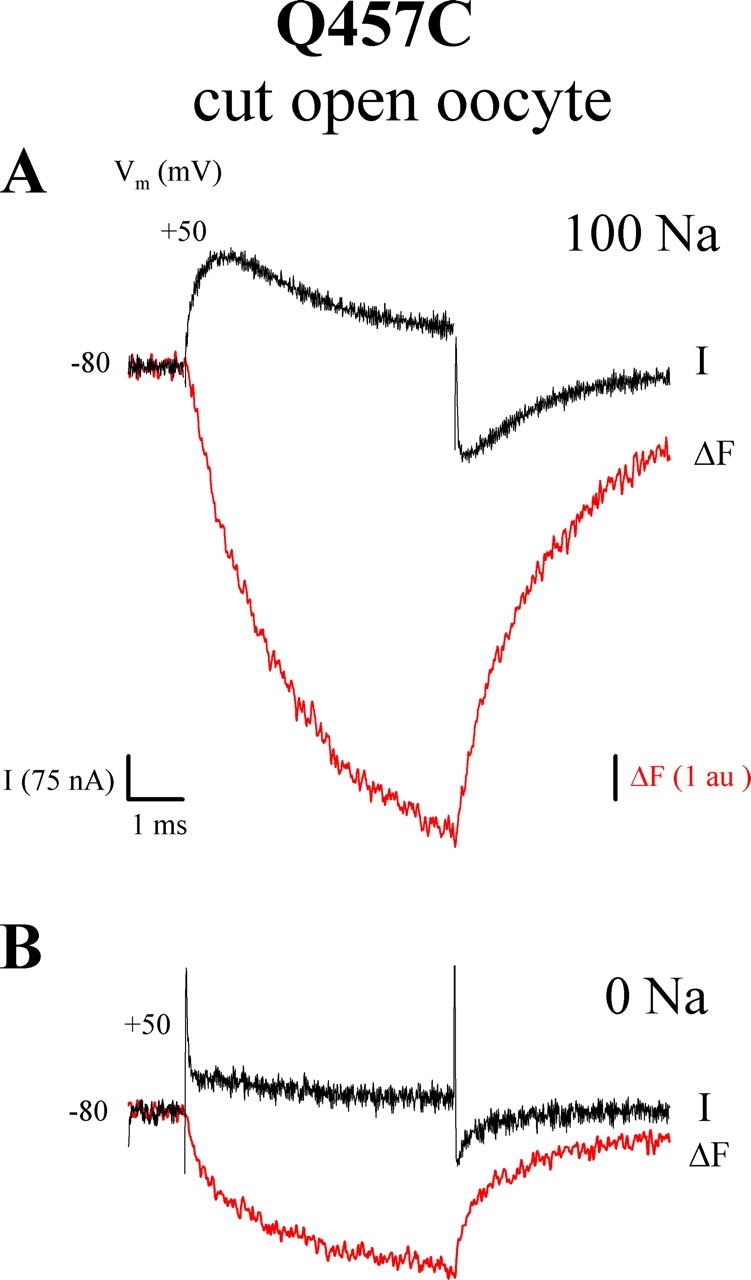
Correlation between fast charge and fluorescence. The experiment was performed using the cut-open oocyte on TMR6M-labeled Q457C (from the oocyte of Fig. 6). Membrane potential was held at −80 mV and stepped to +50 mV. (A) Comparison of the rising phase of the presteady-state current (I) and fluorescence (ΔF) in 100 mM [Na+]o. I is from Fig. 6 A and ΔF is from Fig. 9 A. (B) Comparison of charge and ΔF in absence of Na+. I is from Fig. 6 B and ΔF is from Fig. 9 C.
TABLE I.
Summary of the Time Constants for Charge Movement and Fluorescence for TMR6M-labeled hSGLT1 Q457Ca
| τON (ms) | τOFF (ms) | ||||||||
|---|---|---|---|---|---|---|---|---|---|
| Depolarizing
|
Hyperpolarizing
|
Depolarizing
|
Hyperpolarizing
|
||||||
| Q | ΔF | Q | ΔF | Q | ΔF | Q | ΔF | ||
| +Na | |||||||||
| τslow | 30 ± 1a# | 149 ± 21 | 104 ± 10 | 149 ± 21 | 99 ± 4 | 54 ± 41 | 99 ± 4 | 49 ± 21 | |
| τmed | 4 ± 1# | 12 ± 1 | 19 ± 1 | 12 ± 1 | 15 ± 1 | 8 ± 1 | 15 ± 1 | 12 ± 1 | |
| τfast | 0.17 ± 0.01b | 1.7 ± 0.8 | 1.3 ± 0.1 | 1.7 ± 0.1 | 1.7 ± 0.1 | 0.41 ± 0.02# | 1.7 ± 0.1 | 2.0 ± 0.1 | |
| −Na | |||||||||
| τslow | ND | 146 ± 22 | 63 ± 8 | 146 ± 22 | ND | 46 ± 48 | 63 ± 8 | 146 ± 48 | |
| τmed | 1.9 ± 0.1# | 11 ± 1 | 3.5 ± 0.1# | 11 ± 1 | 2.4 ± 0.1 | 10 ± 1 | 2.4 ± 0.1 | 10 ± 1 | |
| τfast | 0.24 ± 0.01 | 0.35 ± 0.04 | 0.24 ± 0.01 | 0.35 ± 0.04 | 0.17 ± 0.01 | 0.34 ± 0.03 | 0.17 ± 0.01 | 0.34 ± 0.03 | |
τON for depolarizing and hyperpolarizing potentials were determined in the presence 100 mM Na+ or absence of Na+ at Vt of +50 mV, and −150 mV. τOFF was determined when Vt was returned to Vh (−50 or −80 mV) from +50 (depolarizing) and −150 mV (hyperpolarizing). These are the means and standard errors of three to nine estimates, except those indicated by #, which are the errors of the fit for individual experiments, but these were repeated on at least three oocytes. ND, not determined.
For hSGLT1 (not determined for TMR6M-labeled Q457C).
For the rising phase of charge movement in TMR6M-labeled Q457C.
DISCUSSION
Ion-driven cotransporters couple the transmembrane electrochemical potential gradient for ions (Na+ or H+) to the uphill transport of substrates. In recent years, evidence has been accumulating to indicate that all of these proteins share an alternating access mechanism; the initial step in energy transduction is the reorientation of the ligand-free binding sites from the internal to external membrane surface, and external cation binding. A common observation is the charge movements associated with these activation steps (for reviews see Forster et al., 2002; Loo et al., 2002).
In the case of SGLT1, our previous studies have established that the distribution of the human isoform (hSGLT1) between two stable conformations, Na+-bound outward facing (C2) and the Na+-free inward facing (C6, Fig. 15 A), is voltage dependent. hSGLT1 charge movement as a function of membrane voltage is described by a Boltzmann relation with a V0.5 of ≈−50 mV (Loo et al., 1993; Quick et al., 2001). The voltage dependence of the C2-C6 distribution was independently confirmed with optical studies of hSGLT1 (Loo et al., 1998; Meinild et al., 2002). Here we have expanded the study of the transitions between C2 and C6 using a voltage perturbation protocol where we monitored SGLT1 charge and fluorescence from microseconds to seconds. The resolution of our previous voltage clamp experiments on SGLT1 expressed in oocytes has been limited due to the speed of the clamp (≈1 ms) and the limited duration of the voltage pulse (typically 100 ms). We now have recorded transients that have revealed hitherto unexpected features of the transitions between C2 and C6, and these provide new insights into the partial reactions of the transporter. Confidence in the new charge recordings is enhanced by the concurrent optical recordings since fluorescence measurements are subject to different constraints than charge measurements; charge is extracted from SGLT1 capacitive currents within a background of plasma membrane capacitive currents, SGLT1 ionic currents (uniporter currents), and membrane leakage currents (Parent et al., 1992; Loo et al., 1999), whereas SGLT1 optical records are measured against a constant background fluorescence (Loo et al., 1998; Meinild et al., 2002).
Multiple Components of Charge Movement and Fluorescence
A summary of the fast, medium and slow components of charge and fluorescence with time scales ranging from 0.2 to 200 ms is presented in Table I.
Charge Movement
Slow Charge.
Whereas previous studies (Loo et al., 1993; Hazama et al., 1997; Quick et al., 2001) have documented SGLT1 charge movement between C2 and C6 with time constants in the range 2–20 ms (medium component), we now have clearly demonstrated an additional slow component with time constants in the range of 100 ms (Fig. 4 A; Table I). The slow charge movements were found in the presence and absence of Na+ (Fig. 12, A and B), indicating that they are associated with the unloaded carrier. A major consequence of this new slow component is that we have previously overestimated the turnover rate of SGLT1. The turnover rate is estimated from the ratio (Imax/Qmax) of the maximal rate of sugar transport (Imax) and maximal charge (Qmax). Previous estimates for human SGLT1, 57 s−1, were based on the medium component (Loo et al., 1993). Since the total charge (Qmax) is doubled with inclusion of the slow component, the turnover rate of human SGLT1 is reduced by 50%, to 28 s−1.
Our finding of a slow charge (in the presence and absence of Na+) in human SGLT1 is consistent with reports of time constants up to 50 ms in rabbit SGLT1 (Krofchick and Silverman, 2003). Since the rabbit currents were obtained from 100-ms pulses, they are undoubtedly underestimated (Krofchick and Silverman, 2003). In long pulse protocols on rabbit SGLT1, we have found that the slow component required ≈80 ms at +20 mV and ≈500 ms at −100 mV to reach steady state (unpublished data).
The time constants of the slow component (Table I) has important operational consequences for the protocol used in charge movement studies; i.e., the test voltage pulses need to be separated by interpulse intervals greater than five times the slowest time constant (or ≈500 ms). This may, in part, explain the variations in the kinetics of charge movement observed using different protocols (present study; Chen et al., 1996; Krofchick and Silverman, 2003).
Medium Charge.
The medium charge, with τ between 3 and 35 ms (Table I), has been previously described for human, rabbit, and rat SGLT1 (Loo et al., 1993, 1998; Panayotova-Heiermann et al., 1995; Chen et al., 1996; Hazama et al., 1997; Quick et al., 2001; Meinild et al., 2002; Krofchick and Silverman 2003; Krofchick et al., 2004). In the present study, the current records for the medium component (for hSGLT1 and TMR6M-labeled hSGLT1 Q457C) were corrected for the slow component (Fig. 2, A and C), and the τ–V and Q–V relations obtained are similar to those described previously on hSGLT1 and the TMR6M-labeled hSGLT1 Q457C from uncorrected records (Loo et al., 1993; Chen et al., 1996; Hirayama et al., 2001; Quick et al., 2001; Meinild et al., 2002). In the case of the rabbit isoform, the time constant for medium charge can be simulated by the kinetic model for SGLT1 (Hazama et al., 1997).
The slow and medium charge movements were equal in magnitude (Fig. 4, B and C). Their time constants showed similar voltage dependences; they were voltage independent for hyperpolarizing voltages and decreased with depolarizing voltages (Fig. 4 A). For both ON and OFF, zδ was identical between medium and slow charge, but V0.5 was −33 mV for medium and −67 mV for slow. The total charge vs. voltage (Q–V) relation was described by a Boltzmann function with two states and a single steepness factor (zδ) of 1.0. Since total charge consists of three components, the Q–V relation could, in principle, be fitted by a Boltzmann function with four states. Chen et al. (1996) obtained a zδ of 0.7–0.8 for human SGLT1 (in 90 mM [Na+]o), and as slow charge was not reported, this represented the sum of the fast and medium components. Krofchick et al. (2004) modeled the Q–V relation of rabbit SGLT1 (for total charge with fast, medium, and slow components) by a Boltzmann function with three states (and two steepness factors) and obtained zδ values of 0.45 and 0.97 and V0.5 values of −7 and −49 mV. A proper analysis of Boltzmann distributions with multiple states requires experimental protocols that take into account the range of the time constants.
Fast Charge.
Our previous consideration of fast hSGLT1 charge movements, i.e., components with time constants <2 ms, have been fraught with uncertainty due to large membrane capacitive transients with a time constant of ≈0.5 ms. This has been clarified by use of the phlorizin subtraction protocol (Fig. 5, A and B) and the cut-open oocyte voltage clamp with a settling time of 80 μs (Fig. 6). We observed two components of fast charge: (1) a fast decay for hyperpolarizing pulses in the presence of Na+, and both hyperpolarizing and depolarizing voltage pulses in the absence of Na+; and (2) a rising phase with large depolarizing pulses in the presence of Na+. As will be discussed (below), these fast components indicate that there are two fast conformational changes of hSGLT1 between C2 and C6 (Fig. 15), and the dominant component depends on the experimental condition. The time constant of the fast decay is 0.2–1.5 ms for ON, and 1.6 ms for OFF (Table I). A fast decay (with τ ≈ 0.4–0.8 ms in the presence and absence of Na+) has been reported by Chen et al. (1996) using the cut-open oocyte, and suggested by Krofchick and Silverman (2003)(τ ≈ 0.5–1.0 ms) using phlorizin subtraction and two-electrode voltage clamp.
The fast rising phase is a novel finding of this study. The time constant was 200 μs, Na+ dependent and voltage independent (Fig. 5 B; Fig. 6 B). Hints of a rising phase have been observed experimentally in human SGLT1 using the two-electrode voltage clamp (Loo et al., 1993) and in model simulations for rabbit SGLT1 (Hazama et al., 1997). The rising phase has not been reported by other investigators, largely because kinetics were studied using conditioning prepulses of only 40 ms (Chen et al., 1996) and with hyperpolarizing pulses and/or with OFF responses (Chen et al., 1996; Krofchick and Silverman, 2003). The rising phase has confounded our attempts to estimate the contribution of fast charge to total charge. A lesson gained from the present study is that given the wide range of time scales, for kinetic studies, voltage pulses of different durations need to be applied and extra caution taken to ensure that steady-state conditions are reached for accurate estimation of presteady-state kinetics.
Dependence of Charge on Na+.
The kinetics of charge movement was dependent on external Na+. With decreasing [Na+], there was a shift of Q–V curve. For example, for the medium component, V0.5 shifted negative (≈100 mV/10-fold reduction in [Na+]o) with no change in zδ (Loo et al., 1993, Fig. 3; Hazama et al., 1997, Fig. 3; Quick et al., 2001, Fig. 3 B). There was little change in maximal charge (Qmax) until [Na+] was below 25 mM (Loo et al., 1993, Fig. 3; Hazama et al., 1997, Fig. 3; Quick et al., 2001, Fig. 3 B). In the absence of Na+, there was an apparent loss of charge (Fig. 5, A, B, and D) due to the shift of the Q–V curve out of working range (between −150 and +50 mV). The medium charge observed was 50% of that observed in 100 mM Na+ (Fig. 5 D).
The time constants for all three components of charge decreased with [Na+] (Table I). For example, as [Na+] is reduced from 100 to 0 mM, for fast decay, τ decreased from 1.6 to 0.2 ms (Fig. 6 C); for medium charge, τ decreased from 14 to 3 ms (Fig. 5 C); and for slow charge, τ decreased from 104 to 63 ms. For the rising phase with depolarizing pulses, the time to peak decreased with reducing [Na+], in part due to a decrease in the time constant of the medium component (Fig. 5 B).
Q457C-TMR6M Fluorescence
Similar to charge, there were three components of fluorescence (Table I): slow (τ 100 ms), medium (10 ms), and fast (1 ms). The maximal fluorescence (ΔFmax) of the slow component was 20% of the medium. The fast fluorescence was extracted from the medium using the cut-open oocyte preparation (Fig. 10), and the dependence of medium fluorescence on [Na+] observed in two-electrode voltage experiments (Fig. 8 B) was actually due to the Na+ sensitivity of the fast component (Fig. 11 A). Since ΔFmax for fast fluorescence increased threefold between 0 and 100 mM Na+ (Fig. 11 A), we estimate that in 100 mM Na+, 60% of the total ΔF was fast, 20% medium, and 20% slow. In contrast, ≈50% of the total charge was medium and ≈50% slow (fast charge was small). Thus there is a small charge associated with a large change in fast fluorescence.
In Na+, V0.5 was −48 mV for the fast (Fig. 11 A), and −100 ± 50 mV (Fig. 7 B and Fig. 11 B) for the medium and slow components of fluorescence. For medium and fast fluorescence, zδ was ≈0.4 (see Fig. 4, Meinild et al., 2002; Fig. 7 D; Fig. 11), and the time constants for all three components of fluorescence were voltage independent, with τON and τOFF generally equal (Fig. 10; Table I). We were unable to precisely determine the Boltzmann parameters for the slow component, largely due to the low expression of this mutant.
ΔF as a Function of Na+.
The time constants for fluorescence showed some dependence on Na+. For the slow component, τ was 169 ms vs. 144 ms in Na+ free (Table I). For medium component, τ was 19 ms in presence and absence of Na+. For the fast component, τ was 1.5 ms vs. 0.2 ms in Na+ free. Charge and fluorescence changes as a function of Na+ suggest that most if not all charge and fluorescence changes are due to conformational changes of the unloaded carrier, i.e., C1–C6 transitions. A more thorough investigation of the fast transients was made possible by the fluorescence experiments. In the absence of Na+, there was a fast component of the fluorescence, τ ≈ 300–500 μs, that is independent of voltage (Fig. 10 C), but the ON response is slowed by the presence of external Na+ to 2 ms (Fig. 10 C). This observation is consistent with the Na+ dependence of the rising phase of charge movement (Fig. 6 C). A fast component of the fluorescence change, τ ≈ 400 μs is nevertheless observed for the OFF response in Na+, but only for the depolarizing voltage pulses (Fig. 10 D).
Charge vs. Fluorescence Measurements
Charge and fluorescence measurements provide complementary views of the global/local conformational changes. The following observations indicate that to each charge state, there is a corresponding fluorescence state, and a closely associated conformational change to each component of charge movement: (a) the V0.5 for total charge (≈−50 mV) was similar to that for total fluorescence (present study; Meinild et al., 2002); (b) the shift of the V0.5 with varying [Na+], −100 mV/10-fold reduction in [Na+], was the same for charge as for fluorescence (present study; Meinild et al., 2002); (c) the time constants of each component of charge movement were in the same range as those for fluorescence; and (d) the time constants of fast charge and fluorescence showed a decrease with reducing [Na+].
The major difference between charge and fluorescence measurements was their dependence on voltage. (a) For the voltage dependence of the Boltzmann relation, zδ was 0.4 for fluorescence vs. 1.0 for charge. (b) We have found that zδ, which provides a measure of the voltage dependence of the global protein conformations, was the same (≈1) for SGLT1 mutants (unpublished data). On the other hand, zδ for fluorescence, which depended on the local environment of the fluorophore, depended on the location of TMR6M; e.g., zδ for medium fluorescence of TMR6M-labeled D454C was 0.6 (Díez-Sampedro et al., 2004). (c) The time constants for charge were voltage dependent (for medium and slow components), while those for fluorescence were voltage independent. We do not yet understand the mechanism whereby the time constants of the fluorescence changes were independent of voltage but the steady-state ΔF–V relations were voltage dependent.
While there was good agreement between the time course of charge and fluorescence for the fast and slow components (in the hyperpolarizing direction), there was a difference in the medium component (Fig. 13); in the hyperpolarizing direction, fluorescence led charge movement, indicting that the change in local environment of the fluorophore at residue 457 preceded the conformational changes that generate the charge movement. The situation is reversed in the depolarizing direction with charge movement leading fluorescence. These differences between charge and fluorescence depended on the location of the fluorophore on the protein. Preliminary experiments on mutant protein hSGLT1 I443C (labeled with TMR6M) indicated a close agreement between charge and fluorescence for depolarizing and hyperpolarizing pulses (unpublished data). Further studies on the relation between charge movement and fluorescence at different locations in the protein may enable us to obtain a spatial and temporal map of the conformational changes of the cotransporter.
Concurrent charge and fluorescence experiments have been performed on the glucose (Loo et al., 1998; Meinild et al., 2002), γ-aminobutyric acid (GAT1; Li et al., 2000), serotonin (SERT; Li and Lester, 2002), and glutamate transporters (EAAT3; Larsson et al., 2004), and the general agreement between charge and fluorescence and their dependence on substrates confirmed, in real time, that conformational changes are involved in transporter function. These studies have also revealed differences between charge and fluorescence, e.g., there were fluorescence changes in GAT1 (Li et al., 2000), SERT (Li and Lester, 2002), and EAAT3 (Larsson et al., 2004) without a corresponding charge movement. In SGLT1, the changes in the local environment at residue 457C (as monitored by fluorescence) closely mirrored the global conformational changes of the protein.
The slow time constant for SGLT1 is in the range for the Na+/Cl−/GABA family, such as GAT1 (Mager et al., 1993, 1996; Loo et al., 2000; Whitlow et al., 2003). The turnover rate is comparable to the turnover rate for SGLT1, indicating that reorientation of the empty transporter is the rate-limiting step for both families of cotransporters.
Kinetic Model for Na+/Glucose Cotransport
In the absence of external glucose and low internal [Na+], the six-state model for Na+/sugar cotransport is reduced to the three-state model for charge movement, and the three-state model accounted qualitatively for the medium Q–V (Boltzmann) and τ–V relations, and the shift of these relations with reducing [Na+]o (Fig. 5, C and D; Loo et al., 1993; Hazama et al., 1997). The model also predicted a rising phase of charge movement with depolarization at high [Na+] (Hazama et al., 1997). A rising phase is developed when the charge transfer associated with the empty carrier (C1↔C6) is faster and greater than the charge associated with Na+ binding/dissociation (C2↔C1). Na+ binding/dissociation is apparently the slower step because of the fast “back” reaction of Na+ binding (C2←C1). In absence of Na+, the “back” reaction is absent, and the rising phase is not observed. This also explains the decrease of the time to peak of the medium component as external [Na+] is reduced (Fig. 5 B). The rising phase is not observed at hyperpolarizing voltages because the fastest charge is moved during the first step (C6→C1).
A rising phase has been observed in the gating currents of Shaker K+ channels (Bezanilla et al., 1991; Stefani et al., 1994). Like the charge movement of SGLT1, the development depended on membrane voltage; the rising phase was not observed for small depolarizations (≈20 mV) from the holding potential (−80 mV), but became pronounced with large depolarization voltages more positive than +50 mV (Fig. 1 of Bezanilla et al., 1991). The development of the rising phase (of charge movement) in SGLT1 and (gating current) in Shaker K+ channels is due to the increase in the rate of charge transfer with positive membrane voltages and the majority of the charge being carried by the later step (Bezanilla et al., 1991; Parent et al., 1992; Loo et al., 1993; Stefani et al., 1994; Hazama et al., 1997).
A simplifying assumption of the three-state model (for C2–C6 transitions) involves the Na+ binding step; the two Na+ binding reactions (C1+Na+↔C1Na; C1Na+Na+↔C2) are lumped into one, C1+2Na+↔C2 (Hazama et al., 1997; Parent et al., 1992; Loo et al., 1993). This one-step approximation at high [Na+] is supported by the observation of high cooperativity between the two Na+ binding sites (Parent et al., 1992; Falk et al., 1998; Mackenzie et al., 1998; Meinild et al., 2002). However, the simplified model runs into difficulties when external [Na+] is lowered. The model predicted a smaller shift of the V0.5 with reducing [Na+] than experimentally observed (Hazama et al., 1997). In computer modeling, Falk et al. (1998) found that replacement of the two Na+ binding steps by a single step results in a Na+-dependent pseudo rate constant from C1 to C6, and this leads to incorrect predictions as external [Na+] is reduced. Thus for low Na+ concentrations, the two Na+ binding steps need to be included.
In view of the additional fast and slow components of charge observed in the absence of Na+ (for a total of three time constants), the single step transition between C1 and C6 needs to be extended. Two additional intermediate states (in addition to end states C1 and C6) are required for the empty transporter: C1↔C1a↔C1b↔C6. Together with the binding of two Na+ ions to C1 to form C2 a total of at least seven states are required to describe the presteady-state kinetics of SGLT1 (Fig. 15 B). Thus, in saturating [Na+] at hyperpolarizing voltages (eg., −150 mV) where there is a high occupancy in C2, when membrane voltage is stepped to large positive values, the protein goes through more than three intermediate states before reaching C6 (C2a, C2b, C1, C1a, C1b). The estimation of 16 rate constants (each with unknown voltage dependences [zδ's] for a total of 32 parameters) of a seven-state kinetic scheme is a formidable task.
Our computer simulations suggest that with the current knowledge no one set of kinetic parameters can account for the charge movement between C2 and C6. In order to illustrate the simulations we present one example in Fig. 15 C. Here we make the assumptions that (a) the two sodium ions bind to the transporter in one step; (b) the rates of the conformational changes are fast (C2↔C1), medium (C1↔C1a), slow (C1a↔C1b) and fast (C1b↔C6); (c) all the transitions from C2 to C6 are voltage dependent; and (d) for transitions from C6 to C2, only the first (C6→C1b) and last (C1→C2) steps are voltage dependent. Fig. 16 A shows the predicted charge movements in 100 mM Na+ for 10-ms voltage pulses ranging from −80 (Vh) to +90 and −150 mV, and Fig. 16 C shows the time constants as a function of the test potential. Four components of charge are predicted: two fast and difficult to discriminate between, and medium and slow components with voltage dependencies similar to those observed experimentally (compare Fig. 4 A). The fast components (0.2–2 ms) are relatively insensitive to voltage. The medium component has time constants decreasing from 25 to 3 ms from −150 to +50 mV. The slow component has time constants ranging from 90 to 25 ms from −150 to +50 mV. A rising phase is also predicted for depolarizing voltage steps with a peak current at 0.5 ms. In the absence of Na+, the rising phase is not present. Only three components of charge are predicted, and there is a decrease in the time constants for the medium and slow components (Fig. 16, C and D). It can also be deduced from Fig. 16 (A and B) that on removing Na+, the V0.5 for charge movement does not shift to the measured value (−200 mV). The failure of the model to predict the change in V0.5, similar to the failure of the three-state model (Hazama et al., 1997), is likely due to our assumption that the binding of two Na+ ions can be represented as a single rate constant (see also Falk et al., 1998).
Figure 16.

A model simulation for the presteady-state currents (A and B) and τ–V relations (C and D) in 100 and 0 mM external [Na+]. Simulations were performed on the kinetic scheme: C2↔C1↔C1a↔C1b↔C6 using the assumptions and rate constants summarized in Fig. 15 C. The simulation was performed with the membrane potential held at −80 mV at 20°C, and the voltage pulses (between +90 and −150 mV in 20 decrements) were applied for 10 to 500 ms. The differential equation relating the time evolution of states was solved numerically at each test voltage using Berkeley Madonna. The equation is 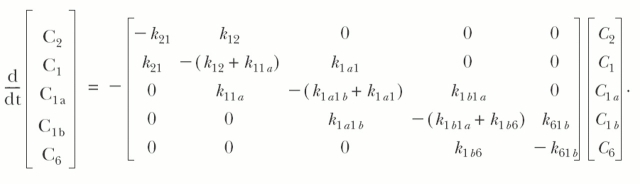 The sum of the occupancy probabilities in all the states is 1 (C1+C2+C1a+C1b+C6=1). For simulation, the total number of transporters in the oocyte plasma membrane was 5 x 10⁹ transporters (Zampighi et al., 1995). There are four components of charge movement (C2↔Cj) the charge (Iij) was calculated by Iij =
  , where e is the elementary charge, ɛij is the voltage dependence, and kij is the rate constants for transition from Ci to Cj (see also Krofchick and Silverman, 2003). The eigenvalues (which are reciprocals of the time constants) of the matrix were obtained using MATLAB 6.0 (The MathWorks Inc.).
This simulation does produce transient currents that are quite similar to those observed in Fig. 4 A, Fig. 5 (A and C), and Fig. 6 C. However, a clear discrepancy is noted between the simulation and the experimental results concerning the onset of the rising phase and the shape of the peak. Experimentally, the rising current originates from zero and the peak is broad (Fig. 6 A), whereas in the simulation, the current does not originate from zero and the peak is sharp (Fig. 16 A). The probable origin of this discrepancy is the assumption about the binding of the two Na+ ions in one step, and this is becoming a focus of future research.
Our assumptions about the relative rates of the conformational transitions of the empty carrier (from C1→C1a→C1b→C6) are an extension of our original two-state model (Hazama et al., 1997) and the three-state models proposed by Chen et al. (1996) and Krofchick and Silverman (2003) to account for the fast and medium charge movements. Both of the latter groups postulated an intermediate state C1a between C1 and C6 to account for the fast charge in the absence of Na+, and a medium transition between C1 and C1a. Our results require an additional intermediate C1b and a slow transition between C1a and C1b.
The simulation in Fig. 16 also makes the following predictions. (a) The observed asymmetry of voltage dependence of the forward and backward reactions of the transitions between C1 and C6. The medium and slow conformational changes are voltage dependent in the depolarizing direction (C1→C1a→C1b) but voltage independent in the hyperpolarizing direction (C1←C1b←C1b). This is consistent with our assumption that for transitions from C1 to C6, the major voltage-dependent step (major charge movement) is C1→C1a, and for transitions from C6 to C1, the major voltage-dependent step is C6→C1b.
(b) In the presence of Na+, the system behaves energetically as though it has two equilibrium states, C2 and C6. This suggests that C1, C1a, and C1b are unstable intermediates or states with extremely low occupancy. The instability of C1 is also supported by our previous findings that in the absence of Na+, the estimated V0.5 values for the medium Q–V and ΔF–V relations are ≈−200 mV (Meinild et al., 2002). Stabilization of the unloaded carrier in the outward-facing conformation by the activating cation (Na+ or H+) appears to be a common mechanism for ion-coupled transporters, e.g., the Na+/Cl−/γ-aminobutyric acid (GAT1; Hilgemann and Lu, 1999), H+/dipeptide (PEPT1; Mackenzie et al., 1996), glutamate (EAAT; Wadiche et al., 1995), Na+/Pi cotransporter (NaPi; Forster et al., 2002), and H+/lactose transporters (Abramson et al., 2003).
(c) The rising phase of charge movement is due to the transition C2→C1→C1a. The implication is that the charge associated with the C1 to C1a transition is greater than that with the dissociation of Na+, C2→C1. The observation of a rising phase (with large depolarizing steps) requires that the major charge be associated with the empty transporter.
(d) A charge associated with Na+ binding/dissociation. This is not observed experimentally, although it is indicated in the simulation (compare Fig. 15, A and C). This suggests that the predicted charge is either extremely fast, within 80 μs (settling time of the cut-open oocyte voltage clamp), or that the amount of charge associated with this step is very small (beyond the resolution of the current measurements).
Conclusions
Our application of perturbation methods to SGLT1 by recording charge and fluorescence signals upon step jumps in membrane voltage have permitted the study of partial reactions of the transport cycle. In the absence of sugar and Na+, we have obtained evidence for four states (C1, C1a, C1b, and C6). Transitions between C1 and C6 carried most of the charge, and are the major voltage-dependent steps in the overall Na+/glucose cotransport cycle. C1, C1a and C1b are unstable conformations. Transitions between C1 and C6 contribute the most to charge and ΔF measurements, i.e., the major voltage-dependent step in the overall transport cycle is the “return” of the unloaded carrier between the interior and exterior surfaces of the membrane. The kinetic states (obtained from charge movement studies) are also supported by the fluorescence measurements.
In general, TMR6M bound to Q457C exhibited fluorescence changes with a time course similar to charge movement. This suggests that global conformational changes monitored by charge movement are reflected by conformational changes at or near Q457C. However, there are subtle differences: the local conformations occurred BEFORE charged transitions from C6 to C2 and AFTER charged transitions from C2 to C6. Finally, the combination of charge and fluorescence recordings at different locations in the protein may be used to construct a spatial map of the conformational changes of the transporter.
Major unresolved questions include the charge associated with Na+ association and dissociation with the transporter (very fast and/or very small), the order of the binding and dissociation of the two Na+ ions, and the nature of the cooperativity between the two Na+ binding sites. Resolving these issues has important implications for both the kinetics of SGLT1 charge movement and the kinetics of Na+/glucose cotransport.
Acknowledgments
We thank E. Gallardo, D. Leung, M. Lai-Bing, A. Johnson, and K. Edwards for the preparation, injection, and care of oocytes, and Dr. Dan Sigg for valuable discussions on fast charge movements.
This research was supported by National Institutes of Health grant DK19567.
Olaf S. Andersen served as editor.
Abbreviations used in this paper: au, arbitrary unit of fluorescence intensity; SGLT1, Na+/glucose cotransporter; TMR6M, tetramethylrhodamine-6-maleimide.
Footnotes
Since the V0.5 for charge is very negative in the absence of Na (∼−200 mV), some SGLT charge is being subtracted using the P/4 protocol. However, it does not invalidate the conclusions of the present study because the time course of the fast charge movement was not altered since the time constants were independent of voltage (Fig. 6 C).
References
- Abramson, J., I. Smirnova, V. Kasho, G. Verner, H.R. Kaback, and S. Iwata. 2003. Structure and mechanism of the lactose permease of Escherichia coli. Science. 301:610–615. [DOI] [PubMed] [Google Scholar]
- Bezanilla, F., and C.M. Armstrong. 1977. Inactivation of the sodium channel. I. Sodium current experiments. J. Gen. Physiol. 70:549–566. [DOI] [PMC free article] [PubMed] [Google Scholar]
- Bezanilla, F., and E. Stefani. 1998. Gating currents. Methods in Enzymology. Vol. 293, Ion Channels, Part B. P.M. Conn, editor. Academic Press, New York. 331–352. [DOI] [PubMed]
- Bezanilla, F., E. Perozo, D.M. Papazian, and E. Stefani. 1991. Molecular basis of gating charge immobilization in Shaker potassium channels. Science. 254:679–683. [DOI] [PubMed] [Google Scholar]
- Cha, A., and F. Bezanilla. 1997. Characterizing voltage-dependent conformational changes in the Shaker K+ channel with fluorescence. Neuron. 19:1127–1140. [DOI] [PubMed] [Google Scholar]
- Cha, A., and F. Bezanilla. 1998. Structural implications of fluorescence quenching in the Shaker K+ channel. J. Gen. Physiol. 112:391–408. [DOI] [PMC free article] [PubMed] [Google Scholar]
- Chen, X.-Z., M.J. Coady, and J.-Y. Lapointe. 1996. Fast voltage clamp discloses a new component of presteady-state currents from the Na+-glucose cotransporter. Biophys. J. 71:2544–2552. [DOI] [PMC free article] [PubMed] [Google Scholar]
- Díez-Sampedro, A., D.D.F. Loo, E.M. Wright, and B.A. Hirayama. 2004. Coupled sodium-glucose cotransport by SGLT1 requires a negative charge at position 454. Biochemistry. 43:13175–13184. [DOI] [PubMed] [Google Scholar]
- Eskandari, S., D.D.F. Loo, and E.M. Wright. 1999. Functional asymmetry of the sodium/glucose cotransporter. FASEB J. A399 (Abstr). [Google Scholar]
- Falk, S., A. Guay, C. Chenu, S.D. Patil, and A. Berteloot. 1998. Reduction of an eight-state mechanism of transport to a six-state model using a new computer program. Biophys. J. 74:816–830. [DOI] [PMC free article] [PubMed] [Google Scholar]
- Forster, I.C., K. Kohler, J. Biber, and H. Murer. 2002. Forging the link between structure and function of electrogenic cotransporters: the renal type IIa Na+/Pi cotransporter as a case study. Prog. Biophys. Mol. Biol. 80:69–108. [DOI] [PubMed] [Google Scholar]
- Hazama, A., D.D.F. Loo, and E.M. Wright. 1997. Presteady-state currents of the Na+/glucose cotransporter (SGLT1). J. Membr. Biol. 155:175–186. [DOI] [PubMed] [Google Scholar]
- Hilgemann, D.W., and C.-C. Lu. 1999. GAT1 (GABA:Na+:Cl−) cotransport function: database reconstruction with an alternating access model. J. Gen. Physiol. 114:459–475. [DOI] [PMC free article] [PubMed] [Google Scholar]
- Hirayama, B.A., A. Diez-Sampedro, and E.M. Wright. 2001. Common mechanisms of inhibition for the Na+/glucose (hSGLT1) and Na+/Cl−/GABA (hGAT1) cotransporters. Br. J. Pharmacol. 134:484–495. [DOI] [PMC free article] [PubMed] [Google Scholar]
- Krofchick, D., S.A. Huntley, and M. Silverman. 2004. Transition states of the high-affinity rabbit Na+/glucose cotransporter SGLT1 as determined from measurement and analysis of voltage-dependent charge movements. Am. J. Physiol. Cell Physiol. 287:C46–C54. [DOI] [PubMed] [Google Scholar]
- Krofchick, D., and M. Silverman. 2003. Investigating the conformational states of the rabbit Na+/glucose cotransporter. Biophys. J. 84:3690–3702. [DOI] [PMC free article] [PubMed] [Google Scholar]
- Larsson, H.P., A.V. Tzingounis, H.P. Koch, and M.P. Kavanaugh. 2004. Fluorometric measurements of conformational changes in glutamate transporters. Proc. Natl. Acad. Sci. USA. 101:3951–3956. [DOI] [PMC free article] [PubMed] [Google Scholar]
- Li, M., R.A. Farley, and H.A. Lester. 2000. An intermediate state of the γ-aminobutyric acid transporter GAT1 revealed by simultaneous voltage clamp and fluorescence. J. Gen. Physiol. 115:491–508. [DOI] [PMC free article] [PubMed] [Google Scholar]
- Li, M., and H.A. Lester. 2002. Early fluorescence signals detect transitions at mammalian serotonin transporters. Biophys. J. 83:206–218. [DOI] [PMC free article] [PubMed] [Google Scholar]
- Loo, D.D.F., S. Eskandari, K.J. Boorer, H.K. Sarkar, and E.M. Wright. 2000. Role of Cl− in electrogenic Na+-coupled cotransporters GAT1 and SGLT1. J. Biol. Chem. 275:37414–17422. [DOI] [PubMed] [Google Scholar]
- Loo, D.D.F., S. Eskandari, B.A. Hirayama, and E.M. Wright. 2002. A kinetic model for secondary active transport. IAMS Volumes in Mathematics and its Applications. Volume 129. A. Weinstein and H. Layton, editors. Springer Verlag, New York. 65–83.
- Loo, D.D.F., A. Hazama, S. Supplisson, E. Turk, and E.M. Wright. 1993. Relaxation kinetics of the Na+/glucose cotransporter. Proc. Natl. Acad. Sci. USA. 90:5767–5771. [DOI] [PMC free article] [PubMed] [Google Scholar]
- Loo, D.D.F., B.A. Hirayama, E.M. Gallardo, J.T. Lam, E. Turk, and E.M. Wright. 1998. Conformational changes couple Na+ and glucose transport. Proc. Natl. Acad. Sci. USA. 95:7789–7794. [DOI] [PMC free article] [PubMed] [Google Scholar]
- Loo, D.D.F., B.A. Hirayama, A.-K. Meinild, G. Chandy, T. Zeuthen, and E.M. Wright. 1999. Passive water and ion transport by cotransporters. J. Physiol. 518:195–202. [DOI] [PMC free article] [PubMed] [Google Scholar]
- Mackenzie, B., D.D.F. Loo, and E.M. Wright. 1998. Relationship between Na+/glucose cotransporter (SGLT1) currents and fluxes. J. Membr. Biol. 162:101–106. [DOI] [PubMed] [Google Scholar]
- Mackenzie, B., D.D.F. Loo, Y. Fei, W.J. Liu, V. Ganapathy, F.H. Leibach, and E.M. Wright. 1996. Mechanisms of the human intestinal H+-coupled oligopeptide transporter hPEPT1. J. Biol. Chem. 271:5430–5437. [DOI] [PubMed] [Google Scholar]
- Mager, S.J., N. Kleinberger-Dorn, G.I. Keshet, N. Davidson, B.I. Kanner, and H.A. Lester. 1996. Ion binding and permeation at the GABA transporter GAT1. J. Neurosci. 16:5405–5414. [DOI] [PMC free article] [PubMed] [Google Scholar]
- Mager, S., J. Naeve, M. Quick, C. Labarca, N. Davidson, and H.A. Lester. 1993. Steady-states, charge movements, and rates for a cloned GABA transporter expressed in Xenopus oocytes. Neuron. 10:177–188. [DOI] [PubMed] [Google Scholar]
- Meinild, A.-K., B.A. Hirayama, E.M. Wright, and D.D.F. Loo. 2002. Fluorescence studies of ligand-induced conformational changes of the Na+/glucose cotransporter. Biochemistry. 41:1250–1258. [DOI] [PubMed] [Google Scholar]
- Meinild, A.-K., D.D.F. Loo, B.A. Hirayama, E. Gallardo, and E.M. Wright. 2001. Evidence for the involvement of Ala 166 in coupling Na+ to sugar transport through the human Na+/glucose cotransporter. Biochemistry. 40:11897–11904. [DOI] [PubMed] [Google Scholar]
- Panayotova-Heiermann, M., D.D.F. Loo, and E.M. Wright. 1995. Kinetics of steady-state currents and charge movements associated with the rat Na+/glucose cotransporter. J. Biol. Chem. 270:27099–27105. [DOI] [PubMed] [Google Scholar]
- Parent, L., S. Supplisson, D.D.F. Loo, and E.M. Wright. 1992. Electrogenic properties of the cloned Na+/glucose cotransporter: II. A transport model under nonrapid equilibrium conditions. J. Membr. Biol. 130:203. [DOI] [PubMed] [Google Scholar]
- Quick, M., D.D.F. Loo, and E.M. Wright. 2001. Neutralization of a conserved amino acid residue in the human Na+/glucose transporter (hSGLT1) generates a glucose-gated H+ channel. J. Biol. Chem. 276:1728–1734. [DOI] [PubMed] [Google Scholar]
- Quick, M., J. Tomasevic, and E.M. Wright. 2003. Functional asymmetry of the human Na+/glucose transporter (hSGLT1) in bacterial membrane vesicles. Biochemistry. 42:9147–9152. [DOI] [PubMed] [Google Scholar]
- Sauer, G.A., G. Nagel, H. Koepsell, E. Bamberg, and K. Hartung. 2000. Voltage and substrate dependence of the inverse transport mode of the rabbit Na+/glucose cotransporter (SGLT1). FEBS Lett. 469:98–100. [DOI] [PubMed] [Google Scholar]
- Stefani, E., and F. Bezanilla. 1998. Cut-open oocyte voltage-clamp technique. Methods in Enzymology. Vol. 298. Ion Channels, Part B. P.M. Conn, editor. Academic Press, New York. 300–318. [DOI] [PubMed]
- Stefani, E., L. Toro, E. Perozo, and F. Bezanilla. 1994. Gating of Shaker K+ channels: I. Ionic and gating currents. Biophys. J. 66:996–1010. [DOI] [PMC free article] [PubMed] [Google Scholar]
- Su, A., S. Mager, S.L. Mayo, and H.A. Lester. 1996. A multi-substrate single-file model for ion-coupled transporters. Biophys. J. 70:762–777. [DOI] [PMC free article] [PubMed] [Google Scholar]
- Taglialatela, M., L. Toro, and E. Stefani. 1992. Novel voltage clamp to record small, fast currents from ion channels expressed in Xenopus oocytes. Biophys. J. 61:78–82. [DOI] [PMC free article] [PubMed] [Google Scholar]
- Umbach, J.A., M.J. Coady, and E.M. Wright. 1990. Intestinal Na+/glucose cotransporter expressed in Xenopus oocytes is electrogenic. Biophys. J. 57:1217–1224. [DOI] [PMC free article] [PubMed] [Google Scholar]
- Wadiche, J.I., J.L. Arriza, S. Amara, and M.P. Kavanaugh. 1995. Kinetics of a human glutamate transporter. Neuron. 14:1019–1027. [DOI] [PubMed] [Google Scholar]
- Whitlow, R.D., A. Sacher, D.D.F. Loo, N. Nelson, and S. Eskandari. 2003. The anticonvulsant valproate increases the turnover rate of γ-aminobutyric acid transporters. J. Biol. Chem. 278:17716–17726. [DOI] [PubMed] [Google Scholar]
- Zampighi, G.A., M. Kreman, K.J. Boorer, D.D.F. Loo, F. Bezanilla, G. Chandy, J.E. Hall, and E.M. Wright. 1995. A method for determining the unitary functional capacity of cloned channels and transporters expressed in Xenopus laevis oocytes. J. Membr. Biol. 148:65–78. [DOI] [PubMed] [Google Scholar]