

Abstract
The Na+/K+-ATPase is a ubiquitous plasma membrane ion pump that utilizes ATP hydrolysis to regulate the intracellular concentration of Na+ and K+. It is comprised of at least two subunits, a large catalytic α subunit that mediates ATP hydrolysis and ion transport, and an ancillary β subunit that is required for proper trafficking of the holoenzyme. Although processes mediated by the α subunit have been extensively studied, little is known about the participation of the β subunit in conformational changes of the enzyme. To elucidate the role of the β subunit during ion transport, extracellular amino acids proximal to the transmembrane region of the sheep β1 subunit were individually replaced for cysteines. This enabled sulfhydryl-specific labeling with the environmentally sensitive fluorescent dye tetramethylrhodamine-6-maleimide (TMRM) upon expression in Xenopus oocytes. Investigation by voltage-clamp fluorometry identified three reporter positions on the β1 subunit that responded with fluorescence changes to alterations in ionic conditions and/or membrane potential. These experiments for the first time show real-time detection of conformational rearrangements of the Na+/K+-ATPase through a fluorophore-labeled β subunit. Simultaneous recording of presteady-state or stationary currents together with fluorescence signals enabled correlation of the observed environmental changes of the β subunit to certain reaction steps of the Na+/K+-ATPase, which involve changes in the occupancy of the two principle conformational states, E1P and E2P. From these experiments, evidence is provided that the β1-S62C mutant can be directly used to monitor the conformational state of the enzyme, while the F64C mutant reveals a relaxation process that is triggered by sodium transport but evolves on a much slower time scale. Finally, shifts in voltage dependence and kinetics observed for mutant K65C show that this charged lysine residue, which is conserved in β1 isoforms, directly influences the effective potential that determines voltage dependence of extracellular cation binding and release.
Keywords: voltage-clamp fluorometry, conformational change, kinetics, electrogenic steps, subunit interaction
INTRODUCTION
Regulation of cellular ionic concentrations is critical for cell homeostasis. The ion pump that actively generates the physiological Na+ and K+ concentration gradients across the plasma membrane of animal cells is the Na+/K+-ATPase (EC 3.6.1.37). It utilizes the energy from ATP hydrolysis for active Na+ extrusion and K+ import and is a member of the P-type ATPase family, so called because all of these proteins are transiently phosphorylated upon ATP hydrolysis (Axelsen and Palmgren, 1998).
The reaction cycle of the Na+/K+-ATPase is described by the Albers-Post scheme (Fig. 1 A), where the enzyme can assume two principle conformational states, E1 and E2 (Albers, 1967; Post et al., 1972). In E1, three Na+ ions bind cytoplasmically for subsequent ion transport across the membrane, while two K+ ions bind to extracellular sites when the protein is in the E2 conformation for transport into the cell. Phosphorylation at a highly conserved aspartic acid residue within the consensus sequence DKTGTLT occurs after Na+ binding but before ion transport. The complete reaction is electrogenic as the pump mediates a net movement of charge, three sodium ions for two potassium ions. The main electrogenic events are the extracellular Na+ release/rebinding steps, which are kinetically coupled to the E1P–E2P conformational change (Fendler et al., 1985, 1993; Nakao and Gadsby, 1986; Rakowski, 1993; Hilgemann, 1994; Friedrich and Nagel, 1997; Holmgren et al., 2000).
Figure 1.

(A) Albers-Post scheme for the Na+/K+ ATPase reaction cycle. (B) Scheme of the experimental setup used for voltage-clamp fluorometry. (C) Schematic diagram of the transmembrane domain and adjacent residues of the sheep β1 subunit of the Na+/K+-ATPase. The diagram depicts residues Arg-27 to Ala-73; in bold are shown the 11 residues Met-57 to Tyr-67, which were individually replaced by cysteines for the purpose of site-directed fluorescence labeling. Three residues that demonstrate significant fluorescence changes in response to voltage pulses are colored red.
The Na+/K+-ATPase is comprised of at least two mandatory subunits. The large catalytic α subunit contains ∼1,000 residues with 10 transmembrane domains. A number of reviews discuss the transport reaction, ligand binding, and conformational transitions that occur on this subunit (Jorgensen and Pedersen, 2001; Kaplan, 2002; Kühlbrandt, 2004). A major development in molecular understanding of P-type ATPases was the elucidation of the crystal structure of the sarcoplasmic reticulum Ca2+-ATPase (SERCA), which was solved in both the E1 and E2 conformations (Toyoshima et al., 2000, 2004; Toyoshima and Nomura, 2002; Toyoshima and Mizutani, 2004). SERCA has a high homology to the Na+/K+-ATPase α subunit (Sweadner and Donnet, 2001), and recent electron microscopy studies suggest that the two ion pumps share the same global structure (Hebert et al., 2001). Based on these structures and using voltage-clamp fluorometry, an extracellular position in the M5–M6 loop was identified that can be used to quantify the distribution between E1 and E2 states in situ (Geibel et al., 2003).
The Na+/K+-ATPase and H+/K+-ATPase are the only members of the P-type ATPase family known to contain a β subunit (Lutsenko and Kaplan, 1995). The Na+/K+-ATPase β subunit is a type II transmembrane glycoprotein with ∼300 amino acids. The protein contains three N-linked glycosylation sites, which are conserved throughout all β subunit isoforms of various species (Laughery et al., 2003), and three disulfide bonds. The disulfides are required for targeting to the plasma membrane and are highly resistant to reduction (Lutsenko and Kaplan, 1993; Laughery et al., 2003). The β subunit serves two primary functions. First, it acts as a chaperone that promotes proper membrane insertion of the α subunit (Geering et al., 1989; Beguin et al., 1998, 2000), and second, it modulates cation sensitivity of the pump (Jassier et al., 1994; Geering et al., 1996; Hasler et al., 1998).
Although no high resolution structure of the β subunit is available, multiple interactions between the α and β subunits have been identified. A 64-residue exocytoplasmic region adjacent to the transmembrane domain of the β subunit has been shown to influence proper membrane insertion and structural maturation (Colonna et al., 1997; Beguin et al., 1998, 2000). Furthermore, scanning tryptophan mutagenesis on the β subunit suggests that at least two faces of the β subunit contribute to inter- or intrasubunit interactions (Hasler et al., 2001). Conformational flexibility has also been observed where the β subunit has two distinct tryptic digest profiles when the holoenzyme is in the E1 or E2 conformation (Lutsenko and Kaplan, 1994).
Many of these studies are limited because the ion pump can only be examined under certain steady-state conditions. To obtain time-resolved and spatially well-defined information, voltage-clamp fluorometry was used to delineate real-time conformational rearrangements of the Na+/K+-ATPase using a fluorophore-labeled β subunit. This technique has been successfully used to analyze conformational changes of a variety of membrane channels and transporters, such as the Shaker potassium channel (Mannuzu et al., 1996; Cha and Bezanilla, 1997), the HERG potassium channel (Smith and Yellen, 2002), the Na+/K+-ATPase (Geibel et al., 2003), and the EAAT1 glutamate transporter (Larsson et al., 2004).
Thus, since little is known of the interaction of the β subunit during the catalytic cycle of the Na+/K+-ATPase, the objective of this study was to identify and analyze real-time conformational changes of Na+/K+-ATPase using scanning cysteine mutagenesis followed by site-specific tetramethylrhodamine-maleimide labeling and voltage-clamp fluorometry. Our results, for the first time, demonstrate time-resolved conformational rearrangements of the Na+/K+-ATPase using a fluorophore-labeled β subunit that does not modify the kinetics of the ion pump. The changes in the attached fluorophore's environment can directly be related to the electrical and/or kinetic properties of charge transport and the main conformational change between E1 and E2 conformations, which are coupled to charge-translocating processes. However, the kinetic behavior at each residue is distinct, exhibiting either one or two exponential phases with different time scales. The fluorescence amplitudes follow a characteristic voltage dependence that is equivalent to that of transient currents under K+-free conditions by the Na+/K+-ATPase. Finally, we demonstrate that neutralization of a charged lysine residue at the extracellular interface of the β subunit's transmembrane domain modulates the voltage dependence of electrogenic Na+ transport steps.
MATERIALS AND METHODS
Molecular Biology
The cDNA of a sheep Na+/K+-ATPase α1 subunit construct without extracellulary exposed cysteine residues (containing mutations C911S and C964A) (Hu and Kaplan, 2000) and of the sheep β1 subunit were subcloned into vector pTLN (Lorenz et al., 1996) as described previously (Geibel et al., 2003). In addition, reduced ouabain sensitivity (mM range) was obtained following introduction of mutations Q111R and N122D into the α1 subunit cDNAs, resulting in a cDNA construct that will be referred to as sNaKα1, ØCys. This construct was used for all coexpression experiments with β1 subunit constructs, which allowed for the selective inhibition of the endogenous oocyte Na+/K+-ATPase, since the latter has an ouabain sensitivity in the micromolar range (Price and Lingrel, 1988). Single cysteine mutations in the transmembrane/extracellular interface of the sheep β1 subunit were introduced by QuikChange Site-Directed Mutagenesis Kit (Stratagene) and verified by sequencing. The β1 subunit constructs are further identified by the original amino acid residue and substituted amino acid (e.g., sβ1-M57C, where cysteine was substituted for methionine at residue 57).
Oocyte Preparation and cRNA Injection
The cRNA was prepared using the SP6 mMessage mMachine kit (Ambion). A 50-nL aliquot of cRNA, which included 15–25 ng of α subunit and 1.5–2.5 ng of β subunit, was injected into each Xenopus oocyte. Oocytes were obtained by collagenase treatment after partial ovarectomy from Xenopus laevis. After injection, oocytes were kept in ORI buffer (90 mM NaCl, 2 mM KCl, 2 mM CaCl2, 5 mM MOPS, pH 7.4) containing 1 mg/ml gentamycin at 18°C for 3–5 d.
Before measurements, oocytes were incubated for 45 min in loading buffer (110 mM NaCl, 2.5 mM Na-citrate, 10 mM MOPS, Tris, pH 7.4) and 45 min in post-loading buffer (100 mM NaCl, 1 mM CaCl2, 5 mM BaCl2, 5 mM NiCl2, 5 mM MOPS/Tris, pH 7.4) to elevate the intracellular Na+ concentration (Rakowski, 1993). Cysteine-specific fluorescence labeling was achieved by incubating Na+-loaded oocytes in post-loading buffer containing 5 μM tetramethylrhodamine-6-maleimide (TMRM; Molecular Probes) for 5–10 min at room temperature in the dark, followed by washes in dye-free buffer. Measurements under Na+/Na+-exchange conditions were performed in Na+ test solution (100 mM NaCl, 5 mM BaCl2, 5 mM NiCl2, 10 μM ouabain, 5 mM Mops, Tris, pH 7.4). For Na+/K+ titration experiments and stationary pump current recordings, 0.1–10 mM K+ were replaced for equimolar amounts of Na+. For K+/NMDG titration experiments, 0.1–1 mM K+ was combined with NMDG for a final ionic concentration of 100 mM. Heterologously expressed Na+/K+-ATPase was largely inhibited by 10 mM ouabain.
Two-electrode Voltage-clamp Epifluorescence Measurements
An oocyte perfusion chamber was mounted on the stage of a fluorescence microscope (Axioskop 2FS, Carl Zeiss MicroImaging, Inc.), equipped with a 40× water immersion objective (numerical aperture = 0.8) (Fig. 1 B). Currents were measured using a two-electrode voltage-clamp amplifier CA-1B (Dagan Instruments). Fluorescence was excited by a 100-W tungsten lamp using a 535DF50 excitation filter, a 565 EFLP emission filter, and a 570DRLP dichroic mirror (Omega Optical). Fluorescence was measured with a PIN-022A photodiode (United Detector Technologies) mounted to the microscope camera port. Photodiode signals were amplified by a patch clamp amplifier EPC-5 (HEKA Electronics). Fluorescence and current signals were simultaneously recorded and subsequently analyzed with Clampex 8.0 software (Axon Instruments).
Fluorophore Bleaching Correction
As absolute comparability of the fluorescence amplitudes under various ionic conditions and membrane potentials was essential, the time course of the fluorescence level during a continuous oocyte experiment was recorded with a chart recorder (Kipp & Zonen) to correct for the slow fluorophore bleaching during continuous illumination. To account for the loss of specific voltage jump–induced fluorescence change signals due to bleaching, a recording of fluorescence traces under standard conditions (Na+ test solution) was performed before and after each change of the ionic conditions and used for normalization.
Measurement and Analysis of Transient Currents
Transient Na+/K+-ATPase currents under Na+/Na+ exchange conditions were obtained as the difference between current responses to a specific voltage step in Na+ test solution containing first 10 μM and second 10 mM ouabain in order to block the endogenous and heterologously expressed ouabain-insensitive form of the Na+/K+-ATPase, respectively (Price and Lingrel, 1988). Time constants were obtained from monoexponential fits to the data. The first few milliseconds after the voltage step were excluded to avoid artifacts arising from capacitance charging of the oocyte membrane. The displaced charge (Q) is the time integral of the fitted currents, extrapolated to onset of voltage pulses. The resulting Q–V curves were fitted according to a Boltzmann function:
 |
where Qmax and Qmin are the saturation values of displaced charge, V0.5 is the voltage of half-maximal activation, zq is the fraction of charge that is displaced through the entire transmembrane field, F is the Faraday constant, R is the molar gas constant, T is temperature (in Kelvin), and V is the transmembrane potential. All experiments were performed at 20–22°C.
Determination of the Apparent K0.5 Value for Extracellular K+
Saturation values of the fluorescence signals (F) in response to steps to different membrane potentials (V) under Na+/Na+ exchange conditions or Na+/K+ exchange conditions in the presence or absence (i.e., replacement by NMDG) of Na+ were obtained from monoexponential fits to the data traces. The total fluorescence change in amplitude (ΔFtot) was calculated as the maximal difference in fluorescence saturation values in the presence of 100 mM Na+ at extreme positive (+60 mV) and negative (−200 mV) potentials. This value represents the maximal possible change in the stationary distributions of states between E1P and E2P conformations, since the voltage dependence of the fluorescence saturation values [(1 − ΔF)–V curve] under K+-free conditions (Na+ test solution) is equivalent to the voltage dependence of voltage jump–induced charge transport (Q–V curve), and therefore is a direct measure of the stationary distribution of conformational states between E1P and E2P (as shown in Fig. 3). Then, for a given [K+], the difference between fluorescence saturation values at −200 mV (F[K+](−200 mV)) and that at a voltage (V) of interest (F[K+](V)) was calculated, yielding a value ΔF[K+](V). The fractional fluorescence change F [K+](V), which is a measure of the change in the stationary distribution of E1-like and E2-like conformational states induced by [K+], was determined according to the equation
 |
and plotted against the respective K+ concentration. The data were fitted using the Hill equation
 |
where Vmax is maximal fluorescence shift, [K+] is the K+ concentration, n is the cooperativity number, C represents the fractional fluorescence change at zero [K+], and K0.5 is an apparent constant for the interaction of extracellular K+ with the pump.
Figure 3.

Voltage pulse–induced fluorescence responses of the Na+/K+-ATPase with different single cysteine mutants of the β subunit under K+-free (Na+/Na+ exchange) conditions. Recordings originated from oocytes coexpressing the α subunit construct sNaKα1, ØCys together with sβ1-S62C (A), sβ1-F64C (B), sβ1-K65C (C). D shows the applied voltage protocol. Voltage jumps were performed from a holding potential of −80 mV to values between +60 mV and −200 mV in 20-mV steps. Since hyperpolarizing potentials result in an increase in fluorescence, negative potentials are shown at the top and positive potentials at the bottom of the voltage protocol. Note the expanded time scale for the recording in B. Voltage jump–induced transient currents, obtained as ouabain-sensitive difference currents (see materials and methods) recorded in parallel to fluorescence change signals for S62C (E), F64C (F), and K65C (G).
RESULTS
Stationary Current and Fluorescence Measurements
Following scanning cysteine mutagenesis of the β subunit, cRNAs of 11 β-subunit constructs (sβ1-M57C to sβ1-T67C, Fig. 1 C) were coinjected with sNaKα1, ØCys cRNA in Xenopus oocytes. Functional expression was assessed by measuring stationary pump currents upon addition of 10 mM K+ in two-electrode voltage-clamp experiments (Fig. 2 A). Each coinjection resulted in robust stationary currents with amplitudes similar to the sNaKα1, ØCys/sβ1-WT ion pump. All solutions contained 10 μM ouabain to inhibit the endogenous Na+/K+-ATPase of the oocytes. The K+-induced stationary currents were largely inhibited by 10 mM ouabain, proof that the currents measured are directly attributable to the heterologously expressed Na+/K+-ATPase with reduced ouabain sensitivity. Complete inhibition cannot be achieved by 10 mM ouabain due to the value of half-maximal inhibition of ∼2 mM for this construct (Horisberger and Kharoubi-Hess, 2002). Interestingly, mutant sβ1-P66C, where a proline residue that is conserved throughout all known species isoforms of the Na+/K+-ATPase β subunit (Axelsen and Palmgren, 1998) was mutated to cysteine, was functional, suggesting that this residue is not required for proper folding and transport of the α/β complex to the plasma membrane or function.
Figure 2.

Stationary current and fluorescence measurements of Na+/K+-ATPase α/β complexes containing different β subunit constructs upon expression in Xenopus oocytes. (A) Stationary pump currents of the Na+/K+-ATPase expressed with wild-type and single cysteine mutants of the β subunit at 0 mV holding potential in response to 10 mM K+. Data originated from 5–11 oocytes; values are means ± SEM. (B) Parallel recording of pump current (top) and fluorescence change (bottom) from an oocyte coinjected with Na+/K+-ATPase sNaKα1, ØCys and sβ1 -F64C cRNA in response to 10 mM K+ and 10 mM ouabain at 0 mV holding potential.
Subsequent stationary current measurements after labeling with TMRM identified three sβ1 mutants (S62C, F64C, and K65C) that exhibited significant (>5%) fluorescence changes in response to voltage steps under K+-free conditions or concurrent with changes in extracellular ionic conditions that induce stationary Na+/K+ exchange currents. Coexpression of sNaKα1, ØCys with the sβ1-E63C construct gave rise to fluorescence changes (<1%) that were too small for kinetic analysis and were not further analyzed. For each of the above three sβ1 single cysteine mutants, addition of extracellular K+ to the oocyte resulted in an increase of fluorescence, as exemplified in Fig. 2 B for an oocyte expressing sNaKα1, ØCys + sβ1-F64C. Application of 10 mM ouabain, in the presence of K+, largely inhibited ion transport and fluorescence changes, which indicates that the latter are directly attributable to the heterologously expressed Na+/K+-ATPase. In these experiments, it was observed that the decay of the fluorescence signal is more rapid than for the stationary current both after removal of extracellular K+ and upon application of ouabain (Fig. 2 B). This is most likely the result of solution flow and data acquisition. As the solution is being changed, current measurement is from the entire cell, while the fluorescence measurement is only from the top half of the oocyte, thus locally inhomogenous solution exchange around the oocyte could result in a differential off rate between fluorescence and current.
From the similarity between stationary currents and the fluorescence changes upon extracellular K+ addition, the observed fluorescence changes can be correlated with pump conformational transitions on the basis of the Albers-Post scheme for the Na+/K+-ATPase reaction cycle. Since dephosphorylation is slow in the absence of K+, the E2P conformation accumulates to a high extent (Cornelius and Skou, 1985). Turnover is increased upon addition of K+, which stimulates dephosphorylation, and the E2P conformation is depleted in favor of E1 states. Therefore, the low fluorescence under K+-free conditions can be assigned mainly to the E2P conformation, whereas high fluorescence measured in the presence of K+ is indicative of the E1 state. Note that fluorescence changes can be the result of either environmental variations due to differential quenching by water or parts of the protein or could be due to exposure to purely hydrophilic/hydrophobic environments. These possibilities can only be resolved with spectral resolution of the fluorescence changes. It is important to note that the K+-induced fluorescence changes of all the above-mentioned sβ1 constructs show an increase in fluorescence upon addition of K+, which leads to an accumulation of E1-like states. This agrees with the fluorescence change previously observed for reporter position N790C on the Na+/K+-ATPase α subunit close to the extracellular end of helix M5, which was implicated to play a role in energy transduction (Geibel et al., 2003).
During these experiments, it was unknown whether secondary fluorophore labeling of native cysteine residues would be observed. However, with the absence of visible labeling in the case of the sNaKα1,ØCys/sβ1-WT coexpression or among the remaining seven sβ1 single cysteine mutants that exhibit no detectable fluorescence changes upon voltage jumps or induction of stationary pump currents, it appears that the fluorophore does not interact with the six native cysteine residues on the sβ1 subunit.
Fluorescence Changes during Na+/Na+ Exchange Conditions
Following identification of three residues that exhibited fluorescence changes in parallel with stationary pump current, we were interested in a more specific attribution of fluorescence signals to certain partial reactions of the Albers-Post cycle. Therefore, we performed voltage pulse experiments at high extracellular Na+ concentrations (100 mM) in the absence of K+. Under these conditions, the Na+/K+-ATPase carries out Na+/Na+ exchange (Nakao and Gadsby, 1986). Since dephosphorylation under K+-free conditions is very slow, the enzyme shuttles in a voltage-dependent manner almost exclusively between E1P and E2P. Increasingly hyperpolarizing potentials drive the enzyme in a saturating fashion into the E1P conformation, whereas depolarizing potentials lead to accumulation of E2P. Since this is accompanied by electrogenic Na+ reuptake and Na+ release, respectively, transient currents can be observed upon voltage jumps. The voltage dependence of displaced charge follows a Boltzmann distribution that reflects the distribution of the enzyme between E1P and E2P states. Therefore, comparison between the voltage dependence of fluorescence amplitudes and charge movement allows conclusions about the coupling of the observed environmental (conformational) changes to the major electrogenic event during the catalytic cycle, which is extracellular Na+ rebinding/release. A summary of voltage jump–induced fluorescence responses for the three sβ1 mutants S62C, F64C, and K65C recorded under Na+/Na+ exchange conditions is shown in Fig. 3. After a period at −80 mV holding potential, the cells were subjected to voltage test pulses (Fig. 3 D) between 60 and −200 mV (“on” pulses) in 20-mV steps, followed by a step back to −80 mV (“off” pulses). Note the different test pulse duration of 200 ms in case of mutants S62C and K65C, and of 1400 ms for mutant F64C.
Furthermore, the amplitudes and kinetics of the fluorescence changes were examined and the data were analyzed by fits of mono- or biexponential functions. The fit parameters were compared with the voltage dependence and kinetics of charge translocation during the E1P–E2P conformational change, as obtained from analyzing transient currents recorded in parallel to the fluorescence traces (Fig. 3, E–G). Whereas the fluorescence traces for the sβ1-S62C and sβ1-K65C constructs could be fitted with a single exponential, satisfactory fitting of the fluorescence signals of the sβ1-F64C mutant required the sum of two exponential functions. Plotting the saturating amplitudes of the fluorescence changes against the membrane potential [(1 − ΔF)–V] for each of the three residues results in a curve that follows a Boltzmann distribution (Fig. 4, A–C, solid symbols). The distributions of the displaced “on” charge, obtained by integrating transient current signals, are depicted for comparison (Fig. 4, A–C, open symbols). For all three mutants, the voltage dependence of the fluorescence amplitudes [(1 − ΔF)–V] is equivalent to the voltage dependence of charge movement (Q–V). Since the latter is a direct measure of the distribution of the enzyme between the E1P and E2P states, the (1 − ΔF)–V curve is equivalent to the distribution of transported charge and an indicator of the relative populations of E1P and E2P. In addition, as the relative populations of E1P and E2P are directly influenced by cation binding, and as the concentration of intracellular and extracellular Na+ concentration are held constant under Na+/Na+ exchange conditions, an increase in V0.5 at the same concentration of Na+ induces a larger shift toward E1P, which can be interpreted as a higher Na+ apparent affinity of this process.
Figure 4.

Voltage dependence and kinetics of voltage jump–induced fluorescence changes and comparison with properties of the corresponding transient charge movements under K+-free (Na+/Na+ exchange) conditions. Data originated from oocytes coexpressing the α subunit construct sNaKα1, ØCys together with sβ1-S62C (A and D), sβ1-F64C (B and E), sβ1-K65C (C and F). Left panels show the voltage dependences of normalized fluorescence saturation values (▪) obtained from mono- (A and C) and biexponential fits (B) to the data, and the corresponding normalized values for the translocated charge (□) obtained from integration of the transient currents recorded in parallel. Curve parameters are summarized in Table I. Right panels show the voltage dependence of reciprocal time constants obtained from monoexponential fits of the transient current traces before (▪) and after (□) labeling of oocytes with TMRM, together with reciprocal time constants from fits of fluorescence signals under K+-free conditions (▴) or in presence of K+ (99.9 mM Na+/0.1 mM K+, ○; 99.5 mM Na+/0.5 mM K+, •). Data are means ± SEM from six oocytes.
At this point, the involvement of the β subunit in a conformational change of the holoenzyme is demonstrated. Since under Na+/Na+ exchange conditions the voltage dependence of the steady-state (1 − ΔF)–V curves is equivalent to the distribution of the enzyme between E1P and E2P conformational states (as inferred from the Q–V plots), it can be concluded that the conformational state of the Na+/K+-ATPase can be directly monitored through the use of a fluorophore-labeled β subunit. Thus, the fluorescence response of the β subunit closely follows the E1P–E2P transition and is directly correlated to the main electrogenic step in the transport cycle, i.e., extracellular Na+ release/rebinding. However, as will be described in detail later, the temporal coupling between rearrangements of the α and the β subunit is distinct for all three amino acid positions investigated.
Comparison of the parameters for the Q–V and (1 − ΔF)–V curves reveals distinct differences between the three sβ1 constructs (Table I). Whereas similar values for V0.5 and zq were obtained for the (1 − ΔF)–V plots of sβ1-S62C and sβ1-F64C, the distribution is significantly shifted for sβ1-K65C (Student's t test <0.05). This behavior is exactly reflected by the values for V0.5 and zq of the Q–V plots. Whereas the parameters for sβ1-S62C are consistent with results obtained for the sheep α1/β1 wild-type enzyme, the increased V0.5 for sβ1-K65C suggests that mutation of this charged residue results in an increase in apparent affinity for extracellular Na+, even though the fraction of charge that is displaced through the entire membrane field (zq) is unchanged. It should be noted that there are significant variations in V0.5 reported in the literature that could be due to variations in experimental setup or the species of ion transporter analyzed (Nakao and Gadsby, 1986; Rakowski et al., 1991; Rakowski, 1993; Hilgemann, 1994; Friedrich and Nagel, 1997; Holmgren et al., 2000), and thus it is critical to compare V0.5 and zq within the same experimental conditions. Additionally, where earlier studies have analyzed the properties of native ion pump in Xenopus oocytes to determine V0.5, these studies include the expression of a heterologous complex whose properties can be quite distinct from the native transporter (Rakowski, 1993). From the equivalence of the (1 − ΔF)–V and the Q–V curves for all three sβ1 mutants, it can be concluded that the (1 − ΔF)–V plot for all residues can be used to determine the voltage dependence of charge transport and apparent Na+ affinity under Na+/Na+ exchange conditions. Surprisingly, the positive shift observed for the charge-neutralizing mutation K65C suggests that residues on the Na+/K+-ATPase β subunit directly affect the apparent Na+ affinity. Since the lysine residue at position 65 is conserved only among different β1 species isoforms, whereas neutral or polar residues are found in β2 or β3 isoforms (threonine in human β2, valine in human β3), sequence differences among different β isoforms may provide an additional tool for the adjustment of ion affinity and voltage dependence of ion transport according to tissue-specific requirements that are reflected by distinct expression patterns of the various α and β isoforms. An alternative explanation to the shift in Q–V and (1 − ΔF)–V curves is that mutation from a lysine to cysteine residue results in a change in the surface potential generated by surface charge unmasking/shielding. This would also result in a novel finding for the Na+/K+-ATPase. However, ion affinity and a change in surface potential are always interconnected, so that a clear separation cannot be made at this point.
TABLE I.
Boltzmann Parameters for (1 − ΔF)–V Curves
| Transient currents | Fluorescence changes | ||
|---|---|---|---|
| S62C | V0.5/mV | −80 ± 5 | −76 ± 2a |
| zq | 0.70 ± 0.10 | 0.79 ± 0.04 | |
| F64C | V0.5/mV | −75 ± 4 | −70 ± 1 |
| zq | 0.75 ± 0.08 | 0.83 ± 0.04 | |
| K65C | V0.5/mV | −50 ± 10 | −47 ± 1a |
| zq | 0.62 ± 0.17 | 0.84 ± 0.04 | |
| WTb | V0.5/mV | −74 ± 12 | |
| zq | 0.59 ± 0.16 |
The values are statistically significantly different (Student's t test < 0.05).
Geibel, S., personal communication; unpublished data.
Kinetics of Fluorescence Changes and Transient Currents during Na+/Na+ Exchange Conditions
To understand the kinetics of the fluorescence changes and transient currents under Na+/Na+ exchange conditions, the voltage dependence of reciprocal time constants of transient currents (from mono-exponential fits) and fluorescence changes (from mono- or biexponential fits) were compared. In addition, the influence of TMRM attachment on the kinetics of transient charge translocation was evaluated by measuring transient currents before and after labeling with TMRM.
Kinetics for mutant S62C
Under Na+/Na+ exchange conditions, the reciprocal time constants for the transient currents of the sβ1-S62C construct were ∼50 s−1 at 20°C and membrane potentials >0 mV (Fig. 4 D), and exhibited a characteristic voltage-dependent rise toward hyperpolarizing potentials. These values agree with published data obtained from heterologously expressed wild-type Na+/K+-ATPase in Xenopus oocytes (Rakowski, 1993; Holmgren and Rakowski, 1994). Binding of the fluorophore did not affect the kinetics of presteady-state charge movement of the mutated Na+/K+-ATPase (Fig. 4 D, open and closed squares). The reciprocal time constants from the fluorescence signals are also ∼50 s−1 at 20°C and zero or positive membrane potentials, however, the voltage-dependent rise at negative potentials is much smaller than in case of the transient currents (Fig. 4 D, triangles). At positive membrane voltages, transient current kinetics due to Na+ release follows the E1P–E2P transition of the pump. Under these conditions, the rate-limiting step is the conformational change, and therefore both the kinetics of the transient currents and fluorescence (which measures the conformational transition) are equivalent. At hyperpolarizing membrane voltages, however, reaction steps occur in the reverse sequence: first extracellular Na+ is bound, followed by the conformational transition E2P–E1P. The observed difference in kinetics can be accounted for by the assumption that the faster kinetics of the transient current is due to electrogenic Na+ binding, whereas fluorescence is sensitive to the conformational changes of the enzyme, which could be slower than the preceding ion binding reaction. In this instance, we are not measuring cation binding within the access channel, which is several orders of magnitude faster, instead we are measuring a combination of extracellular Na+ binding and a conformational transition that is kinetically linked to it (Hilgemann, 1994; Holmgren et al., 2000). It can be ruled out that the difference in kinetics is brought about by attachment of the TMRM fluorophore since there is no significant difference in the kinetics of transient currents in the absence or presence of the fluorophore. Under the assumption that the fluorescence level measured by the TMRM-labeled sβ1-S62C construct is a direct measure of the conformational state of the holoenzyme, at hyperpolarizing potentials, the conformational change lags behind the preceding electrogenic Na+ rebinding step. A similar phenomenon was observed in a previous study by our laboratory in which the TMRM fluorophore was linked to a cysteine residue (sα1 mutant N790C) at the extracellular end of helix M5 (Geibel et al., 2003). It is important to note that the detected fluorescence changes are still weakly voltage dependent. At hyperpolarizing potentials, the reciprocal time constant is accelerated. This provides experimental evidence that the conformational change of the ion pump exhibits an intrinsic voltage dependence that has been previously reported (Wuddel and Apell, 1995).
Kinetics for mutant F64C
As stated above, the fluorescence signals of the sβ1-F64C construct in response to voltage jumps under Na+/Na+ exchange conditions are biphasic. One component, which contributes to ∼75% to the total fluorescence change amplitude, is slower by nearly two orders of magnitude than for the sβ1-S62C construct (Fig. 4 E). The corresponding reciprocal time constant exhibits a shallow voltage dependence, changing from ∼1 s−1 at +60 mV to ∼2.5 s−1 at −200 mV. The reciprocal time constant of the second component, which contributes ∼25% to the total amplitude, is voltage independent with values around 30–40 s−1 (unpublished data). Furthermore, the low amplitude of this component makes a complete analysis unfeasible, although the voltage dependence of these amplitude components do appear to be linked to the conformational state of the ion pump (unpublished data). In contrast, the transient currents for the F64C construct roughly follow the same kinetics as those of sβ1-S62C or the wild-type enzyme with and without the fluorophore (Fig. 4, D and E). Therefore, none of the components of the fluorescence signal of sβ1-F64C can be correlated to the time course of charge translocation by the enzyme complex. In addition, although the kinetic parameters of Na+ translocation are equivalent for the sβ1-F64C and the sβ1-S62C construct, the environmental changes detected by the fluorophore only two amino acid residues apart are different. However the steady-state saturation fluorescence of both constructs still accurately describes the transporter charge distribution and E1P–E2P conformation. It is important to note, that the observed slow reciprocal time constant of the sβ1-F64C construct cannot correspond to a partial reaction during the enzyme's reaction cycle. If this was the case, a reaction proceeding with only 1–2.5 s−1 would certainly be rate limiting for turnover. This would result in dramatically smaller stationary currents compared with the sα1/sβ1 wild-type enzyme, which is not observed (see Fig. 2 A). However, in spite of this slow response, the reporter fluorophore attached to residue F64C is able to act as a sensor device for monitoring enzymatic activity. This is demonstrated by the changes in the stationary fluorescence level in response to extracellular K+ addition, which induces stationary Na+/K+ exchange current (Fig. 2 B).
Kinetics for Mutant K65C
Although fluorescence changes for the sβ1-K65C construct in response to voltage pulses under Na+/Na+ exchange conditions can be fit with a monoexponential function and are voltage dependent (Fig. 4 F, triangles), the kinetics of the fluorescence changes (8–25 s−1) are significantly slower than those of the S62C construct (45–70 s−1). Analysis of the time course of transient currents recorded under Na+/Na+ exchange conditions demonstrate that the transient currents of the K65C construct are significantly slower than those of either S62C or F64C under the same conditions (Fig. 4 F). This change in the kinetics of a reaction sequence, which involves the main electrogenic event during the transport cycle, is paralleled by a shifted Q–V curve for this construct and might also be due to the charge-neutralizing mutation K65C. Again, bound TMRM does not affect the transient current kinetics of the holoenzyme (Fig. 4 F, open and closed squares). However, the kinetics of the fluorescence changes are still slower and less voltage dependent than the reciprocal time constants from charge translocation. Thus, there is no direct temporal correlation between fluorescence changes (indicative of environmental changes due to conformational rearrangements) and presteady-state charge movement, although the voltage dependence of the steady-state (1 − ΔF)–V curve and the Q–V curve is equivalent. Therefore, the same considerations apply as in case of the F64C construct: amino acid substitution K65C and attachment of the TMRM fluorophore results in formation of a sensor complex that can be used to monitor enzymatic activity.
Fluorescence Changes during Na+/K+ Exchange Conditions
Voltage-clamp fluorometry represents an advantageous electrophysiological technique and enables presteady-state kinetic investigation of the Na+/K+-ATPase under physiological, i.e., Na+/K+ turnover conditions (Geibel et al., 2003). The only means of determining redistributions of reaction cycle intermediates by pure electrophysiology is detection and analysis of transient charge translocations. Although there are two reports in the literature in which transient currents under Na+/K+ turnover conditions were observed (Bahinski et al., 1988; Hilgemann, 1997), a detailed kinetic analysis of the signals has never been performed, due to a number of difficulties. (a) Upon addition of K+, a redistribution of reaction cycle intermediates takes place. Addition of K+ introduces another step(s) that reduces the overall electrogenicity of the ion pump as compared with Na+/Na+ exchange conditions . Therefore, the amplitude of the transient currents that can be influenced by the membrane potential decline drastically. (b) Since addition of K+ speeds up dephosphorylation and K+-translocating reaction steps are also, albeit weakly, voltage dependent, the observed apparent rate constant (which is the lumped sum of several reaction rate constants) is faster, which makes it difficult to accurately determine the time course of the observed relaxations. Since voltage-clamp fluorometry does not require the calculation of transient currents as ouabain-sensitive difference currents, the parameters for time course and voltage dependence can be obtained in a direct fashion.
To determine the influence of Na+ and/or K+ on voltage dependence and kinetics of conformational changes detected by the attached TMRM fluorophore, voltage pulse experiments were performed at different K+ concentrations either in the presence or absence of Na+ (replacement by NMDG). For the interpretation of the fluorescence amplitudes under Na+/K+ turnover conditions, a single assumption applies, which is justified by previous experimental results: the TMRM fluorophore attached to sβ1-S62C can discriminate between two main conformations of the enzyme. High fluorescence values are characteristic for E1-like conformational states and low fluorescence is indicative of E2-like states. This assumption is valid because all fluorescence values measured during a continuous K+ titration experiment are interspersed between two extreme values. The minimum fluorescence is observed upon inhibition of the Na+/K+-ATPase by ouabain, which stabilizes the E2P conformation. Maximal fluorescence is measured in the presence of saturating extracellular K+ concentrations, which accelerates dephosphorylation and leads to maximal accumulation of E1-like states within the dynamic equilibrium of reaction cycle intermediates.
Included in Fig. 5 is a depiction of voltage jump–induced fluorescence changes from continuous recordings on oocytes expressing the sβ1-S62C construct at different K+ concentrations in the presence of Na+ (Fig. 5, A–E) or upon replacement of Na+ by NMDG (Fig. 5, G–J), which allows for the comparison of the absolute fluorescence levels under the varying conditions of the experiments. Note that precautions were taken to account for fluorescence bleaching, which leads to a slow, roughly linear decay of background fluorescence, and equally slow loss of specific voltage jump–induced fluorescence amplitudes (see materials and methods). After solution exchanges to the stated ionic conditions, voltage step protocols were applied (Fig. 5 F) in which, starting from a holding potential of −80 mV, oocytes were clamped to potentials between +60 mV and −200 mV (in −20-mV steps). In these experiments, the ratio between fluorescence amplitudes upon jumps to −200 mV and to +60 mV successively decreases with increasing K+ concentration (Fig. 5, A–E).
Figure 5.
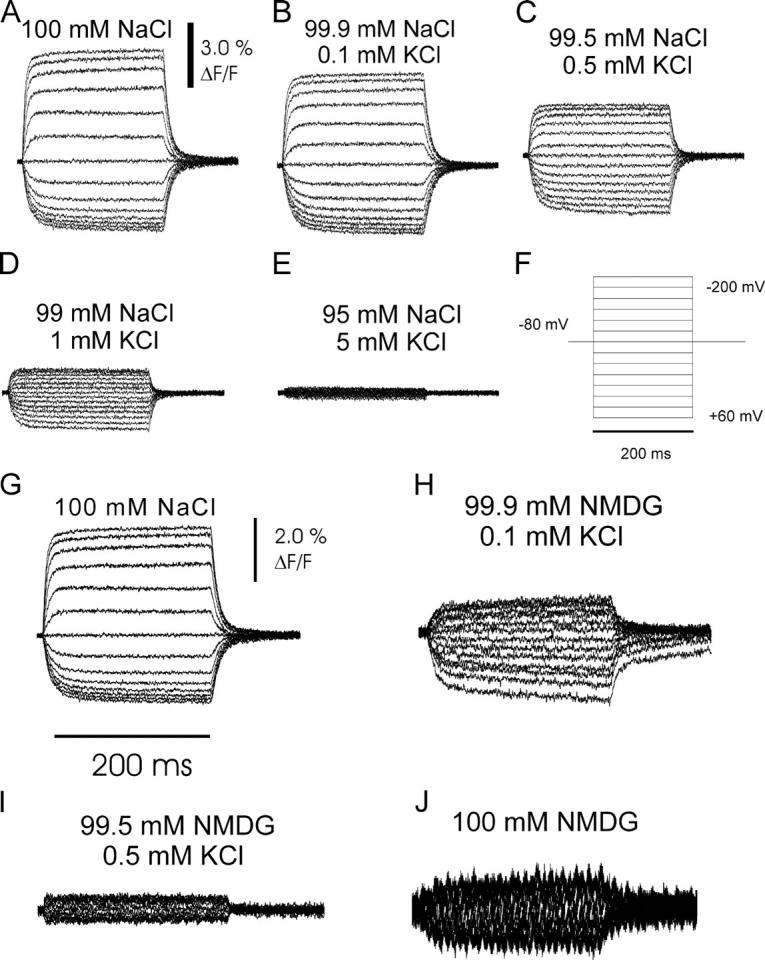
Voltage pulse–induced fluorescence responses at different extracellular Na+ and K+ concentrations from oocytes coexpressing the α subunit construct sNaKα1, ØCys together with sβ1-S62C. (A–E) K+ titration in presence of Na+. Data were consecutively recorded from a single oocyte after changes to perfusion buffers with the following Na+/K+ contents: (A) 100 mM Na+ (no K+), (B) 99.9 mM Na+ and 0.1 mM K+, (C) 99.5 mM Na+ and 0.5 mM K+, (D) 99 mM Na+ and 1 mM K+, and (E) 95 mM Na+ and 5 mM K+. F shows the applied voltage protocol for all data traces shown in this figure. (G–J) K+ titration in presence of NMDG. Voltage pulse–induced fluorescence responses from a single oocyte experiment at different Na+/NMDG/K+ concentrations: (G) 100 mM Na+ (no K+, for control), (H) 99.9 mM NMDG and 0.1 mM K+, (I) 99.5 mM NMDG and 0.5 mM K+, and (J) 100 mM NMDG.
In principle, measurements of the [K+] dependence of voltage jump–induced relaxations on the Na+/K+-ATPase in the absence of extracellular Na+ (replacement by NMDG) have the advantage that voltage-dependent Na+ rebinding steps do not contribute to the observed apparent reciprocal time constant. Therefore, the influence of electrogenic steps that occur during the K+ translocating branch of the reaction cycle can be observed more directly. NMDG can be considered as a functionally “inert” cation, since it cannot be transported. In the presence of Na+, stationary pump currents are reduced upon hyperpolarization due to the acceleration of Na+ rebinding from the extracellular side. In contrast, upon replacement of Na+ by NMDG, the voltage dependence of stationary currents at hyperpolarizing potentials is abolished, which indicates that NMDG cannot substitute for Na+ at the binding sites (Bahinski et al., 1988; Nakao and Gadsby, 1989). Furthermore, the enzyme's apparent affinity for K+ is increased by nearly one order of magnitude upon Na+ replacement by NMDG (Nakao and Gadsby, 1989), which indicates that there is a interaction between K+ and Na+ for binding, but not between NMDG and K+. Consistent with this higher K+ apparent affinity in the absence of Na+, the K+-dependent changes in the appearance of the voltage pulse–induced fluorescence signals are already exerted at much lower K+ concentrations, when NMDG-based solutions were used (Fig. 5, G–J). Already at 0.1 mM K+, the stationary fluorescence level at −80 mV is increased (unpublished data), the absolute fluorescence difference between extremely hyperpolarizing and depolarizing potentials is small, and jumps to hyperpolarizing potentials induce smaller fluorescence changes than depolarizing pulses (Fig. 5 H). Upon further increase in extracellular [K+] to 0.5 mM, the stationary fluorescence level at −80 mV is nearly maximal (unpublished data) and only very small fluorescence changes occur upon voltage pulses (Fig. 5 I). In a solution containing NMDG as the only monovalent cation (Fig. 5 J), the stationary fluorescence value at −80 mV holding potential is smaller than when compared with a 100 mM Na+ solution, and most of the fluorescence changes in response to voltage pulses were eliminated. This is consistent with the interpretation that the pump assumes the E2P conformation and cannot be shifted by voltage into E1P in the absence of Na+. However, still some voltage dependence of the conformational distribution seems to persist, which is in agreement with a previous report that determined the dielectric coefficient to be 0.1 for this reaction (Wuddel and Apell, 1995). This could be due to an intrinsic voltage dependence of the E1P–E2P conformational transition, independent from the interaction of substrate cations with the pump. An alternative explanation is that since even highly purified substances from commercial sources contain trace amounts of K+, 100 mM buffers might contain several micromolar K+ (Sigma ultra pure NaCl: 0.005% K+), which could exert the observed effects due to the high apparent K+ affinity of the pump in the absence of Na+.
A summary of the dependence of the saturating fluorescence amplitudes of the sβ1-S62C construct on voltage and [K+] from K+ titration experiments in Na+-based solutions and for NMDG-based solutions is shown in Fig. 6. According to the description in materials and methods, the data in Figs. 6 and 7 have been corrected for fluorescence bleaching. In addition, results from K+ titration experiments using the sβ1-F64C construct in Na+-based (Fig. 6 C) and NMDG-based solutions (Fig. 6 D) are shown, which, despite the previously mentioned difference in the time course of the fluorescence signals, yield very similar results. At the holding potential of −80 mV for each of these experiments, the stationary fluorescence increases and the absolute fluorescence difference between extremely hyperpolarizing and depolarizing potentials decreases with increasing concentrations of K+. Evaluation of the fluorescence signals by a Boltzmann analysis for both sβ1 residues shows that increasing the external K+ concentration induces a positive shift of the V0.5 and a decrease in slope (lower zq). A decrease in slope can be interpreted as a decrease in voltage sensitivity. For example, the value for the equivalent charge, zq, for S62C decreases from ∼0.8 at 0 mM K+ to ∼0.3 at 1 mM K+. The zq value represents the amount of charges translocated or the fraction of charge that is translocated through the transmembrane field. Thus, to a first approximation, it can be inferred that activation of the K+ branch of the Albers-Post cycle leads to an inward transport of ∼0.5 unitary positive charges, which is consistent with the reported lower electrogenicity of K+ transport steps (Lafaire and Schwarz, 1986; Rakowski et al., 1991; Peluffo and Berlin, 1997), and with results from a similar study of our laboratory using site-directed fluorescence labeling of the Na+/K+-ATPase α subunit (Geibel et al., 2003). However, since the Boltzmann parameters cannot be accurately determined at K+ concentrations greater than 1 mM, this value can only be regarded as a lower limit.
Figure 6.

Voltage dependence values for fluorescence saturation amplitudes during K+ titrations, obtained from monoexponential fits to data traces from experiments as exemplified in Fig. 5. Top panels correspond to β subunit construct sβ1-S62C in (A) Na+-based and (B) NMDG-based solutions, bottom panels to β subunit construct sβ1-F64C, in (C) Na+-based and (D) NMDG-based solutions. Buffer compositions were as follows. (A and C) ▪, 100 mM Na+; □, 99.9 mM Na+ and 0.1 mM K+; ▴, 99.5 mM Na+ and 0.5 mM K+; ○, 99 mM Na+ and 1 mM K+; •, 95 mM Na+ and 5 mM K+; and ⋄, 100 mM Na+ and 10 mM ouabain. (B and D) ▪, 100 mM Na+; □, 100 mM NMDG; ▴, 99.9 mM NMDG and 0.1 mM K+; ○, 99.5 mM NMDG and 0.5 mM K+; and •, 99 mM NMDG and 1 mM K+.
Figure 7.

Determination of the apparent K0.5 for the shift of the steady-state distribution between E1 and E2 states by external K+ at +60 mV. Data were derived from fluorescence changes for the Na+/K+-ATPase containing the β subunit construct sβ1-S62C in the presence of NMDG-based (A) or Na+-based (B) buffers. Solid lines represent fits of a Hill equation to the data (where nH = 1), with K0.5 values as stated. Each dataset was obtained from three oocytes (means ± SEM).
The kinetics of the conformational changes can also be analyzed under Na+/K+ reaction conditions (Fig. 4, D–F). Here, the relative populations of each conformational state are altered as when compared with Na+/Na+ exchange conditions. It has been determined that where the reciprocal time constants of the conformational changes can be accurately measured, there is no discernable difference between Na+/Na+ and Na+/K+ reaction conditions. This suggests that even though the populations of the two conformational states may change, the apparent rate of change between these conformations is constant.
Determination of Apparent Binding Parameters (Apparent Affinities) for K+
To derive quantitative information about the interaction of K+ with the Na+/K+-ATPase, we analyzed the K+ dependence of the absolute changes in voltage-dependent fluorescence amplitudes for the enzyme with sβ1-S62C (data from Fig. 5). Therefore, for all K+ concentrations either in the absence or presence of Na+, the difference between the fluorescence amplitudes at −200 mV (F[K+](−200mV)) and at a given membrane potential V (F[K+](V)) was scaled to the maximally possible fluorescence change amplitude ΔFtot, yielding a fractional fluorescence change amplitude [sc]F[/sc][K+](V) (see materials and methods). [sc]F[/sc][K+](V) is a measure of the [K+]-dependent shift of the conformational distribution toward E1-like states at a potential, V, and reflects a voltage-dependent apparent binding parameter for K+. [sc]F[/sc][K+](V) was plotted against the K+ concentration and fitted according to a Hill equation. For simplicity sake and because the purpose of this experiment was to determine K0.5, the Hill coefficient was held at 1, which is consistent with previous experiments (Nakao and Gadsby, 1989; Sagar and Rakowski, 1994). Altering the Hill coefficient had a negligible effect on K0.5. The results for V = +60 mV are shown in Fig. 7, for a K+ titration in the absence (Fig. 7 A) and in the presence (Fig. 7 B) of Na+, yielding apparent K0.5 values for the shift in the voltage-dependent steady-state distribution between conformational states E1 and E2 by extracellular K+. With the addition of K+, the entire Albers-Post scheme can be used and thus the relative populations of E1 and E2 are measured. In the absence of Na+, the apparent affinity (K0.5 = 80 ± 20 μM) is high, whereas in the presence of Na+, a low apparent affinity (K0.5 = 2.8 ± 0.3 mM) is observed. These values agree with (voltage-dependent) KM values for the stimulation of stationary pump currents by K+ in the presence or absence of Na+ (Nakao and Gadsby, 1989; Rakowski et al., 1991; Sagar and Rakowski, 1994) and are also consistent with results from stopped-flow experiments using purified enzyme (Kane et al., 1998).
DISCUSSION
This work is the first demonstration that the β subunit follows the conformational dynamics of the Na+/K+-ATPase using time-resolved fluorescence techniques. Three amino acid positions were identified (S62, F64, and K65), which upon cysteine replacement and subsequent labeling with a TMRM fluorophore enabled the detection of environmental changes, which are triggered by and can be correlated to the conformational changes occurring on the Na+/K+-ATPase α subunit. In addition, the role of the Na+/K+-ATPase β subunit extends beyond proper assembly, and trafficking of the enzyme complex to the plasma membrane as it affects the voltage dependence of conformational changes that occur upon ion binding.
Under Na+/Na+ exchange conditions the stationary voltage-dependent fluorescence amplitudes [(1 − ΔF)–V curves] at all three sites follow a Boltzmann distribution, which in all cases is equivalent to the voltage dependence of translocated charge (Q–V curves) obtained from analysis of transient currents. Since the Q–V curves measure the distribution of the enzyme between E1P and E2P, it is evident that the fluorescence level measured at the β subunit residues describes the same phenomenon. Thus, fluorescence labeling of the β subunit can directly report on voltage-dependent processes that occur on the α subunit.
Despite the equivalence of the voltage-dependent steady-state fluorescence amplitudes, the temporal coupling between charge movement mediated by the α subunit and the environmental changes detected on the β subunit is distinct for all three residues. In case of the sβ1-S62C construct, the reciprocal time constants of fluorescence changes and transient currents are equivalent with ∼50 s−1 at potentials >0 mV. In this voltage range, the reciprocal time constants are determined by extracellular Na+ release, which is rate limited by the preceding E1P–E2P conformational transition. However, at hyperpolarizing potentials, the fluorescence changes exhibit a much weaker voltage dependence than the reciprocal time constants of the transient currents. At negative potential, the sequence of reaction steps is inverted: first Na+ is extracellularly bound to the binding sites, followed by the backward conformational transition E2P–E1P. Under these conditions, transient currents measure an electrogenic event, which is (fast) Na+ rebinding, fluorescence is sensitive to the conformational transition of the enzyme, which could well be slower than the preceding ion binding reaction. The fluorescence data indicate that the conformational change E2P–E1P is slower than extracellular cation rebinding. However, it still exhibits a weak intrinsic voltage dependence (Wuddel and Apell, 1995).
The reciprocal time constants of fluorescence changes and transient currents for the F64C and K65C constructs did not show equivalent temporal behavior, with fluorescence changes being slower over the whole range of potentials investigated. This indicates that the environmental changes detected by these residues are triggered by conformational changes of the α subunit, but evolve independently in time. The extent, however, of the conformational change reported by the β subunit is determined by the conformational change of the α subunit, as inferred from the equivalence of stationary (1 − ΔF)–V curves and Q–V curves. The fluorescence changes observed for the F64C mutant were biphasic. The fast component, though slower than charge translocation, might reflect this above-mentioned triggering event. The slow component, which occurs with 1–2.5 s−1, cannot correspond to any enzymatic partial reaction, since this would severely affect turnover. However, in spite of the slow fluorescence responses of the F64C and the K65C constructs, the observed environmental changes are able to monitor Na+/K+ transport activity in an integrating fashion.
Previous work has identified an amino acid at the extracellular end of helix M5 of the sheep α1 subunit that when mutated to a cysteine (in mutant N790C) served as a sensor position for conformational changes. However, in this mutant, the kinetics of ion transport was slowed down and the voltage dependence of the Q–V curve was shifted to hyperpolarizing potentials (Geibel et al., 2003), which led to the conclusion that the aforementioned asparagine residue interferes with extracellular access of cations to their binding sites. Since it was desirable to investigate conformational changes of the Na+/K+-ATPase without functional effects due to cysteine mutagenesis, the identification of the sβ1-S62C construct is advantageous, since it does not change kinetics or voltage dependence of ion transport. Thus, the β subunit can be used to monitor the conformation of the enzyme with a native α subunit.
Whereas the Boltzmann distribution of charge transport for two of the constructs, sβ1-S62C and sβ1-F64C, is analogous to that of the wild-type enzyme, the charge-neutralizing mutation K65C led to an increase in apparent Na+ affinity or a change in the ion pump surface potential, as demonstrated by a positive shift of the V0.5 value, even though the fraction of charge that is displaced through the entire membrane field (as judged from zq value) has not changed. Furthermore, analysis of transient currents showed that the K65C mutation slowed the kinetics of charge translocation under Na+/Na+ exchange conditions. Thus, for the first time, evidence is provided that an individual charged residue on the β subunit directly or indirectly affects the voltage dependence of Na+ transport. Hydropathy analysis suggests that this residue is close to the transmembrane-to-extracellular interface and thus could be ideally poised to influence cation binding. It also could disturb proper contacts between subunits, such as by the abolishment of a salt bridge or other inter- or intrasubunit ionic interactions. A lysine at this position is only conserved between β1 isoforms of various species, whereas tryptophan and valine are found in homologous position of β2 or β3 isoforms. Sequence differences among β isoforms may therefore provide an additional tool for the physiological fine tuning of enzymatic function according to tissue-specific requirements, which are reflected by distinct expression patterns of the different α and β isoforms.
The transmembrane segment of the Na+/K+-ATPase β1 subunit as defined by hydropathy analysis can be modeled as an α-helical structure up to residue 57 (Hasler et al., 2001). From this analysis, residue 57 would roughly align with the orientation of a tri-glycine motif (GxxxGxxxG), as indicated by the black arrow in Fig. 8 A. The latter is hypothesized to be involved in helix–helix interaction within a putative αβ–βα oligomeric assembly of the functional Na+/K+-ATPase, which is still controversial. The dotted arrow in Fig. 8 A shows the direction of the C45 residue, which was shown to cross-link with helix M8 of the α subunit (Or et al., 1999; Ivanov et al., 2000). Fig. 8 B shows two possible orientations of the β1 subunit, in which C45 could approach helix M8 of the α subunit that is derived from previous results (Hasler et al., 2001). The results from our study cannot differentiate from either of these two potential sites. According to these models, residue F64 would point away from the α subunit in any of the two possible configurations, whereas S62 and K65 would face the α subunit core region. The results of these experiments also strongly indicate that the β1 subunit region analyzed here has two distinct faces, one which is dominated by the two residues that exhibit a single and comparatively fast fluorescence signal component (S62 and K65) and the second face that has two components (F64). In addition, previous research on the β subunit has demonstrated that mutation of two tyrosine residues, located in the transmembrane domain, to tryptophan interfere with the kinetics of the ion pump (Hasler et al., 2001). Within the α-helical wheel in Fig. 8 A, these two tyrosine residues would be located in between K65 and F64, further suggesting that these two residues have distinct local environments. The slow relaxation process detected by the F64C construct might be due to a long-range conformational shift of the α and/or β subunit, which could kinetically be modulated by changing the molecular mass of the large extracellular portion of the β subunit. However, attempts to verify this hypothesis, either by expression and characterization of truncated β subunits or by trypsin digest in situ of the entire complex, have thus far proven unsuccessful.
Figure 8.

Model of the analyzed region of the Na+/K+-ATPase β1 subunit and possible orientation of residues with respect to the α subunit. (A) The analyzed region of the sheep Na+/K+-ATPase β1 subunit adjacent to the extracellular plasma membrane interface is represented as a helical wheel assuming an α-helical structure. The last residue of the transmembrane domain, M57, aligns with a putative tri-glycine helix–helix interaction motif (see text), which points in the direction of the yellow arrow. The red arrow aligns with a cysteine residue (C45, not shown) within the transmembrane region of the β1 subunit that was shown to cross-link with helix M8 of the α subunit (Or et al., 1999; Ivanov et al., 2000). The blue arrow indicates the orientation of the F64 sidechain. (B) Putative orientation of the Na+/K+-ATPase β1 subunit's transmembrane helix with respect to the transmembrane domain of P2-ATPases. Views of the 10 transmembrane helices (M1 to M10) of the Na+/K+-ATPase α subunit perpendicular to the membrane plane from the cytoplasmic side are depicted as deduced from the SERCA crystal structure (Toyoshima et al., 2000). The Na+/K+-ATPase β1 subunit's transmembrane helix was oriented with C45 pointing towards M8 (in red) of the α subunit as suggested by cross-linking studies (Or et al., 1999; Ivanov et al., 2000), which allows positioning in two possible orientations according to Hasler et al. (2001). Arrows indicate the same directions as in A.
Two explanations for the observed fluorescence changes on the β subunit could be that this subunit is undergoing conformational changes as a function of ion transport or that the subunit is rigid and only reporting conformational changes of the α subunit. There are a number of reasons why the latter case is less probable. The proposed secondary structure of the β subunit is an α helix, which is verified by hydropathy analysis. If the fluorescence signals originating from three different residues as discussed in this work on the β subunit located within one α-helical turn only report conformational changes of the α subunit, then the α subunit would have to surround the β subunit completely. There is no structural evidence for such an arrangement as neither electron microscopy studies of the Na+/K+-ATPase nor x-ray crystallography studies of the Ca2+-ATPase support this requirement (Toyoshima et al., 2000; Hebert et al., 2001; Toyoshima and Nomura, 2002). Furthermore, trypsin digests of the holoenzyme have revealed that while differential trypsin digests are observed under different ion pump conformational states, the transmembrane domain and cytoplasmic region proximal to the transmembrane domain of the β subunit are not affected (Lutsenko and Kaplan, 1994). Thus, although large conformational changes may be present at regions distal to the transmembrane domain of the β subunit, the more probable interpretation is that the region close to the transmembrane domain of the β subunit is in close contact with the α subunit and undergoes a conformational change that can be measured by fluorescence.
In voltage-clamp fluorometric studies performed on the Na+/K+-ATPase α subunit mutant N790C (Geibel et al., 2003), it was demonstrated that hyperpolarization of the cell resulted in an increase in fluorescence while depolarization resulted in a decrease of fluorescence. This was interpreted as the fluorophore residing in a sheltered, hydrophobic environment in E1(P) states and in a more exposed, aqueous environment in E2(P) states. Interestingly, each of the three residues of the β subunit identified in the present study also follow the same environmental change. Thus, both the α and β subunits appear to be shifted into the same direction or environment during the E1P–E2P transition.
Acknowledgments
We thank Giovanni Zifarelli for advice on the instrumentation, and Eva Kaindl and Verena Pintschovius for excellent technical assistance.
The work was supported by the Deutsche Forschungsgemeinschaft (SFB 472), the Max Planck-Gesellschaft zur Föderung der Wissenschaften, and the Johann Wolfgang Goethe-Universität, Frankfurt am Main. R. Dempski was a recipient of a Max-Planck fellowship.
David C. Gadsby served as editor.
Abbreviations used in this paper: SERCA, sarcoplasmic reticulum Ca2+-ATPase; TMRM, tetramethylrhodamine-6-maleimide.
References
- Albers, R.W. 1967. Biochemical aspects of active transport. Annu. Rev. Biochem. 36:727–756. [DOI] [PubMed] [Google Scholar]
- Axelsen, K.B., and M.G. Palmgren. 1998. Evolution of substrate specificities in the P-type ATPase superfamily. J. Mol. Evol. 46:84–101. [DOI] [PubMed] [Google Scholar]
- Bahinski, A., M. Nakao, and D.C. Gadsby. 1988. Potassium translocation by the Na+/K+ pump is voltage insensitive. Proc. Natl. Acad. Sci. USA. 85:3412–3416. [DOI] [PMC free article] [PubMed] [Google Scholar]
- Beguin, P., U. Hasler, A. Beggah, J.D. Horisberger, and K. Geering. 1998. Membrane integration of Na,K-ATPase α subunits and β subunits assembly. J. Biol. Chem. 273:24921–24931. [DOI] [PubMed] [Google Scholar]
- Beguin, P., U. Hasler, O. Staub, and K. Geering. 2000. Endoplasmic reticulum quality control of oligomeric membrane proteins: topogenic determinants involved in the degradation of the unassembled Na,K-ATPase α subunit and in its stabilization by β subunit assembly. Mol. Biol. Cell. 11:1657–1672. [DOI] [PMC free article] [PubMed] [Google Scholar]
- Cha, A., and F. Bezanilla. 1997. Characterizing voltage-dependent conformational changes in the Shaker K+ channel with fluorescence. Neuron. 19:1127–1140. [DOI] [PubMed] [Google Scholar]
- Colonna, T.E., L. Huynh, and D.M. Fambrough. 1997. Subunit interactions in the Na,K-ATPase explored with the yeast two-hybrid system. J. Biol. Chem. 272:12366–12372. [DOI] [PubMed] [Google Scholar]
- Cornelius, F., and J. Skou. 1985. Na+-Na+ exchange mediated by (Na+ + K+)-ATPase reconstituted into liposomes. Evaluation of pump stoichiometry and response to ATP and ADP. Biochim. Biophys. Acta. 818:211–221. [DOI] [PubMed] [Google Scholar]
- Fendler, K., E. Grell, M. Haubs, and E. Bamberg. 1985. Pump currents generated by the purified Na+K+-ATPase from kidney on black lipid membranes. EMBO J. 4:3079–3085. [DOI] [PMC free article] [PubMed] [Google Scholar]
- Fendler, K., S. Jauruschewski, A. Hobbs, W. Albers, and J.P. Froehlich. 1993. Pre-steady state charge translocation in Na,K-ATPase from eel electron organ. J. Gen. Physiol. 102:631–666. [DOI] [PMC free article] [PubMed] [Google Scholar]
- Friedrich, T., and G. Nagel. 1997. Comparison of Na+/K+-ATPase pump currents activated by ATP concentration or voltage jumps. Biophys. J. 73:186–194. [DOI] [PMC free article] [PubMed] [Google Scholar]
- Geering, K., A. Beggah, P. Good, S. Girardet, S. Roy, D. Schaer, and P. Jaunin. 1996. Oligomerization and maturation of Na,K-ATPase: functional interaction of the cytoplasmic NH2 terminus of the β subunit with the α subunit. J. Cell Biol. 133:1193–1204. [DOI] [PMC free article] [PubMed] [Google Scholar]
- Geering, K., I. Theulaz, F. Verrey, M.T. Hauptle, and B.C. Rossier. 1989. A role for the β-subunit expression of functional Na+K+-ATPase in the Xenopus oocyte. Am. J. Physiol. 257. [DOI] [PubMed] [Google Scholar]
- Geibel, S., J.H. Kaplan, E. Bamberg, and T. Friedrich. 2003. Conformational dynamics of the Na+/K+-ATPase probed by voltage clamp fluorometry. Proc. Natl. Acad. Sci. USA. 100:964–969. [DOI] [PMC free article] [PubMed] [Google Scholar]
- Hasler, U., G. Crambert, J.D. Horisberger, and K. Geering. 2001. Structural and functional features of the transmembrane domain of the Na,K-ATPase β subunit revealed by tryptophan scanning mutagenesis. J. Biol. Chem. 276:16356–16364. [DOI] [PubMed] [Google Scholar]
- Hasler, U., X. Wang, G. Crambert, P. Beguin, F. Jaisser, J.D. Horisberger, and K. Geering. 1998. Role of β-subunit domains in the assembly, stable expression, intracellular routing, and functional properties of Na,K-ATPase. J. Biol. Chem. 273:30826–30835. [DOI] [PubMed] [Google Scholar]
- Hebert, H., P. Purhonen, H. Vorum, K. Thomsen, and A. Maunsbach. 2001. Three-dimensional structure of renal Na,K-ATPase from cryo-electron microscopy of two-dimensional crystals. J. Mol. Biol. 314:479–494. [DOI] [PubMed] [Google Scholar]
- Hilgemann, D.W. 1994. Channel-like function of the Na,K pump probed at microsecond resolution in giant membrane patches. Science. 263:1429–1432. [DOI] [PubMed] [Google Scholar]
- Hilgemann, D.W. 1997. Recent electrical snapshots of the cardiac Na,K pump. Ann. NY Acad. Sci. 834:260–269. [DOI] [PubMed] [Google Scholar]
- Holmgren, M., and R.F. Rakowski. 1994. Pre-steady-state transient currents mediated by the Na/K pump in internally perfused Xenopus oocytes. Biophys. J. 66:912–922. [DOI] [PMC free article] [PubMed] [Google Scholar]
- Holmgren, M., J. Wagg, F. Bezanilla, R.F. Rakowski, P. De Weer, and D.C. Gadsby. 2000. Three distinct and sequential steps in the release of sodium ions by the Na+/K+-ATPase. Nature. 403:898–901. [DOI] [PubMed] [Google Scholar]
- Horisberger, J.D., and S. Kharoubi-Hess. 2002. Functional differences between α subunit isoforms of the rat Na,K-ATPase expressed in Xenopus oocytes. J. Physiol. 539:669–680. [DOI] [PMC free article] [PubMed] [Google Scholar]
- Hu, Y.K., and J.H. Kaplan. 2000. Site-directed chemical labeling of extracellular loops in a membrane protein-the topology of the Na,K-ATPase α-subunit. J. Biol. Chem. 275:19185–19191. [DOI] [PubMed] [Google Scholar]
- Ivanov, A., H. Zhao, and N. Modyanov. 2000. Packing of the transmembrane helices of Na,K-ATPase: direct contact between β-subunit and H8 segment of α-subunit revealed by oxidative cross-linking. Biochemistry. 39:9778–9785. [DOI] [PubMed] [Google Scholar]
- Jassier, F., P. Jaunin, K. Geering, B.C. Rossier, and J.D. Horisberger. 1994. Modulation of the Na,K-pump function by β subunit isoforms. J. Gen. Physiol. 103:605–623. [DOI] [PMC free article] [PubMed] [Google Scholar]
- Jorgensen, P.L., and P.A. Pedersen. 2001. Structure-function relationships of Na+, K+, ATP, or Mg2+ binding and energy transduction in Na,K-ATPase. Biochim. Biophys. Acta. 1505:57–74. [DOI] [PubMed] [Google Scholar]
- Kane, D.J., E. Grell, E. Bamberg, and R.J. Clarke. 1998. Dephosphorylation kinetics of pig kidney Na+,K+-ATPase. Biochemistry. 37:4581–4591. [DOI] [PubMed] [Google Scholar]
- Kaplan, J.H. 2002. Biochemistry of the Na,K-ATPase. Annu. Rev. Biochem. 71:511–535. [DOI] [PubMed] [Google Scholar]
- Kühlbrandt, W. 2004. Biology, structure and mechanism of P-type ATPases. Nat. Rev. Mol. Cell Biol. 5:282–295. [DOI] [PubMed] [Google Scholar]
- Lafaire, A.V., and W. Schwarz. 1986. Voltage dependence of the rheogenic Na+/K+ ATPase in the membrane of oocytes of Xenopus laevis. J. Membr. Biol. 91:43–51. [DOI] [PubMed] [Google Scholar]
- Larsson, H., A. Tzingounis, H. Koch, and M. Kavanaugh. 2004. Fluorometric measurements of conformational changes in glutamate transporters. Proc. Natl. Acad. Sci. USA. 101:3951–3956. [DOI] [PMC free article] [PubMed] [Google Scholar]
- Laughery, M.D., M.L. Todd, and J.H. Kaplan. 2003. Mutational analysis of α-β subunit interactions in the delivery of Na,K-ATPase heterodimers to the plasma membrane. J. Biol. Chem. 278:34794–34803. [DOI] [PubMed] [Google Scholar]
- Lorenz, C., M. Pusch, and T.J. Jentsch. 1996. Heteromultimeric CLC chloride channels with novel properties. Proc. Natl. Acad. Sci. USA. 93:13362–13366. [DOI] [PMC free article] [PubMed] [Google Scholar]
- Lutsenko, S., and J.H. Kaplan. 1993. An essential role for the extracellular domain of the Na,K-ATPase β-subunit in cation occlusion. Biochemistry. 32:6737–6743. [DOI] [PubMed] [Google Scholar]
- Lutsenko, S., and J.H. Kaplan. 1994. Molecular events in close proximity to the membrane associated with the binding of ligands to the Na,K-ATPase. J. Biol. Chem. 269:4555–4564. [PubMed] [Google Scholar]
- Lutsenko, S., and J.H. Kaplan. 1995. Organization of P-type ATPases-significance of structural diversity. Biochemistry. 34:15607–15613. [DOI] [PubMed] [Google Scholar]
- Mannuzu, L.M., M.M. Moronne, and E.Y. Isacoff. 1996. Direct physical measure of conformational rearrangement underlying potassium channel gating. Science. 271:213–216. [DOI] [PubMed] [Google Scholar]
- Nakao, M., and D.C. Gadsby. 1986. Voltage dependence of Na translocation by the Na/K pump. Nature. 323:628–630. [DOI] [PubMed] [Google Scholar]
- Nakao, M., and D.C. Gadsby. 1989. [Na] and [K] dependence óf the Na/K pump current-voltage relationship in guinea pig ventricular myocytes. J. Gen. Physiol. 94:539–565. [DOI] [PMC free article] [PubMed] [Google Scholar]
- Or, E., R. Goldshleger, and S. Karlish. 1999. Characterization of disulfide cross-links between fragments of proteolyzed Na,K-ATPase-implications for spatial organization of trans-membrane helices. J. Biol. Chem. 274:2802–2809. [DOI] [PubMed] [Google Scholar]
- Peluffo, R.D., and J.R. Berlin. 1997. Electrogenic K+ transport by the Na+K+ pump in rat cardiac ventricular myocytes. J. Physiol. 501:33–40. [DOI] [PMC free article] [PubMed] [Google Scholar]
- Post, R.L., S. Kume, and C. Hegyvary. 1972. Activation by adenosine-triphosphate in phosphorylation kinetics of sodium and potassium ion transport adenosine-triphosphatase. J. Biol. Chem. 247:6530–6540. [PubMed] [Google Scholar]
- Price, E.M., and J.B. Lingrel. 1988. Structure-function-relationships in the Na,K-ATPase α subunit-site-directed mutagenesis of glutamine-111 and asparagine-122 to aspartic acid generates a ouabain-resistant enzyme. Biochemistry. 27:8400–8408. [DOI] [PubMed] [Google Scholar]
- Rakowski, R.F. 1993. Charge movement by the Na/K pump in Xenopus oocytes. J. Gen. Physiol. 101:117–144. [DOI] [PMC free article] [PubMed] [Google Scholar]
- Rakowski, R.F., L.A. Vasilets, J. LaTona, and W. Schwarz. 1991. A negative slope in the current-voltage relationship of the Na+/K+ pump in Xenopus oocytes produced by reduction of external K+. J. Membr. Biol. 121:177–187. [DOI] [PubMed] [Google Scholar]
- Sagar, A., and R.F. Rakowski. 1994. Access channel model for the voltage dependence of the forward-running Na+/K+ pump. J. Gen. Physiol. 103:869–894. [DOI] [PMC free article] [PubMed] [Google Scholar]
- Smith, P.L., and G. Yellen. 2002. Fast and slow voltage sensor movements in HERG potassium channels. J. Gen. Physiol. 119:275–293. [DOI] [PMC free article] [PubMed] [Google Scholar]
- Sweadner, K., and C. Donnet. 2001. Structural similarities of Na,K-ATPase and SERCA, the Ca2+-ATPase of the sarcoplasmic reticulum. Biochem. J. 356:685–704. [DOI] [PMC free article] [PubMed] [Google Scholar]
- Toyoshima, C., and T. Mizutani. 2004. Crystal structure of the calcium pump with a bound ATP analogue. Nature. 430:529–535. [DOI] [PubMed] [Google Scholar]
- Toyoshima, C., M. Nakasaki, H. Nomura, and H. Ogawa. 2000. Crystal structure of the calcium pump of sarcoplasmic reticulum at 2.6 angstrom resolution. Nature. 405:647–655. [DOI] [PubMed] [Google Scholar]
- Toyoshima, C., and H. Nomura. 2002. Structural changes in the calcium pump accompanying the dissociation of calcium. Nature. 418:605–611. [DOI] [PubMed] [Google Scholar]
- Toyoshima, C., H. Nomura, and T. Tsuda. 2004. Lumenal gating mechanism revealed in calcium pump crystal structures with phosphate analogues. Nature. 432:361–368. [DOI] [PubMed] [Google Scholar]
- Wuddel, I., and H. Apell. 1995. Electrogenicity of the sodium transport pathway in the Na,K-ATPase probed by charge-pulse experiments. Biophys. J. 69:909–921. [DOI] [PMC free article] [PubMed] [Google Scholar]